

Validation of Methods for Assessment of Dust Levels in Layer Barns

Abstract
:Simple Summary
Abstract
1. Introduction
2. Materials and Methods
2.1. Animals
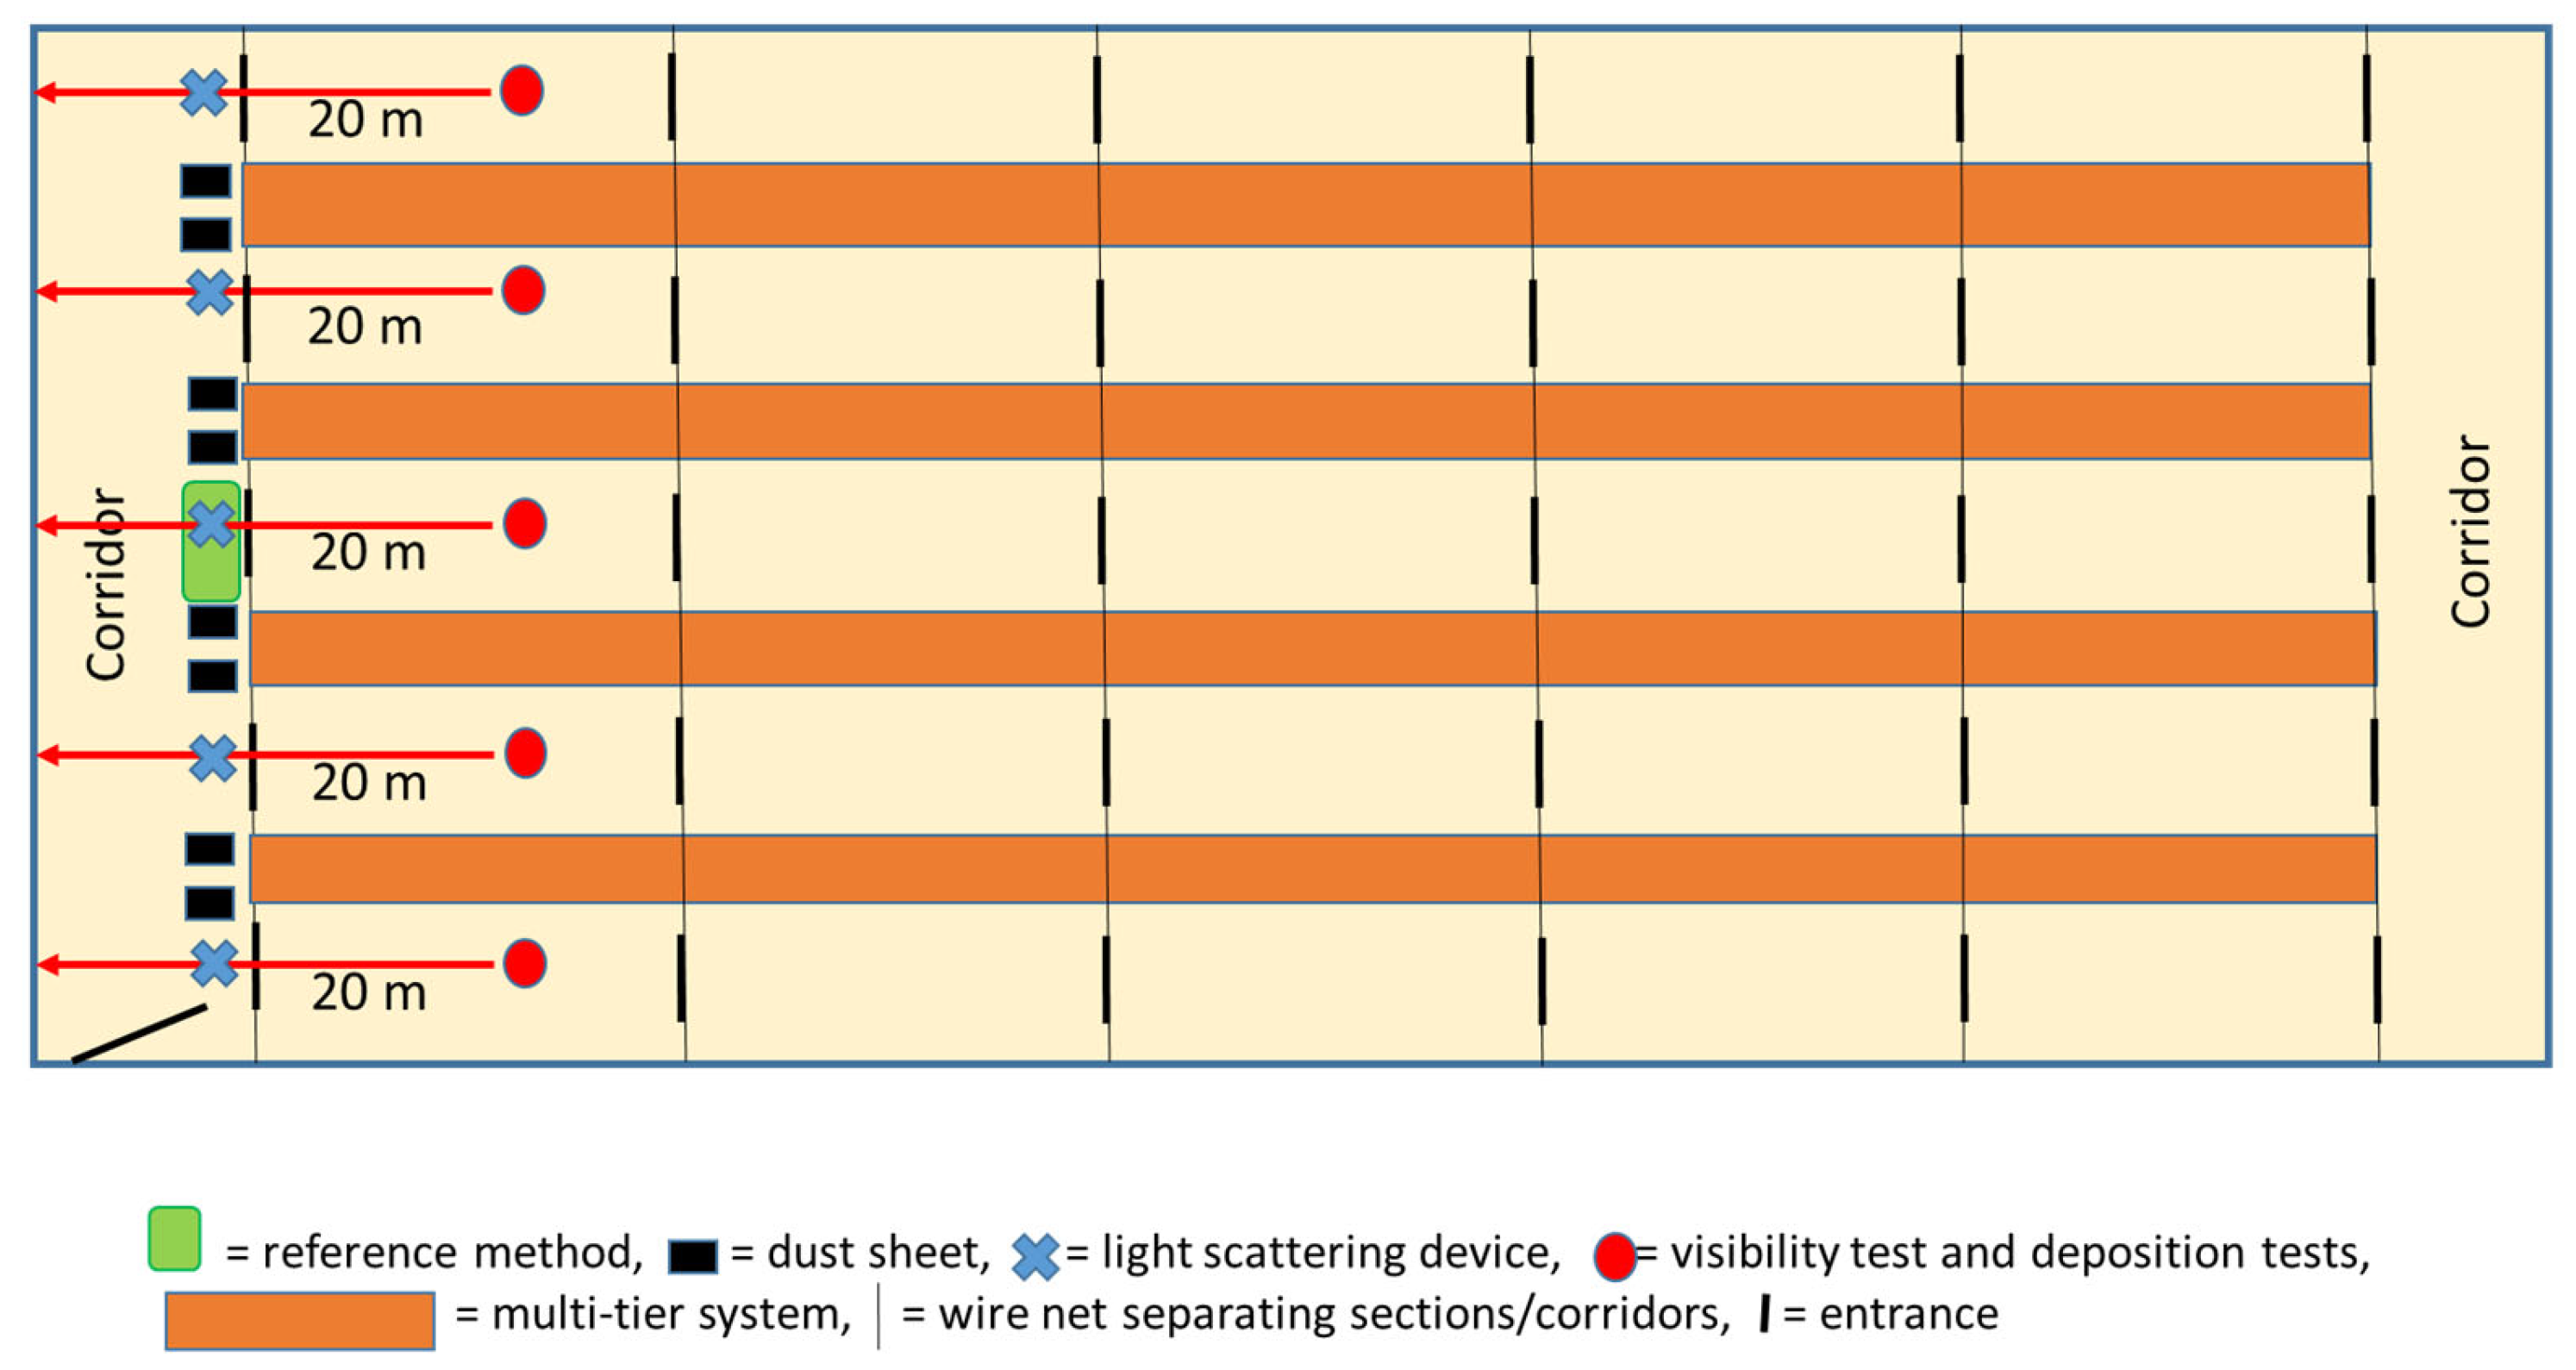
2.2. Methodology
2.2.1. Gravimetric Measurement—The Reference Method
2.2.2. Light Scattering Measurement
2.2.3. Dust Sheet Tests
- Score 0 = No or minimal evidence of dust (sheet has same colour as clean sheet);
- Score 1 = Isolated specks or a thin layer of dust on sheet is detectable (without comparing with a clean sheet, the test sheet still appears black but there is a slight colour difference between the two sheets);
- Score 2 = Dust covers the sheet; even without comparing with a clean sheet, it is clear that the test sheet is no longer black (i.e., there is a clear difference in colour between clean and test sheets).
2.2.4. Tape Test
2.2.5. Visibility Assessment
- Score 0: No or limited dust: No visible dust specks in the air;
- Score 1: Moderate dust level: Isolated dust specks are detectable, but visibility has only slightly or not notably decreased – details of the wall are easily recognisable;
- Score 2: High dust level: Many dust specks are detectable, and visibility has notably decreased – details of the wall are not easily recognisable.
2.2.6. Deposition Assessment
- Score 0 = No or minimal evidence of dust (structure has same colour as a spot nearby that has been wiped clean);
- Score 1 = Isolated specks or a thin layer of dust (≤1 mm) is detectable (when comparing with a cleaned part of the structure; a slight colour difference appears between the two parts of the structure);
- Score 2 = Dust covers the structure (clear difference in colour between clean and test parts). Dust layer is >1 mm but <5 mm;
- Score 3 = As in score 2, but the dust layer is ≥5 mm.
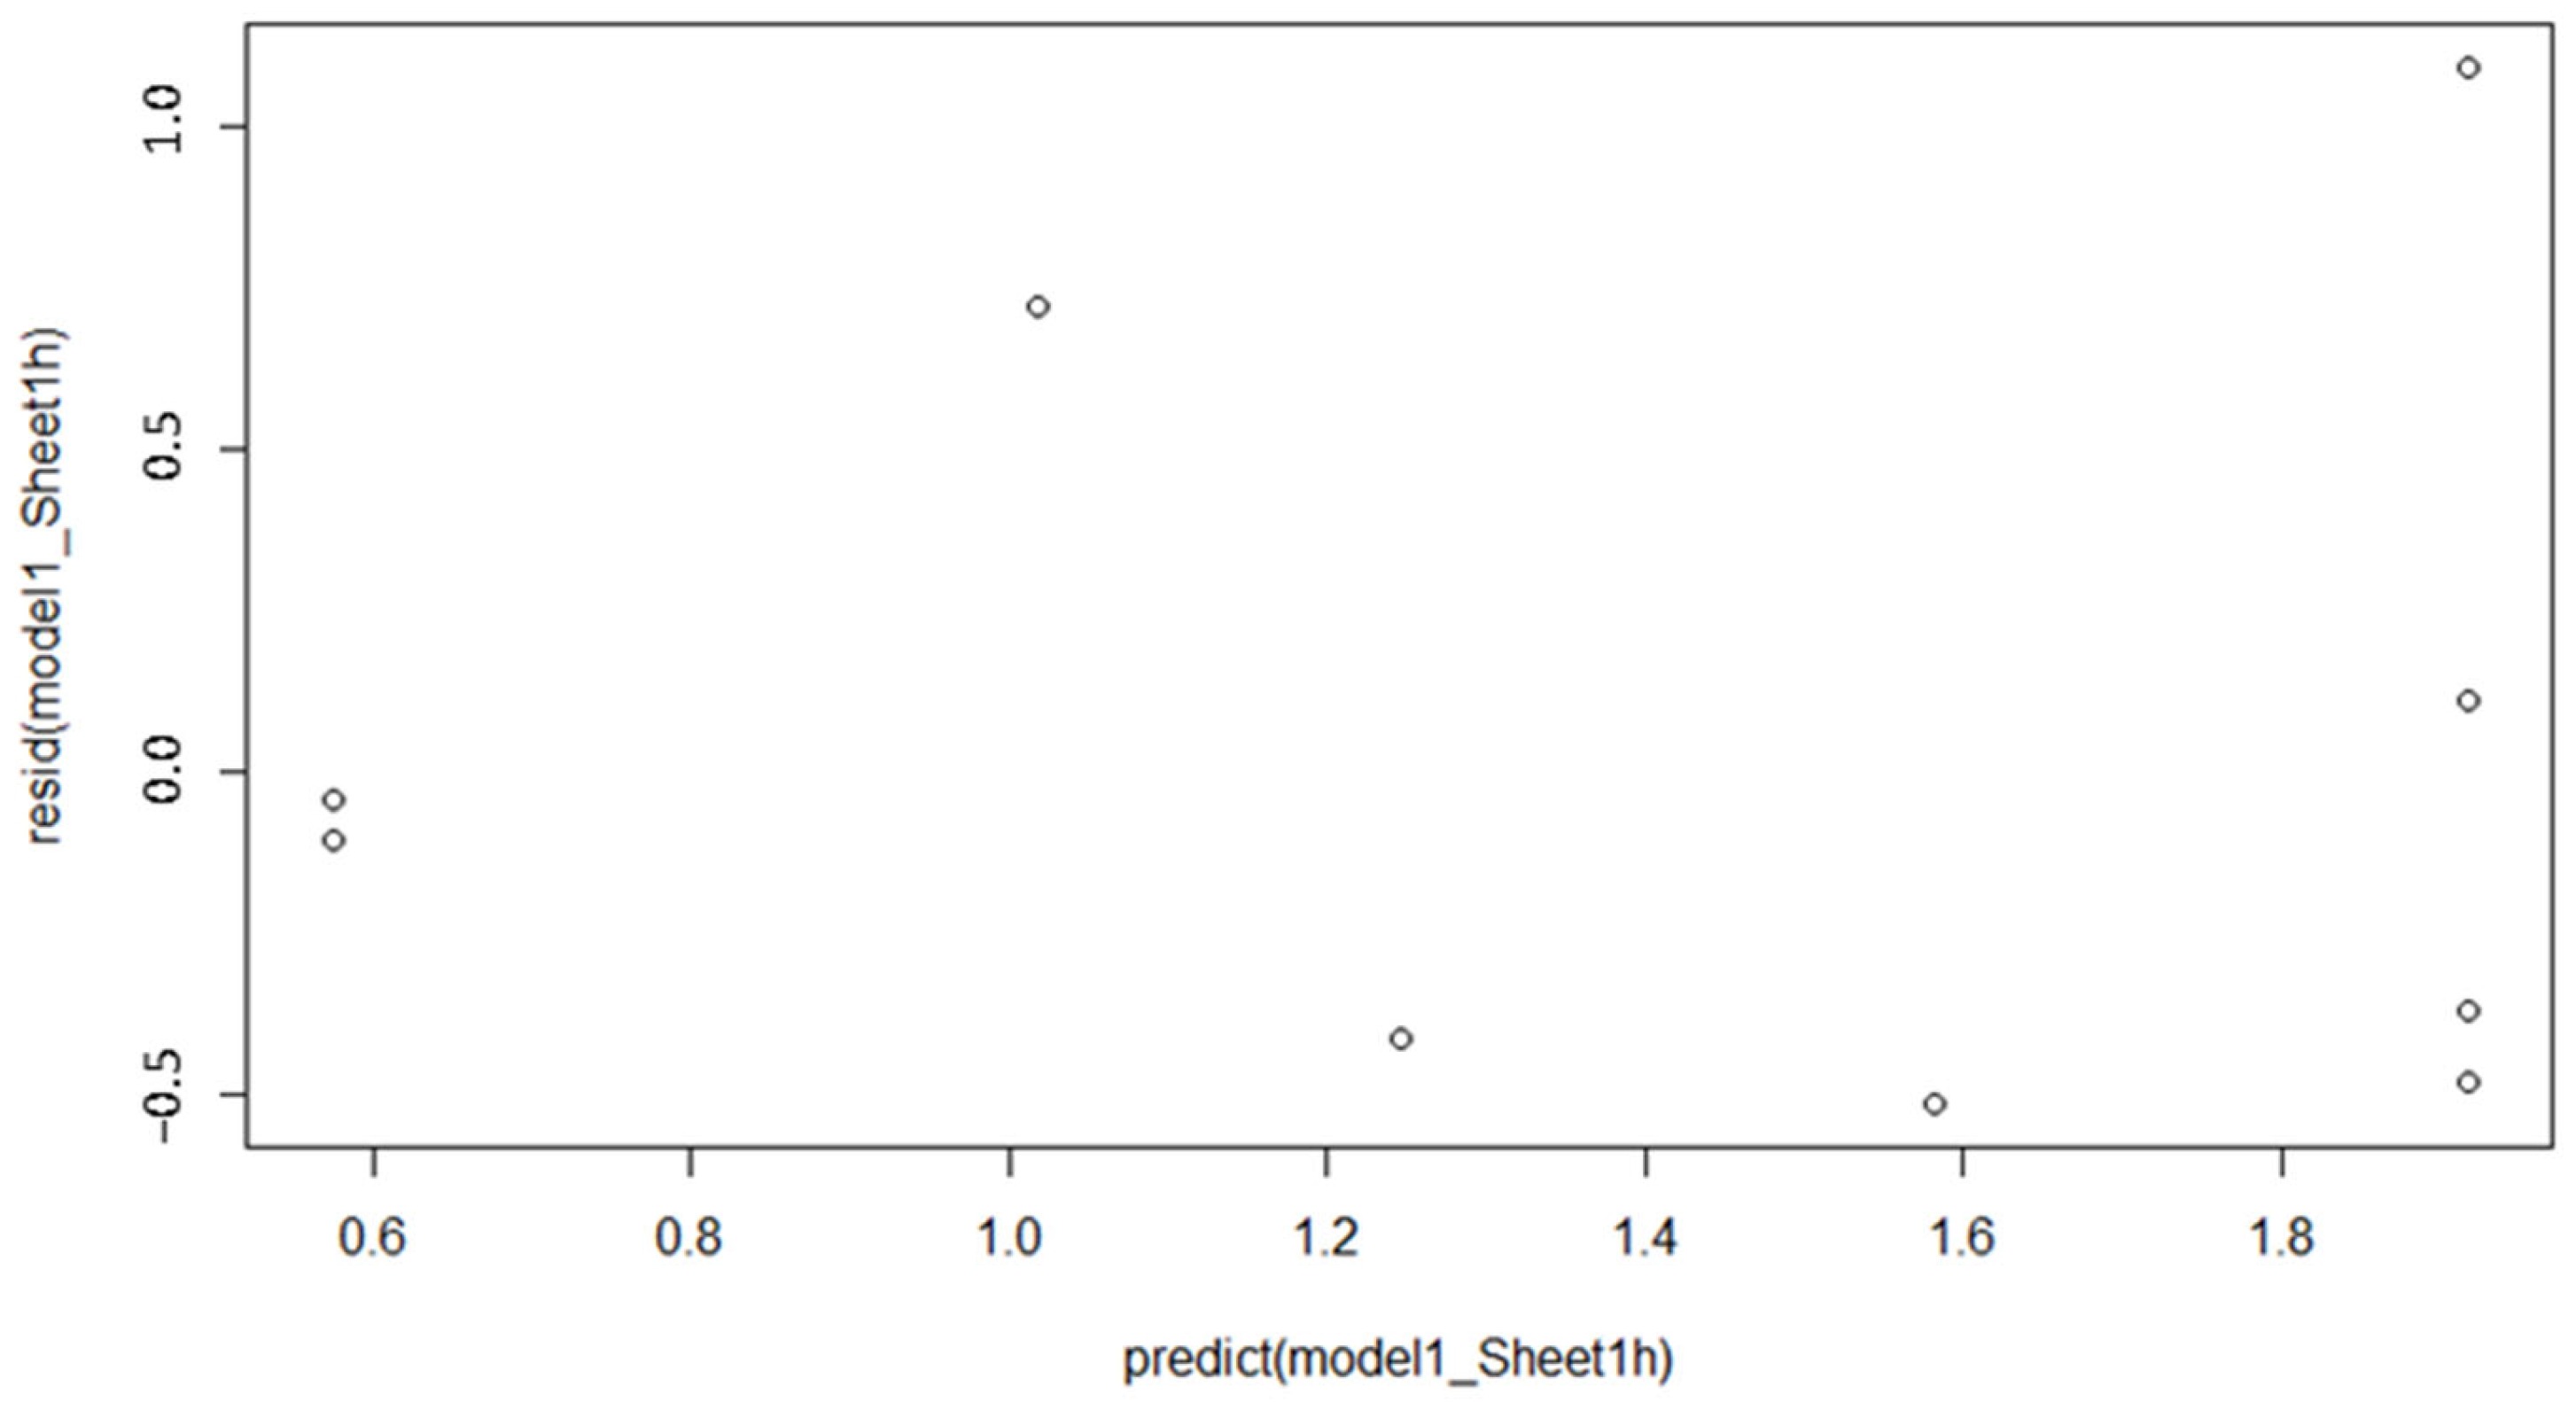
2.3. Statistical Analysis
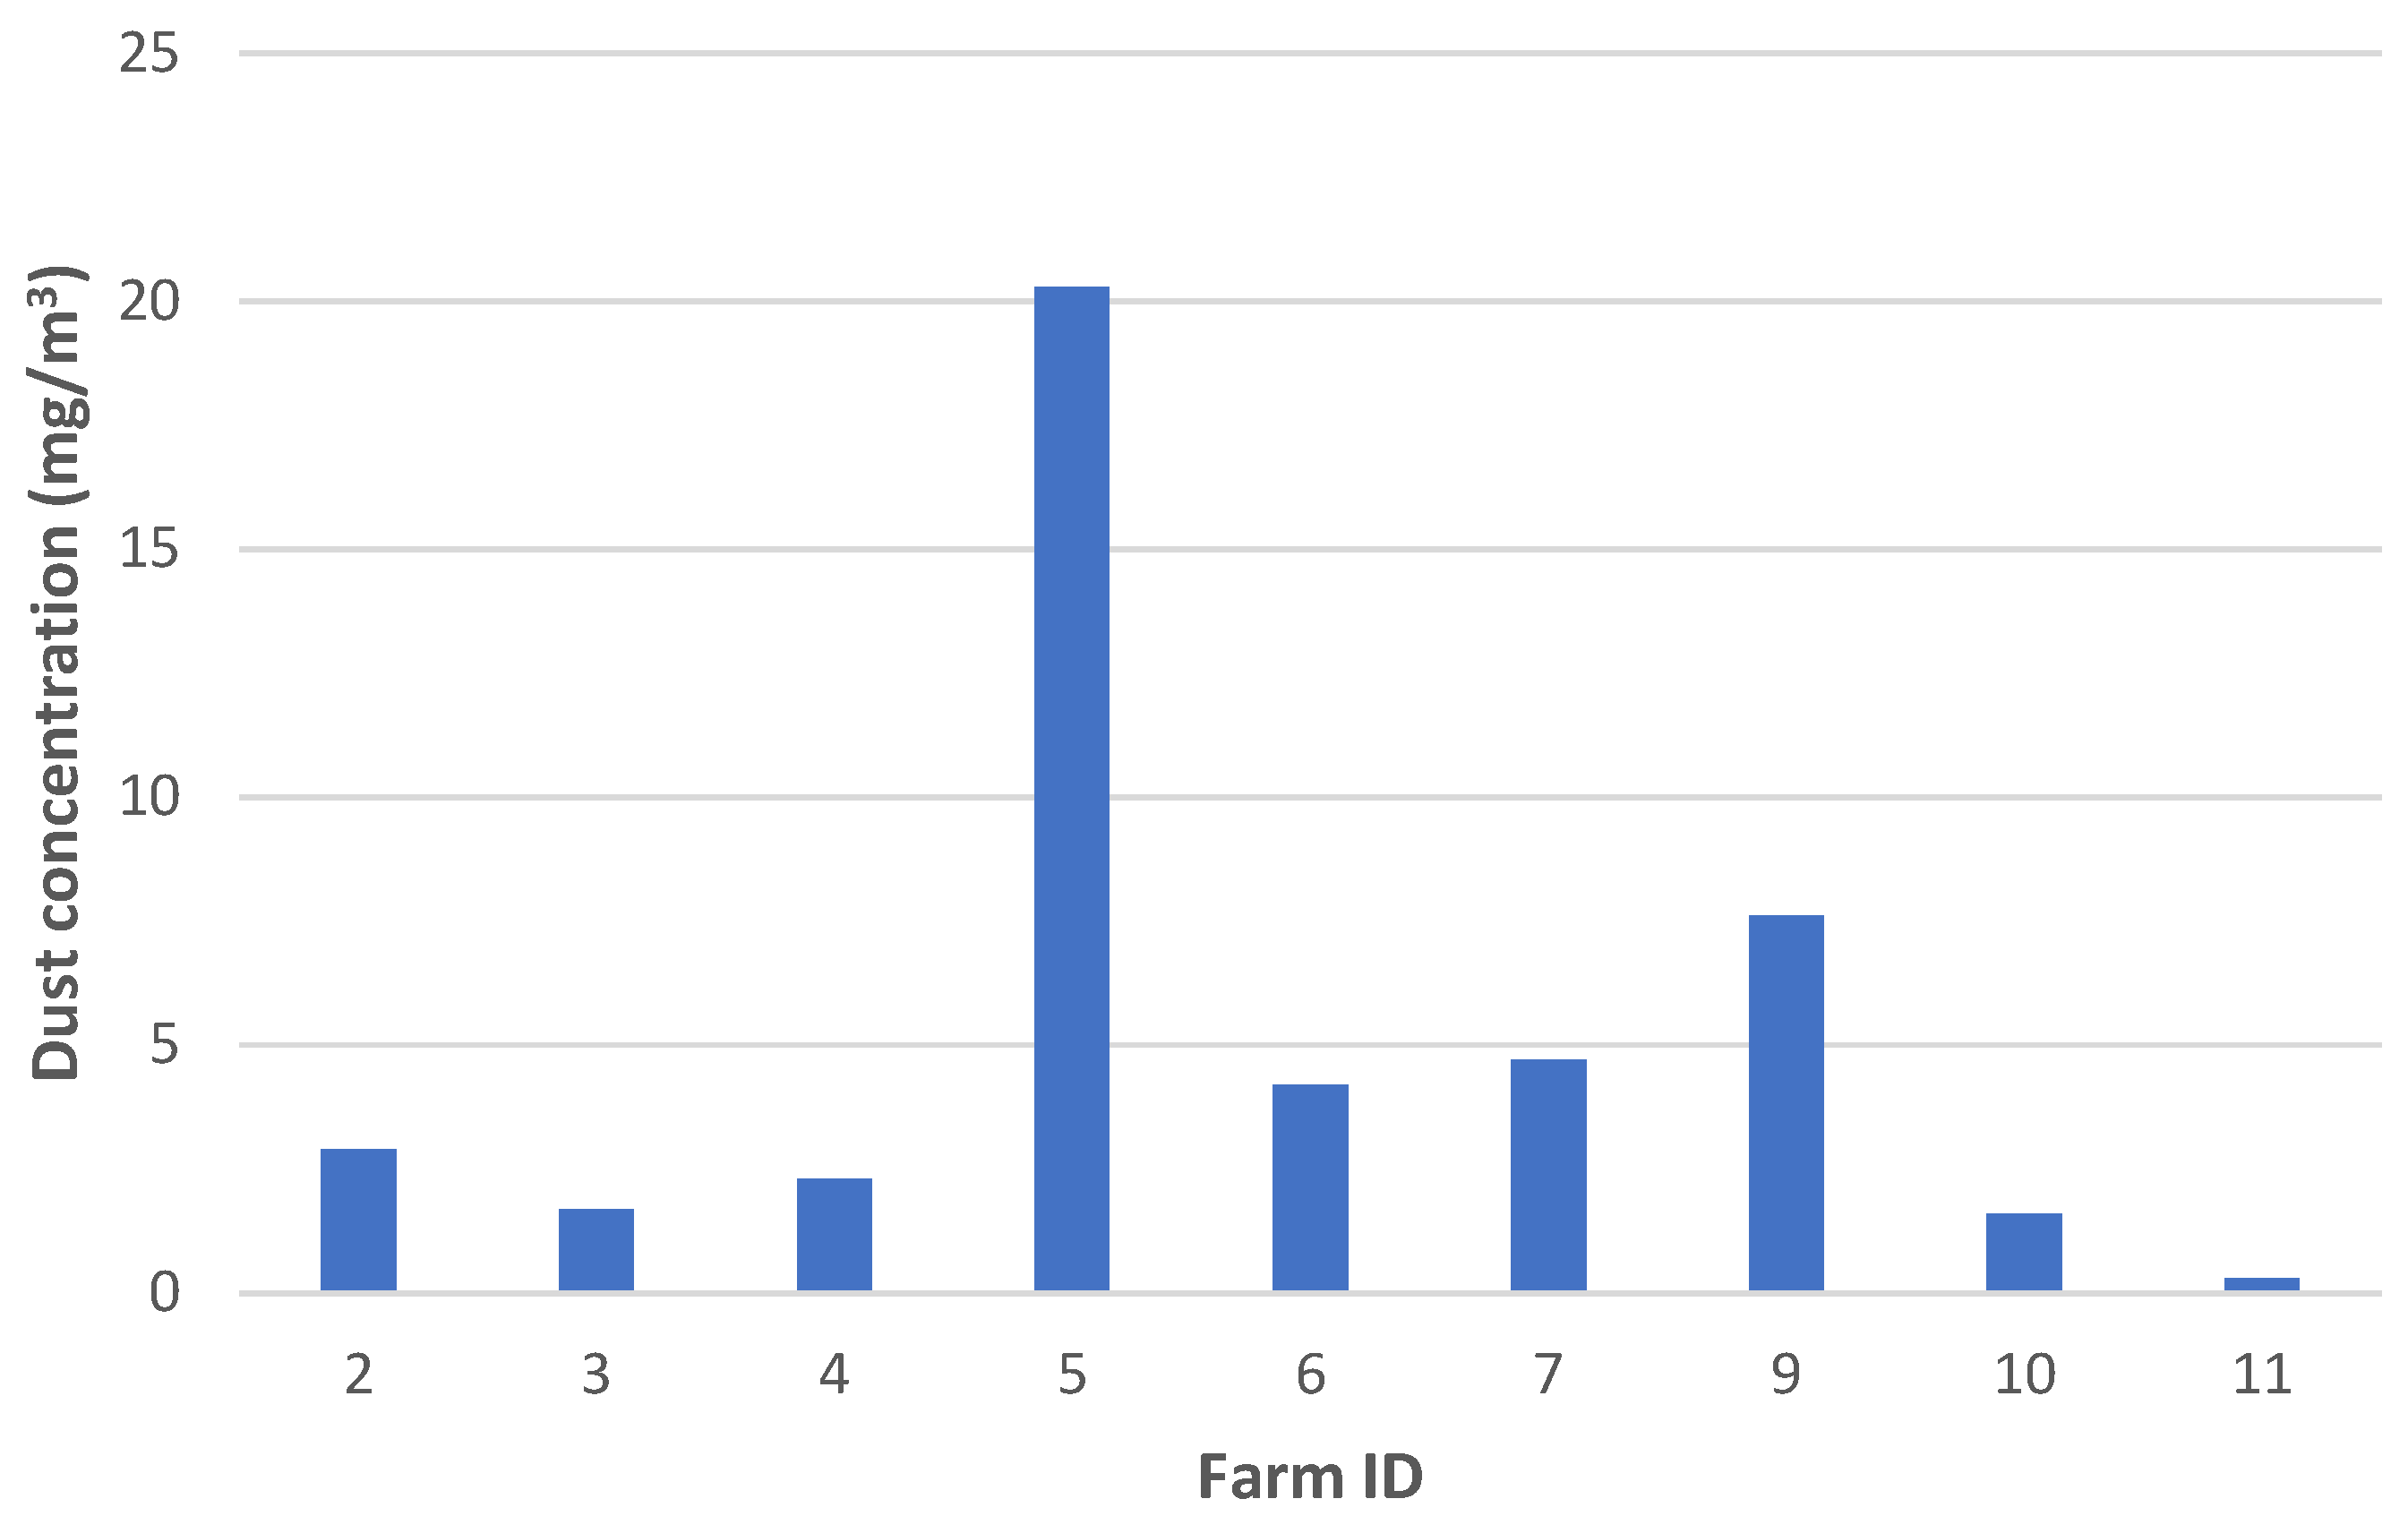
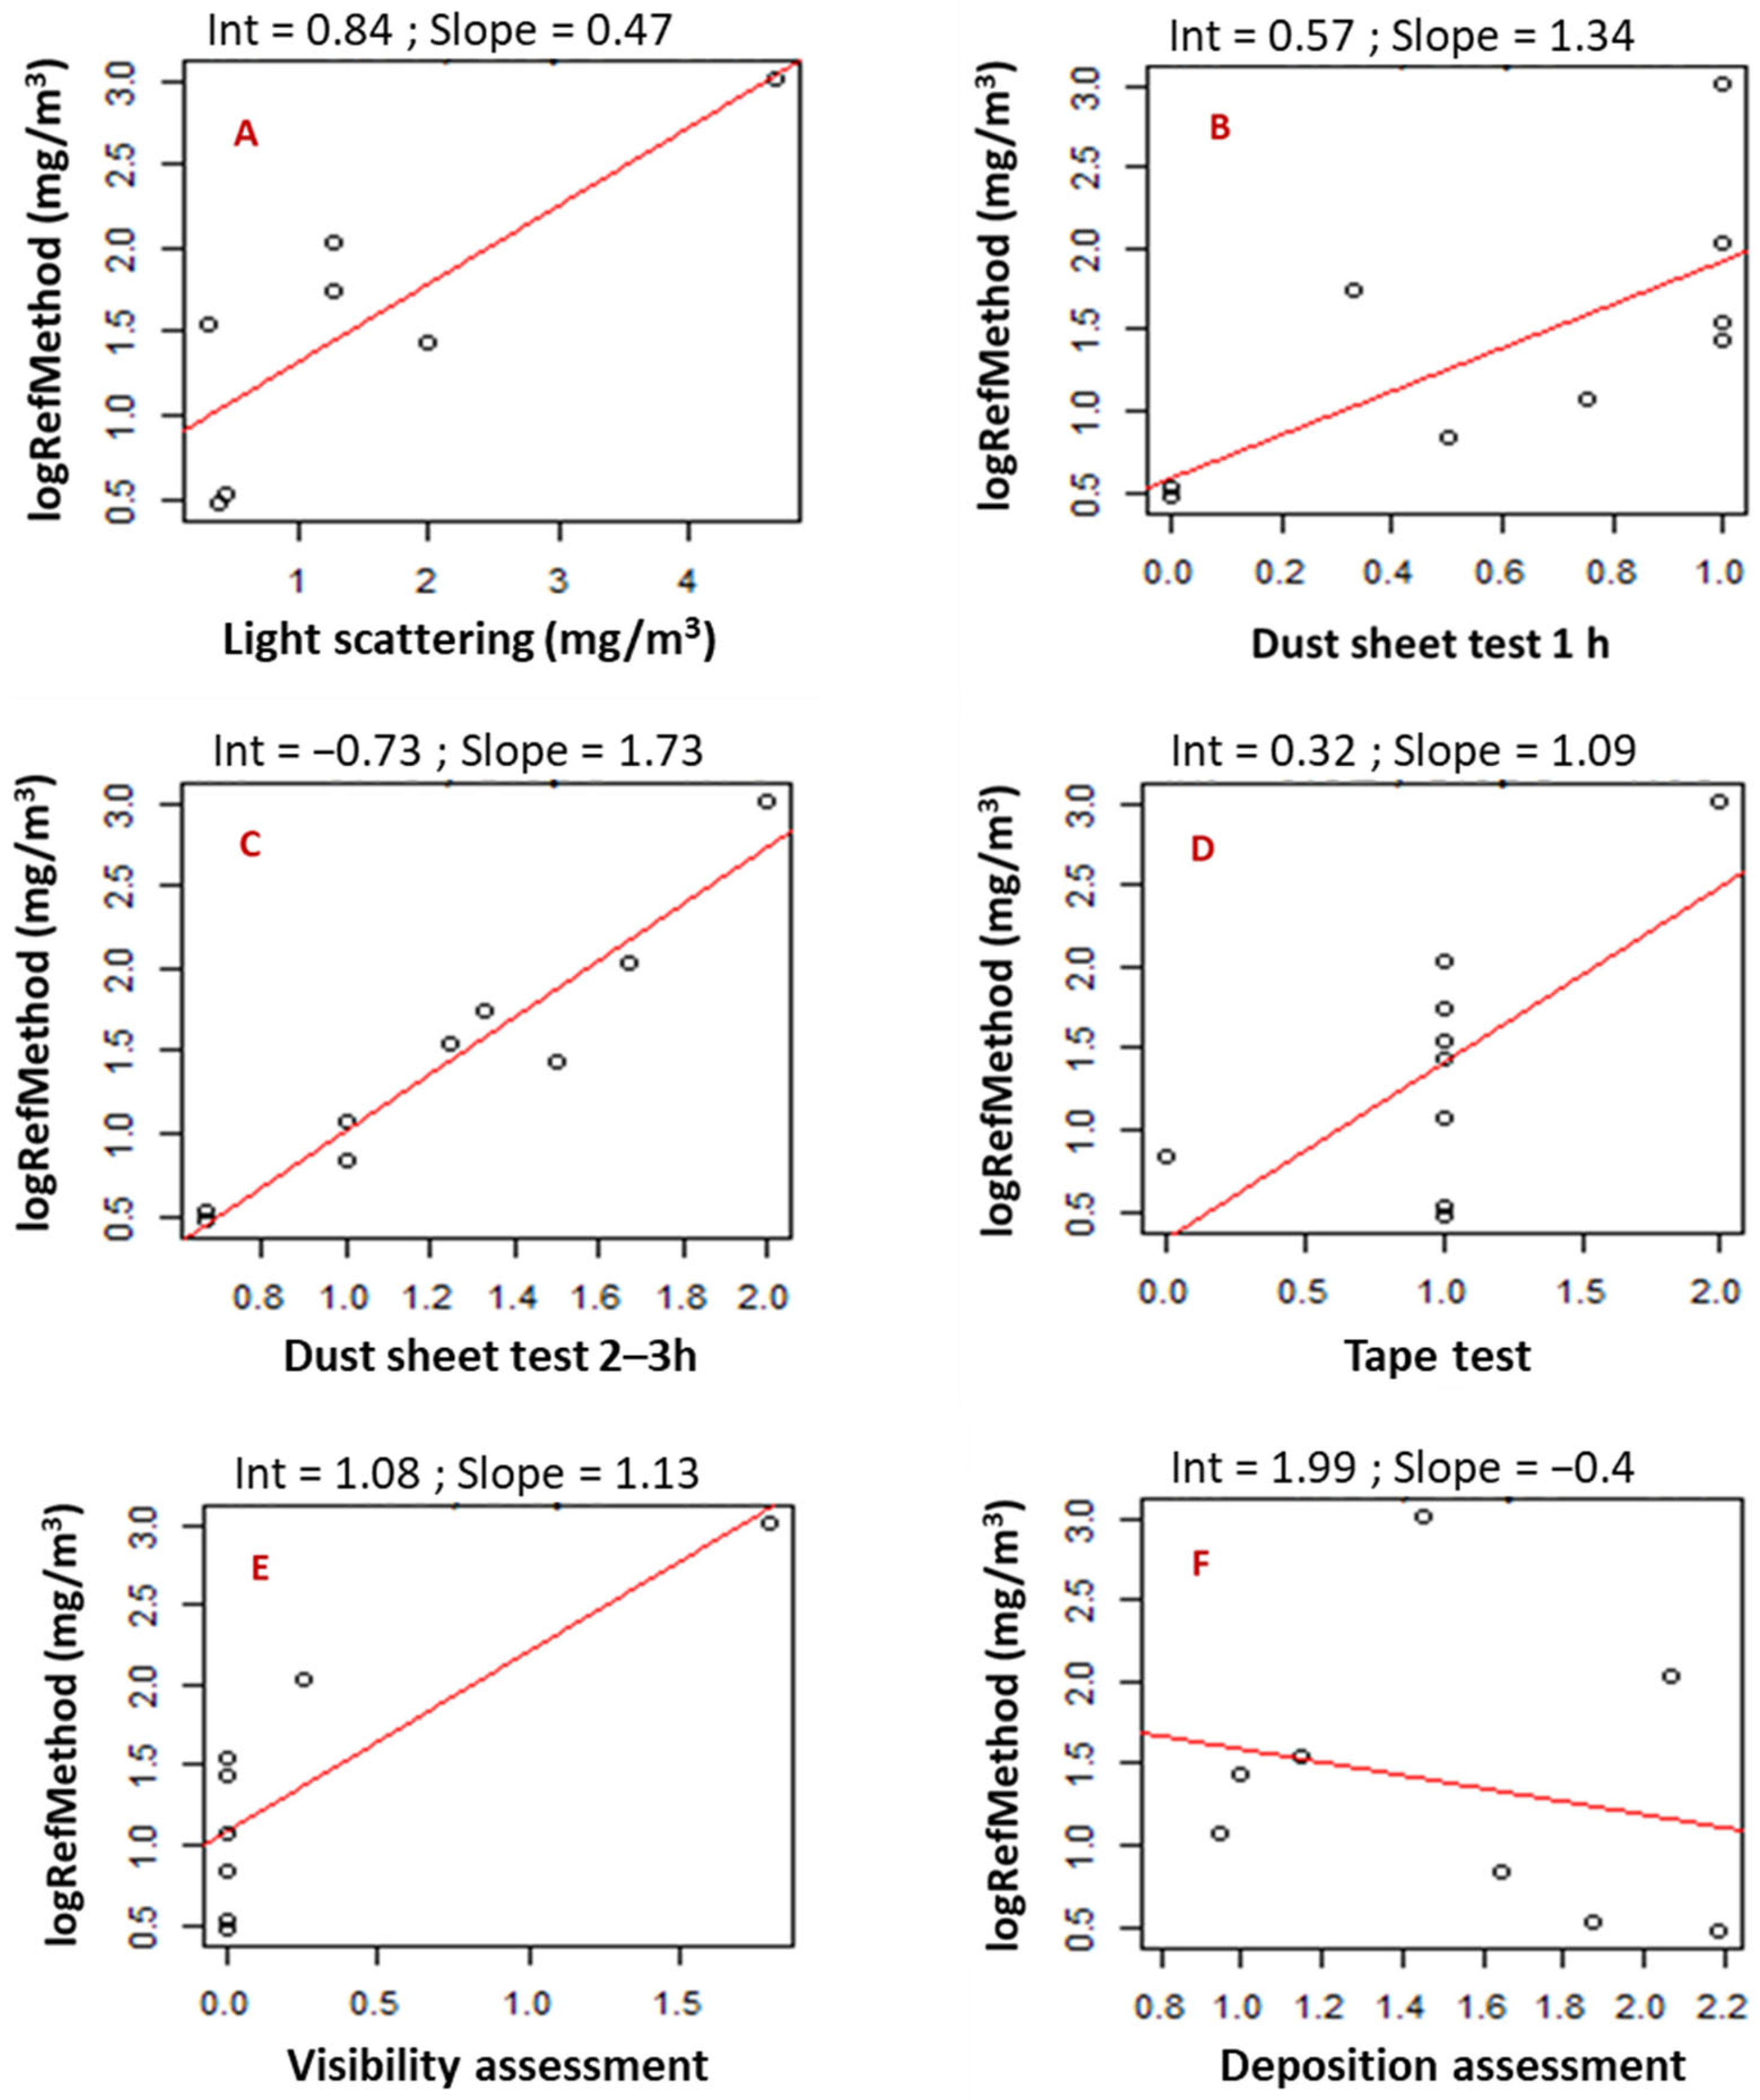
3. Results
4. Discussion
5. Conclusions
Author Contributions
Funding
Institutional Review Board Statement
Informed Consent Statement
Data Availability Statement
Acknowledgments
Conflicts of Interest
References
- Zhang, Y. Indoor Air Quality Engineering, 1st ed.; CRC Press: Boca Raton, US, USA, 2004; pp. 6–7. [Google Scholar]
- European Commission. Council Directive 98/58/EC of 20 July 1998 Concerning the Protection of Animals Kept for Farming Purposes. 1998. Available online: https://eur-lex.europa.eu/legal-content/EN/TXT/?uri=celex%3A31998L0058 (accessed on 26 December 2022). [CrossRef]
- EURCAW-Poultry-SFA. List and Description of Improved Methods for the Assessment of Welfare. 2021, pp. 1–19. Available online: https://zenodo.org/record/7473090#.Y6WrH4fMI2w (accessed on 26 December 2022).
- EURCAW-Poultry-SFA. Description of the Considered Validated Indicators among the Identified Ones and Associated Methodology, Laying Hens Welfare in Alternative Housing Systems. 2022, pp. 1–22. Available online: https://doi.org/10.5281/zenodo.7436995 (accessed on 26 December 2022). [CrossRef]
- Martin, P.; Bateson, P. Measuring Behaviour—An Introductory Guide; Cambridge University Press: Cambridge, UK, 1993; pp. 114–124. [Google Scholar]
- Welfare Quality®. Welfare Quality Assessment Protocol for Laying Hens; Welfare Quality Consortium: Lelystad, The Netherlands, 2019; pp. 1–69. [Google Scholar]
- Welfare Quality®. Welfare Quality Assessment Protocol for Poultry; Welfare Quality Consortium: Lelystad, The Netherlands, 2009; pp. 1–119. [Google Scholar]
- Winkel, A. Particulate Matter Emission from Livestock Houses. Ph.D. Thesis, Wageningen University and Research, Wageningen, The Netherlands, 21 October 2016. [Google Scholar]
- Cambra-López, M.; Winkel, A.; Mosquera, J.; Ogink, N.W.M.; Aarnink, A.J.A. Comparison between light scattering and gravimetric samplers for PM10 mass concentration in poultry and pig houses. Atmos. Environ. 2015, 111, 20–27. [Google Scholar] [CrossRef]
- Team R. RStudio: Integrated Development for R; RStudio, PBC: Boston, MA, USA, 2021; Available online: http://www.rstudio.com/ (accessed on 26 December 2022).
- Cambra-Lopez, M.; Aarnink, A.J.; Zhao, Y.; Calvet, S.; Torres, A.G. Airborne particulate matter from livestock production systems: A review of an air pollution problem. Environ. Pollut. 2010, 158, 1–17. [Google Scholar] [CrossRef] [PubMed]
- David, B.; Moe, R.O.; Michel, V.; Lund, V.; Mejdell, C. Air quality in alternative housing systems may have an impact on laying hen welfare. Part I-Dust. Animals 2015, 5, 495–511. [Google Scholar] [CrossRef] [Green Version]
- Le Bouquin, S.; Huneau-Salaun, A.; Huonnic, D.; Balaine, L.; Martin, S.; Michel, V. Aerial dust concentration in cage-housed, floor-housed, and aviary facilities for laying hens. Poult. Sci. 2013, 92, 2827–2833. [Google Scholar] [CrossRef]
- Zuskin, E.; Mustajbegovic, J.; Schachter, E.N.; Kern, J.; Rienzi, N.; Goswami, S.; Marom, Z.; Maayani, S. Respiratory function in poultry workers and pharmacologic characterization of poultry dust extract. Environ. Res. 1995, 70, 11–19. [Google Scholar] [CrossRef] [PubMed]
- Radon, K.; Danuser, B.; Iversen, M.; Monso, E.; Weber, C.; Hartung, J.; Donham, K.J.; Palmgren, U.; Nowak, D. Air contaminants in different European farming environments. Ann. Agric. Environ. Med. 2002, 9, 41–48. [Google Scholar] [PubMed]
- Seedorf, J.; Hartung, J.; Schröder, M.; Linkert, K.H.; Phillips, V.R.; Holden, M.R.; Sneath, R.W.; Short, J.L.; White, R.P.; Pedersen, S.; et al. Concentrations and emissions of airborne endotoxins and microorganisms in livestock buildings in Northern Europe. J. Agric. Eng. Res. 1998, 70, 97–109. [Google Scholar] [CrossRef] [Green Version]
- Takai, H.; Pedersen, S.; Johnsen, J.O.; Metz, J.H.M.; Koerkamp, P.G.; Uenk, G.H.; Phillips, V.R.; Holden, M.R.; Sneath, R.W.; Short, J.L.; et al. Concentrations and emissions of airborne dust in livestock buildings in Northern Europe. J. Agric. Eng. Res. 1998, 70, 59–77. [Google Scholar] [CrossRef] [Green Version]
- EMEP/EEA. EMEP/EEA Air Pollutant Emission Inventory Guidebook 2019—Technical Guidance to Prepare National Emission Inventories; European Environment Agency: Copenhagen, Denmark, 2019; pp. 1–26. [Google Scholar]
- Kim, K.Y.; Ko, H.J. Field survey on concentration and emission of dust in different types of poultry houses of South Korea. Atmosphere 2020, 11, 530. [Google Scholar] [CrossRef]
- Harry, E.G. Air pollution in farm buildings and methods of control: A review. Avian Pathol. 1978, 7, 441–454. [Google Scholar] [CrossRef] [PubMed]
- Almuhanna, E.; Ahmed, A.S.; Al-Yousif, Y. Effect of air contaminants on poultry immunological and production performance. Int. J. Poult. Sci. 2011, 10, 461–470. [Google Scholar] [CrossRef] [Green Version]
- Knierim, U.; Winckler, C. On-farm welfare assessment in cattle: Validity, reliability and feasibility issues and future perspectives with special regard to the Welfare Quality® approach. Anim. Welf. 2009, 18, 451–458. [Google Scholar] [CrossRef]
- Tuyttens, F.A.; Federici, J.F.; Vanderhasselt, R.F.; Goethals, K.; Duchateau, L.; Sans, E.C.; Molento, C.F. Assessment of welfare of Brazilian and Belgian broiler flocks using the Welfare Quality protocol. Poult. Sci. 2015, 94, 1758–1766. [Google Scholar] [CrossRef] [PubMed]
- Federici, J.F.; Vanderhasselt, R.; Sans, E.C.O.; Tuyttens, F.A.M.; Souza, A.P.O.; Molento, C.F.M. Assessment of broiler chicken welfare in Southern Brazil. Rev. Bras. Cienc. Avic. 2016, 18, 133–140. [Google Scholar] [CrossRef] [Green Version]
- Iannetti, L.; Romagnoli, S.; Cotturone, G.; Podaliri Vulpiani, M. Animal welfare assessment in antibiotic-free and conventional broiler chicken. Animals 2021, 11, 2822. [Google Scholar] [CrossRef] [PubMed]
- Yasmeen, R.; Ali, Z.; Tyrrel, S.; Nasir, Z.A. Estimation of particulate matter and gaseous concentrations using low-cost sensors from broiler houses. Environ. Monit. Assess. 2019, 191, 470. [Google Scholar] [CrossRef] [PubMed]
- Marczak, H. Examination of dust concentration in the interior air of a teaching room. J. Ecol. Eng. 2018, 19, 99–106. [Google Scholar] [CrossRef]


| Method Examined | p-Value of Slope a | Significance b | Adjusted R2 | RMSE |
|---|---|---|---|---|
| Light scattering measurements | 0.02174 | * | 0.6206 | 0.7567 |
| Dust sheet test 1 h | 0.03118 | * | 0.4376 | 0.7987 |
| Dust sheet test 2–3 h | 0.00003 | *** | 0.9192 | 0.3553 |
| Tape test | 0.04541 | * | 0.3801 | 0.4088 |
| Visibility assessment | 0.00994 | ** | 0.6462 | 1.1112 |
| Deposition assessment | 0.58756 | n.s. | −0.1062 | 0.6546 |
Disclaimer/Publisher’s Note: The statements, opinions and data contained in all publications are solely those of the individual author(s) and contributor(s) and not of MDPI and/or the editor(s). MDPI and/or the editor(s) disclaim responsibility for any injury to people or property resulting from any ideas, methods, instructions or products referred to in the content. |
© 2023 by the authors. Licensee MDPI, Basel, Switzerland. This article is an open access article distributed under the terms and conditions of the Creative Commons Attribution (CC BY) license (https://creativecommons.org/licenses/by/4.0/).
Share and Cite
Mousqué, S.; Mocz, F.; Riber, A.B. Validation of Methods for Assessment of Dust Levels in Layer Barns. Animals 2023, 13, 783. https://doi.org/10.3390/ani13050783
Mousqué S, Mocz F, Riber AB. Validation of Methods for Assessment of Dust Levels in Layer Barns. Animals. 2023; 13(5):783. https://doi.org/10.3390/ani13050783
Chicago/Turabian StyleMousqué, Solène, Frédérique Mocz, and Anja B. Riber. 2023. "Validation of Methods for Assessment of Dust Levels in Layer Barns" Animals 13, no. 5: 783. https://doi.org/10.3390/ani13050783