
Impact of Co-Ensiling of Maize with Moringa oleifera on the Production of Greenhouse Gases and the Characteristics of Fermentation in Ruminants

 ,
,  , ,
, ,  and
and 
Abstract
:Simple Summary
Abstract
1. Introduction
2. Materials and Methods
2.1. Production of Forage
2.2. Elaboration of Micro-Silages
2.3. Chemical Composition
2.4. In Vitro Incubation
2.5. Ruminal Total Biogas, Methane (CH4), Carbon Monoxide (CO), and Hydrogen Sulfide (H2S)
2.6. Ruminal Hydrogen Potential (pH) and Dry Matter Degradability (DMD)
2.7. Calculations
2.8. Statistical Analysis
3. Results
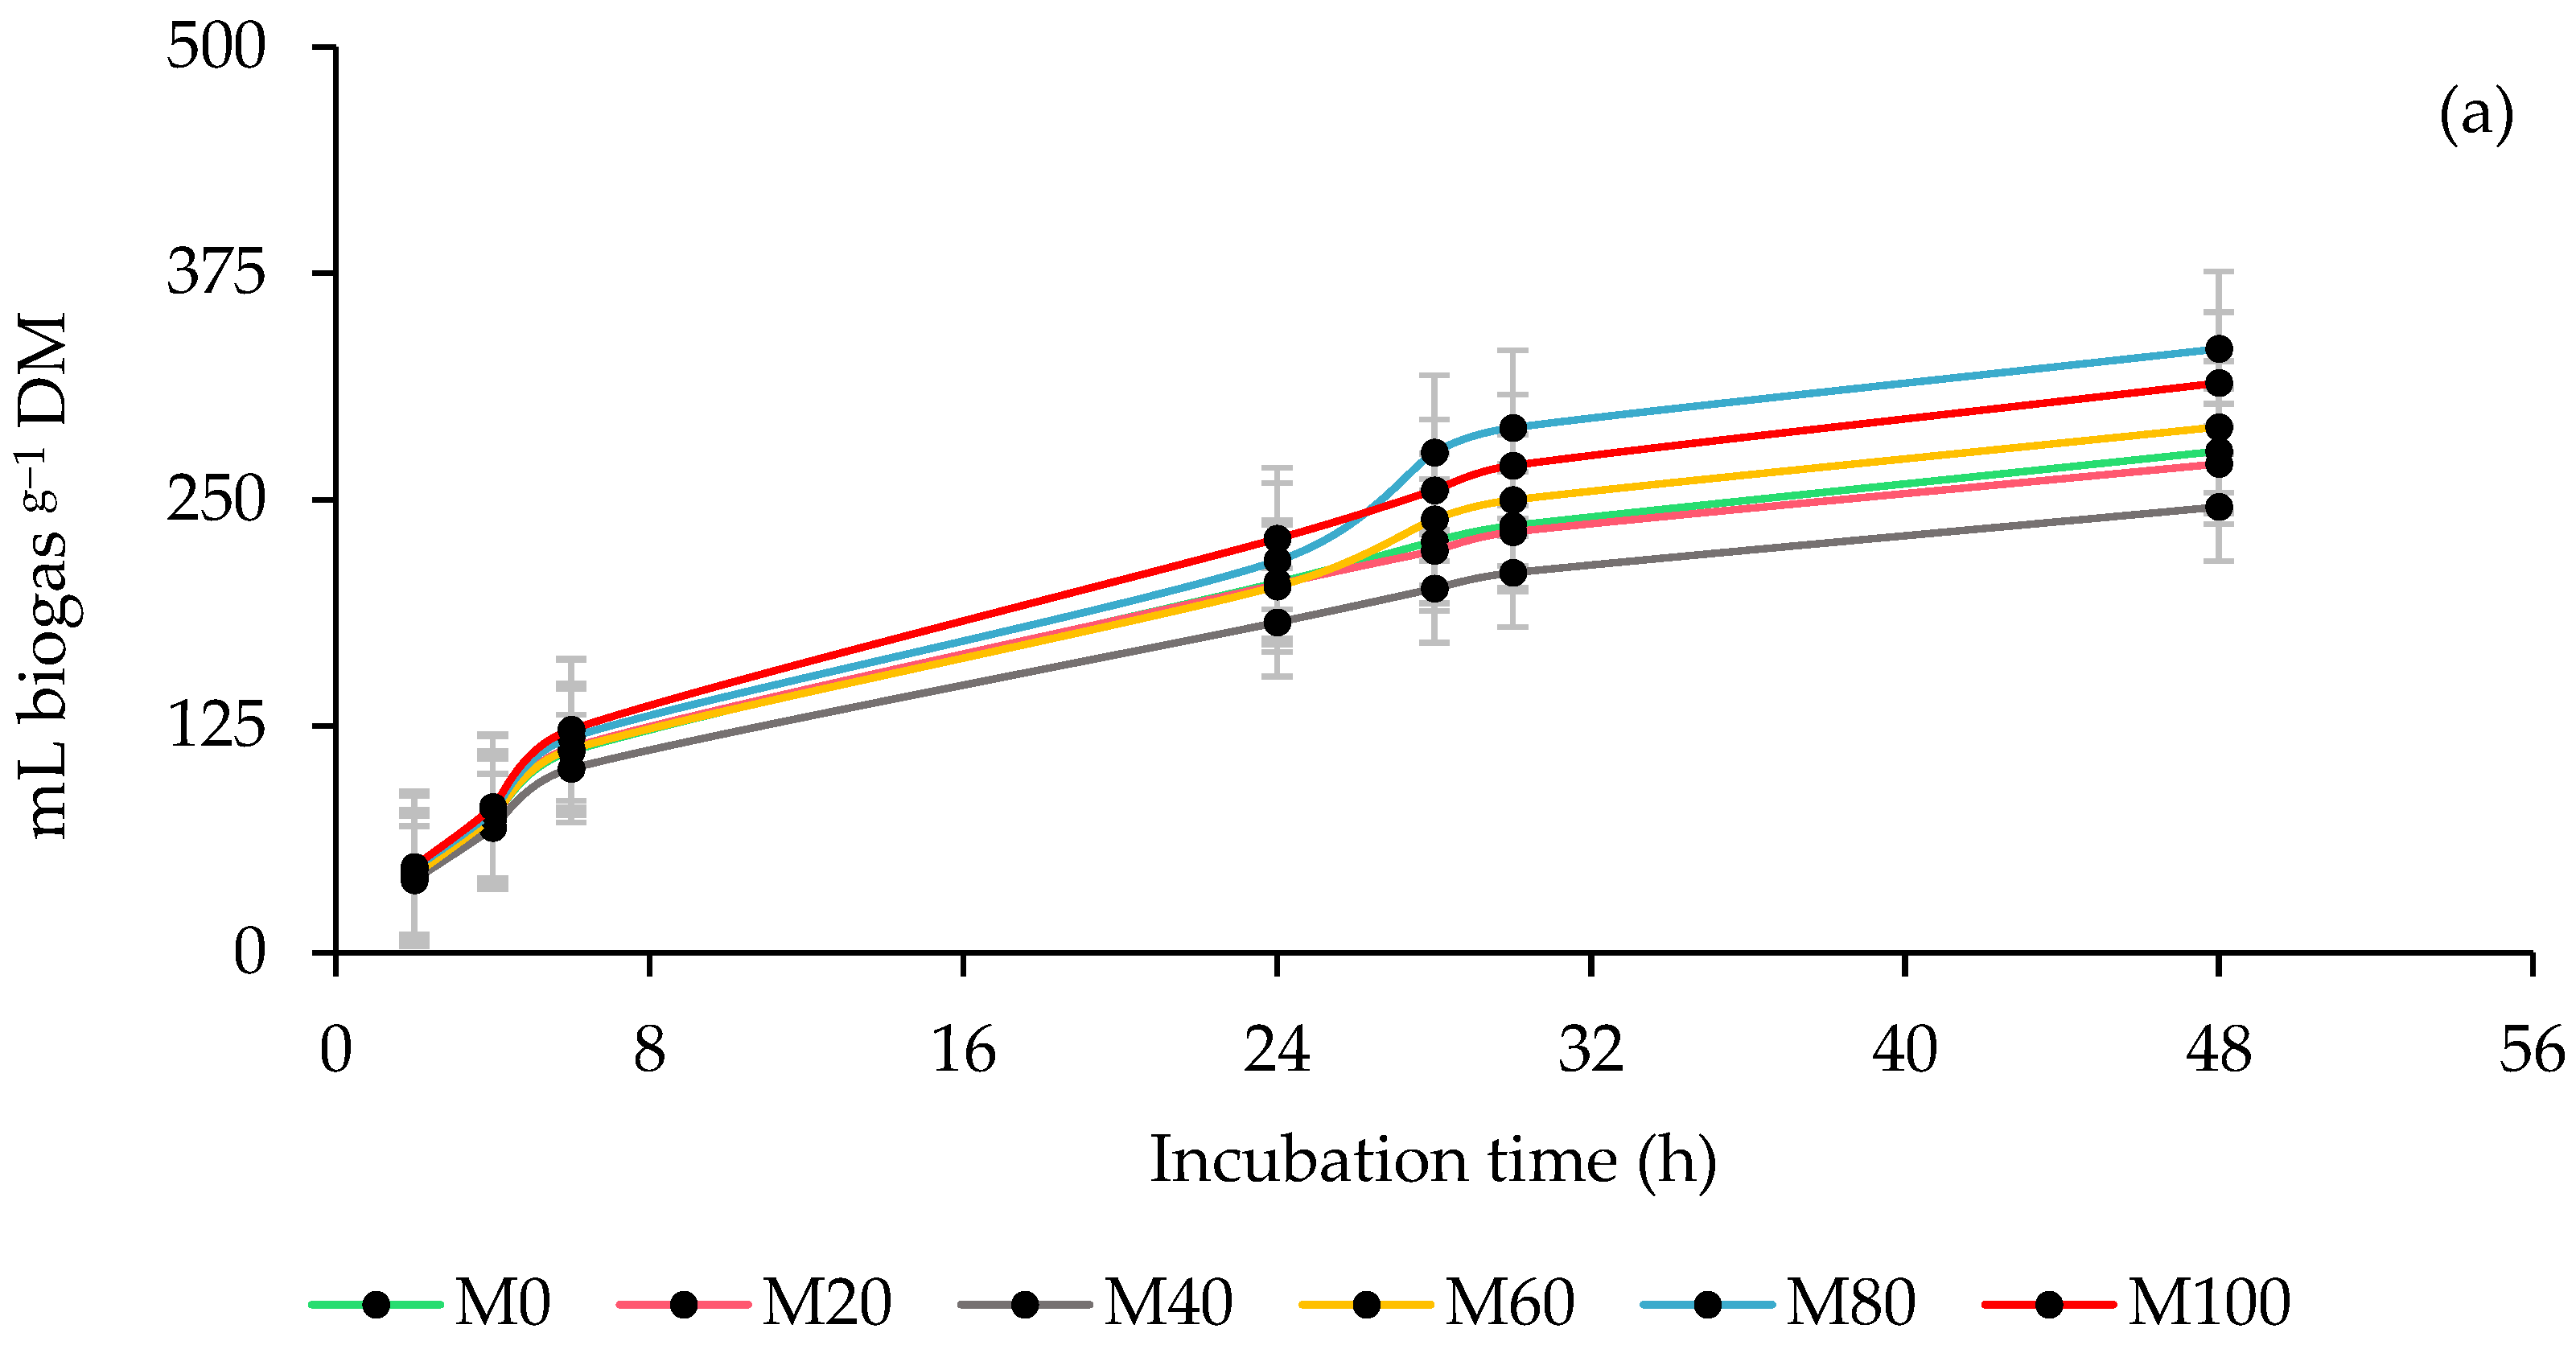
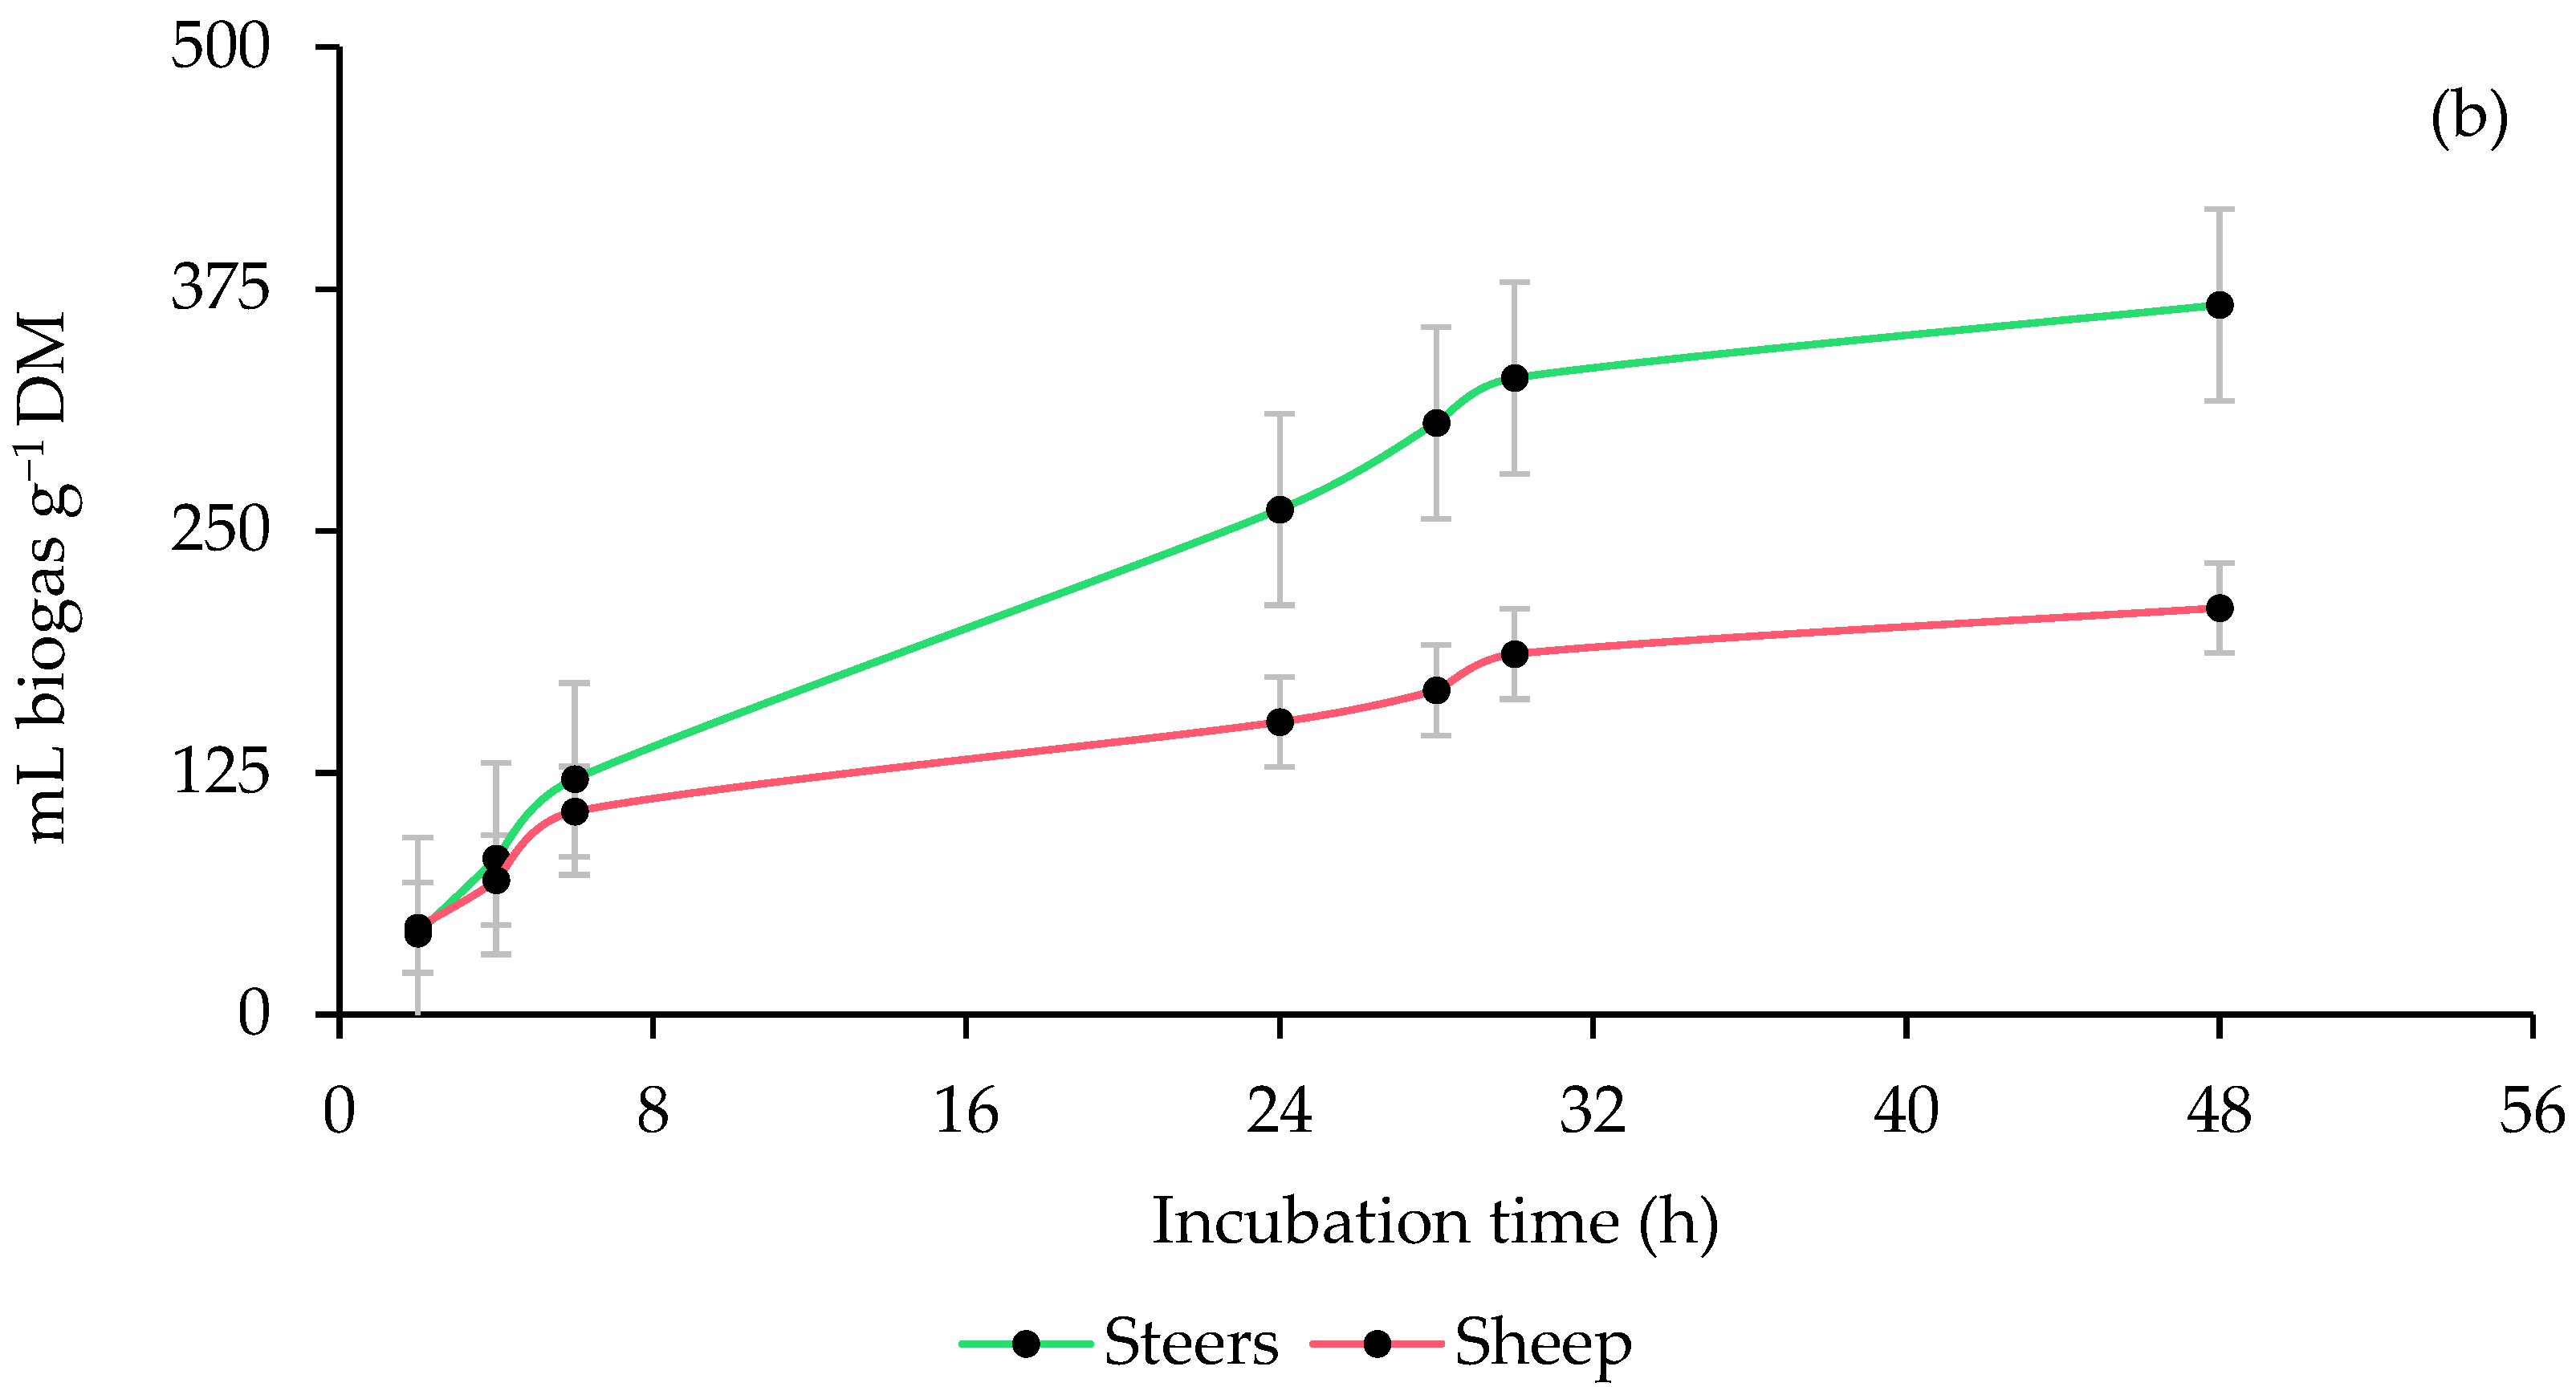
3.1. Ruminal Biogas Production
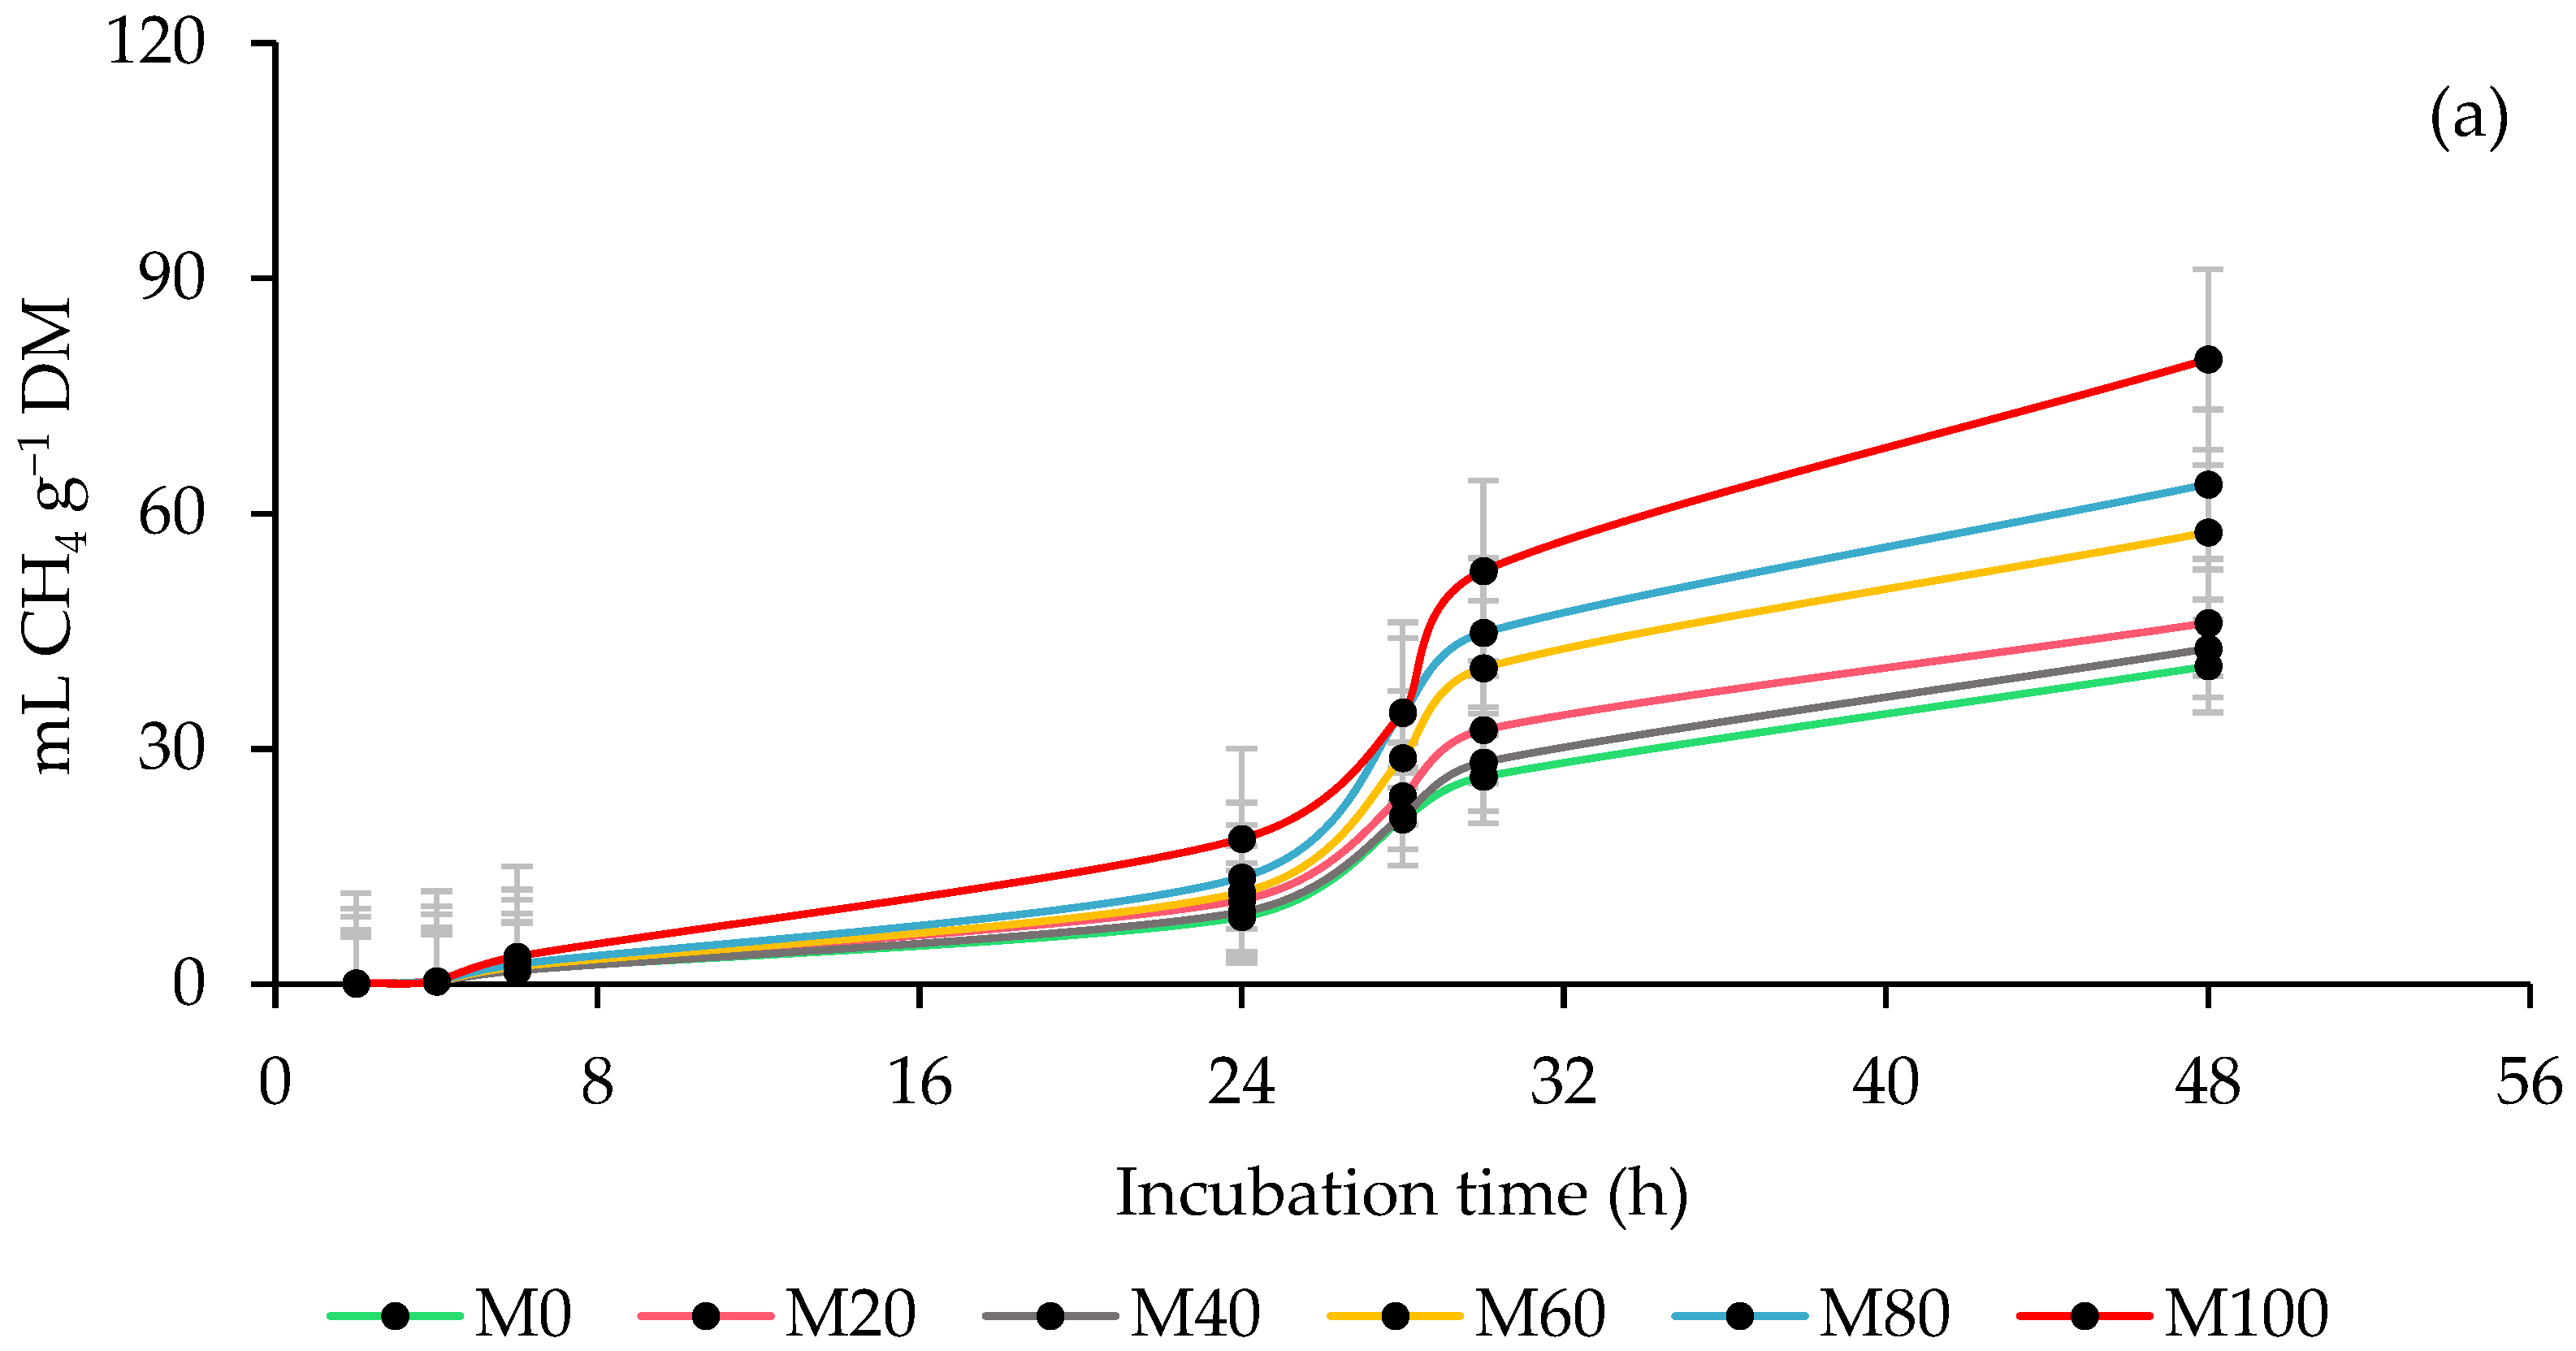
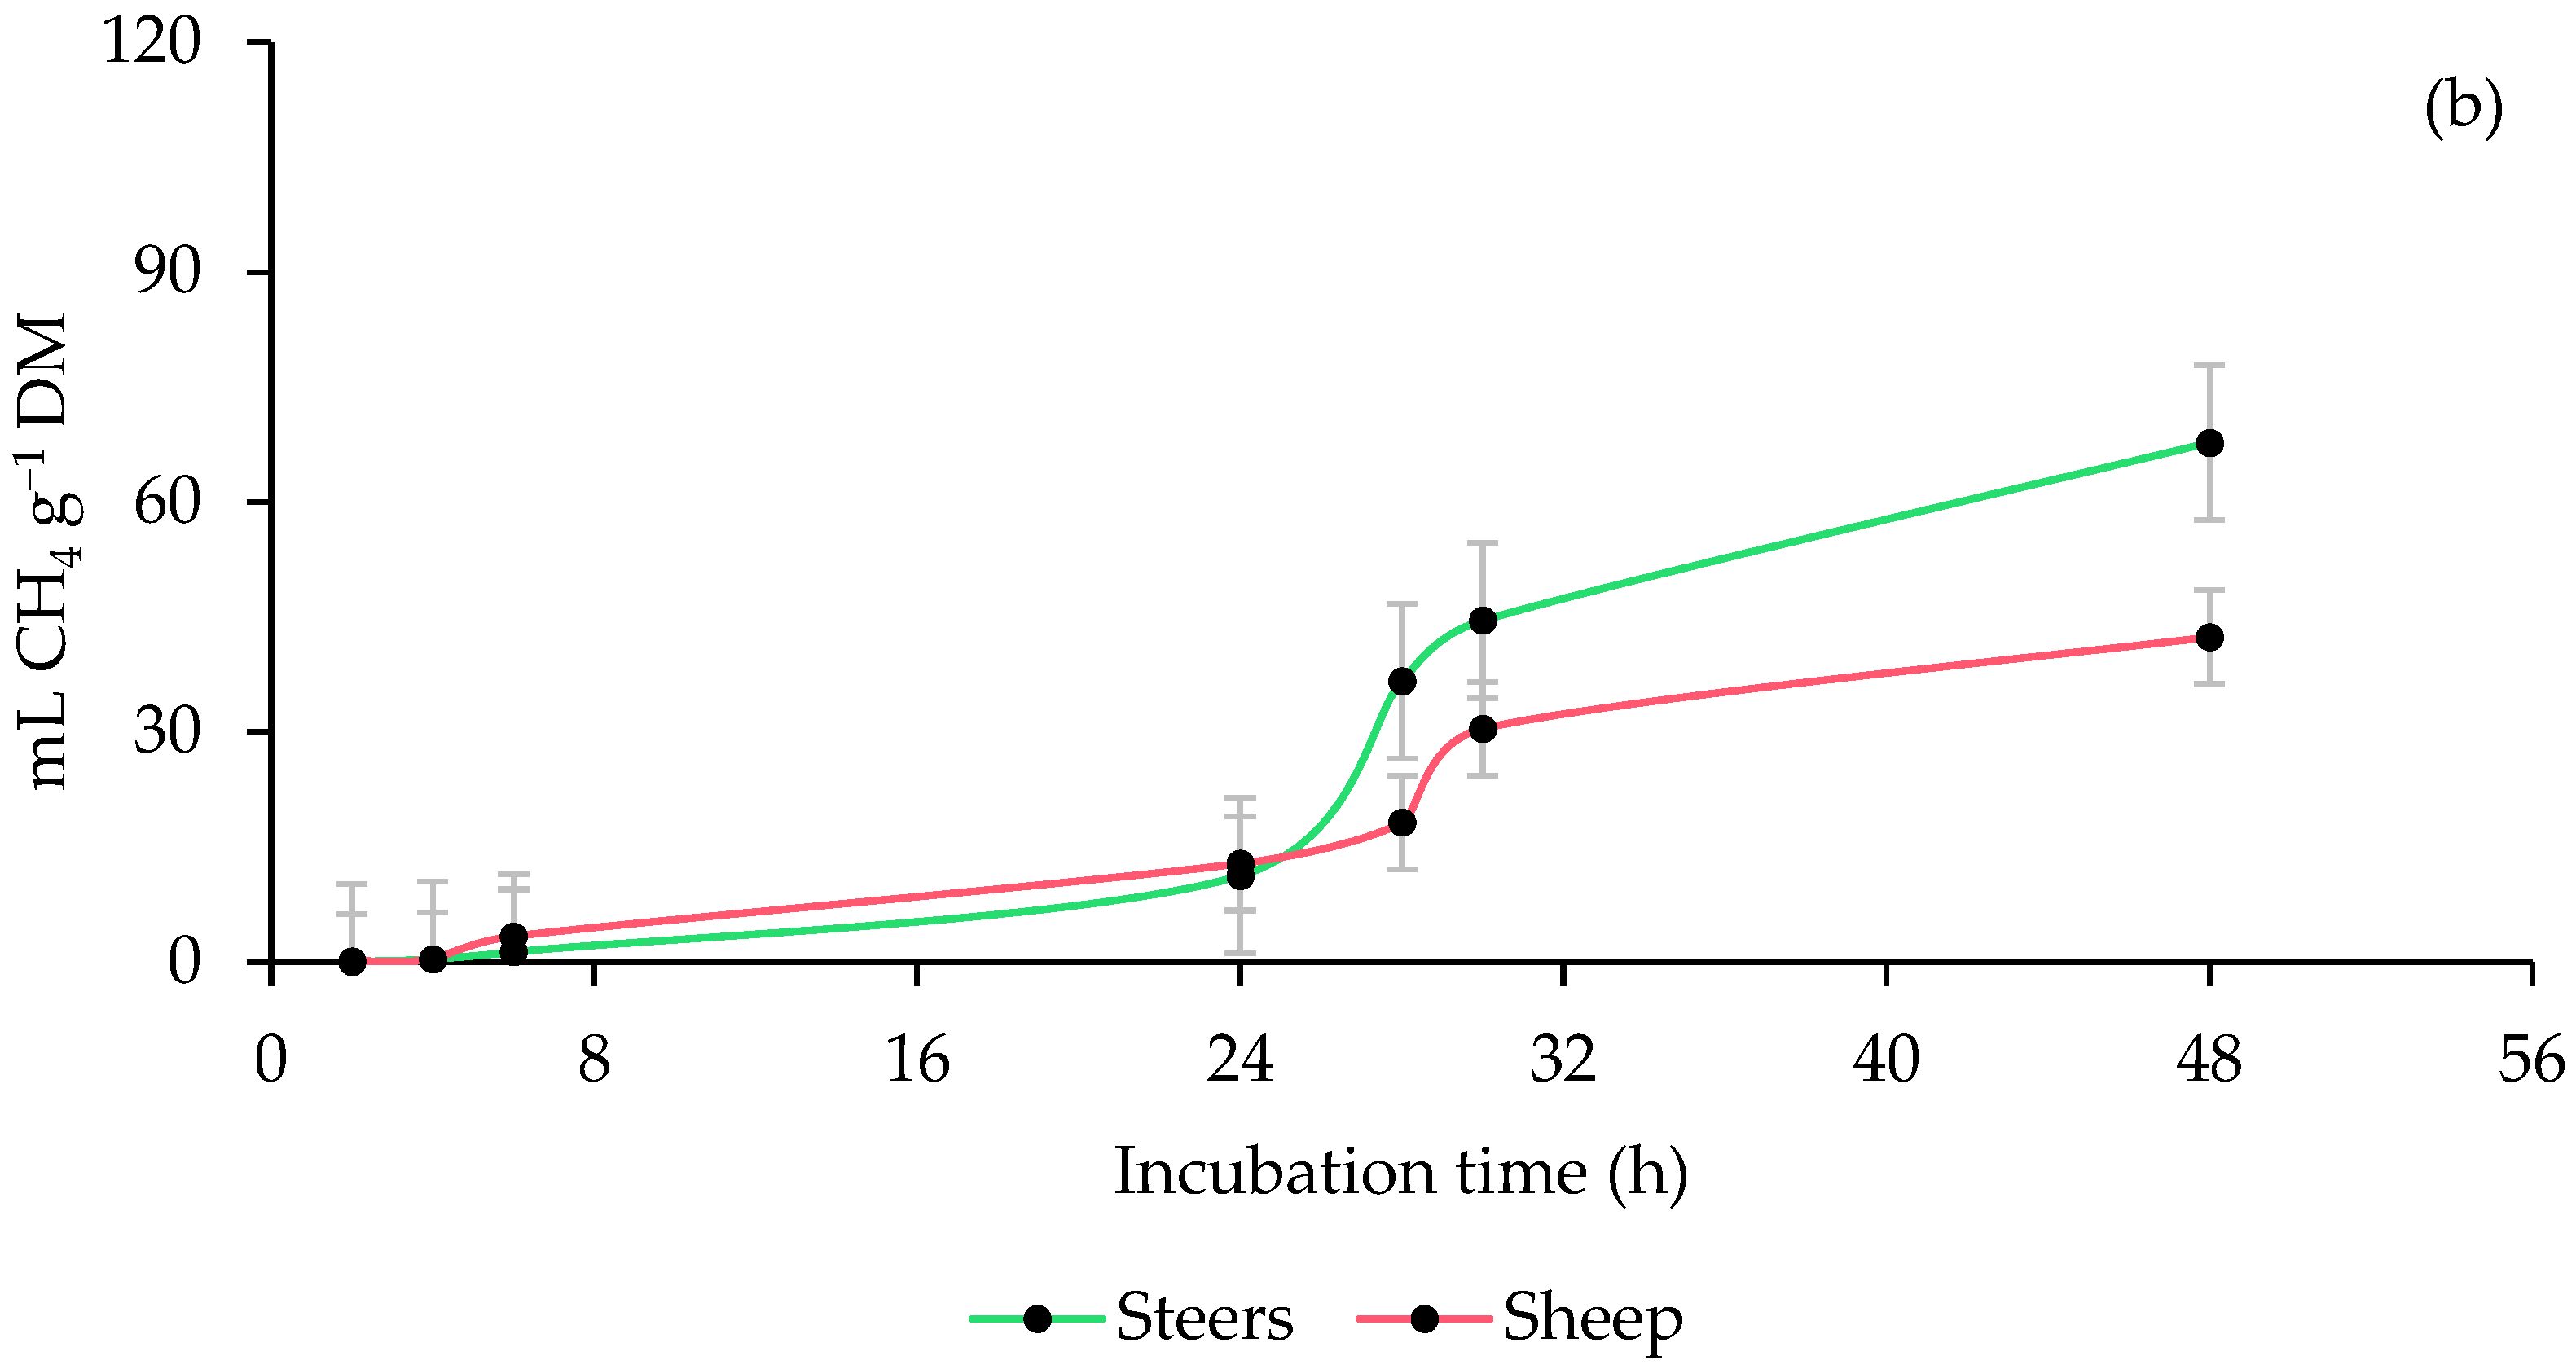
3.2. Ruminal Methane (CH4) Production
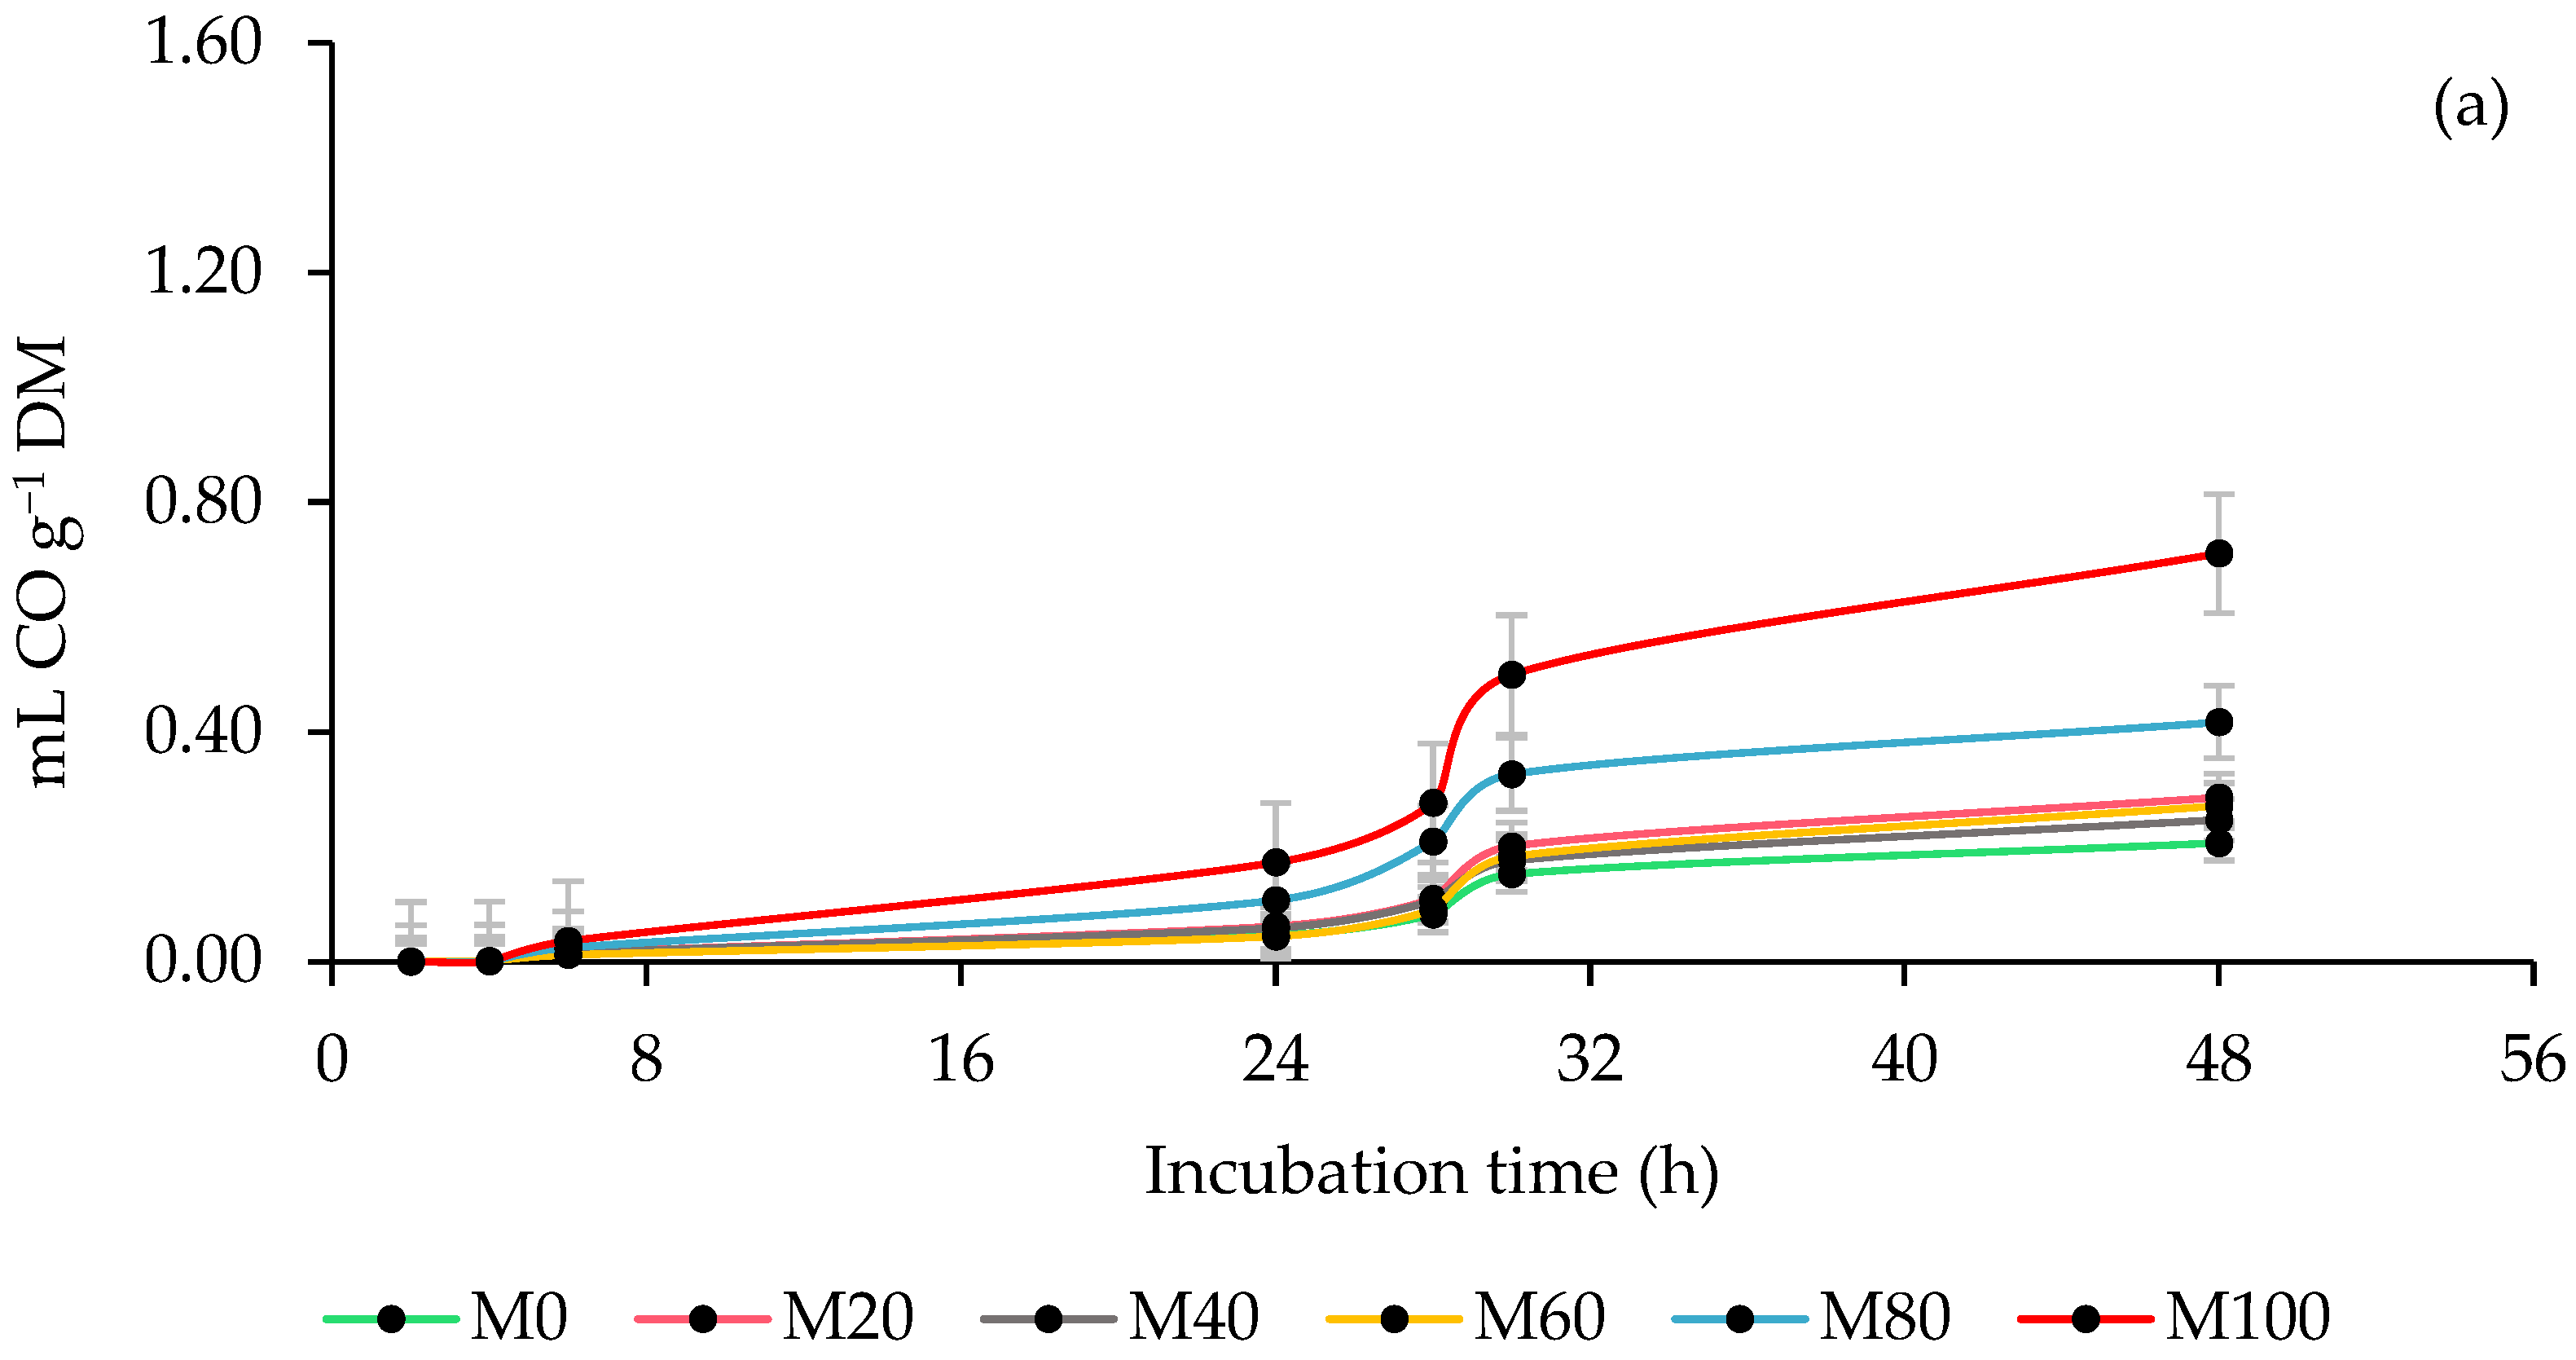
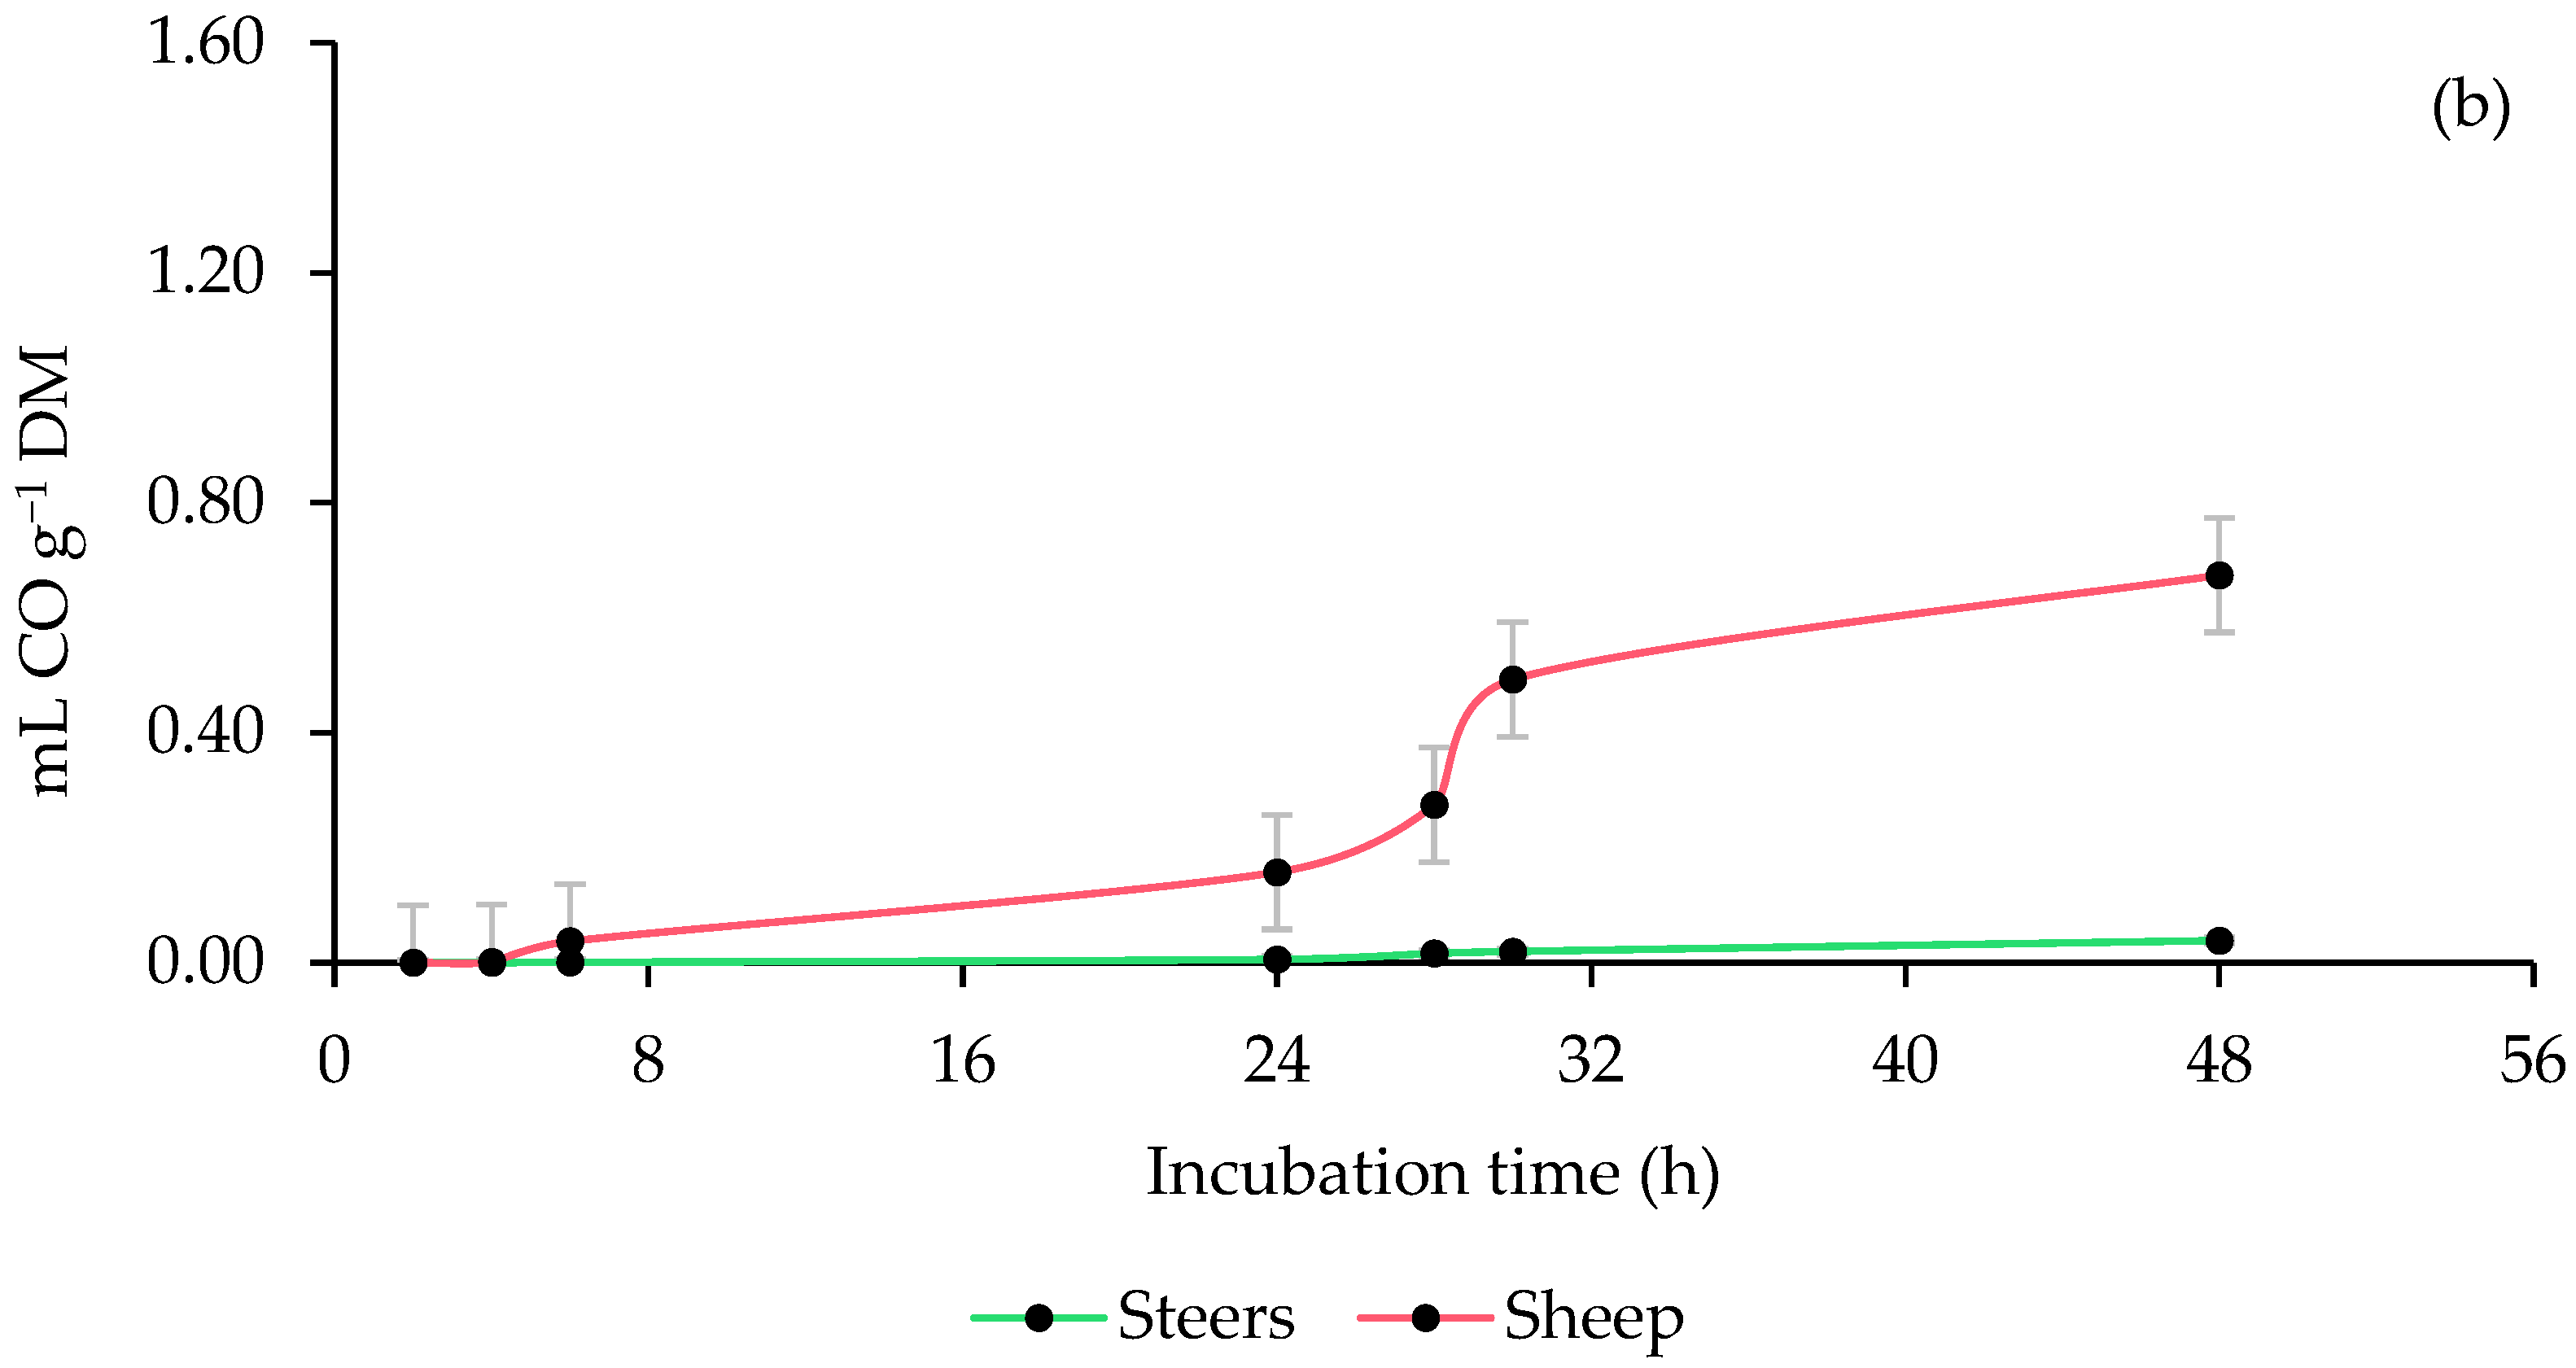
3.3. Ruminal Carbon Monoxide (CO) Production
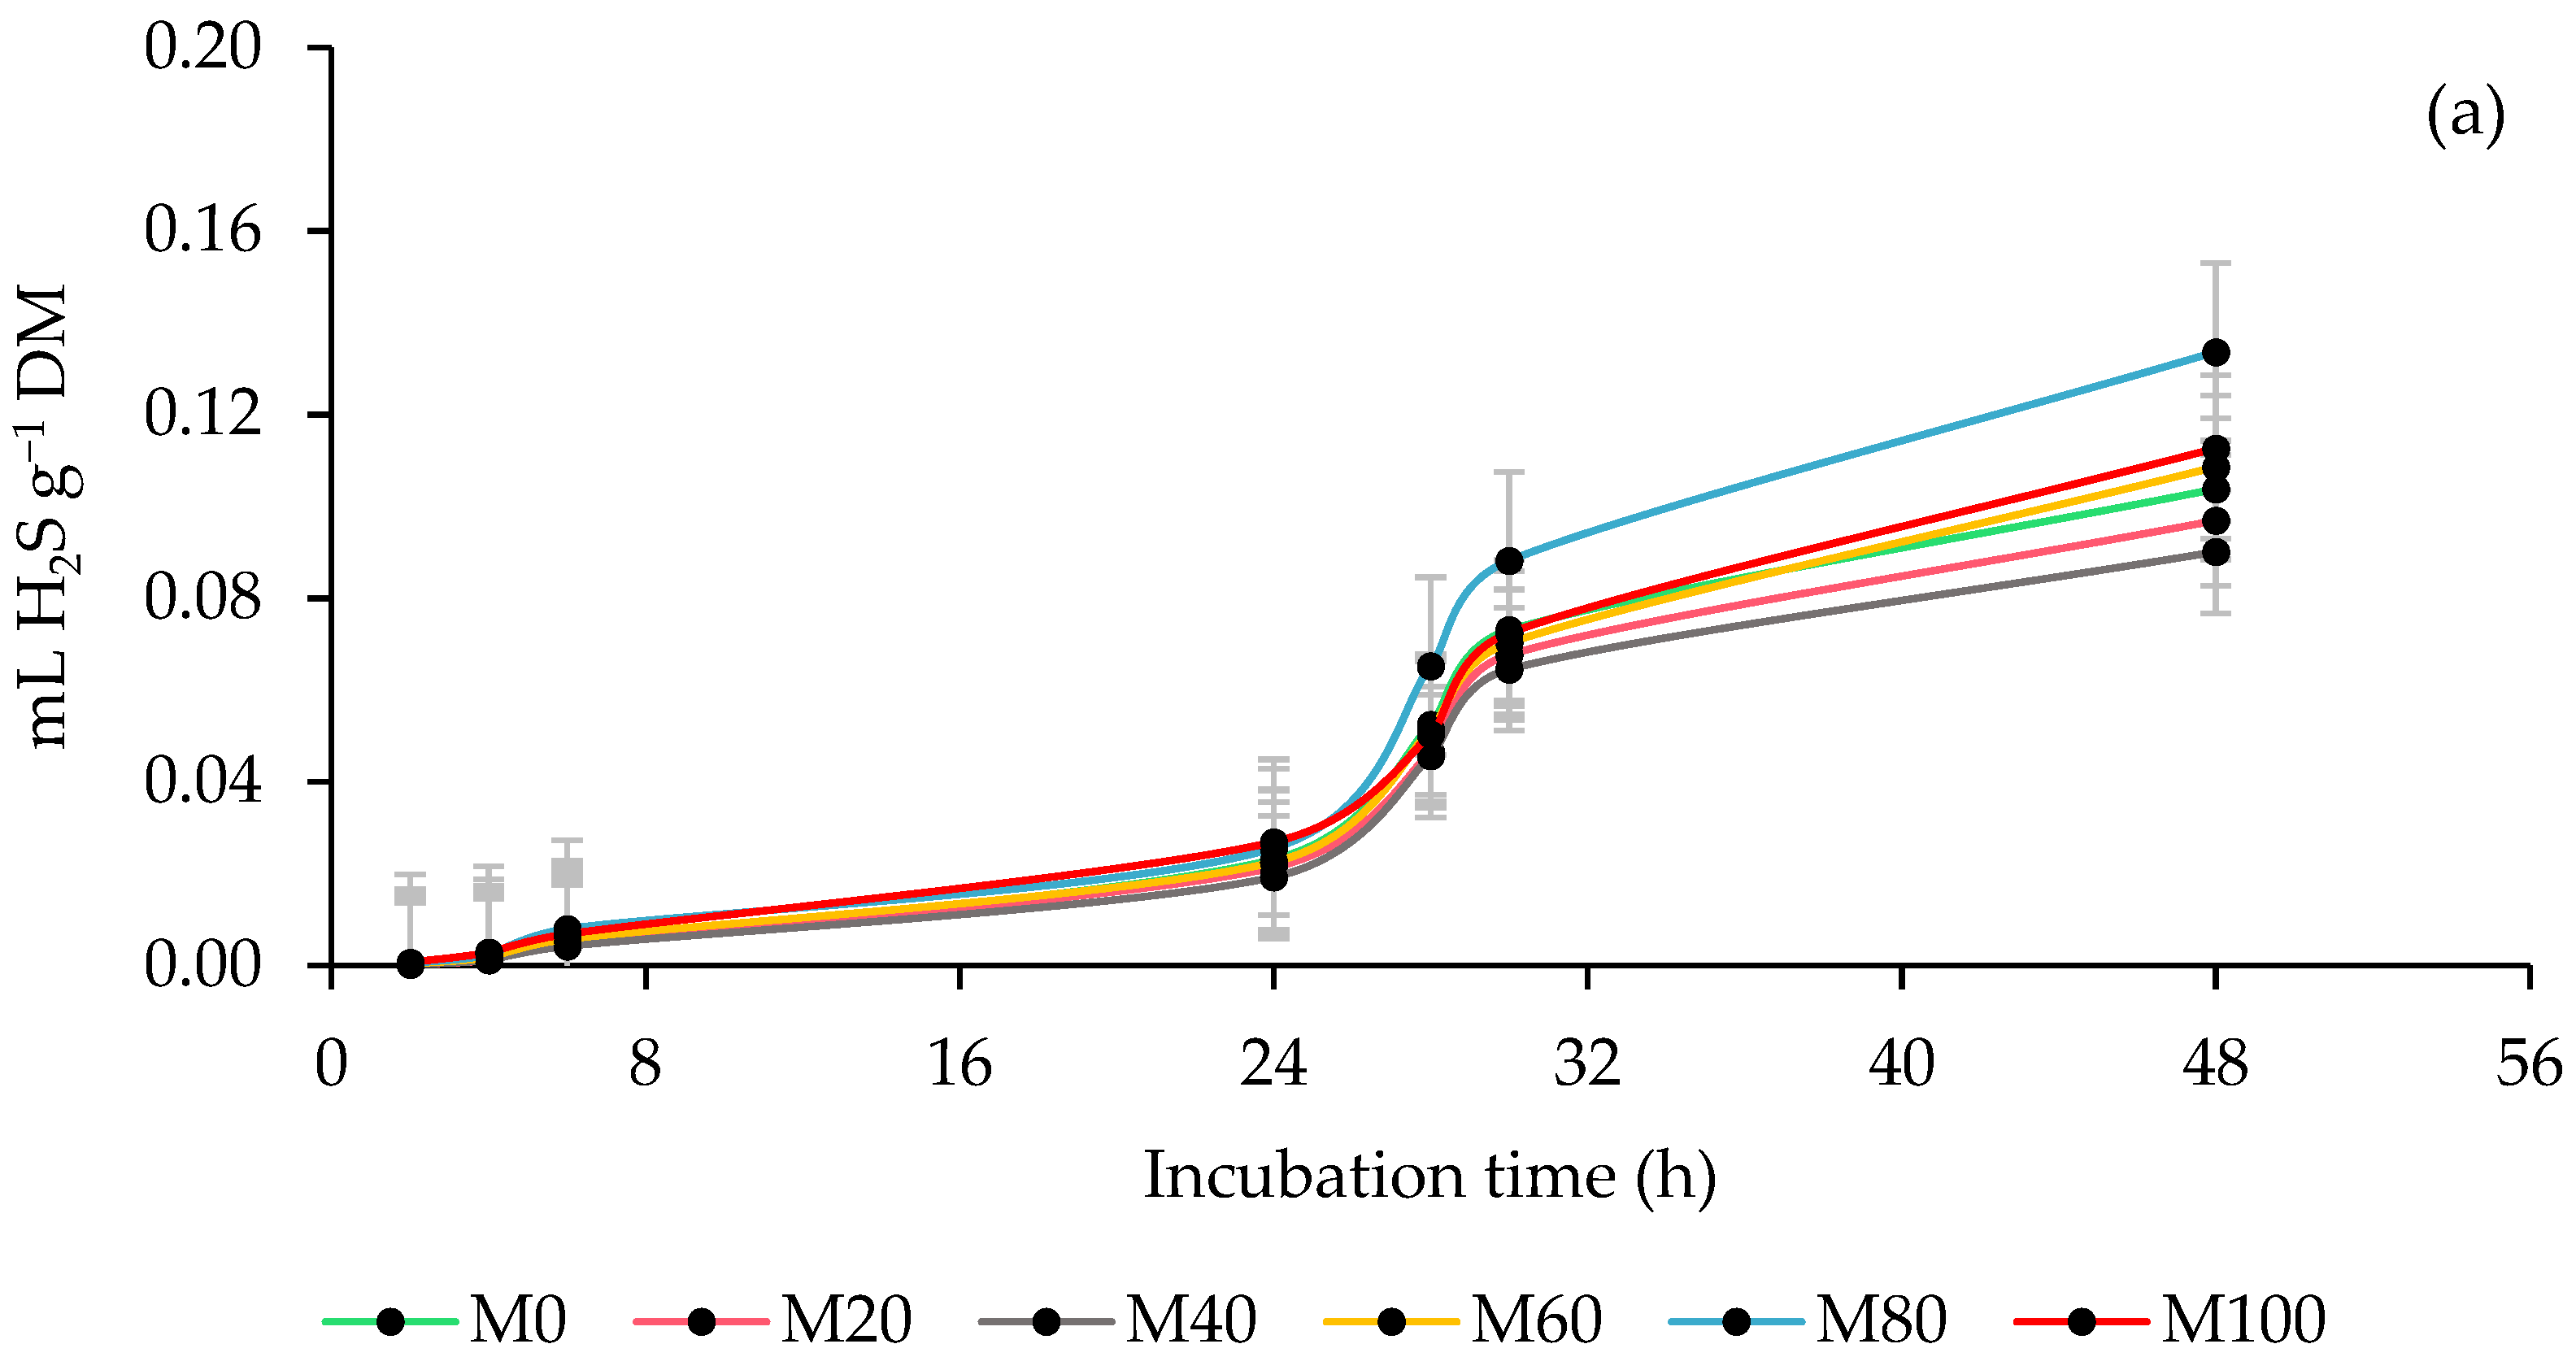
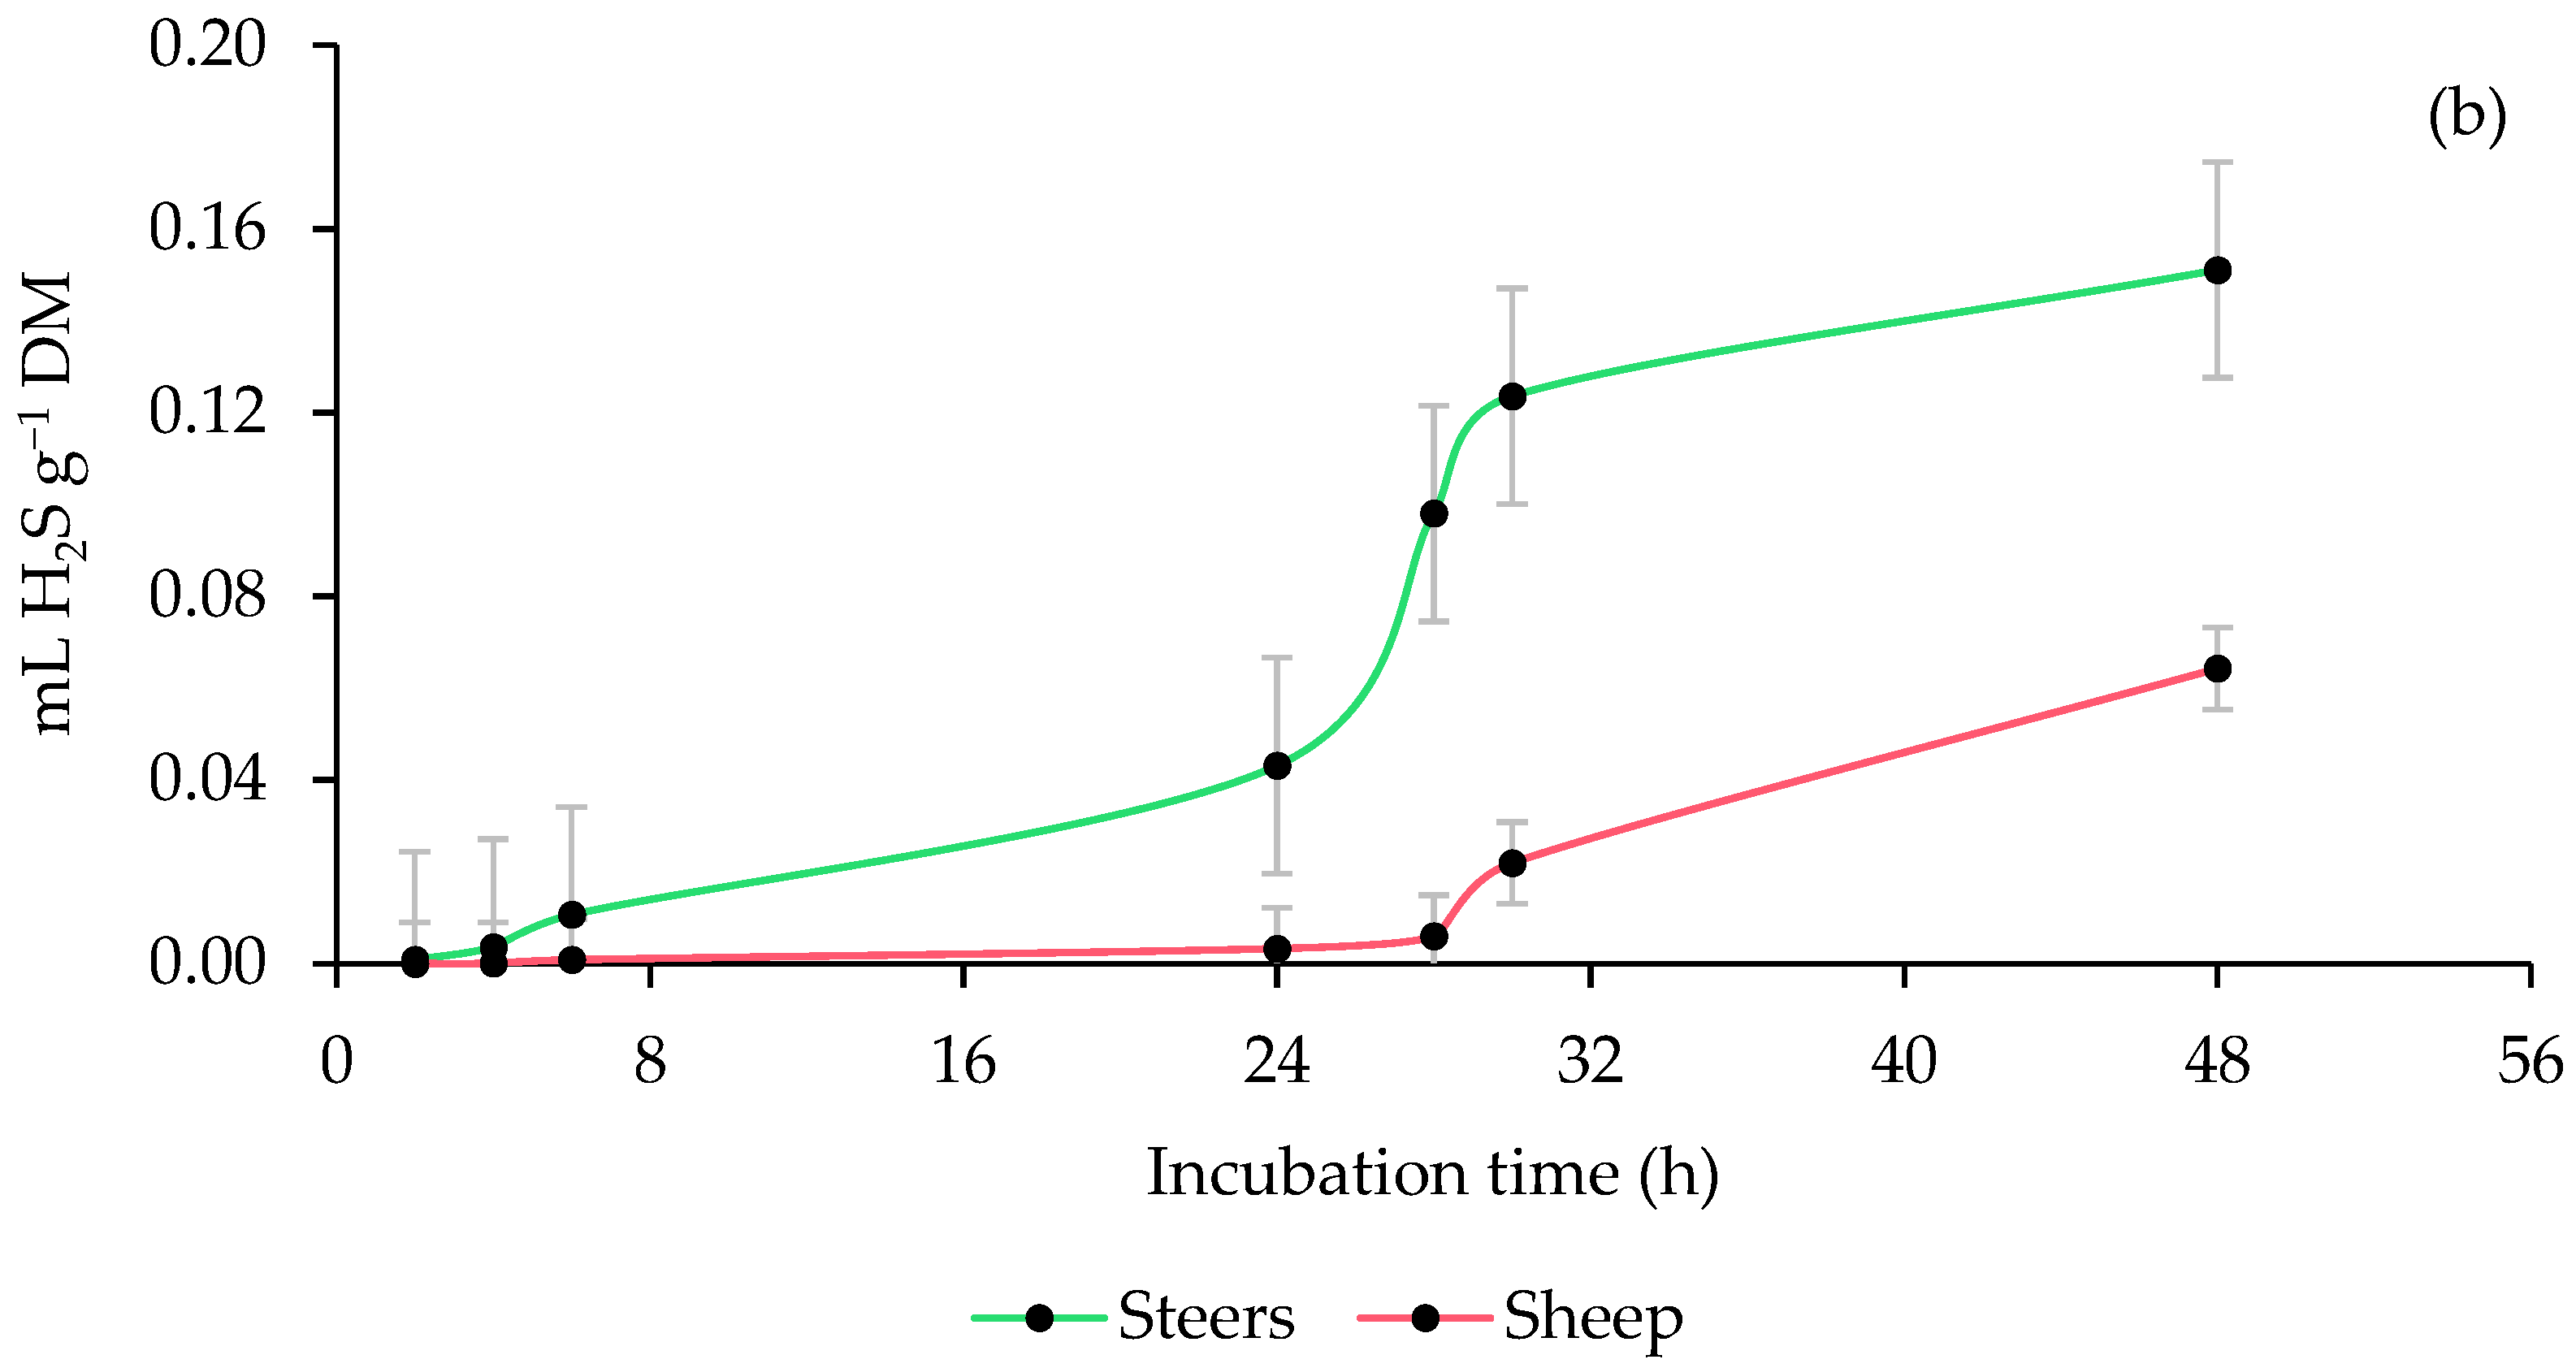
3.4. Ruminal Hydrogen Sulfide (H2S) Production
3.5. Ruminal Fermentation Characteristics and CH4 Conversion Efficiency
4. Discussion
4.1. Ruminal Biogas Production
4.2. Ruminal Methane (CH4) Production
4.3. Ruminal Carbon Monoxide (CO) Production
4.4. Ruminal Hydrogen Sulfide (H2S) Production
4.5. Ruminal Fermentation Characteristics and CH4 Conversion Efficiency
5. Conclusions
Author Contributions
Funding
Institutional Review Board Statement
Informed Consent Statement
Data Availability Statement
Acknowledgments
Conflicts of Interest
References
- Steinfeld, H.; Gerber, P. Livestock production and the global environment: Consume less or produce better? Proc. Natl. Acad. Sci. USA 2010, 107, 18237–18238. [Google Scholar] [CrossRef] [PubMed] [Green Version]
- Ryckebosch, E.; Drouillon, M.; Vervaeren, H. Techniques for transformation of biogas to biomethane. Biomass Bioenergy 2011, 35, 1633–1645. [Google Scholar] [CrossRef]
- Besharati, M.; Maggiolino, A.; Palangi, V.; Kaya, A.; Jabbar, M.; Eseceli, H.; De Palo, P.; Lorenzo, J.M. Tannin in Ruminant Nutrition. Molecules 2022, 27, 8273. [Google Scholar] [CrossRef] [PubMed]
- Morgavi, D.P.; Forano, E.; Martin, C.; Newbold, C.J. Microbial ecosystem and methanogenesis in ruminants. Animal 2010, 4, 1024–1036. [Google Scholar] [CrossRef] [PubMed] [Green Version]
- Mizrahi, I.; Wallace, R.J.; Moraïs, S. The rumen microbiome: Balancing food security and environmental impacts. Nat. Rev. Microbiol. 2021, 19, 553–566. [Google Scholar] [CrossRef]
- Hristov, A.N.; Oh, J.; Firkins, J.L.; Dijkstra, J.; Kebreab, E.; Waghorn, G.; Makkar, H.P.S.; Adesogan, A.T.; Yang, W.; Lee, C.; et al. Special topics-Mitigation of methane and nitrous oxide emissions from animal operations: I. A review of enteric methane mitigation options. J. Anim. Sci. 2013, 91, 5045–5069. [Google Scholar] [CrossRef] [Green Version]
- Faniyi, T.O.; Prates, E.R.; Adegbeye, M.J.; Adewumi, M.K.; Elghandour, M.M.M.Y.; Salem, A.Z.M.; Ritt, L.A.; Sánchez, Z.A.; Stella, L.; Ticiani, E.; et al. Prediction of biogas and pressure from rumen fermentation using plant extracts to enhance biodigestibility and mitigate biogases. Environ. Sci. Pollut. Res. 2019, 26, 27043–27051. [Google Scholar] [CrossRef]
- Dall-Orsoletta, A.C.; Oziemblowski, M.M.; Berndt, A.; Ribeiro-Filho, H.M.N. Enteric methane emission from grazing dairy cows receiving corn silage or ground corn supplementation. Anim. Feed Sci. Technol. 2019, 253, 65–73. [Google Scholar] [CrossRef]
- Offner, A.; Bach, A.; Sauvant, D. Quantitative review of in situ starch degradation in the rumen. Anim. Feed Sci. Technol. 2003, 106, 81–93. [Google Scholar] [CrossRef]
- Castro-Montoya, J.; Witzig, M.; Rahman, M.; Westreicher-Kristen, E.; Dickhoefer, U. In vitro rumen fermentation, microbial protein synthesis and composition of microbial community of total mixed rations replacing maize silage with red clover silage. J. Anim. Physiol. Anim. Nutr. 2018, 102, 1450–1463. [Google Scholar] [CrossRef]
- Copani, G.; Niderkorn, V.; Anglard, F.; Quereuil, A.; Ginane, C. Silages containing bioactive forage legumes: A promising protein-rich feed source for growing lambs. Grass Forage Sci. 2016, 71, 622–631. [Google Scholar] [CrossRef]
- Jahanzad, E.; Sadeghpour, A.; Hashemi, M.; Keshavarz-Afshar, R.; Hosseini, M.B.; Barker, A.V. Silage fermentation profile, chemical composition and economic evaluation of millet and soya bean grown in monocultures and as intercrops. Grass Forage Sci. 2016, 71, 584–594. [Google Scholar] [CrossRef]
- Zeng, T.; Wu, Y.; Xin, Y.; Chen, C.; Du, Z.; Li, X.; Zhong, J.; Thair, M.; Kang, B.; Jiang, D.; et al. Silage quality and output of different maize-soybean strip intercropping patterns. Fermentation 2022, 8, 174. [Google Scholar] [CrossRef]
- García, D.E.; Medina, M.G.; Domínguez, C.; Baldizán, A.; Humbría, J.; Cova, L. Evaluación química de especies no leguminosas con potencial forrajero en el estado de Trujillo, Venezuela. Zootec. Trop. 2006, 24, 401–415. [Google Scholar]
- Ramachandran, C.; Peter, K.V.; Gopalakrishman, P.K. Drumstick (Moringa oleifera): A multiporpose Indian vegetable. Econ. Bot. 1980, 34, 276–283. [Google Scholar] [CrossRef]
- Olson, M.E.; Fahey, J.W. Moringa oleifera: Un árbol multiusos para las zonas tropicales secas. Rev. Mex. Biodivers. 2011, 82, 1071–1082. [Google Scholar] [CrossRef] [Green Version]
- Nouman, W.; Basra, S.M.A.; Siddiqui, M.T.; Yasmeen, A.; Gull, T.; Alcayde, M.A.C. Potential of Moringa oleifera L. as livestock fodder crop: A review. Turk. J. Agric. For. 2014, 38, 1–14. [Google Scholar] [CrossRef]
- Cohen-Zinder, M.; Leibovich, H.; Vaknin, Y.; Sagi, G.; Shabtay, A.; Ben-Meir, Y.; Nikbacht, M.; Portnik, Y.; Yishay, M.; Miron, J. Effect of feedeing lactating cows with ensiled mixtures of Moringa oleifera, wheat hay and molasses, on digestibility and efficiency of milk production. Anim. Feed Sci. Technol. 2016, 211, 75–83. [Google Scholar] [CrossRef]
- Zheng, Y.; Zhang, Y.; Wu, J. Yield and quality of Moringa oleifera under different planting densities and cutting heights in southwest China. Ind. Crops Prod. 2016, 91, 88–96. [Google Scholar] [CrossRef]
- Quintanilla-Medina, J.J.; López-Aguirre, D.; Joaquín-Cancino, S.; Vázquez-Armijo, J.F.; López-Villalobos, N.; Limas-Martínez, A.G.; Estrada-Drouaillet, B.; Martínez-González, J.C.; Hernández-Meléndez, J. Moringa oleifera Lam. leaf meal as a protein supplement for small ruminants in tropical conditions: Nutrient content at different harvest dates during the year. Agroforest. Syst. 2020, 94, 1301–1306. [Google Scholar] [CrossRef]
- Moyo, B.; Masika, P.J.; Hugo, A.; Muchenje, V. Nutritional characterization of moringa (Moringa oleifera Lam.) leaves. Afr. J. Biotechnol. 2011, 10, 12925–12933. [Google Scholar] [CrossRef] [Green Version]
- Cabrera-Carrión, J.L.; Jaramillo-Jaramillo, C.; Dután-Torres, F.; Cun-Carrión, J.; García, P.A.; Rojas, A.L. Variación del contenido de alcaloides, fenoles, flavonoides y taninos en Moringa oleifera Lam. en función de su edad y altura. Bioagro 2017, 29, 53–60. [Google Scholar]
- Parra-Garcia, A.; Elghandour, M.M.M.Y.; Greiner, R.; Barbabosa-Pliego, A.; Camacho-Diaz, L.M.; Salem, A.Z.M. Effects of Moringa oleifera leaf extract on ruminal methane and carbon dioxide production and fermentation kinetics in a steer model. Environ. Sci. Pollut. Res. 2019, 26, 15333–15344. [Google Scholar] [CrossRef] [PubMed]
- Elghandour, M.M.M.Y.; Vallejo, L.H.; Salem, A.Z.M.; Mellado, M.; Camacho, L.M.; Cipriano, M.; Olafadehan, O.A.; Olivares, J.; Rojas, S. Moringa oleifera leaf meal as an environmental friendly protein source for ruminants: Biomethane and carbon dioxide production, and fermentation characteristics. J. Clean. Prod. 2017, 165, 1229–1238. [Google Scholar] [CrossRef]
- Kholif, A.E.; Olafadehan, O.A. Essential oils and phytogenic feed additives in ruminant diet: Chemistry, ruminal microbiota and fermentation, feed utilization and productive performance. Phytochem. Rev. 2021, 20, 1087–1108. [Google Scholar] [CrossRef]
- Morsy, T.A.; Gouda, G.A.; Kholif, A.E. In vitro fermentation and production of methane and carbon dioxide from rations containing Moringa oleifera leave silage as a replacement of soybean meal: In vitro assessment. Environ. Sci. Pollut. Res. 2022, 29, 69743–69752. [Google Scholar] [CrossRef]
- Babiker, E.E.; Juhaimi, F.A.; Ghafoor, K.; Abdoun, K.A. Comparative study on feeding value of Moringa leaves as a partial replacement for alfalfa hay in ewes and goats. Livest. Sci. 2017, 195, 21–26. [Google Scholar] [CrossRef]
- Kholif, A.E.; Gouda, G.A.; Olafadehan, O.A.; Abdo, M.M. Effects of replacement of Moringa oleifera for berseem clover in the diets of Nubian goats on feed utilisation, and milk yield, composition and fatty acid profile. Animal 2018, 12, 964–972. [Google Scholar] [CrossRef]
- Kewan, K.Z.; Salem, F.A.; Salem, A.Z.M.; Abdou, A.R.; El-Sayed, H.M.; Eisa, S.S.; Zaki, E.A.; Odongo, N.E. Nutritive utilization of Moringa oleifera tree stalks treated with fungi and yeast to replace clover hay in growing lambs. Agroforest. Syst. 2019, 93, 161–173. [Google Scholar] [CrossRef]
- Mueller-Harvey, I.; Bee, G.; Dohme-Meier, F.; Hoste, H.; Karonen, M.; Kölliker, R.; Waghorn, G.C. Benefits of condensed tannins in forage legumes fed to ruminants: Importance of structure, concentration, and diet composition. Crop Sci. 2019, 59, 861–885. [Google Scholar] [CrossRef] [Green Version]
- Theodorou, M.K.; Williams, B.A.; Dhanoa, M.S.; McAllan, A.B.; France, J. A simple gas production method using a pressure transducer to determine the fermentation kinetics of ruminant feeds. Anim. Feed Sci. Technol. 1994, 48, 185–197. [Google Scholar] [CrossRef]
- Tavendale, M.H.; Meagher, L.P.; Pacheco, D.; Walker, N.; Attwood, G.T.; Sivakumaran, S. Methane production from in vitro rumen incubations with Lotus pedunculatus and Medicago sativa, and effects of extractable condensed tannin fractions on methanogenesis. Anim. Feed Sci. Technol. 2005, 123, 403–419. [Google Scholar] [CrossRef]
- Lovett, D.K.; McGilloway, D.; Bortolozzo, A.; Hawkins, M.; Callan, J.; Flynn, B.; O’Mara, F.P. In vitro fermentation patterns and methane production as influenced by cultivar and season of harvest of Lolium perenne L. Grass Forage Sci. 2006, 61, 9–21. [Google Scholar] [CrossRef]
- Hatew, B.; Cone, J.W.; Pellikaan, W.F.; Podesta, S.C.; Bannink, A.; Hendriks, W.H.; Dijkstra, J. Relationship between in vitro and in vivo methane production measured simultaneously with different dietary starch sources and starch levels in dairy cattle. Anim. Feed Sci. Technol. 2015, 202, 20–31. [Google Scholar] [CrossRef]
- Elghandour, M.M.M.Y.; Kholif, A.E.; Marquez-Molina, O.; Vazquez-Armijo, J.F.; Puniya, A.K.; Salem, A.Z.M. Influence of individual or mixed cellulase and xylanase mixture on in vitro rumen gas production kinetics of total mixed rations with different maize silage and concentrate ratios. Turk. J. Vet. Anim. Sci. 2015, 39, 435–442. [Google Scholar] [CrossRef]
- Vallejo-Hernández, L.H.; Elghandour, M.M.M.Y.; Greiner, R.; Anele, U.Y.; Rivas-Cáceres, R.R.; Barros-Rodríguez, M.; Salem, A.Z.M. Environmental impact of yeast and exogenous xylanase on mitigating carbon dioxide and enteric methane production in ruminants. J. Clean. Prod. 2018, 189, 40–46. [Google Scholar] [CrossRef]
- Salem, A.Z.M. Impact of season of harvest on in vitro gas production and dry matter degradability of Acacia saligna leaves with inoculum from three ruminant species. Anim. Feed Sci. Technol. 2005, 123, 67–79. [Google Scholar] [CrossRef]
- Vinhas, I.L.C.; Ítavo, C.C.B.F.; Valle, C.B.D.; Dias, A.M.; Difante, G.D.S.; Morais, M.D.G.; Soares, C.M.; Da Silva, P.C.; Oliveira, R.L. Brachiaria grasses in vitro digestibility with bovine and ovine ruminal liquid as inoculum. Rev. Mex. Cienc. Pecu. 2021, 12, 1045–1060. [Google Scholar] [CrossRef]
- Vargas, V.; Hernández, M.E.; Gutiérrez, L.J.; Plácido, J.M.; Jiménez, C.A. Clasificación climática del Estado de Tamaulipas, México. Ciencia UAT 2007, 2, 15–19. [Google Scholar]
- Maggiolino, A.; Lorenzo, J.M.; Quiñones, J.; Latorre, M.A.; Blando, F.; Centoducati, G.; Dahl, G.E.; De Palo, P. Effects of dietary supplementation with Pinus taeda hydrolyzed lignin on in vivo performances, in vitro nutrient apparent digestibility, and gas emission in beef steers. Anim. Feed. Sci. Technol. 2019, 255, 114217. [Google Scholar] [CrossRef]
- Besharati, M.; Palangi, V.; Salem, A.Z.M.; De Palo, P.; Lorenzo, J.M.; Maggiolino, A. Substitution of raw lucerne with raw citrus lemon by-product in silage: In vitro apparent digestibility and gas production. Front. Vet. Sci. 2022, 9, 1672. [Google Scholar] [CrossRef] [PubMed]
- Padmore, J.M. Animal feed. In Official Methods of Analysis of the Association of Official Analytical Chemists; Helrick, K., Ed.; AOAC: Arlington, VA, USA, 1990; pp. 69–90. [Google Scholar]
- Van Soest, P.V.; Robertson, J.B.; Lewis, B.A. Methods for dietary fiber, neutral detergent fiber, and non-starch polysaccharides in relation to animal nutrition. J. Dairy Sci. 1991, 74, 3583–3597. [Google Scholar] [CrossRef] [PubMed]
- Faichney, J.G.; White, G.A. Methods for the Analysis of Feeds Eaten by Ruminants; Division of Animal Production, Ian Clunies Ross Animal Research Laboratory and Commonwealth Scientific and Industrial Research Organization: Melbourne, VIC, Australia, 1983. [Google Scholar]
- Mertens, D.R. Creating a system for meeting the fiber requirements of dairy cows. J. Dairy Sci. 1997, 80, 1463–1481. [Google Scholar] [CrossRef] [PubMed]
- Sniffen, C.J.; O’connor, J.D.; Van Soest, P.J.; Fox, D.G.; Russell, J.B. A net carbohydrate and protein system for evaluating cattle diets: II. Carbohydrate and protein availability. J. Anim. Sci. 1992, 70, 3562–3577. [Google Scholar] [CrossRef] [PubMed] [Green Version]
- Wilson, R.F.; Wilkins, R.J. The ensilage of autumn-sown rye. Grass Forage Sci. 1972, 27, 35–42. [Google Scholar] [CrossRef]
- Goering, M.K.; Van Soest, P.J. Forage Fibre Analysis (Apparatus, Reagents, Procedures and Some Applications); Agricultural Research Service USDA: Washington, DC, USA, 1970; pp. 1–24.
- De Bellis, P.; Maggiolino, A.; Albano, C.; De Palo, P.; Blando, F. Ensiling grape pomace with and without addition of a Lactiplantibacillus plantarum Strain: Effect on polyphenols and microbiological characteristics, in vitro nutrient apparent digestibility, and gas emission. Front. Vet. Sci. 2022, 9, 808293. [Google Scholar] [CrossRef]
- Acosta, J.A.D.; Elghandour, M.M.; Mariezcurrena-Berasain, M.D.; Adegbeye, M.J.; Fajemisin, A.N.; Pliego, A.B.; Salem, A.Z. Effect of mid-term dietary administration of the Caesalpinia coriaria extract on the sustainable mitigation of equine fecal methane, carbon monoxide and hydrogen sulfide production. J. Equine Vet. Sci. 2022, 115, 10402. [Google Scholar] [CrossRef]
- Tagliapietra, F.; Cattani, M.; Bailoni, L.; Schiavon, S. In vitro rumen fermentation: Effect of headspace pressure on the gas production kinetics of corn meal and meadow hay. Anim. Feed. Sci. Tech. 2010, 158, 197–201. [Google Scholar] [CrossRef]
- SAS. User’s Guide: Statistics; Version 9.0; SAS Institute: Cary, NC, USA, 2002. [Google Scholar]
- France, J.; Dijkstra, J.; Dhanoa, M.S.; Lopez, S.; Bannink, A. Estimating the extent of degradation of ruminant feeds from a description of their gas production profiles observed in vitro: Derivation of models and other mathematical considerations. Br. J. Nutr. 2000, 83, 143–150. [Google Scholar] [CrossRef] [Green Version]
- Menke, K.H.; Raab, L.; Salewski, A.; Steingass, H.; Fritz, D.; Schneider, W. The estimation of the digestibility and metabolizable energy content of ruminant feeding stuffs from the gas production when they are incubated with rumen liquor in vitro. J. Agric. Sci. 1979, 93, 217–222. [Google Scholar] [CrossRef] [Green Version]
- Getachew, G.; Makkar, H.P.S.; Becker, K. Tropical browses: Contents of phenolic compounds, in vitro gas production and stoichiometric relationship between short chain fatty acid and in vitro gas production. J. Agric. Sci. 2002, 139, 341–352. [Google Scholar] [CrossRef]
- Mould, F.L.; Kliem, K.E.; Morgan, R.; Mauricio, R.M. In vitro microbial inoculum: A review of its function and properties. Anim. Feed Sci. Technol. 2005, 123, 31–50. [Google Scholar] [CrossRef]
- Calabrò, S.; Williams, B.A.; Piccolo, V.; Infascelli, F.; Tamminga, S. A comparison between buffalo (Bubalus bubalis) and cow (Bos taurus) rumen fluids in terms of the in vitro fermentation characteristics of three fibrous feedstuffs. J. Sci. Food Agric. 2004, 84, 645–652. [Google Scholar] [CrossRef]
- Aderinboye, R.Y.; Akinlolu, A.O.; Adeleke, M.A.; Najeem, G.O.; Ojo, V.O.A.; Isah, O.A.; Babayemi, O.J. In vitro gas production and dry matter degradation of four browse leaves using cattle, sheep and goat inocula. Slovak J. Anim. Sci. 2016, 49, 32–43. [Google Scholar]
- Wang, K.; Xiong, B.; Zhao, X. Could propionate formation be used to reduce enteric methane emission in ruminants? Sci. Total Environ. 2022, 855, 158867. [Google Scholar] [CrossRef]
- Deutschmann, K.; Phatsara, C.; Sorachakula, C.; Vearasilp, T.; Hunphiphat, W.; Cherdthong, A.; Gerlach, K.; Südekum, K.H. In vitro gas production and in vivo nutrient digestibility and growth performance of Thai indigenous cattle fed fresh and conserved pangola grass. Ital. J. Anim. Sci. 2017, 16, 521–529. [Google Scholar] [CrossRef] [Green Version]
- Mills, J.A.N.; Dijkstra, J.; Bannink, A.; Cammell, S.B.; Kebreab, E.; France, J. A mechanistic model of whole-tract digestion and methanogenesis in the lactating dairy cow: Model development, evaluation, and application. J. Anim. Sci. 2001, 79, 1584–1597. [Google Scholar] [CrossRef] [Green Version]
- Bannink, A.; France, J.; Lopez, S.; Gerrits, W.J.J.; Kebreab, E.; Tamminga, S.; Dijkstra, J. Modelling the implications of feeding strategy on rumen fermentation and functioning of the rumen wall. Anim. Feed Sci. Technol. 2008, 143, 3–26. [Google Scholar] [CrossRef]
- Kim, K.S.; Anderson, J.D.; Newell, M.A.; Grogan, S.M.; Byrne, P.F.; Baenziger, P.S.; Butler, T.J. Genetic diversity of great plains hard winter wheat germplasm for forage. Crop Sci. 2016, 56, 2297–2305. [Google Scholar] [CrossRef] [Green Version]
- Qian, K.; Xu, J.; Zu, H.C.; Cong, Y.Y. Research progress of rumen hydrogen sulfide production in ruminants. Anim. Sci. J. 2020, 91, e13349. [Google Scholar] [CrossRef]
- Zhao, Y.; Zhao, G. Decreasing ruminal methane production through enhancing the sulfate reduction pathway. Anim. Nutr. 2022, 9, 320–326. [Google Scholar] [CrossRef] [PubMed]
- Haarstad, K.; Bergersen, O.; Sørheim, R. Occurrence of carbon monoxide during organic waste degradation. J. Air Waste Manag. Assoc. 2006, 56, 575–580. [Google Scholar] [CrossRef] [PubMed] [Green Version]
- Techtmann, S.M.; Colman, A.S.; Robb, F.T. ‘That which does not kill us only makes us stronger’: The role of carbon monoxide in thermophilic microbial consortia. Environ. Microbiol. 2009, 11, 1027–1037. [Google Scholar] [CrossRef] [PubMed]
- Ragsdale, S.W. Life with carbon monoxide. Crit. Rev. Biochem. Mol. Biol. 2004, 39, 165–195. [Google Scholar] [CrossRef] [PubMed]
- Shah, A.M.; Ma, J.; Wang, Z.; Hu, R.; Wang, X.; Peng, Q.; Kwame, A.F.; Goswami, N. Production of hydrogen sulfide by fermentation in rumen and its impact on health and production of animals. Processes 2020, 8, 1169. [Google Scholar] [CrossRef]
- Castro, D.J.; Cerón-Cucchi, M.E.; Ortiz-Chura, A.; Depetris, G.J.; Irazoqui, J.M.; Amadio, A.F.; Cantón, G.J. Ruminal effects of excessive dietary sulphur in feedlot cattle. J. Anim. Physiol. Anim. Nutr. 2021, 106, 978–987. [Google Scholar] [CrossRef]
- Sunvold, G.D.; Hussein, H.S.; Fahey, G.C., Jr.; Merchen, N.R.; Reinhart, G.A. In vitro fermentation of cellulose, beet pulp, citrus pulp, and citrus pectin using fecal inoculum from cats, dogs, horses, humans, and pigs and ruminal fluid from cattle. J. Anim. Sci. 1995, 73, 3639–3648. [Google Scholar] [CrossRef]
- Kolver, E.S.; De Veth, M.J. Prediction of ruminal pH from pasture-based diets. J. Dairy Sci. 2002, 85, 1255–1266. [Google Scholar] [CrossRef]
- Shen, J.; Zheng, L.; Chen, X.; Han, X.; Cao, Y.; Yao, J. Metagenomic analyses of microbial and carbohydrate-active enzymes in the rumen of dairy goats fed different rumen degradable starch. Front. Microbiol. 2020, 11, 1003. [Google Scholar] [CrossRef]
- Zicarelli, F.; Calabro, S.; Cutrignelli, M.I.; Infascelli, F.; Tudisco, R.; Bovera, F.; Piccolo, V. In vitro fermentation characteristics of diets with different forage/concentrate ratios: Comparison of rumen and faecal inocula. J. Sci. Food Agric. 2011, 91, 1213–1221. [Google Scholar] [CrossRef] [Green Version]
- Jiao, H.P.; Yan, T.; McDowell, D.A.; Carson, A.F.; Ferris, C.P.; Easson, D.L.; Wills, D. Enteric methane emissions and efficiency of use of energy in Holstein heifers and steers at age of six months. J. Anim. Sci. 2013, 91, 356–362. [Google Scholar] [CrossRef] [PubMed] [Green Version]


| Percentage of Moringa 2 | Component 3 | |||||||
|---|---|---|---|---|---|---|---|---|
| OM | CP | EE | HEM | CEL | LIG | NSC | TC | |
| M0 | 94.86 | 8.23 | 1.58 | 26.13 | 30.14 | 4.46 | 24.32 | 85.05 |
| M20 | 94.51 | 9.21 | 1.83 | 26.64 | 29.41 | 4.69 | 22.73 | 83.47 |
| M40 | 93.91 | 11.18 | 1.94 | 24.36 | 26.95 | 5.20 | 24.28 | 80.79 |
| M60 | 92.77 | 13.55 | 2.02 | 22.85 | 23.97 | 5.76 | 24.61 | 77.20 |
| M80 | 92.30 | 17.37 | 2.89 | 21.35 | 20.88 | 5.93 | 23.88 | 72.04 |
| M100 | 91.01 | 20.12 | 3.92 | 15.77 | 18.55 | 6.49 | 26.16 | 66.97 |
| Inoculum Source Ruminal (ISR) | Percentage of Moringa (PMOL) 1 | Biogas Production | ||||||||
|---|---|---|---|---|---|---|---|---|---|---|
| Parameters 2 | mL Gas g−1 DM Incubated | mL Gas g−1 DM Degraded | ||||||||
| b | c | Lag | 6 h | 24 h | 48 h | 6 h | 24 h | 48 h | ||
| Steers | M0 | 396.07 | 0.0283 | 2.17 | 125.55 | 283.41 | 390.61 | 492.08 | 1110.97 | 1530.14 |
| M20 | 319.97 | 0.0293 | 1.75 | 108.30 | 239.50 | 318.29 | 282.92 | 625.58 | 831.07 | |
| M40 | 320.87 | 0.0284 | 1.76 | 107.92 | 236.53 | 317.76 | 316.87 | 694.44 | 932.90 | |
| M60 | 374.83 | 0.0294 | 2.05 | 118.15 | 254.71 | 367.81 | 359.77 | 775.63 | 1120.00 | |
| M80 | 457.23 | 0.0282 | 2.50 | 135.64 | 276.50 | 439.74 | 452.40 | 923.99 | 1474.65 | |
| M100 | 370.57 | 0.0278 | 2.03 | 134.94 | 275.91 | 366.44 | 451.39 | 922.68 | 1225.77 | |
| SEM 3 | 27.04 | 0.0007 | 0.15 | 3.90 | 9.31 | 24.02 | 18.05 | 45.44 | 94.30 | |
| p-value | ||||||||||
| Linear | 0.0698 | 0.3631 | 0.0698 | 0.0087 | 0.0059 | 0.0547 | <0.0001 | <0.0001 | 0.0002 | |
| Quadratic | 0.7113 | 0.2733 | 0.7114 | 0.0027 | 0.2289 | 0.6909 | 0.0136 | 0.3476 | 0.7026 | |
| Sheep | M0 | 166.20 | 0.0252 | 10.30 | 69.20 | 125.32 | 163.12 | 320.59 | 580.46 | 755.36 |
| M20 | 227.40 | 0.0253 | 7.98 | 79.69 | 166.93 | 221.35 | 363.17 | 760.56 | 1008.35 | |
| M40 | 180.50 | 0.0235 | 9.71 | 66.98 | 128.13 | 174.40 | 290.67 | 556.04 | 756.98 | |
| M60 | 221.25 | 0.0238 | 7.33 | 71.21 | 149.83 | 212.62 | 288.82 | 607.46 | 862.17 | |
| M80 | 237.00 | 0.0251 | 4.80 | 64.65 | 156.08 | 226.91 | 227.27 | 548.61 | 797.80 | |
| M100 | 272.55 | 0.0267 | 2.87 | 65.29 | 181.17 | 262.48 | 204.04 | 567.07 | 821.12 | |
| SEM 3 | 11.71 | 0.0010 | 0.47 | 3.12 | 10.33 | 12.14 | 15.37 | 40.81 | 49.28 | |
| p-value | ||||||||||
| Linear | 0.0101 | 0.9155 | 0.0128 | 0.0551 | 0.0293 | 0.0146 | 0.0978 | 0.0206 | 0.0110 | |
| Quadratic | 0.0019 | 0.2557 | <0.0001 | 0.0536 | 0.0325 | 0.0032 | 0.0003 | 0.0839 | 0.3530 | |
| Pooled SEM 3 | 25.31 | 0.0008 | 0.28 | 3.90 | 10.04 | 22.73 | 18.27 | 46.49 | 89.46 | |
| p-value | ||||||||||
| ISR | <0.0001 | <0.0001 | <0.0001 | <0.0001 | <0.0001 | <0.0001 | <0.0001 | <0.0001 | <0.0001 | |
| PMOL | 0.0171 | 0.5988 | <0.0001 | 0.0399 | 0.0064 | 0.0157 | 0.0006 | 0.0049 | 0.0235 | |
| Linear | 0.7730 | 0.5103 | 0.0001 | 0.3996 | 0.9104 | 0.7614 | 0.0003 | 0.0043 | 0.0232 | |
| Quadratic | 0.0604 | 0.7539 | <0.0001 | 0.2088 | 0.0111 | 0.0523 | 0.0319 | 0.5522 | 0.9215 | |
| ISR × PMOL | 0.0571 | 0.1613 | <0.0001 | 0.0002 | 0.0128 | 0.0475 | <0.0001 | <0.0001 | 0.0006 | |
| Inoculum Source Ruminal (ISR) | Percentage of Moringa (PMOL) 1 | CH4 Production | ||||||||
|---|---|---|---|---|---|---|---|---|---|---|
| Parameters 2 | mL Gas g−1 DM Incubated | mL Gas g−1 DM Degraded | ||||||||
| b | c | Lag | 6 h | 24 h | 48 h | 6 h | 24 h | 48 h | ||
| Steers | M0 | 58.32 | 0.0826 | 10.10 | 1.23 | 9.86 | 58.45 | 4.83 | 38.36 | 226.93 |
| M20 | 61.35 | 0.0919 | 10.63 | 1.14 | 10.21 | 61.62 | 2.96 | 26.65 | 160.99 | |
| M40 | 62.59 | 0.0856 | 10.84 | 1.19 | 10.93 | 62.74 | 3.48 | 32.09 | 184.27 | |
| M60 | 76.95 | 0.0944 | 13.33 | 1.34 | 12.10 | 77.19 | 4.08 | 36.81 | 235.10 | |
| M80 | 82.98 | 0.0960 | 14.37 | 1.58 | 13.06 | 83.63 | 5.28 | 43.80 | 280.55 | |
| M100 | 62.50 | 0.0895 | 10.83 | 1.35 | 11.47 | 62.84 | 4.52 | 38.33 | 210.08 | |
| SEM 3 | 9.53 | 0.0042 | 1.65 | 0.07 | 1.13 | 9.60 | 0.25 | 4.15 | 35.24 | |
| p-value | ||||||||||
| Linear | 0.8260 | 0.1404 | 0.8261 | 0.3616 | 0.8264 | 0.8194 | 0.0002 | 0.0690 | 0.2104 | |
| Quadratic | 0.8228 | 0.6704 | 0.8229 | 0.0801 | 0.3173 | 0.8152 | 0.0661 | 0.2740 | 0.7152 | |
| Sheep | M0 | 22.68 | 0.0997 | 20.80 | 0.44 | 7.27 | 22.63 | 2.04 | 33.85 | 105.30 |
| M20 | 30.79 | 0.1051 | 20.86 | 0.50 | 11.29 | 30.50 | 2.27 | 51.37 | 138.80 | |
| M40 | 22.95 | 0.1003 | 21.08 | 0.33 | 7.46 | 22.82 | 1.45 | 32.44 | 99.16 | |
| M60 | 38.25 | 0.1205 | 21.71 | 0.36 | 11.32 | 38.02 | 1.44 | 45.93 | 153.59 | |
| M80 | 9.12 | 0.1123 | 21.07 | 0.32 | 14.17 | 43.86 | 1.14 | 49.70 | 154.42 | |
| M100 | 10.05 | 0.1057 | 22.05 | 0.33 | 25.63 | 96.49 | 1.02 | 80.45 | 303.04 | |
| SEM 3 | 4.60 | 0.0126 | 0.73 | 0.06 | 2.96 | 11.12 | 0.31 | 10.92 | 39.94 | |
| p-value | ||||||||||
| Linear | 0.2590 | 0.7701 | 0.9553 | 0.5395 | 0.3734 | 0.6347 | 0.6173 | 0.2999 | 0.5748 | |
| Quadratic | 0.0252 | 0.8390 | 0.2217 | 0.1174 | 0.0041 | 0.0022 | 0.0249 | 0.0300 | 0.0101 | |
| Pooled SEM 3 | 8.98 | 0.0076 | 1.55 | 0.07 | 1.86 | 10.49 | 0.28 | 6.85 | 38.25 | |
| p-value | ||||||||||
| ISR | <0.0001 | 0.0011 | <0.0001 | <0.0001 | 0.1585 | 0.0006 | <0.0001 | 0.0044 | 0.0189 | |
| PMOL | 0.3128 | 0.2902 | 0.6007 | 0.2638 | 0.0005 | 0.0120 | 0.0259 | 0.0144 | 0.0598 | |
| Linear | 0.5451 | 0.3473 | 0.8531 | 0.7941 | 0.2561 | 0.6070 | 0.0103 | 0.6783 | 0.6780 | |
| Quadratic | 0.3819 | 0.6829 | 0.5417 | 0.8260 | <0.0001 | 0.0009 | 0.3150 | 0.0018 | 0.0084 | |
| ISR × PMOL | 0.2280 | 0.9685 | 0.6991 | 0.0108 | 0.0021 | 0.0157 | 0.0002 | 0.0307 | 0.0876 | |
| Inoculum Source Ruminal (ISR) | Percentage of Moringa (PMOL) 1 | CH4 Production | |||||
|---|---|---|---|---|---|---|---|
| mL CH4 100 mL−1 Biogas | g CH4 kg−1 DM | ||||||
| 6 h | 24 h | 48 h | 6 h | 24 h | 48 h | ||
| Steers | M0 | 0.98 | 3.53 | 15.17 | 5.73 | 45.83 | 271.79 |
| M20 | 1.05 | 4.27 | 19.35 | 5.28 | 47.49 | 286.52 | |
| M40 | 1.10 | 4.62 | 19.68 | 5.52 | 50.80 | 291.75 | |
| M60 | 1.13 | 4.75 | 20.92 | 6.23 | 56.25 | 358.95 | |
| M80 | 1.17 | 4.72 | 18.92 | 7.36 | 60.72 | 388.88 | |
| M100 | 1.00 | 4.13 | 17.08 | 6.30 | 53.35 | 292.22 | |
| SEM 2 | 0.04 | 0.39 | 2.00 | 0.34 | 5.23 | 44.63 | |
| p-value | |||||||
| Linear | 0.3061 | 0.2046 | 0.1649 | 0.3617 | 0.8265 | 0.8194 | |
| Quadratic | 0.7629 | 0.6310 | 0.9442 | 0.0801 | 0.3173 | 0.8152 | |
| Sheep | M0 | 0.63 | 5.69 | 13.69 | 2.04 | 33.80 | 105.24 |
| M20 | 0.63 | 6.75 | 13.75 | 2.31 | 52.52 | 141.83 | |
| M40 | 0.50 | 5.88 | 13.13 | 1.56 | 34.71 | 106.10 | |
| M60 | 0.50 | 7.56 | 17.81 | 1.66 | 52.65 | 176.80 | |
| M80 | 0.50 | 9.06 | 19.31 | 1.50 | 65.88 | 203.97 | |
| M100 | 0.50 | 13.94 | 36.19 | 1.52 | 119.16 | 448.70 | |
| SEM 2 | 0.07 | 1.23 | 3.20 | 0.29 | 13.76 | 51.73 | |
| p-value | |||||||
| Linear | 1.0000 | 0.5644 | 0.9894 | 0.5396 | 0.3734 | 0.6347 | |
| Quadratic | 0.2070 | 0.0022 | 0.0012 | 0.1175 | 0.0041 | 0.0022 | |
| Pooled SEM 2 | 0.06 | 0.74 | 2.47 | 0.34 | 8.64 | 48.78 | |
| p-value | |||||||
| ISR | <0.0001 | <0.0001 | 0.7525 | <0.0001 | 0.1585 | 0.0006 | |
| PMOL | 0.6616 | 0.0002 | 0.0021 | 0.2638 | 0.0005 | 0.0120 | |
| Linear | 0.5548 | 0.2401 | 0.4045 | 0.7940 | 0.2561 | 0.6070 | |
| Quadratic | 0.1570 | <0.0001 | <0.0001 | 0.8258 | <0.0001 | 0.0009 | |
| ISR × PMOL | 0.0719 | 0.0002 | 0.0007 | 0.0108 | 0.0021 | 0.0157 | |
| Inoculum Source Ruminal (ISR) | Percentage of Moringa (PMOL) 1 | CO Production | ||||||||
|---|---|---|---|---|---|---|---|---|---|---|
| Parameters 2 | mL CO g−1 DM Incubated | mL CO g−1 DM Degraded | ||||||||
| b | c | Lag | 6 h | 24 h | 48 h | 6 h | 24 h | 48 h | ||
| Steers | M0 | 0.02153 | 0.00009 | 0.00003 | 0.00050 | 0.00546 | 0.04038 | 0.00194 | 0.02139 | 0.15822 |
| M20 | 0.03350 | 0.00008 | 0.00004 | 0.00054 | 0.00534 | 0.04067 | 0.00140 | 0.01395 | 0.10607 | |
| M40 | 0.03847 | 0.00008 | 0.00203 | 0.00054 | 0.00549 | 0.03604 | 0.00158 | 0.01613 | 0.10575 | |
| M60 | 0.01837 | 0.00006 | 0.00002 | 0.00087 | 0.00459 | 0.03231 | 0.00264 | 0.01397 | 0.09841 | |
| M80 | 0.02593 | 0.00006 | 0.00003 | 0.00099 | 0.00589 | 0.04164 | 0.00333 | 0.01960 | 0.13948 | |
| M100 | 0.03630 | 0.00010 | 0.00005 | 0.00130 | 0.00850 | 0.04075 | 0.00436 | 0.02851 | 0.13652 | |
| SEM 3 | 0.00868 | 0.00002 | 0.00081 | 0.00006 | 0.00062 | 0.00306 | 0.00024 | 0.00208 | 0.01112 | |
| p-value | ||||||||||
| Linear | 0.6072 | 0.0199 | 0.6076 | 0.3770 | 0.1488 | 0.0006 | 0.0053 | 0.0005 | <0.0001 | |
| Quadratic | 0.4452 | 0.4909 | 0.4452 | 0.0019 | 0.0877 | 0.0122 | 0.0025 | 0.1022 | 0.0267 | |
| Sheep | M0 | 5.47365 | 0.00943 | 9.70000 | 0.00169 | 0.08639 | 0.37269 | 0.00784 | 0.40196 | 1.73135 |
| M20 | 9.29490 | 0.00631 | 7.65240 | 0.00203 | 0.11812 | 0.53105 | 0.00926 | 0.53562 | 2.41206 | |
| M40 | 2.24535 | 0.00024 | 5.35000 | 0.00165 | 0.11192 | 0.45795 | 0.00714 | 0.48624 | 1.98784 | |
| M60 | 2.97805 | 0.00076 | 4.50000 | 0.00200 | 0.08380 | 0.51019 | 0.00808 | 0.34433 | 2.06793 | |
| M80 | 6.35000 | 0.00031 | 4.20000 | 0.00168 | 0.20790 | 0.79209 | 0.00591 | 0.73058 | 2.79043 | |
| M100 | 25.95985 | 0.01201 | 6.65000 | 0.00114 | 0.33702 | 1.38065 | 0.00358 | 1.05746 | 4.32665 | |
| SEM 3 | 5.69736 | 0.00609 | 2.80410 | 0.00017 | 0.04020 | 0.12264 | 0.00066 | 0.15639 | 0.46880 | |
| p-value | ||||||||||
| Linear | 0.6521 | 0.7297 | 0.6241 | 0.2124 | 0.5970 | 0.3964 | 0.1783 | 0.5678 | 0.3441 | |
| Quadratic | 0.0374 | 0.5994 | 0.5767 | 0.0144 | 0.0031 | 0.0008 | 0.0008 | 0.0218 | 0.0077 | |
| Pooled SEM 3 | 2.98757 | 0.00319 | 1.47041 | 0.00011 | 0.02109 | 0.06437 | 0.00041 | 0.08203 | 0.24604 | |
| p-value | ||||||||||
| ISR | <0.0001 | 0.0192 | <0.0001 | <0.0001 | <0.0001 | <0.0001 | <0.0001 | <0.0001 | <0.0001 | |
| PMOL | 0.0094 | 0.3091 | 0.4406 | 0.0331 | <0.0001 | <0.0001 | 0.0206 | 0.0037 | 0.0006 | |
| Linear | 0.5313 | 0.6321 | 0.4973 | 0.0946 | 0.4656 | 0.2359 | 0.2979 | 0.4539 | 0.2199 | |
| Quadratic | 0.0022 | 0.4652 | 0.4389 | 0.7268 | <0.0001 | <0.0001 | 0.005 | 0.0005 | <0.0001 | |
| ISR × PMOL | 0.0094 | 0.3144 | 0.4404 | <0.0001 | <0.0001 | <0.0001 | <0.0001 | 0.0051 | 0.0007 | |
| Inoculum Source Ruminal (ISR) | Percentage of Moringa (PMOL) 1 | H2S Production | ||||||||
|---|---|---|---|---|---|---|---|---|---|---|
| Parameters 2 | mL H2S g−1 DM Incubated | mL H2S g−1 DM Degraded | ||||||||
| b | c | Lag | 6 h | 24 h | 48 h | 6 h | 24 h | 48 h | ||
| Steers | M0 | 0.10800 | 0.00021 | 0.00080 | 0.00911 | 0.04526 | 0.1669 | 0.03578 | 0.17736 | 0.13267 |
| M20 | 0.11613 | 0.00015 | 0.00086 | 0.00797 | 0.03823 | 0.1257 | 0.02084 | 0.09992 | 0.03632 | |
| M40 | 0.11287 | 0.00015 | 0.00084 | 0.00790 | 0.03645 | 0.1262 | 0.02320 | 0.10704 | 0.04467 | |
| M60 | 0.10877 | 0.00019 | 0.00081 | 0.01093 | 0.04289 | 0.1509 | 0.03331 | 0.13054 | 0.10073 | |
| M80 | 0.14127 | 0.00022 | 0.00105 | 0.01497 | 0.04665 | 0.1781 | 0.04995 | 0.15621 | 0.11396 | |
| M100 | 0.12260 | 0.00020 | 0.00091 | 0.01281 | 0.04908 | 0.1586 | 0.04283 | 0.16389 | 0.11687 | |
| SEM 3 | 0.01089 | 0.00002 | 0.00008 | 0.00088 | 0.00322 | 0.0031 | 0.00311 | 0.01165 | 0.01047 | |
| p-value | ||||||||||
| Linear | 0.6072 | 0.0199 | 0.6076 | 0.3770 | 0.1488 | 0.0006 | 0.0053 | 0.0005 | <0.0001 | |
| Quadratic | 0.4452 | 0.4909 | 0.4452 | 0.0019 | 0.0877 | 0.0122 | 0.0025 | 0.1022 | 0.0267 | |
| Sheep | M0 | 0.04160 | 0.12475 | 7.08305 | 0.00008 | 0.00107 | 0.04079 | 0.00036 | 0.00490 | 0.12728 |
| M20 | 0.08320 | 0.00003 | 5.20000 | 0.00006 | 0.00458 | 0.06825 | 0.00029 | 0.02084 | 0.20312 | |
| M40 | 0.03077 | 0.00014 | 6.00000 | 0.00006 | 0.00218 | 0.05403 | 0.00026 | 0.00945 | 0.15613 | |
| M60 | 0.02450 | 0.00005 | 7.20000 | 0.00007 | 0.00228 | 0.06635 | 0.00030 | 0.00928 | 0.17636 | |
| M80 | 0.03675 | 0.00048 | 8.30000 | 0.00007 | 0.00460 | 0.08928 | 0.00024 | 0.01626 | 0.20082 | |
| M100 | 0.02200 | 0.00010 | 8.35000 | 0.00002 | 0.00483 | 0.06676 | 0.00006 | 0.01521 | 0.14296 | |
| SEM 3 | 0.02409 | 0.04636 | 1.36597 | 0.00001 | 0.00100 | 0.00780 | 0.00004 | 0.00360 | 0.02784 | |
| p-value | ||||||||||
| Linear | 0.2679 | 0.1058 | 0.3673 | 0.3857 | 0.0465 | 0.1716 | 0.2858 | 0.0204 | 0.1024 | |
| Quadratic | 0.2200 | 0.3147 | 0.2349 | 0.0045 | 0.1505 | 0.3613 | 0.0014 | 0.6159 | 0.5386 | |
| Pooled SEM 3 | 0.01605 | 0.02431 | 0.71628 | 0.00080 | 0.00297 | 0.00494 | 0.00282 | 0.01075 | 0.01742 | |
| p-value | ||||||||||
| ISR | <0.0001 | 0.1588 | <0.0001 | <0.0001 | <0.0001 | <0.0001 | <0.0001 | <0.0001 | <0.0001 | |
| PMOL | 0.3394 | 0.1035 | 0.2377 | 0.0016 | 0.1777 | 0.0067 | 0.0005 | 0.0157 | 0.0828 | |
| Linear | 0.1405 | 0.0199 | 0.2074 | 0.4816 | 0.5644 | 0.7686 | 0.0165 | 0.0107 | 0.5655 | |
| Quadratic | 0.2991 | 0.1584 | 0.0935 | 0.0072 | 0.0876 | 0.0287 | 0.0096 | 0.1578 | 0.7420 | |
| ISR × PMOL | 0.2999 | 0.1037 | 0.2378 | 0.0015 | 0.3199 | 0.0237 | 0.0005 | 0.0046 | 0.0018 | |
| Inoculum Source Ruminal (ISR) | Percentage of Moringa (PMOL) 1 | Fermentation Characteristics 2 | CH4 Conversion Efficiency 3 | |||||
|---|---|---|---|---|---|---|---|---|
| pH | DMD | SCFA | ME | CH4:SCFA | CH4:ME | CH4:OM | ||
| Steers | M0 | 6.33 | 60.58 | 6.27 | 8.82 | 46.27 | 5.22 | 10.94 |
| M20 | 6.36 | 75.53 | 5.30 | 8.32 | 55.90 | 5.71 | 11.34 | |
| M40 | 6.46 | 72.01 | 5.23 | 8.29 | 60.49 | 6.13 | 12.13 | |
| M60 | 6.55 | 75.52 | 5.63 | 8.49 | 62.22 | 6.62 | 13.43 | |
| M80 | 6.55 | 74.14 | 6.12 | 8.74 | 61.76 | 6.94 | 14.49 | |
| M100 | 6.67 | 81.05 | 6.10 | 8.73 | 54.12 | 6.09 | 12.73 | |
| SEM 4 | 0.07 | 1.430 | 0.211 | 0.112 | 5.060 | 0.581 | 1.250 | |
| p-value | ||||||||
| Linear | 0.7778 | <0.0001 | 0.0059 | 0.0060 | 0.2032 | 0.5642 | 0.8264 | |
| Quadratic | 0.0015 | <0.0001 | 0.2291 | 0.2296 | 0.6327 | 0.3962 | 0.3173 | |
| Sheep | M0 | 7.09 | 43.25 | 2.76 | 5.03 | 74.78 | 6.67 | 7.85 |
| M20 | 7.06 | 43.89 | 3.69 | 5.51 | 88.59 | 9.53 | 12.20 | |
| M40 | 7.06 | 46.07 | 2.82 | 5.07 | 77.25 | 6.87 | 8.06 | |
| M60 | 7.03 | 49.32 | 3.31 | 5.31 | 99.32 | 9.91 | 12.23 | |
| M80 | 7.02 | 56.90 | 3.44 | 5.38 | 118.99 | 12.23 | 15.31 | |
| M100 | 6.98 | 64.14 | 4.00 | 5.67 | 182.84 | 20.83 | 27.69 | |
| SEM4 | 0.041 | 0.992 | 0.230 | 0.122 | 16.151 | 2.163 | 3.202 | |
| p-value | ||||||||
| Linear | 0.6207 | 0.6648 | 0.0292 | 0.0292 | 0.5676 | 0.3853 | 0.3734 | |
| Quadratic | 0.1051 | <0.0001 | 0.0325 | 0.0325 | 0.0022 | 0.0029 | 0.0041 | |
| Pooled SEM 4 | 0.06 | 1.40 | 0.22 | 0.11 | 9.64 | 1.25 | 2.02 | |
| p-value | ||||||||
| ISR | <0.0001 | <0.0001 | <0.0001 | <0.0001 | <0.0001 | <0.0001 | 0.2548 | |
| PMOL | 0.3955 | 0.0063 | <0.0001 | 0.0064 | 0.0002 | 0.0001 | 0.0006 | |
| Linear | 0.9793 | <0.0001 | 0.9115 | 0.9108 | 0.2418 | 0.1994 | 0.2589 | |
| Quadratic | 0.0491 | <0.0001 | 0.0111 | 0.0111 | <0.0001 | <0.0001 | <0.0001 | |
| ISR × PMOL | 0.0237 | 0.0127 | 0.0001 | 0.0128 | 0.0002 | 0.0003 | 0.0023 | |
Disclaimer/Publisher’s Note: The statements, opinions and data contained in all publications are solely those of the individual author(s) and contributor(s) and not of MDPI and/or the editor(s). MDPI and/or the editor(s) disclaim responsibility for any injury to people or property resulting from any ideas, methods, instructions or products referred to in the content. |
© 2023 by the authors. Licensee MDPI, Basel, Switzerland. This article is an open access article distributed under the terms and conditions of the Creative Commons Attribution (CC BY) license (https://creativecommons.org/licenses/by/4.0/).
Share and Cite
Alvarado-Ramírez, E.R.; Maggiolino, A.; Elghandour, M.M.M.Y.; Rivas-Jacobo, M.A.; Ballesteros-Rodea, G.; Palo, P.D.; Salem, A.Z.M. Impact of Co-Ensiling of Maize with Moringa oleifera on the Production of Greenhouse Gases and the Characteristics of Fermentation in Ruminants. Animals 2023, 13, 764. https://doi.org/10.3390/ani13040764
Alvarado-Ramírez ER, Maggiolino A, Elghandour MMMY, Rivas-Jacobo MA, Ballesteros-Rodea G, Palo PD, Salem AZM. Impact of Co-Ensiling of Maize with Moringa oleifera on the Production of Greenhouse Gases and the Characteristics of Fermentation in Ruminants. Animals. 2023; 13(4):764. https://doi.org/10.3390/ani13040764
Chicago/Turabian StyleAlvarado-Ramírez, Edwin Rafael, Aristide Maggiolino, Mona M. M. Y. Elghandour, Marco Antonio Rivas-Jacobo, Gilberto Ballesteros-Rodea, Pasquale De Palo, and Abdelfattah Z. M. Salem. 2023. "Impact of Co-Ensiling of Maize with Moringa oleifera on the Production of Greenhouse Gases and the Characteristics of Fermentation in Ruminants" Animals 13, no. 4: 764. https://doi.org/10.3390/ani13040764