

Energetic Implications of Morphological Changes between Fish Larval and Juvenile Stages Using Geometric Morphometrics of Body Shape

 , , , and
Abstract
:Simple Summary
Abstract
1. Introduction
2. Materials and Methods
2.1. Study Sampling
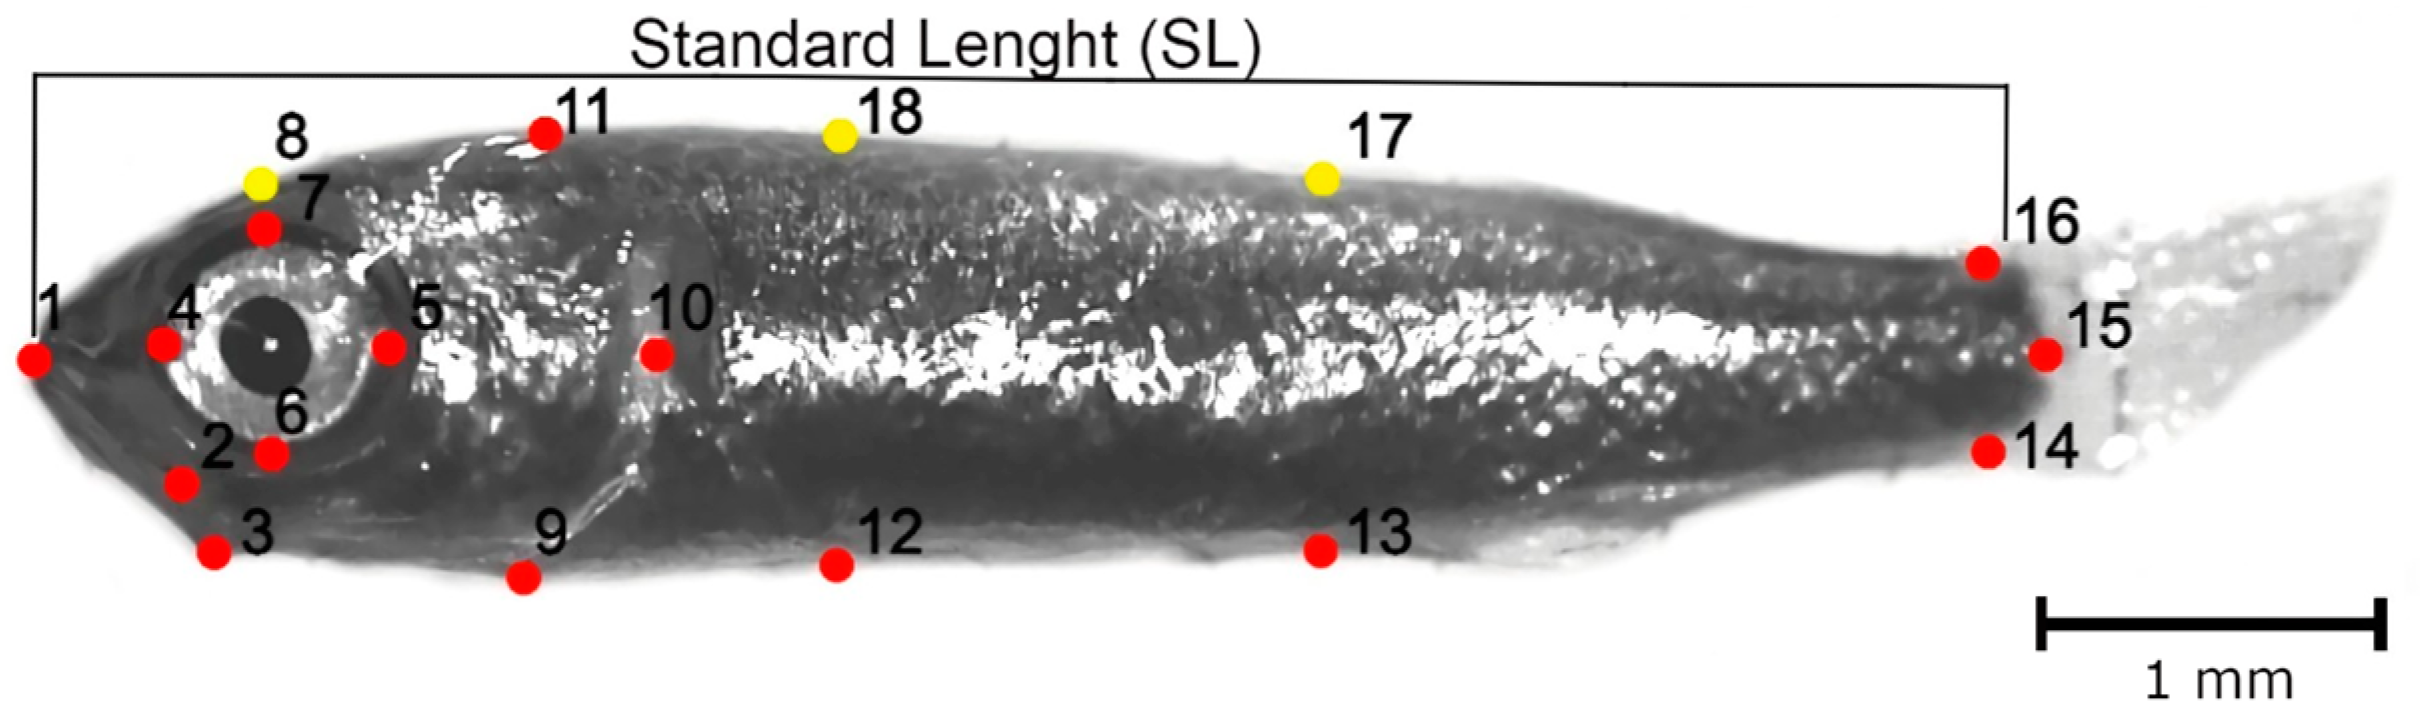
2.2. Geometric Morphometric Analysis
2.3. Electron Transport System (ETS) and Protein Measurements
2.4. Statistical Analysis
3. Results
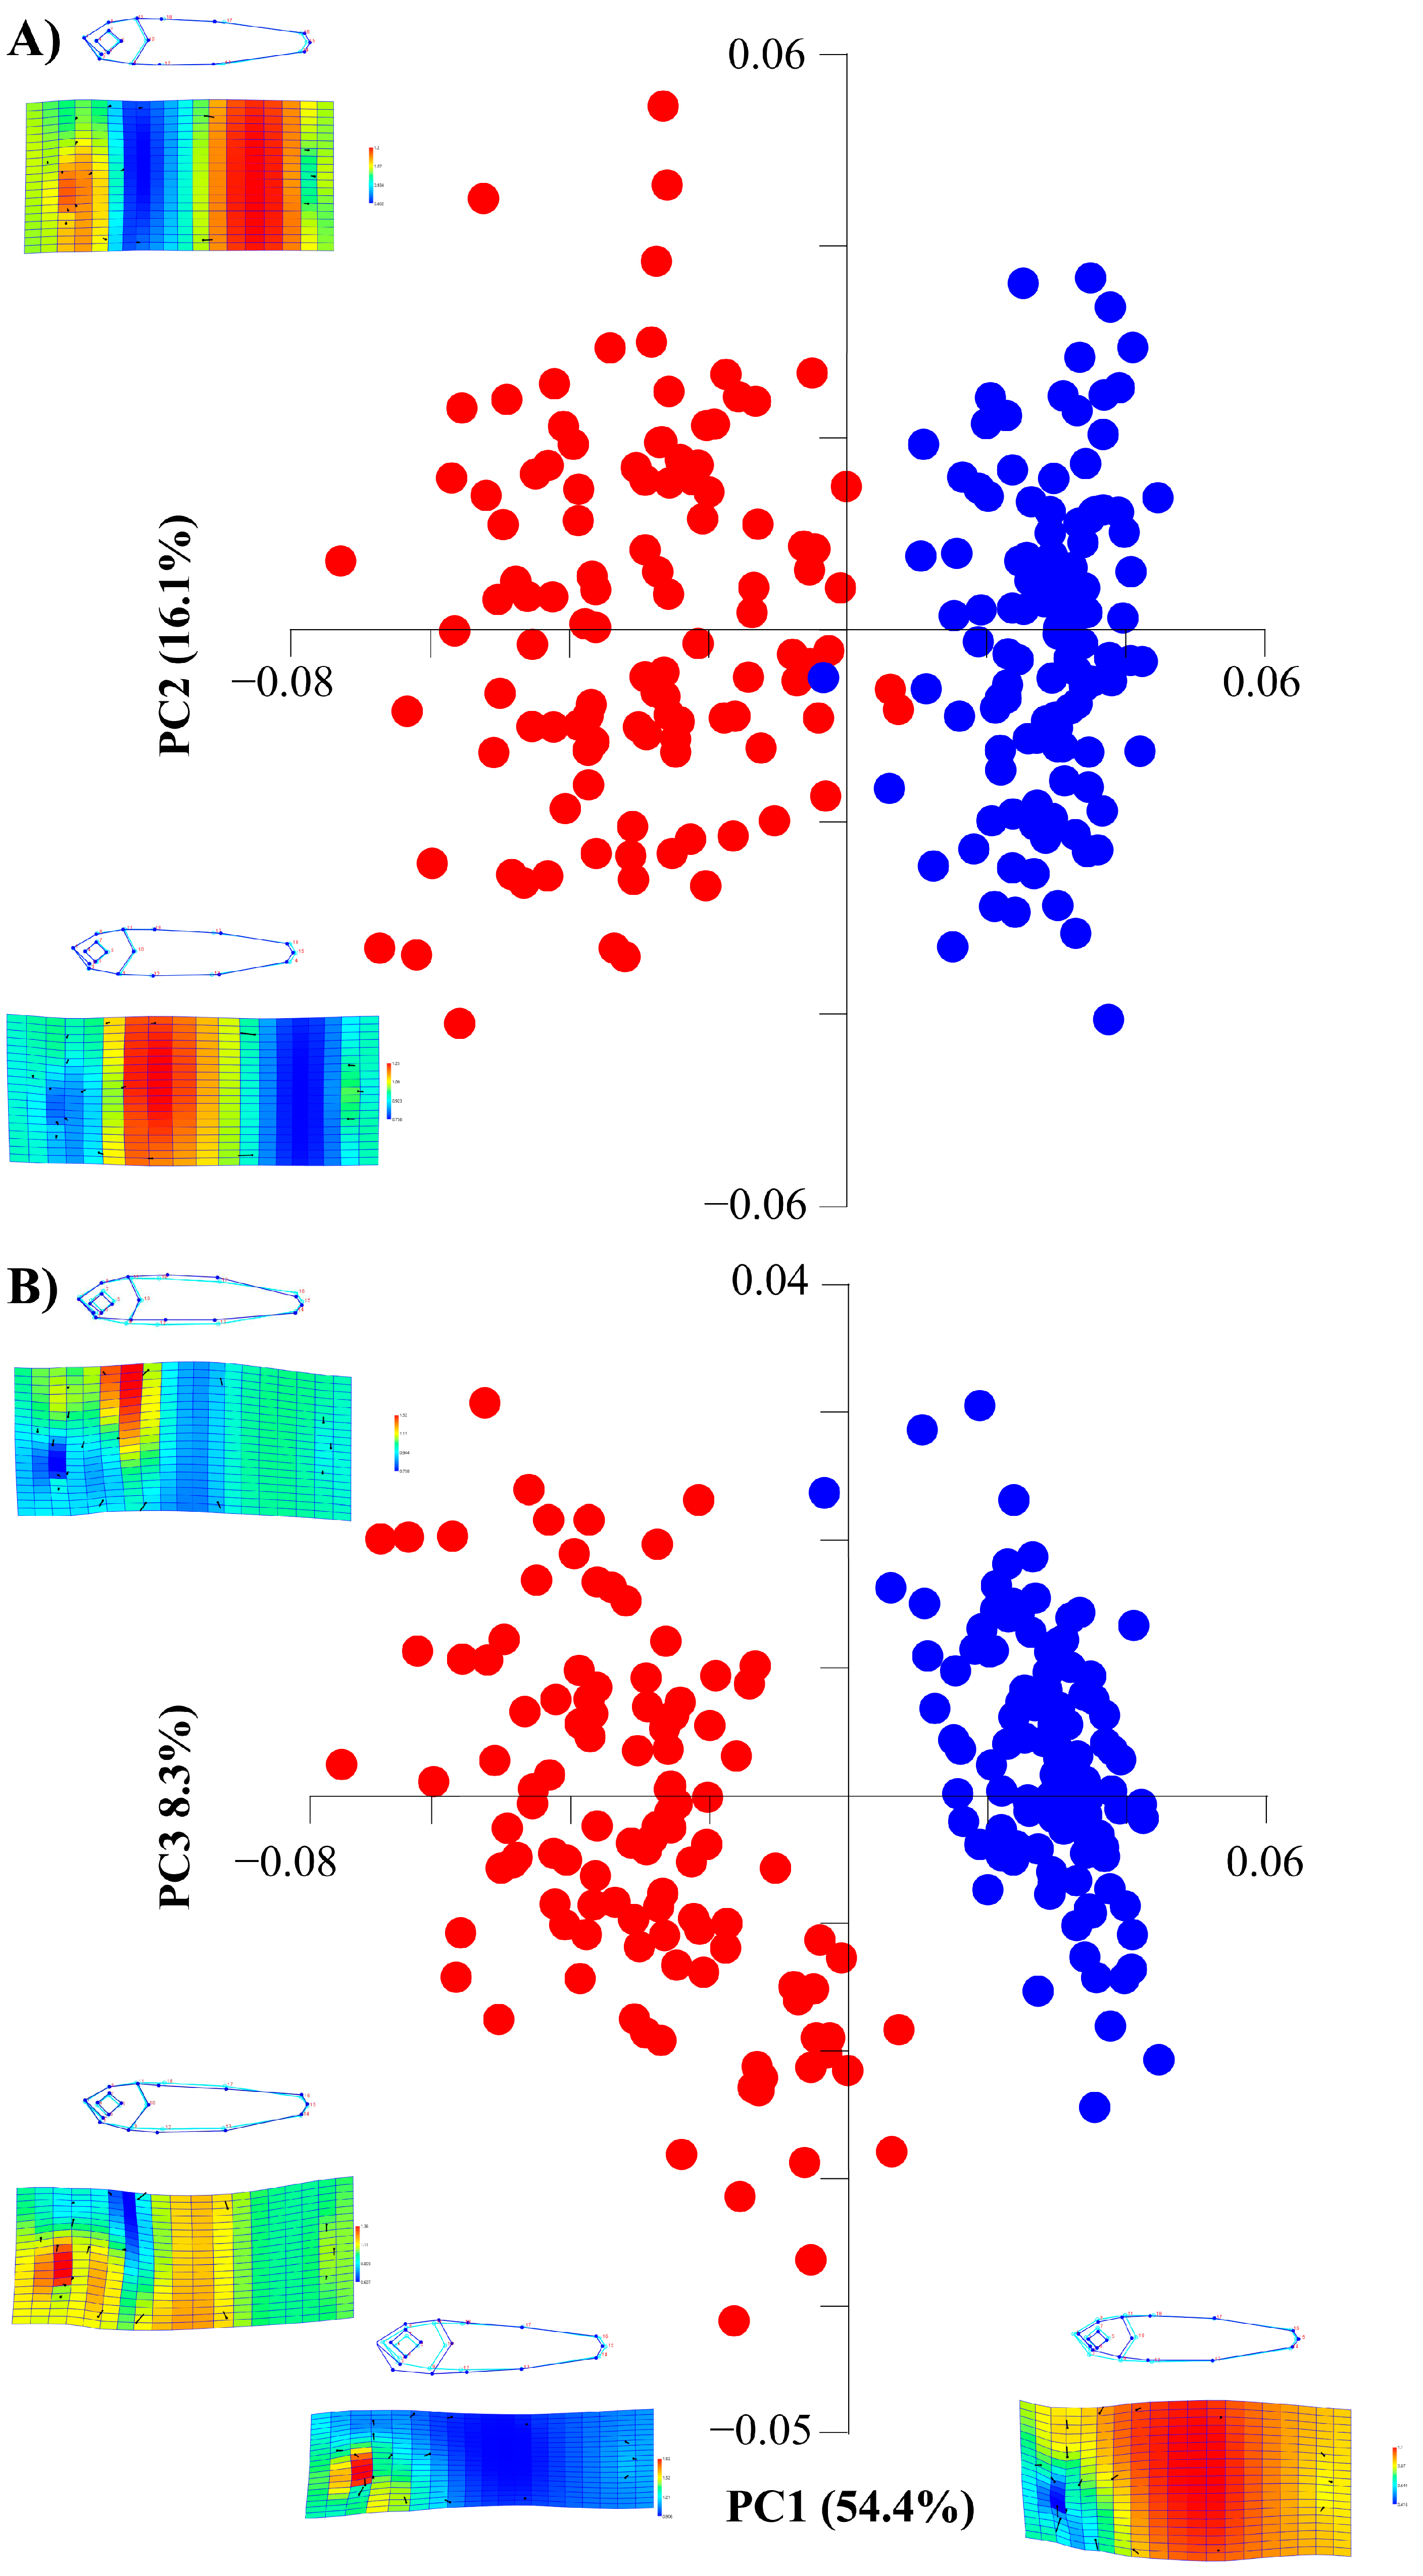
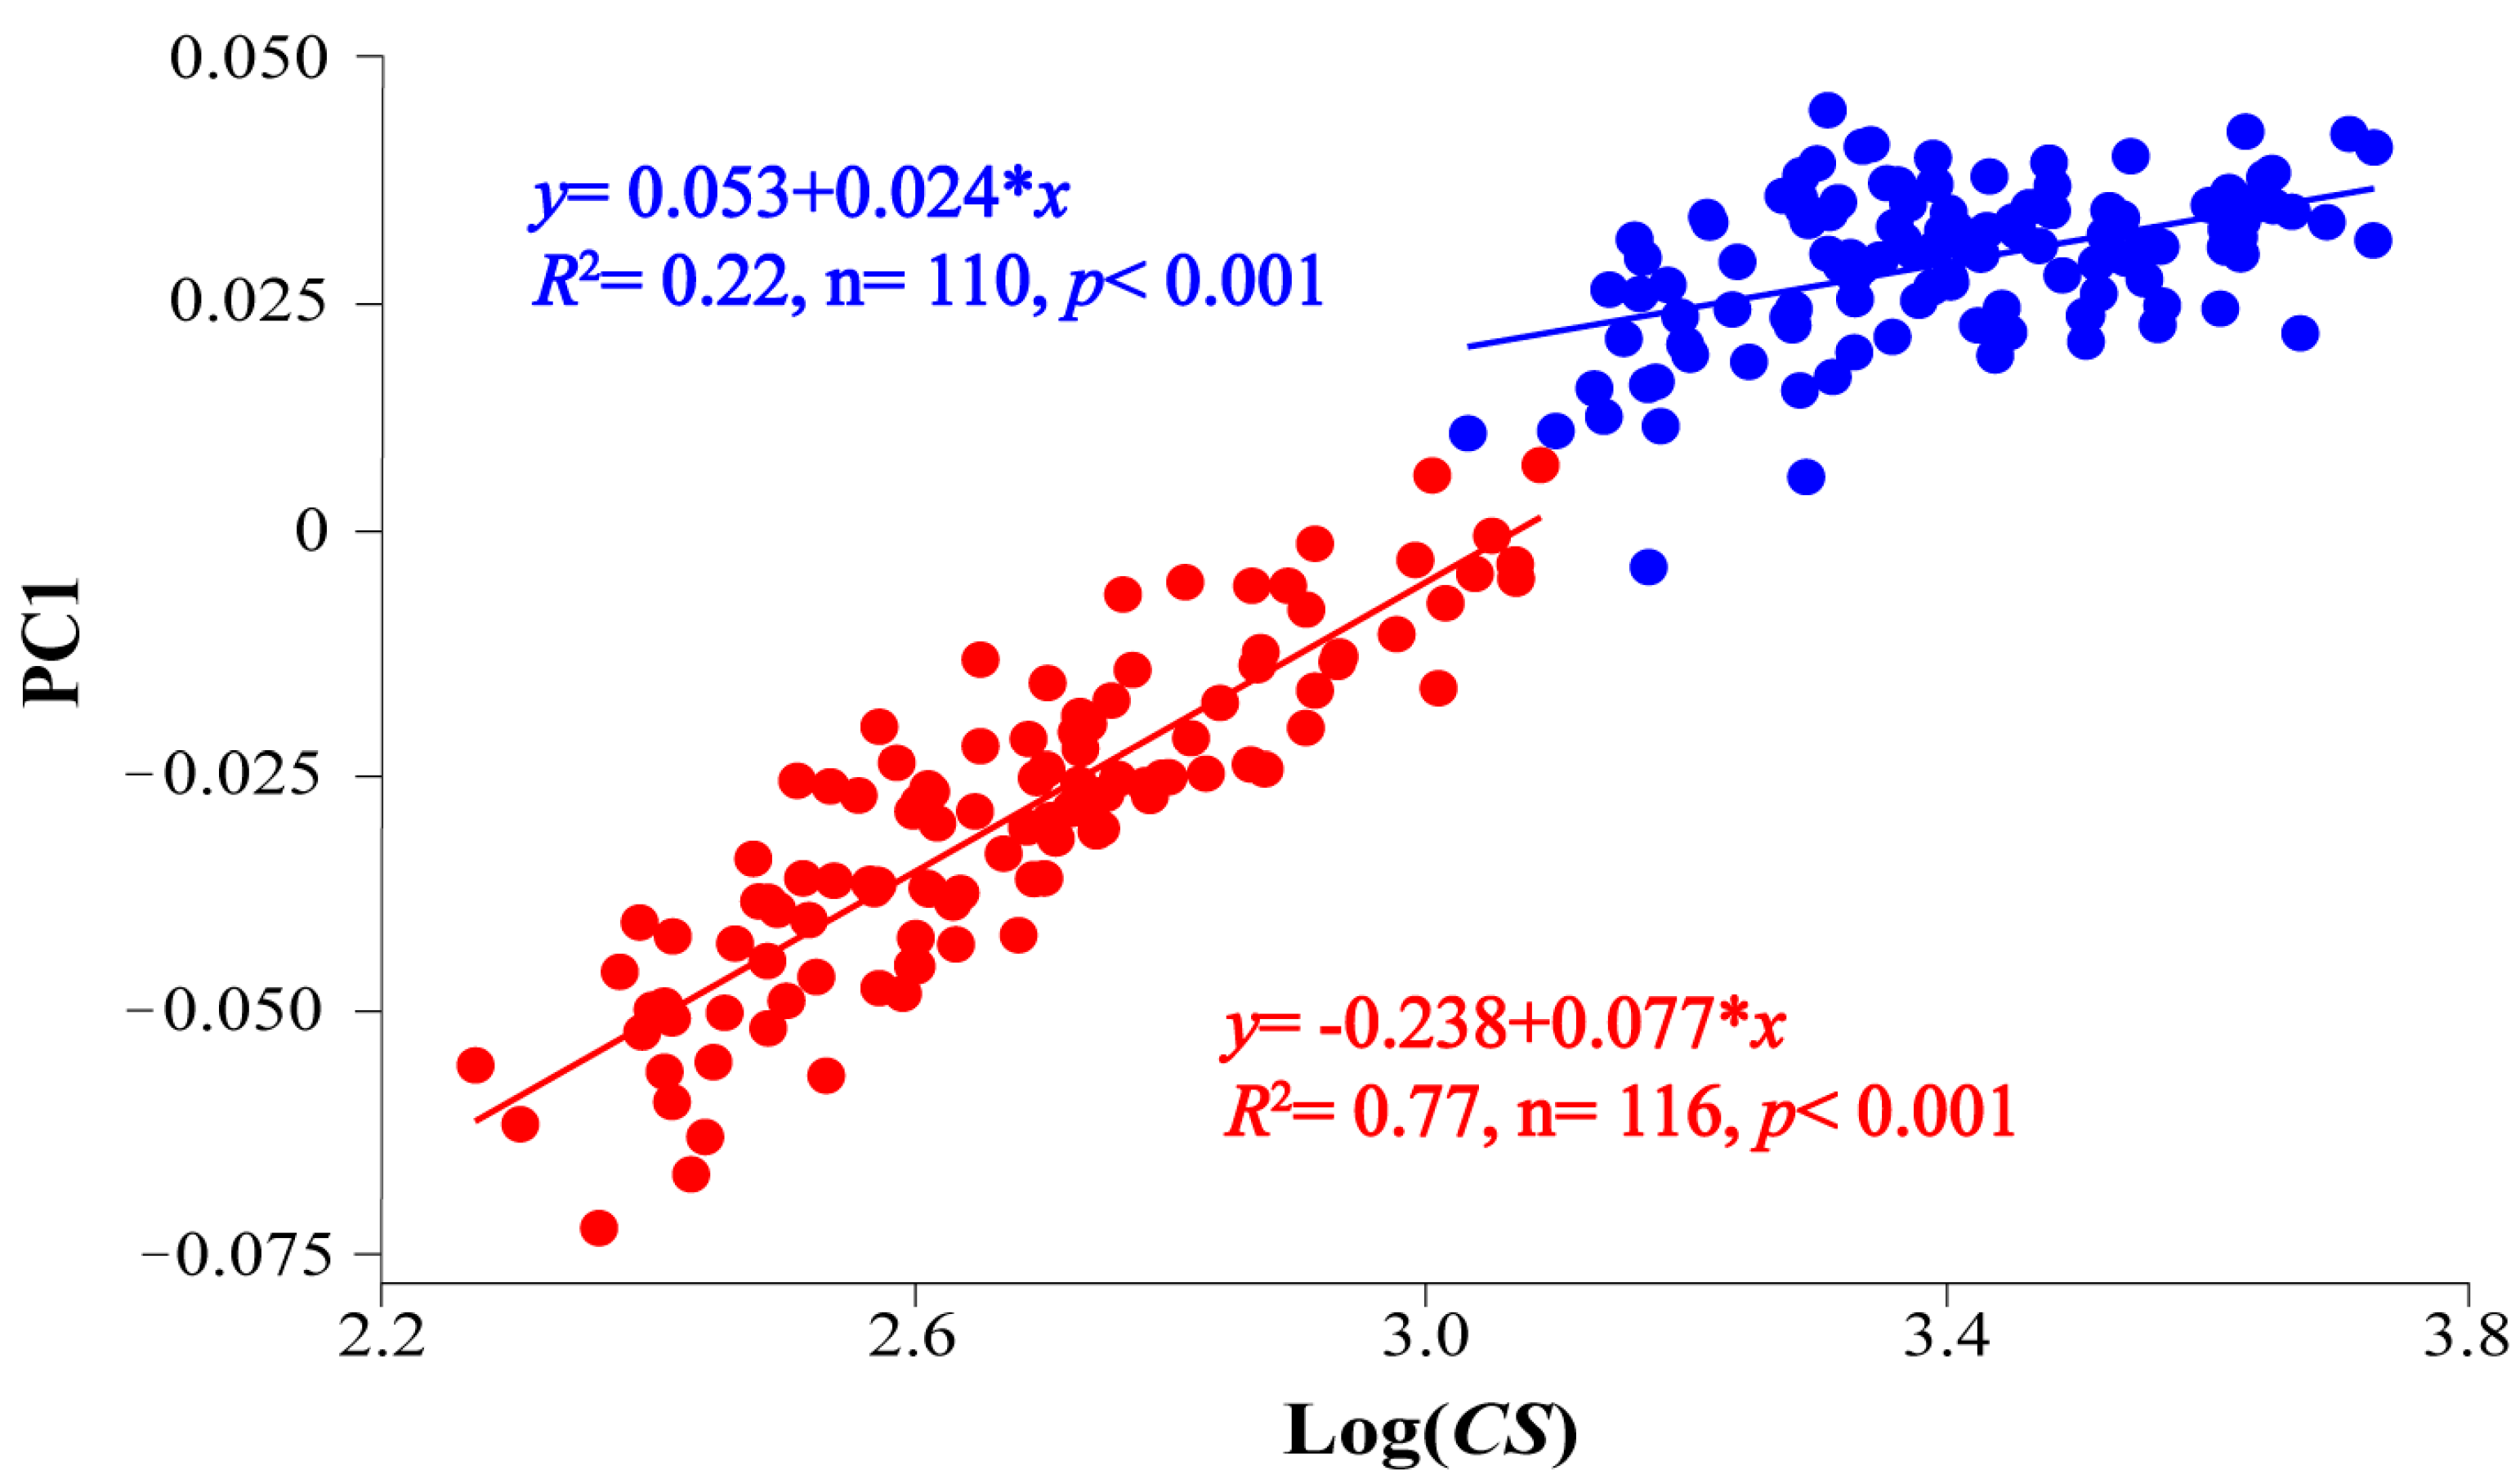
3.1. Body Analysis
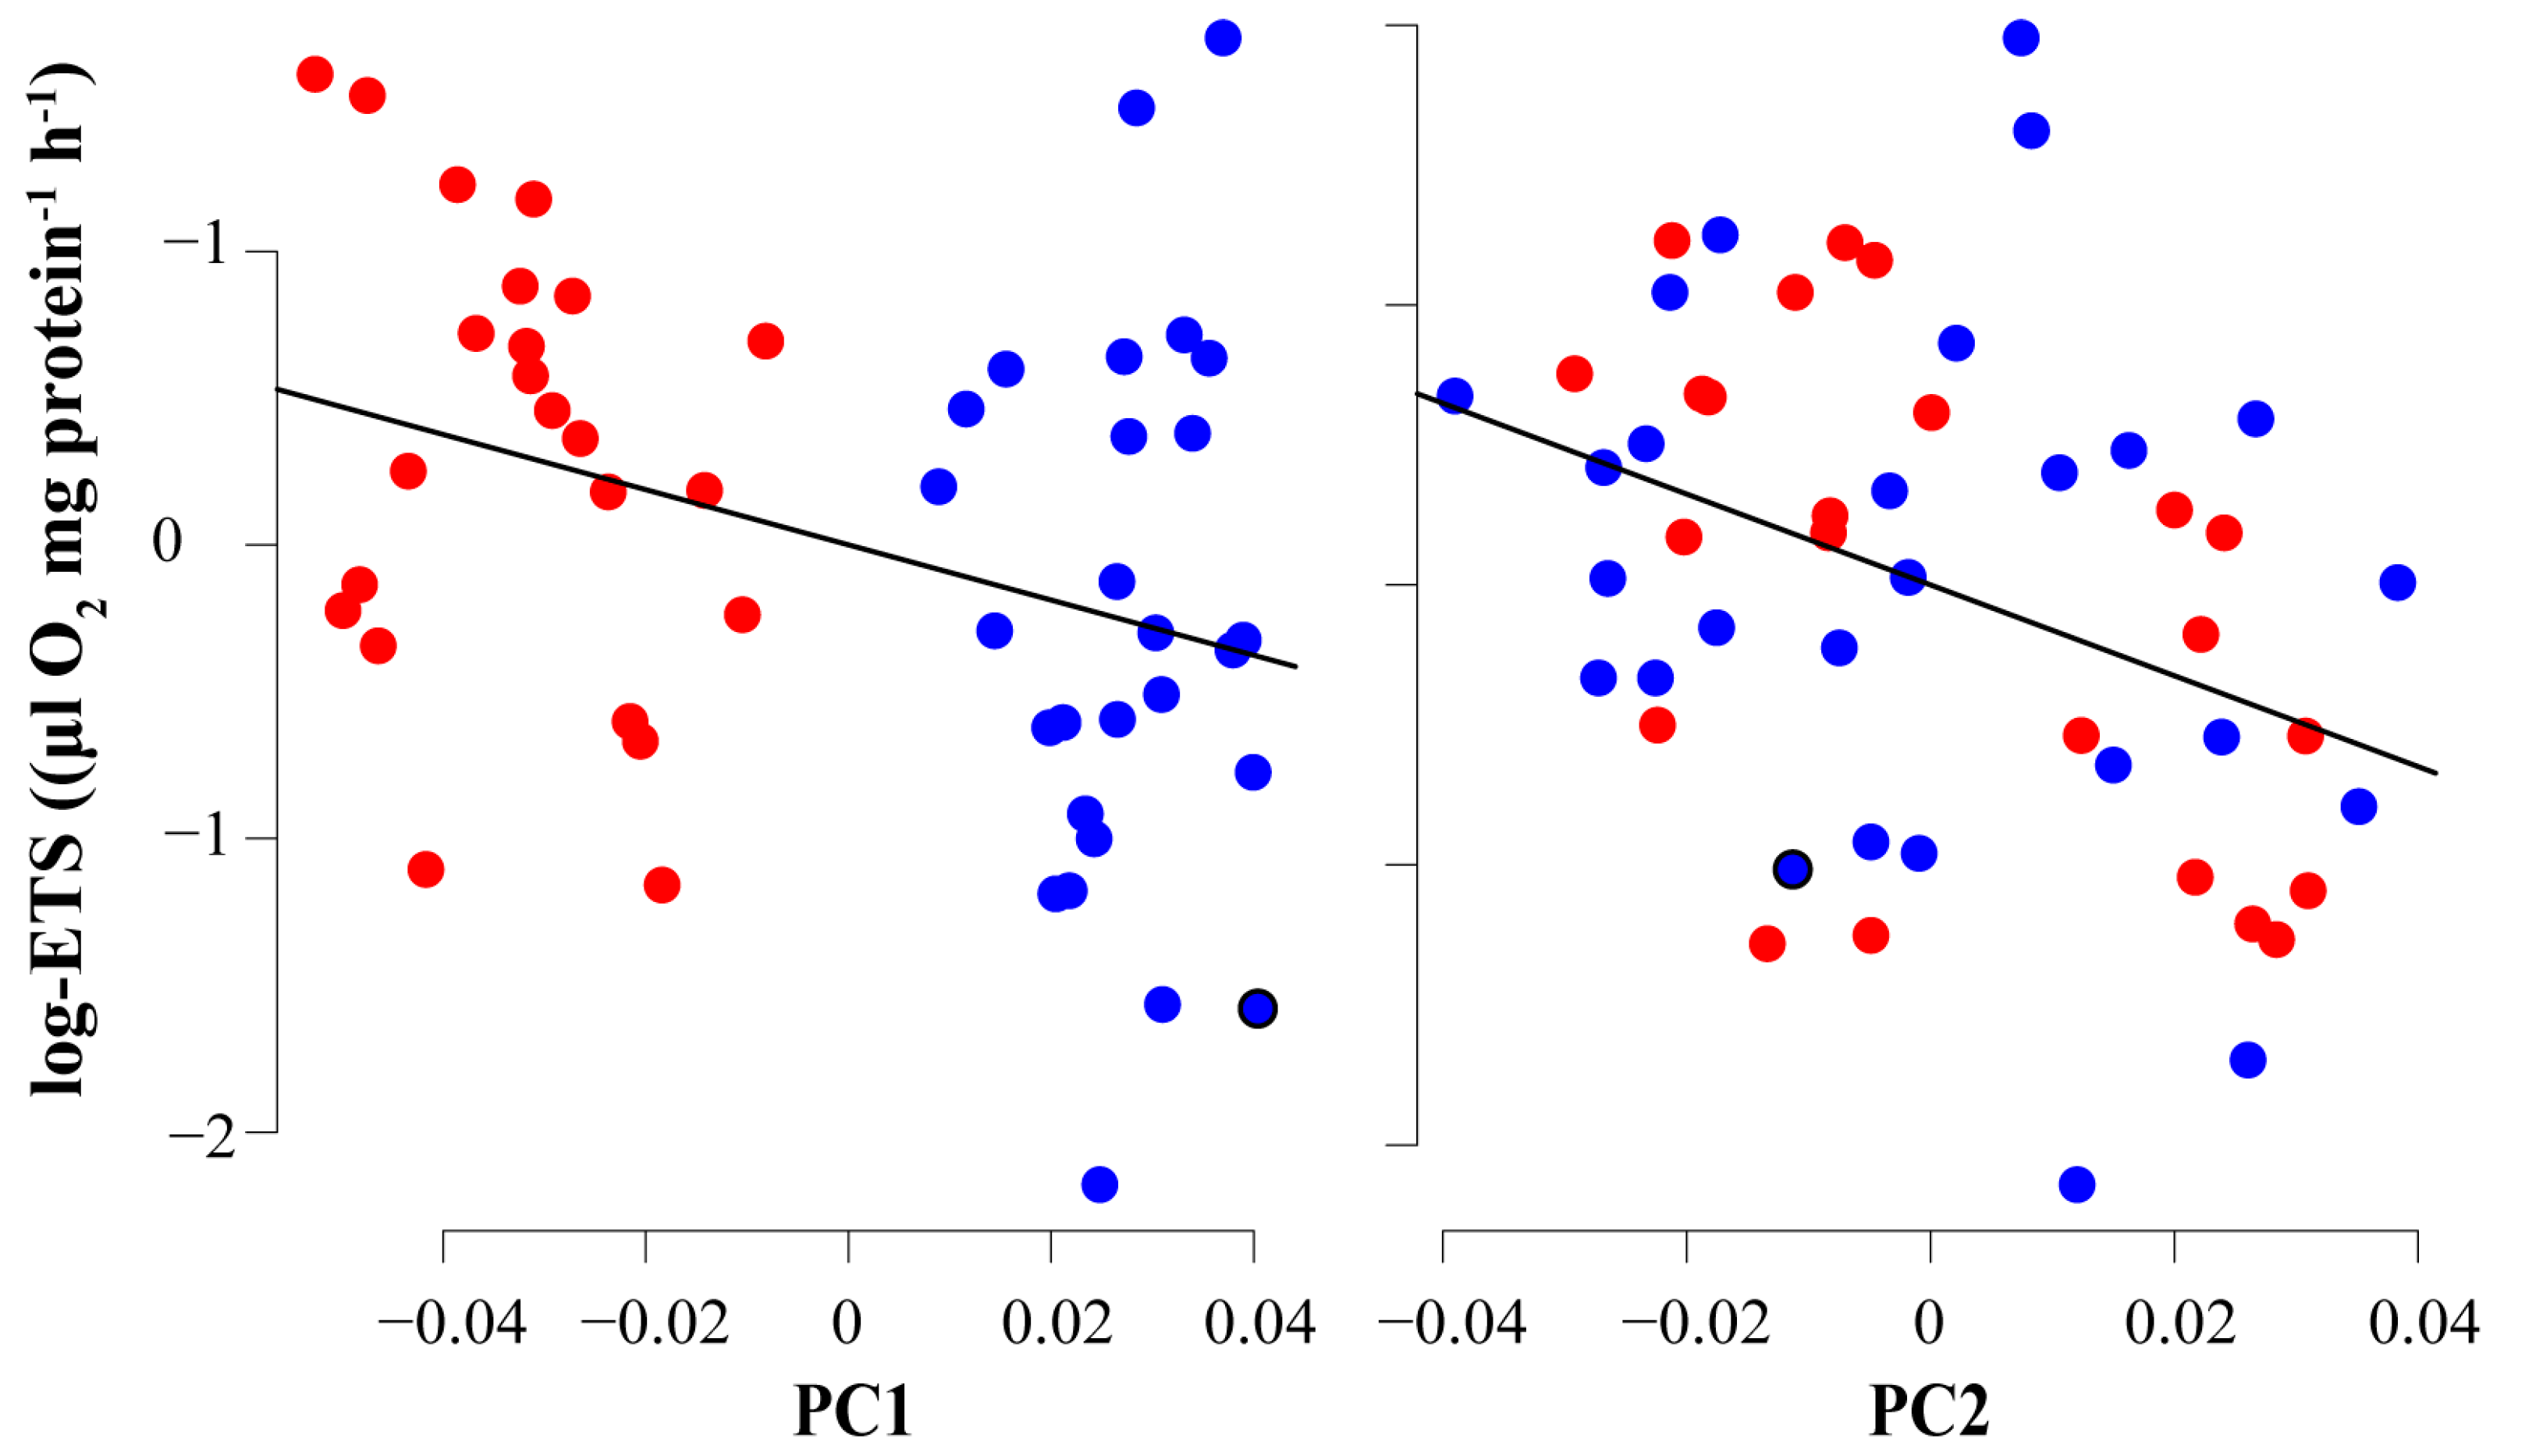
3.2. Metabolic Analysis
4. Discussion
5. Conclusions
Supplementary Materials
Author Contributions
Funding
Institutional Review Board Statement
Informed Consent Statement
Data Availability Statement
Acknowledgments
Conflicts of Interest
References
- Russell, E.S. Form and Function: A Contribution to the History of Animal Morphology; Murray, J., Ed.; John Murray: London, UK, 1916. [Google Scholar]
- Thomson, J.A. On Growth and Form. Nature 1917, 100, 21–22. [Google Scholar] [CrossRef]
- Abzhanov, A. The Old and New Faces of Morphology: The Legacy of D’Arcy Thompson’s ‘Theory of Transformations’ and ‘Laws of Growth.’. Development 2017, 144, 4284–4297. [Google Scholar] [CrossRef] [PubMed] [Green Version]
- Wainwright, P.C.; Bellwood, D.R.; Westneat, M.W. Ecomorphology of Locomotion in Labrid Fishes. Environ. Biol. Fishes. 2002, 65, 47–62. [Google Scholar] [CrossRef]
- Winemiller, K.O. Ecomorphological Diversification in Lowland Freshwater Fish Assemblages from Five Biotic Regions. Ecol. Monogr. 1991, 61, 343–365. [Google Scholar] [CrossRef]
- Karr, J.R.; James, F.C. Ecomorphological Configurations and Convergent Evolution in Species and Communities; Belknap Press: Cambridge, UK, 1975. [Google Scholar]
- Neige, P. Spatial Patterns of Disparity and Diversity of the Recent Cuttlefishes (Cephalopoda) across the Old World. J. Biogeogr. 2003, 30, 1125–1137. [Google Scholar] [CrossRef]
- Kerschbaumer, M.; Sturmbauer, C. The Utility of Geometric Morphometrics to Elucidate Pathways of Cichlid Fish Evolution. Int J. Evol. Biol. 2011, 2011, 1–8. [Google Scholar] [CrossRef] [Green Version]
- Price, S.A.; Holzman, R.; Near, T.J.; Wainwright, P.C. Coral Reefs Promote the Evolution of Morphological Diversity and Ecological Novelty in Labrid Fishes. Ecol. Lett. 2011, 14, 462–469. [Google Scholar] [CrossRef]
- Garnier, S.; Magniez-Jannin, F.; Rasplus, J.Y.; Alibert, P. When Morphometry Meets Genetics: Inferring the Phylogeography of Carabus solieri Using Fourier Analyses of Pronotum and Male Genitalia. J. Evol. Biol. 2005, 18, 269–280. [Google Scholar] [CrossRef]
- Schoener, T.W. Theory of Feeding Strategies. Annu. Rev. Ecol. Syst. 1971, 2, 369–404. [Google Scholar] [CrossRef] [Green Version]
- Webb, P.W. Body Form, Locomotion and Foraging in Aquatic Vertebrates. Am. Zool. 1984, 24, 107–120. [Google Scholar] [CrossRef]
- Walker, J.A. An Integrative Model of Evolutionary Covariance: A Symposium on Body Shape in Fishes. Integr. Comp. Biol. 2010, 50, 1051–1056. [Google Scholar] [CrossRef] [Green Version]
- Snorrason, S.S.; Skulason, S.; Jonsson, B.; Malmquist, H.J.; Jonasson, P.M.; Sandlund, O.T.; Lindem, T. Trophic Specialization in Arctic Charr Salvelinus alpinus (Pisces; Salmonidae): Morphological Divergence and Ontogenetic Niche Shifts. Biol. J. Lin. Soc. 1994, 52, 1–18. [Google Scholar] [CrossRef]
- Wainwright, P.C.; Richard, B.A. Predicting Patterns of Prey Use from Morphology of Fishes. Environ. Biol. Fishes. 1995, 44, 97–113. [Google Scholar] [CrossRef]
- Adams, C.E.; Fraser, D.; Huntingford, F.A.; Greer, R.B.; Askew, C.M.; Walker, A.F. Trophic Polymorphism amongst Arctic Charr from Loch Rannoch, Scotland. J. Fish. Biol. 1998, 52, 1259–1271. [Google Scholar] [CrossRef]
- Pigliucci, M.; Murren, C.J.; Schlichting, C.D. Phenotypic Plasticity and Evolution by Genetic Assimilation. J. Exp. Biol. 2006, 209, 2362–2367. [Google Scholar] [CrossRef] [Green Version]
- Fusco, G.; Minelli, A. Phenotypic Plasticity in Development and Evolution: Facts and Concepts. Philos. Trans. R Soc. B Biol. Sci. 2010, 365, 547–556. [Google Scholar] [CrossRef] [Green Version]
- Klingenberg, C.P. Phenotypic Plasticity, Developmental Instability, and Robustness: The Concepts and How They Are Connected. Front. Ecol. Evol. 2019, 7, 1–56. [Google Scholar] [CrossRef] [Green Version]
- Fuiman, L.A. Growth Gradients in Fish Larvae. J. Fish. Biol. 1983, 23, 117–123. [Google Scholar] [CrossRef] [Green Version]
- Somarakis, S.; Nikolioudakis, N. What Makes a Late Anchovy Larva? The Development of the Caudal Fin Seen as a Milestone in Fish Ontogeny. J. Plankton. Res. 2010, 32, 317–326. [Google Scholar] [CrossRef] [Green Version]
- Wimberger, P.H. Plasticity of Fish Body Shape. The Effects of Diet, Development, Family and Age in Two Species of Geophugus (Pisces: Cichlidae). Biol. J. Linn. Soc. 1992, 45, 197–218. [Google Scholar] [CrossRef]
- Guillerme, T.; Cooper, N.; Brusatte, S.L.; Davis, K.E.; Jackson, A.L.; Gerber, S.; Goswami, A.; Healy, K.; Hopkins, M.J.; Jones, M.E.H.; et al. Disparities in the Analysis of Morphological Disparity. Biol. Lett. 2020, 16, 20200199. [Google Scholar] [CrossRef] [PubMed]
- Pecquerie, L.; Petitgas, P.; Kooijman, S.A.L.M. Modeling Fish Growth and Reproduction in the Context of the Dynamic Energy Budget Theory to Predict Environmental Impact on Anchovy Spawning Duration. J. Sea. Res. 2009, 62, 93–105. [Google Scholar] [CrossRef] [Green Version]
- Hjort, J. Fluctuations in the Great Fisheries of Northern Europe Viewed in the Light of Biological Research. J. Cons. Int. Explor. Mer 1914, 20, 1–228. [Google Scholar]
- Best, C.; Ikert, H.; Kostyniuk, D.J.; Craig, P.M.; Navarro-Martin, L.; Marandel, L.; Mennigen, J.A. Epigenetics in Teleost Fish: From Molecular Mechanisms to Physiological Phenotypes. Comp. Biochem. Physiol. B Biochem. Mol. Biol. 2018, 224, 210–244. [Google Scholar] [CrossRef] [PubMed] [Green Version]
- Jonsson, B.; Jonsson, N. Phenotypic Plasticity and Epigenetics of Fish: Embryo Temperature Affects Later-Developing Life-History Traits. Aquat. Biol. 2019, 28, 21–32. [Google Scholar] [CrossRef] [Green Version]
- Johnston, I.A. Environment and Plasticity of Myogenesis in Teleost Fish. J. Exp. Biol. 2006, 209, 2249–2264. [Google Scholar] [CrossRef] [Green Version]
- Bernot, R.J.; Dodds, W.K.; Quist, M.C.; Guy, C.S. Larval Fish-Induced Phenotypic Plasticity of Coexisting Daphnia: An Enclosure Experiment. Freshw. Biol. 2004, 49, 87–97. [Google Scholar] [CrossRef]
- Loizides, M.; Georgakopoulou, E.; Christou, M.; Iliopoulou, M.; Papadakis, I.; Katharios, P.; Divanach, P.; Koumoundouros, G. Thermally-Induced Phenotypic Plasticity in Gilthead Seabream Sparus aurata L. (Perciformes, Sparidae). Aquaculture 2014, 432, 383–388. [Google Scholar] [CrossRef]
- Garrido, S.; Cristóvão, A.; Caldeira, C.; Ben-Hamadou, R.; Baylina, N.; Batista, H.; Saiz, E.; Peck, M.A.; Ré, P.; Santos, A.M.P. Effect of Temperature on the Growth, Survival, Development and Foraging Behaviour of Sardina pilchardus Larvae. Mar. Ecol. Prog. Ser. 2016, 559, 131–145. [Google Scholar] [CrossRef] [Green Version]
- Burggren, W.; Blank, T. Physiological study of larval fishes: Challenges and opportunities. Sci. Mar. 2009, 73 (Suppl. S1), 99–110. [Google Scholar] [CrossRef] [Green Version]
- Biro, P.A.; Stamps, J.A. Do Consistent Individual Differences in Metabolic Rate Promote Consistent Individual Differences in Behavior? Trends. Ecol. Evol. 2010, 25, 653–659. [Google Scholar] [CrossRef]
- Osse, J.W.M.; van den Boogaart, J.G.M. Dynamic Morphology of Fish Larvae, Structural implications of Friction Forces in Swimming, Feeding and Ventilation. J. Fish. Biol. 1999, 55, 156–174. [Google Scholar] [CrossRef]
- Loy, A.; Bertelletti, M.; Costa, C.; Ferlin, L.; Cataudella, S. Shape Changes and Growth Trajectories in the Early Stages of Three Species of the Genus Diplodus (Perciformes, Sparidae). J. Morphol. 2001, 250, 24–33. [Google Scholar] [CrossRef]
- Loy, A.; Mariani, L.; Bertelletti, M.; Tunesi, L. Visualizing Allometry: Geometric Morphometrics in the Study of Shape Changes in the Early Stages of the Two-Banded Sea Bream, Diplodus vulgaris (Perciformes, Sparidae). J. Morphol. 1998, 237, 137–146. [Google Scholar] [CrossRef]
- Osse, J.W.M.; van den Boogaart, J.G.M.; van Snik, G.M.J.; van der Sluys, L. Priorities during Early Growth of Fish Larvae. Aquaculture 1997, 155, 249–258. [Google Scholar] [CrossRef]
- Arnott, S.A.; Chiba, S.; Conover, D.O. Evolution of Intrinsic Growth Rate: Metabolic Cost Drive Trade-Offs between Growth and Swimming Performance in Menidia menidia. Evolution 2006, 60, 1269–1278. [Google Scholar] [CrossRef]
- Khemis, I.B.; Gisbert, E.; Alcaraz, C.; Zouiten, D.; Besbes, R.; Zouiten, A.; Masmoudi, A.S.; Cahu, C. Allometric Growth Patterns and Development in Larvae and Juveniles of Thick-Lipped Grey Mullet Chelon labrosus Reared in Mesocosm Conditions. Aquac. Res. 2013, 44, 1872–1888. [Google Scholar] [CrossRef] [Green Version]
- Dwyer, G.K.; Stoffels, R.J.; Pridmore, P.A. Morphology, Metabolism and Behaviour: Responses of Three Fishes with Different Lifestyles to Acute Hypoxia. Freshw. Biol. 2014, 59, 819–831. [Google Scholar] [CrossRef]
- Hirst, A.G.; Glazier, D.S.; Atkinson, D. Body Shape Shifting during Growth Permits Tests That Distinguish between Competing Geometric Theories of Metabolic Scaling. Ecol. Lett. 2014, 17, 1274–1281. [Google Scholar] [CrossRef] [Green Version]
- Florenza, A.; Galbraith, H.; Blakeslee, C.; Glazier, D. Ontogenetic Changes in Body Shape and the Scaling of Metabolic Rate in the American Eel (Anguilla rostrata). Physiol. Biochem. Zool. 2022, 95, 430–437. [Google Scholar] [CrossRef]
- Bookstein, F.L. Morphometric Tools for Landmark Data: Geometry and Biology; Cambridge Univeristy Press: New York, NY, USA, 1991. [Google Scholar] [CrossRef]
- James Rohlf, F.; Marcus, L.F. A Revolution Morphometrics. Trends. Ecol. Evol. 1993, 8, 129–132. [Google Scholar] [CrossRef] [PubMed]
- Kourkouta, C.; Printzi, A.; Geladakis, G.; Mitrizakis, N.; Papandroulakis, N.; Koumoundouros, G. Long Lasting Effects of Early Temperature Exposure on the Swimming Performance and Skeleton Development of Metamorphosing Gilthead Seabream (Sparus aurata L.). Larvae. Sci. Rep. 2021, 11, 8787. [Google Scholar] [CrossRef] [PubMed]
- Crichigno, S.A.; Battini, M.Á.; Cussac, V.E. Diet Induces Phenotypic Plasticity of Percichthys trucha (Valenciennes, 1833) (Perciformes, Percichthyidae) in Patagonia. Zool. Anz. 2014, 253, 192–202. [Google Scholar] [CrossRef]
- Gisbert, E. Early Development and Allometric Growth Patterns in Siberian Sturgeon and Their Ecological Significance. J. Fish. Biol. 1999, 54, 852–862. [Google Scholar] [CrossRef]
- Bernal-Durán, V.; Jahnsen-Guzmán, N.; Landaeta, M.F. Sharing Morphospaces: Early Ontogenetic Shape Changes in Two Clingfish Larvae (Pisces: Gobiesocidae) from the South-East Pacific Ocean. J. Fish. Biol. 2017, 91, 1510–1516. [Google Scholar] [CrossRef]
- Verhaegen, Y.; Adriaens, D.; de Wolf, T.; Dhert, P.; Sorgeloos, P. Deformities in Larval Gilthead Sea Bream (Sparus aurata): A Qualitative and Quantitative Analysis Using Geometric Morphometrics. Aquaculture 2007, 268, 156–168. [Google Scholar] [CrossRef] [Green Version]
- Jara, B.; Abarca, M.; Wilson, R.; Krapivka, S.; Mercado, A.; Guiñez, R.; Marchant, L. Qualitative Analysis of Cartilaginous Jaw Element Malformation in Cultured Yellowtail Kingfish (Seriola lalandi) Larvae. Aquac. Res. 2017, 48, 4420–4428. [Google Scholar] [CrossRef]
- Sánchez-González, J.R.; Nicieza, A.G. Declining Metabolic Scaling Parallels an Ontogenetic Change from Elongate to Deep-Bodied Shapes in Juvenile Brown Trout. Curr. Zool. 2022, 1–10. [Google Scholar] [CrossRef]
- Killen, S.S.; Glazier, D.S.; Rezende, E.L.; Clark, T.D.; Atkinson, D.; Willener, A.S.T.; Halsey, L.G. Ecological Influences and Morphological Correlates of Resting and Maximal Metabolic Rates across Teleost Fish Species. Am. Nat. 2016, 187, 592–606. [Google Scholar] [CrossRef] [Green Version]
- Petterson, L.B.; Brönmark, C. Energetic Consequences of an Inducible Morphological Defence in Crucian Carp. Oecologia 1999, 121, 12–18. [Google Scholar] [CrossRef]
- Latorre, D.; García-Berthou, E.; Rubio-Gracia, F.; Galobart, C.; Almeida, D.; Vila-Gispert, A. Captive Breeding Conditions Decrease Metabolic Rates and Alter Morphological Traits in the Endangered Spanish Toothcarp, Aphanius iberus. Int. Rev. Hydrobiol. 2020, 105, 119–130. [Google Scholar] [CrossRef]
- Tancioni, L.; Caprioli, R.; Dawood Al-Khafaji, A.H.; Mancini, L.; Boglione, C.; Ciccotti, E.; Cataudella, S. Anthropogenic Threats to Fish of Interest in Aquaculture: Gonad Intersex in a Wild Population of Thinlip Grey Mullet Liza ramada (Risso, 1827) from a Polluted Estuary in Central Italy. Aquac. Res. 2016, 47, 1670–1674. [Google Scholar] [CrossRef] [Green Version]
- Karapanagiotidis, I.T.; Karalazos, V.; Kougioumtzis, N.; Tsiamis, V.; Tsiaras, V.; Neofitou, C.; Karacostas, I.; Nengas, I. Growth and Feed Utilization by Golden Grey Mullet (Liza aurata) in a Coastal Lagoon Ecosystem, Fed Compound Feeds with Varying Protein Levels. Isr. J. Aquac-Bamidgeh. 2014, 66, 1–9. [Google Scholar] [CrossRef]
- Demir, N. On the Occurrence of Grey Mullet Postlarvae off Plymouth. J. Mar. Biolog. Assoc. 1971, 51, 235–246. [Google Scholar] [CrossRef]
- Boglione, C.; Bertolini, B.; Russiello, M.; Cataudella, S. Embryonic and Larval Development of the Thicklipped Mullet (Chelon labrosus) under Controlled Reproduction Conditions. Aquaculture 1992, 101, 349–359. [Google Scholar] [CrossRef]
- Loi, B.; Papadakis, I.E.; Leggieri, F.; Giménez Papiol, G.; Vallainc, D. Ontogeny of the Digestive System and Eye of Reared Flathead Grey Mullet, Mugil cephalus (Linnaeus, 1758), and Evaluation of Lipid Deposition in the Liver According to the Feeding Protocol. Aquaculture 2020, 526, 735386. [Google Scholar] [CrossRef]
- Rohlf, F.J.; Bookstein, F.L. Proceedings of the Michigan Morphometrics Workshop; Univeristy of Michigan Museum of Zoology: Ann Arbor, MI, USA, 1990; Volume 2. [Google Scholar]
- Ponton, D.; Carassou, L.; Raillard, S.; Borsa, P. Geometric Morphometrics as a Tool for Identifying Emperor Fish (Lethrinidae) Larvae and Juveniles. J. Fish. Biol. 2013, 83, 14–27. [Google Scholar] [CrossRef]
- Rohlf, F.J. The Tps Series of Software. Hystrix 2015, 26, 1–4. [Google Scholar] [CrossRef]
- Dryden, I.L.; Mardia, K.V. Statistical Shape Analysis; Willey: Chichester, UK, 1998. [Google Scholar]
- Goodall, C. Procrustes Methods in the Statistical Analysis of Shape. J. R Statl. Soc. Series B Stat. Methodol. 1991, 53, 285–321. [Google Scholar] [CrossRef]
- Rohlf, F.J.; Slice, D. Extensions of the Procrustes Method for the Optimal Superimposition of Landmarks. Soc. Syst. Biol. 1990, 39, 40–59. [Google Scholar] [CrossRef]
- Collyer, M.L.; Adams, D.C. RRPP: An r Package for Fitting Linear Models to High-Dimensional Data Using Residual Randomization. Methods Ecol. Evol. 2018, 9, 1772–1779. [Google Scholar] [CrossRef] [Green Version]
- Baken, E.K.; Collyer, M.L.; Kaliontzopoulou, A.; Adams, D.C. Geomorph v4.0 and GmShiny: Enhanced Analytics and a New Graphical Interface for a Comprehensive Morphometric Experience. Methods Ecol. Evol. 2021, 12, 2355–2363. [Google Scholar] [CrossRef]
- Bookstein, F.L. Landmark Methods for Forms without Landmarks: Morphometrics of Group Differences in Outline Shape. Med. Image. Anal. 1997, 1, 225–243. [Google Scholar] [CrossRef] [PubMed]
- Gauldie, R.W.; Crampton, J.S. An Eco-Morphological Explanation of Individual Variability in the Shape of the Fish Otolith: Comparison of the Otolith of Hoplostethus atlanticus with Other Species by Depth. J. Fish. Biol. 2002, 60, 1204–1221. [Google Scholar] [CrossRef]
- Hammer, D.A.T.; Ryan, P.D.; Hammer, Ø.; Harper, D.A.T. Past: Paleontological Statistics Software Package for Education and Data Analysis; 2001; Volume 4, Available online: http://palaeo-electronica.org (accessed on 25 June 2022).
- Packard, T.T.; Devol, A.H.; King, F.D. The Effect of Temperature on the Respiratory Electron Transport System in Marine Plankton. Deep Sea Res. Oceanogr. Abstr. 1975, 22, 237–249. [Google Scholar] [CrossRef]
- Gómez, M.; Torres, S.; Hernzández-León, S. Modification of the Electron Transport System (ETS) Method for Routine Measurements of Respiratory Rates of Zooplankton. Afr. J. Mar. Sci. 1996, 17, 15–20. [Google Scholar] [CrossRef] [Green Version]
- Lowry, O.H.; Rosebrough, N.J.; Farr, A.L.; Randall, R.J. Protein Measurment with the Folin Phenol Reagent. J. Biol. Chem. 1951, 193, 265–275. [Google Scholar] [CrossRef]
- Rutter, W.J. Methods in Developmental Biology; Wilt, H.F., Wessels, N.K., Eds.; Academic Press: London, UK, 1967; pp. 671–684. [Google Scholar]
- Zelditch, M.L.; Ye, J.; Mitchell, J.S.; Swiderski, D.L. Rare Ecomorphological Convergence on a Complex Adaptive Landscape: Body Size and Diet Mediate Evolution of Jaw Shape in Squirrels (Sciuridae). Evolution 2017, 71, 633–649. [Google Scholar] [CrossRef]
- Layman, C.A.; Langerhans, R.B.; Winemiller, K.O. Body Size, Not Other Morphological Traits, Characterizes Cascading Effects in Fish Assemblage Composition Following Commercial Netting. Can. J. Fish Aquat. Sci. 2005, 62, 2802–2810. [Google Scholar] [CrossRef]
- Ripley, B.; Venables, B.; Bates, D.M.; Hornik, K.; Gebhardt, A.; Firth, D. Package “Mass”; 2022. Available online: https://CRAN.R-project.org/package=MASS (accessed on 25 June 2022).
- Aitkin, M.; Francis, B.; Hinde, J.; Darnell, R. Statistical Modelling in R; Oxford University Press: Oxford, UK, 2009. [Google Scholar]
- Flikac, T.; Cook, D.G.; Davison, W.; Jerrett, A. Seasonal Growth Dynamics and Maximum Potential Growth Rates of Australasian Snapper (Chrysophrys auratus) and Yellow-Eyed Mullet (Aldrichetta Forsteri). Aquac. Rep. 2020, 17, 100306. [Google Scholar] [CrossRef]
- Quirós-Pozo, R.; Robaina, L.; Calderón, J.A.; Filgueira, J.R. Reproductive Management of the Mugilid Liza aurata and Characterization of Proximate and Fatty Acid Composition of Broodstock Tissues and Spawnings. Aquaculture 2023, 564, 739055. [Google Scholar] [CrossRef]
- Vallainc, D.; Concu, D.; Loi, B.; Pitzalis, A.; Frongia, C.; Chindris, A.; Carboni, S. Spawning Induction and Larval Rearing in the Thinlip Gray Mullet (Chelon ramada): The Use of the Slow Release Gonadotropin Releasing Hormone Analog (GnRHa) Preparation, Leuprorelin Acetate. Anim. Reprod. Sci. 2022, 247, 107145. [Google Scholar] [CrossRef]
- Crossety, D.; Blaber, S.J.M. Biology, Ecology and Culture of Grey Mullets (Mugilidae); CRC Press: Boca Raton, FL, USA, 2016; p. 539. [Google Scholar]
- Thieme, P.; Vallainc, D.; Moritz, T. Postcranial Skeletal Development of Mugil Cephalus (Teleostei: Mugiliformes): Morphological and Life-History Implications for Mugiliformes. Zool. J. Linn. Soc. 2021, 192, 1071–1089. [Google Scholar] [CrossRef]
- Peck, M.A.; Huebert, K.B.; Llopiz, J.K. Intrinsic and Extrinsic Factors Driving Match-Mismatch Dynamics During the Early Life History of Marine Fishes. Adv. Ecol. Res. 2012, 47, 177–302. [Google Scholar] [CrossRef]
- Olla, B.L.; Davis, M.W.; Ryer, C.H.; Sogard Olla, S.M.; Olla, B.L.; Davis, M.W.; Ryer, C.H. Behavioural Responses of Larval and Juvenile Walleye Pollock (Theragra chalcogramma): Possible Mechanisms Controlling Distribution and Recruitment. ICES Mar. Sci. Sym. 1995, 201, 3–15. [Google Scholar]
- Koumoundouros, G.; Ashton, C.; Xenikoudakis, G.; Giopanou, I.; Georgakopoulou, E.; Stickland, N. Ontogenetic Differentiation of Swimming Performance in Gilthead Seabream (Sparus aurata, Linnaeus 1758) during Metamorphosis. J. Exp. Mar. Biol. Ecol. 2009, 370, 75–81. [Google Scholar] [CrossRef]
- Downie, A.T.; Leis, J.M.; Cowman, P.F.; McCormick, M.I.; Rummer, J.L. The Influence of Habitat Association on Swimming Performance in Marine Teleost Fish Larvae. Fish Fish. 2021, 22, 1187–1212. [Google Scholar] [CrossRef]
- Dabrowski, K.R. Active Metabolism in Larval and Juvenile Fish: Ontogenetic Changes, Effect of Water Temperature and Fasting. Fish Physiol. Biochem. 1986, 1, 125–144. [Google Scholar] [CrossRef]
- Osse, J.W.M.; van den Boogaart, J.G.M. Fish Larvae, Development, Allometric Growth and the Aquatic Environment. ICES Mar. Sci. Sym. 1995, 201, 21–34. [Google Scholar]
- Yoklavich, M.M.; Bailey, K.M. Hatching Period, Growth and Survival of Young Walleye Pollock Theragra chalcogramma as Determined from Otolith Analysis. Mar. Ecol. Prog. Ser. 1990, 64, 13–23. [Google Scholar] [CrossRef]
- Toth, G.P.; Christ, S.A.; McCarthy, H.W.; Torsella, J.A.; Smith, M.K. Computer-Assisted Motion Analysis of Sperm from the Common Carp. J. Fish. Biol. 1995, 47, 986–1003. [Google Scholar] [CrossRef]
- Simčič, T.; Jesenšek, D.; Brancelj, A. Effects of Increased Temperature on Metabolic Activity and Oxidative Stress in the First Life Stages of Marble Trout (Salmo marmoratus). Fish Physiol. Biochem. 2015, 41, 1005–1014. [Google Scholar] [CrossRef] [PubMed]
- Myrick, C.A.; Cech, J.J. Temperature Influences on California Rainbow Trout Physiological Performance. Fish Physiol. Biochem. 2000, 22, 245–254. [Google Scholar] [CrossRef]
- Rombough, P.J. Growth, Aerobic Metabolism, and Dissolved Oxygen Requirements of Embryos and Alevins of Steelhead, Salmo gairdneri. Can. J. Zool. 1998, 66, 651–660. [Google Scholar] [CrossRef]
- Moyano, M.; Illing, B.; Christiansen, L.; Peck, M.A. Linking Rates of Metabolism and Growth in Marine Fish Larvae. Mar. Biol. 2018, 165, 5. [Google Scholar] [CrossRef]
- Müller, U.K.; van Leeuwen, J.L. Undulatory Fish Swimming: From Muscles to Flow. Fish Fish. 2006, 7, 84–103. [Google Scholar] [CrossRef]
- Nemova, N.N.; Lysenko, L.A.; Kantserova, N.P. Degradation of Skeletal Muscle Protein during Growth and Development of Salmonid Fish. Russ. J. Dev. Biol. 2016, 47, 161–172. [Google Scholar] [CrossRef]
- Galloway, T.F.; Kjorsvik, E.; Kryvi, H. Muscle Growth and Development in Atlantic Cod Larvae (Gadus morhua L.) Related to Different Somatic Growth Rates. J. Exp. Biol. 1999, 202, 2111–2120. [Google Scholar] [CrossRef]
- Lee, C.-S.; Menu, B. Effects of Salinity on Egg Development and Hatching in Grey Mullet Mugil cephalus L. J. Fish. Biol. 1981, 19, 179–188. [Google Scholar] [CrossRef]
- Loi, B.; Leggieri, F.; Giménez Papiol, G.; Carta, G.; Banni, S.; Carboni, S.; Vallainc, D. Effects of Salinity on Lipids Reserves, Survival and Growth of Flathead Grey Mullet Mugil cephalus (Linnaeus, 1758). Aquac. Res. 2022, 53, 5979–5987. [Google Scholar] [CrossRef]
- Walsh, M.R.; Munch, S.B.; Chiba, S.; Conover, D.O. Maladaptive Changes in Multiple Traits Caused by Fishing: Impediments to Population Recovery. Ecol. Lett. 2006, 9, 142–148. [Google Scholar] [CrossRef]
- Olukolajo, S.O.; Omolara, L.-A.-A. Salinity Tolerance of Grey Mullet, Mugil cephalus (Linnaeus) Fry in the Laboratory. J. Fish. Sci. 2013, 7, 292–296. [Google Scholar] [CrossRef]
- Pepin, P.; Robert, D.; Bouchard, C.; Dower, J.F.; Falardeau, M.; Fortier, L.; Jenkins, G.P.; Leclerc, V.; Levesque, K.; Llopiz, J.K.; et al. Once upon a Larva: Revisiting the Relationship between Feeding Success and Growth in Fish Larvae. ICES J. Mar. Sci. 2014, 72, 359–373. [Google Scholar] [CrossRef]


| df | SS | MS | Rsq | F | p | |
|---|---|---|---|---|---|---|
| Centroid | 1 | 0.199 | 0.199 | 0.465 | 215.52 | 0.001 |
| Stages | 1 | 0.023 | 0.023 | 0.054 | 25.11 | 0.001 |
| Residuals | 223 | 0.206 | 0.0009 | 0.481 | ||
| Total | 225 | 0.428 |
Disclaimer/Publisher’s Note: The statements, opinions and data contained in all publications are solely those of the individual author(s) and contributor(s) and not of MDPI and/or the editor(s). MDPI and/or the editor(s) disclaim responsibility for any injury to people or property resulting from any ideas, methods, instructions or products referred to in the content. |
© 2023 by the authors. Licensee MDPI, Basel, Switzerland. This article is an open access article distributed under the terms and conditions of the Creative Commons Attribution (CC BY) license (https://creativecommons.org/licenses/by/4.0/).
Share and Cite
Martinez-Leiva, L.; Landeira, J.M.; Fatira, E.; Díaz-Pérez, J.; Hernández-León, S.; Roo, J.; Tuset, V.M. Energetic Implications of Morphological Changes between Fish Larval and Juvenile Stages Using Geometric Morphometrics of Body Shape. Animals 2023, 13, 370. https://doi.org/10.3390/ani13030370
Martinez-Leiva L, Landeira JM, Fatira E, Díaz-Pérez J, Hernández-León S, Roo J, Tuset VM. Energetic Implications of Morphological Changes between Fish Larval and Juvenile Stages Using Geometric Morphometrics of Body Shape. Animals. 2023; 13(3):370. https://doi.org/10.3390/ani13030370
Chicago/Turabian StyleMartinez-Leiva, Lorena, José M. Landeira, Effrosyni Fatira, Javier Díaz-Pérez, Santiago Hernández-León, Javier Roo, and Víctor M. Tuset. 2023. "Energetic Implications of Morphological Changes between Fish Larval and Juvenile Stages Using Geometric Morphometrics of Body Shape" Animals 13, no. 3: 370. https://doi.org/10.3390/ani13030370