

Importance of Genetic–Fitness Correlations for the Conservation of Amphibians

Abstract
:Simple Summary
Abstract
1. Introduction
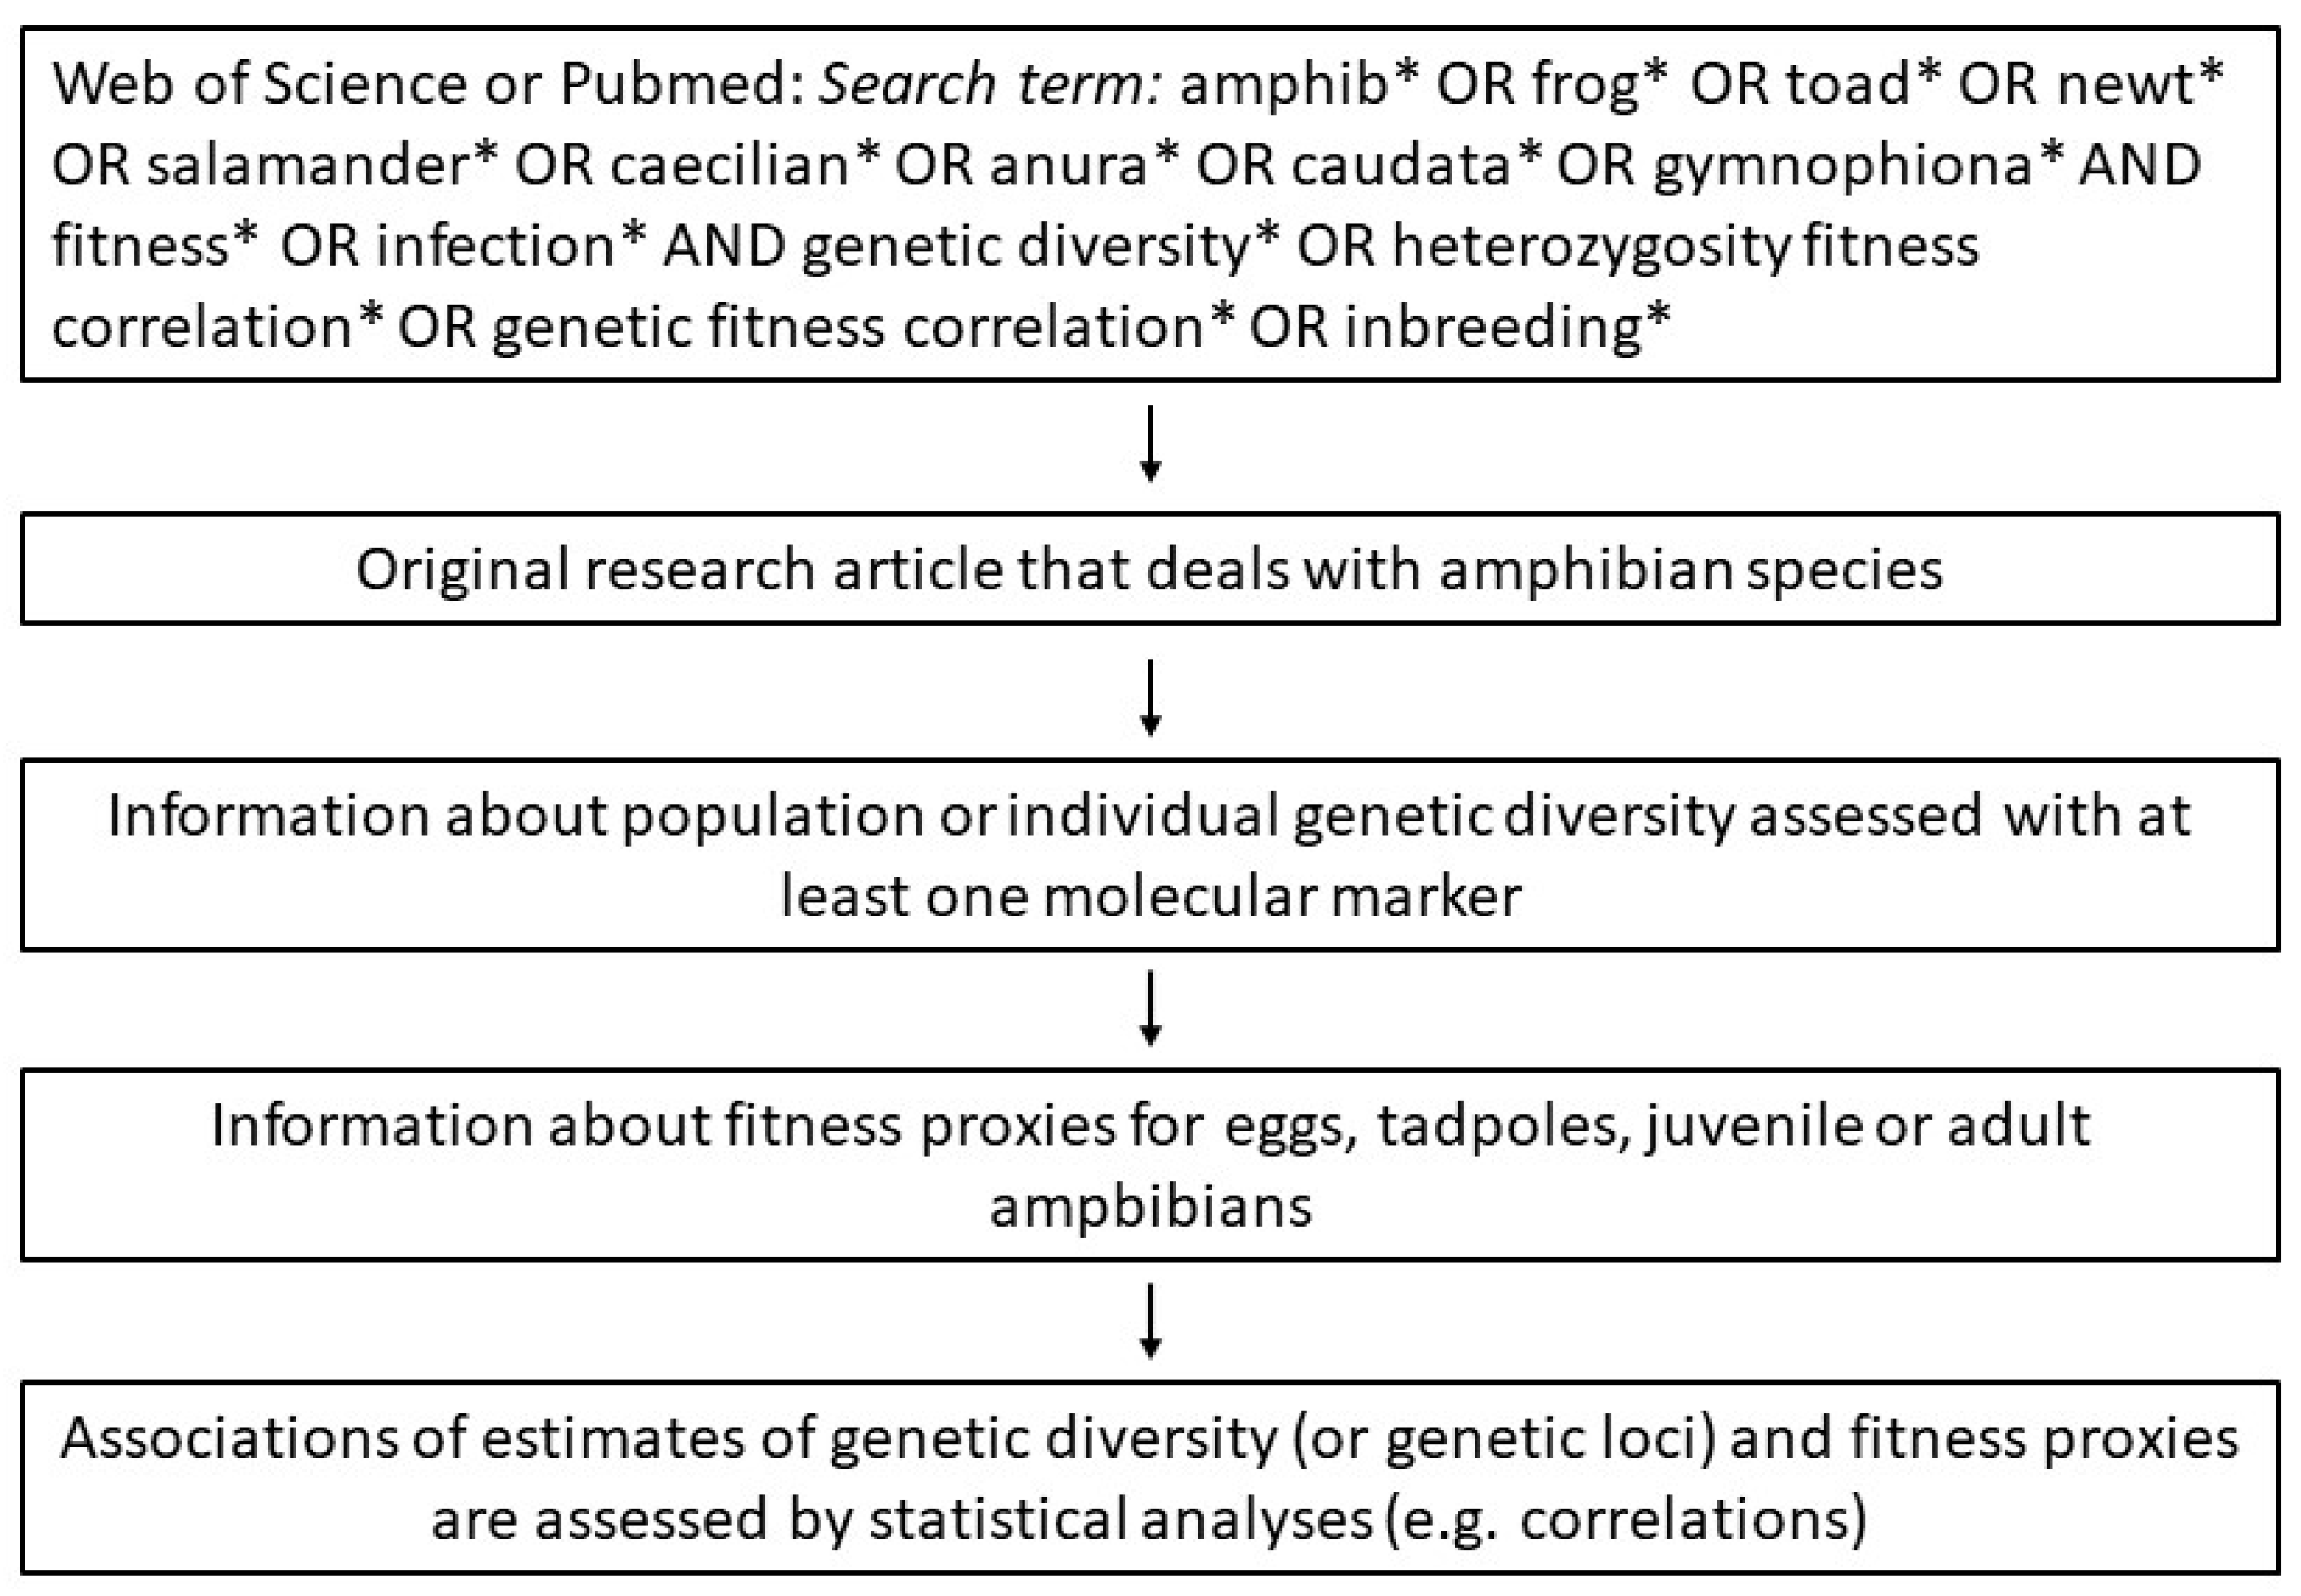
2. Material and Methods
3. Results
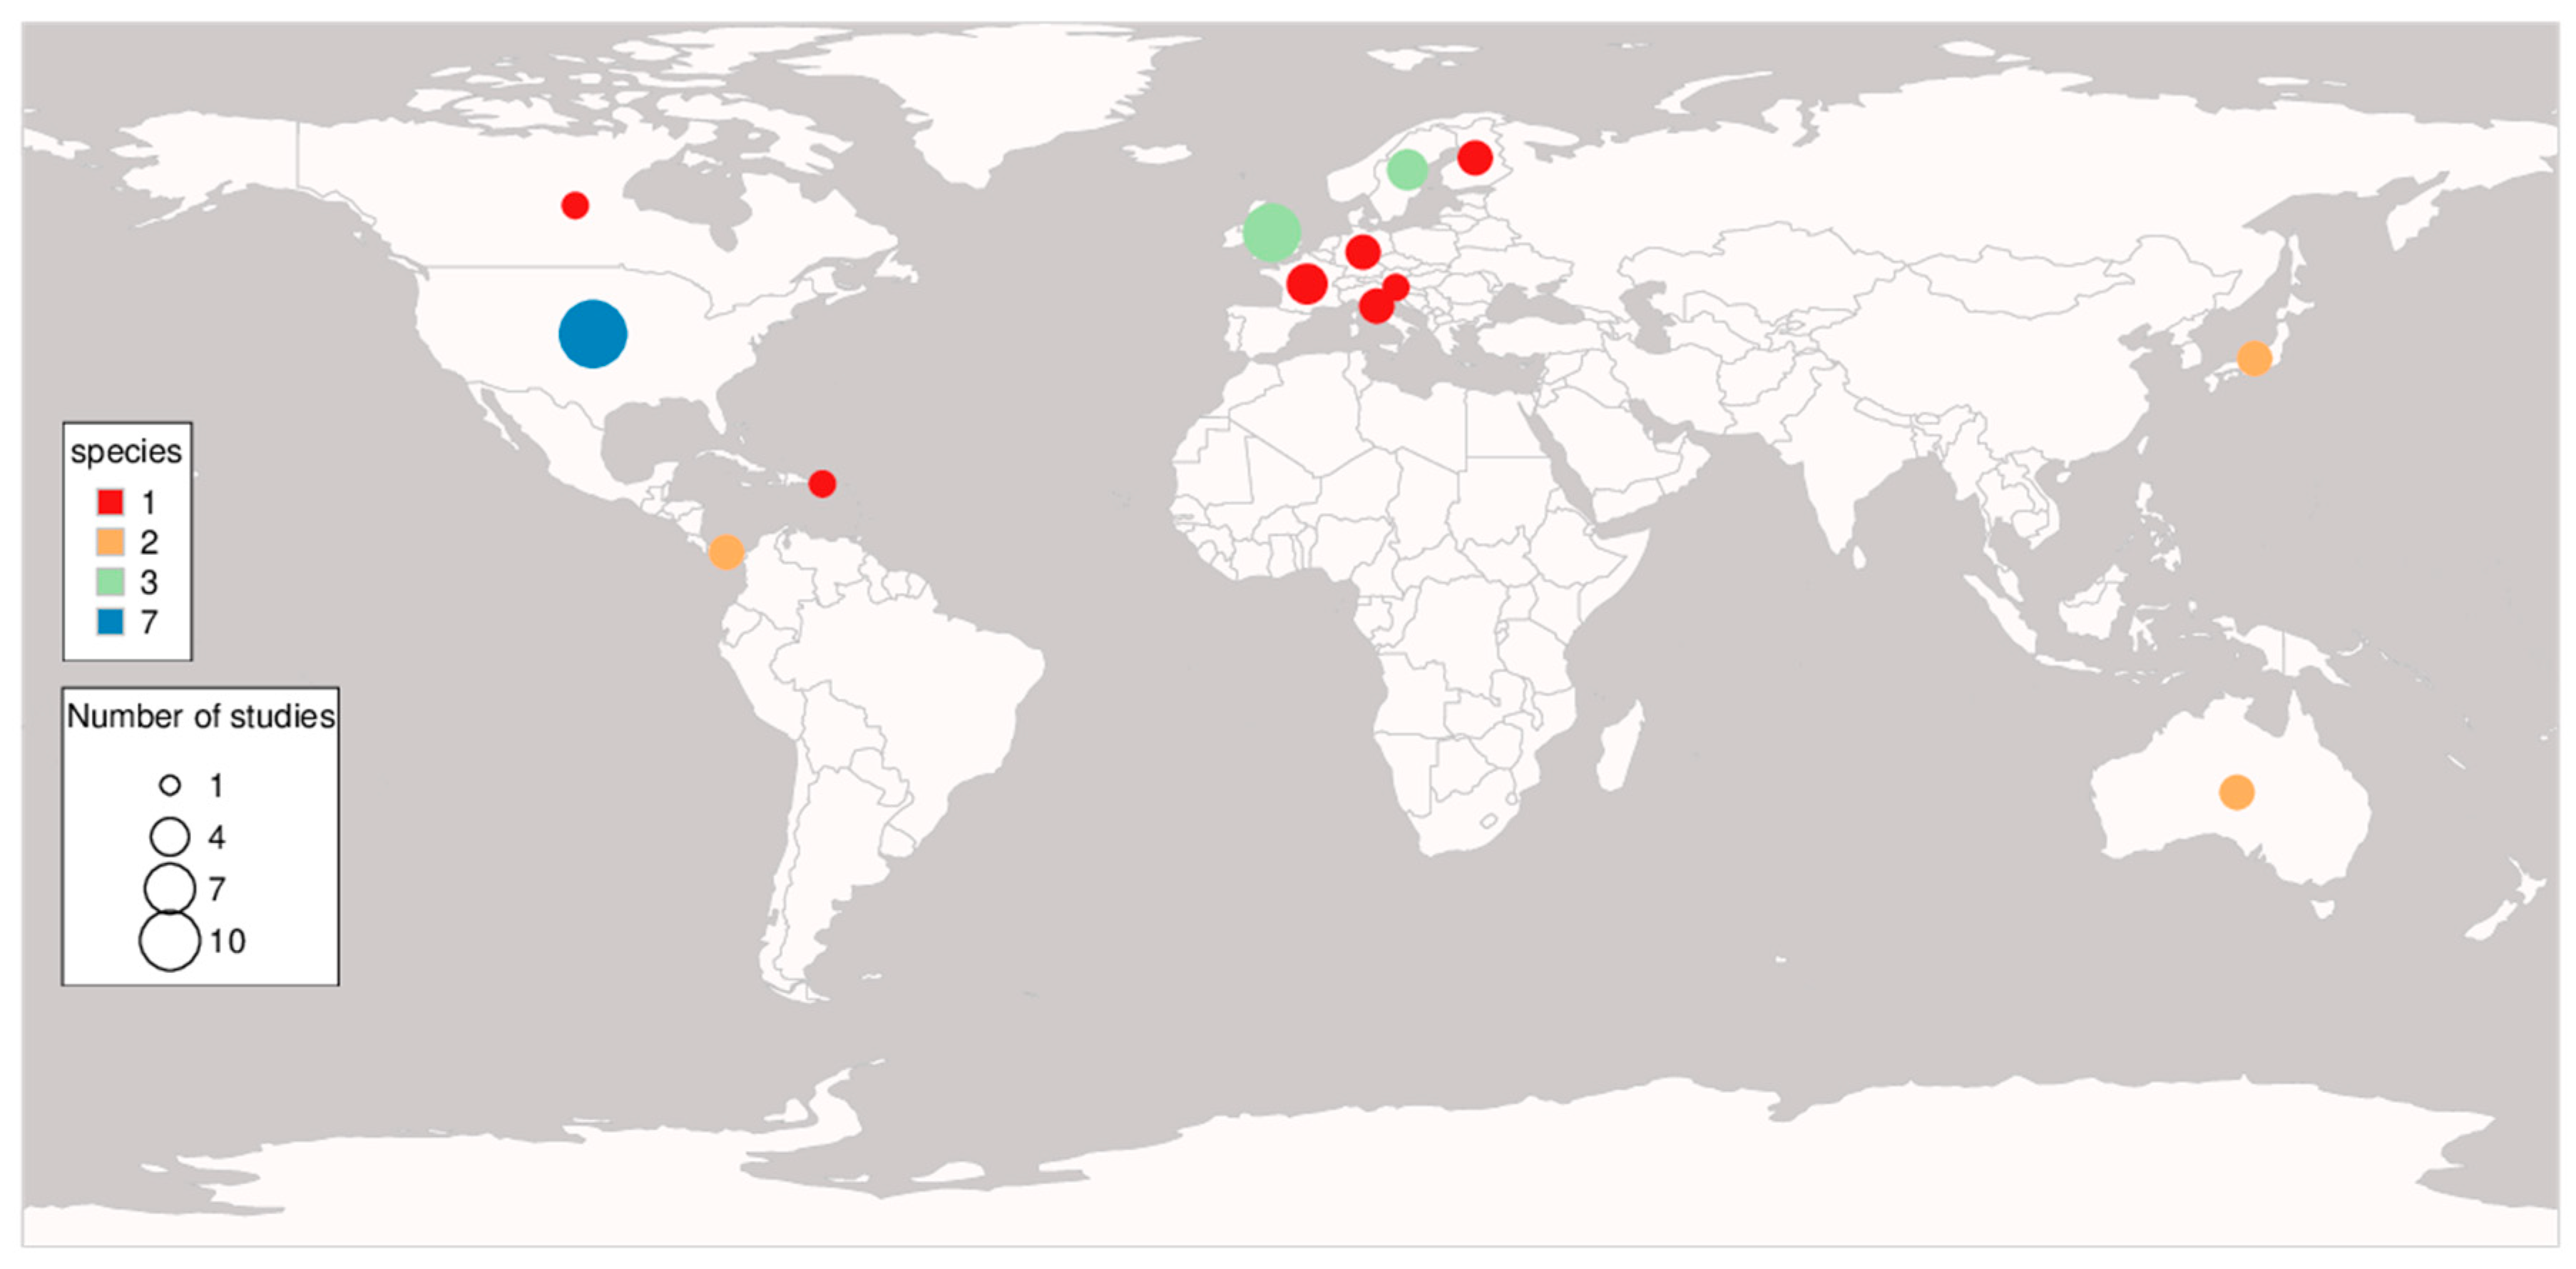
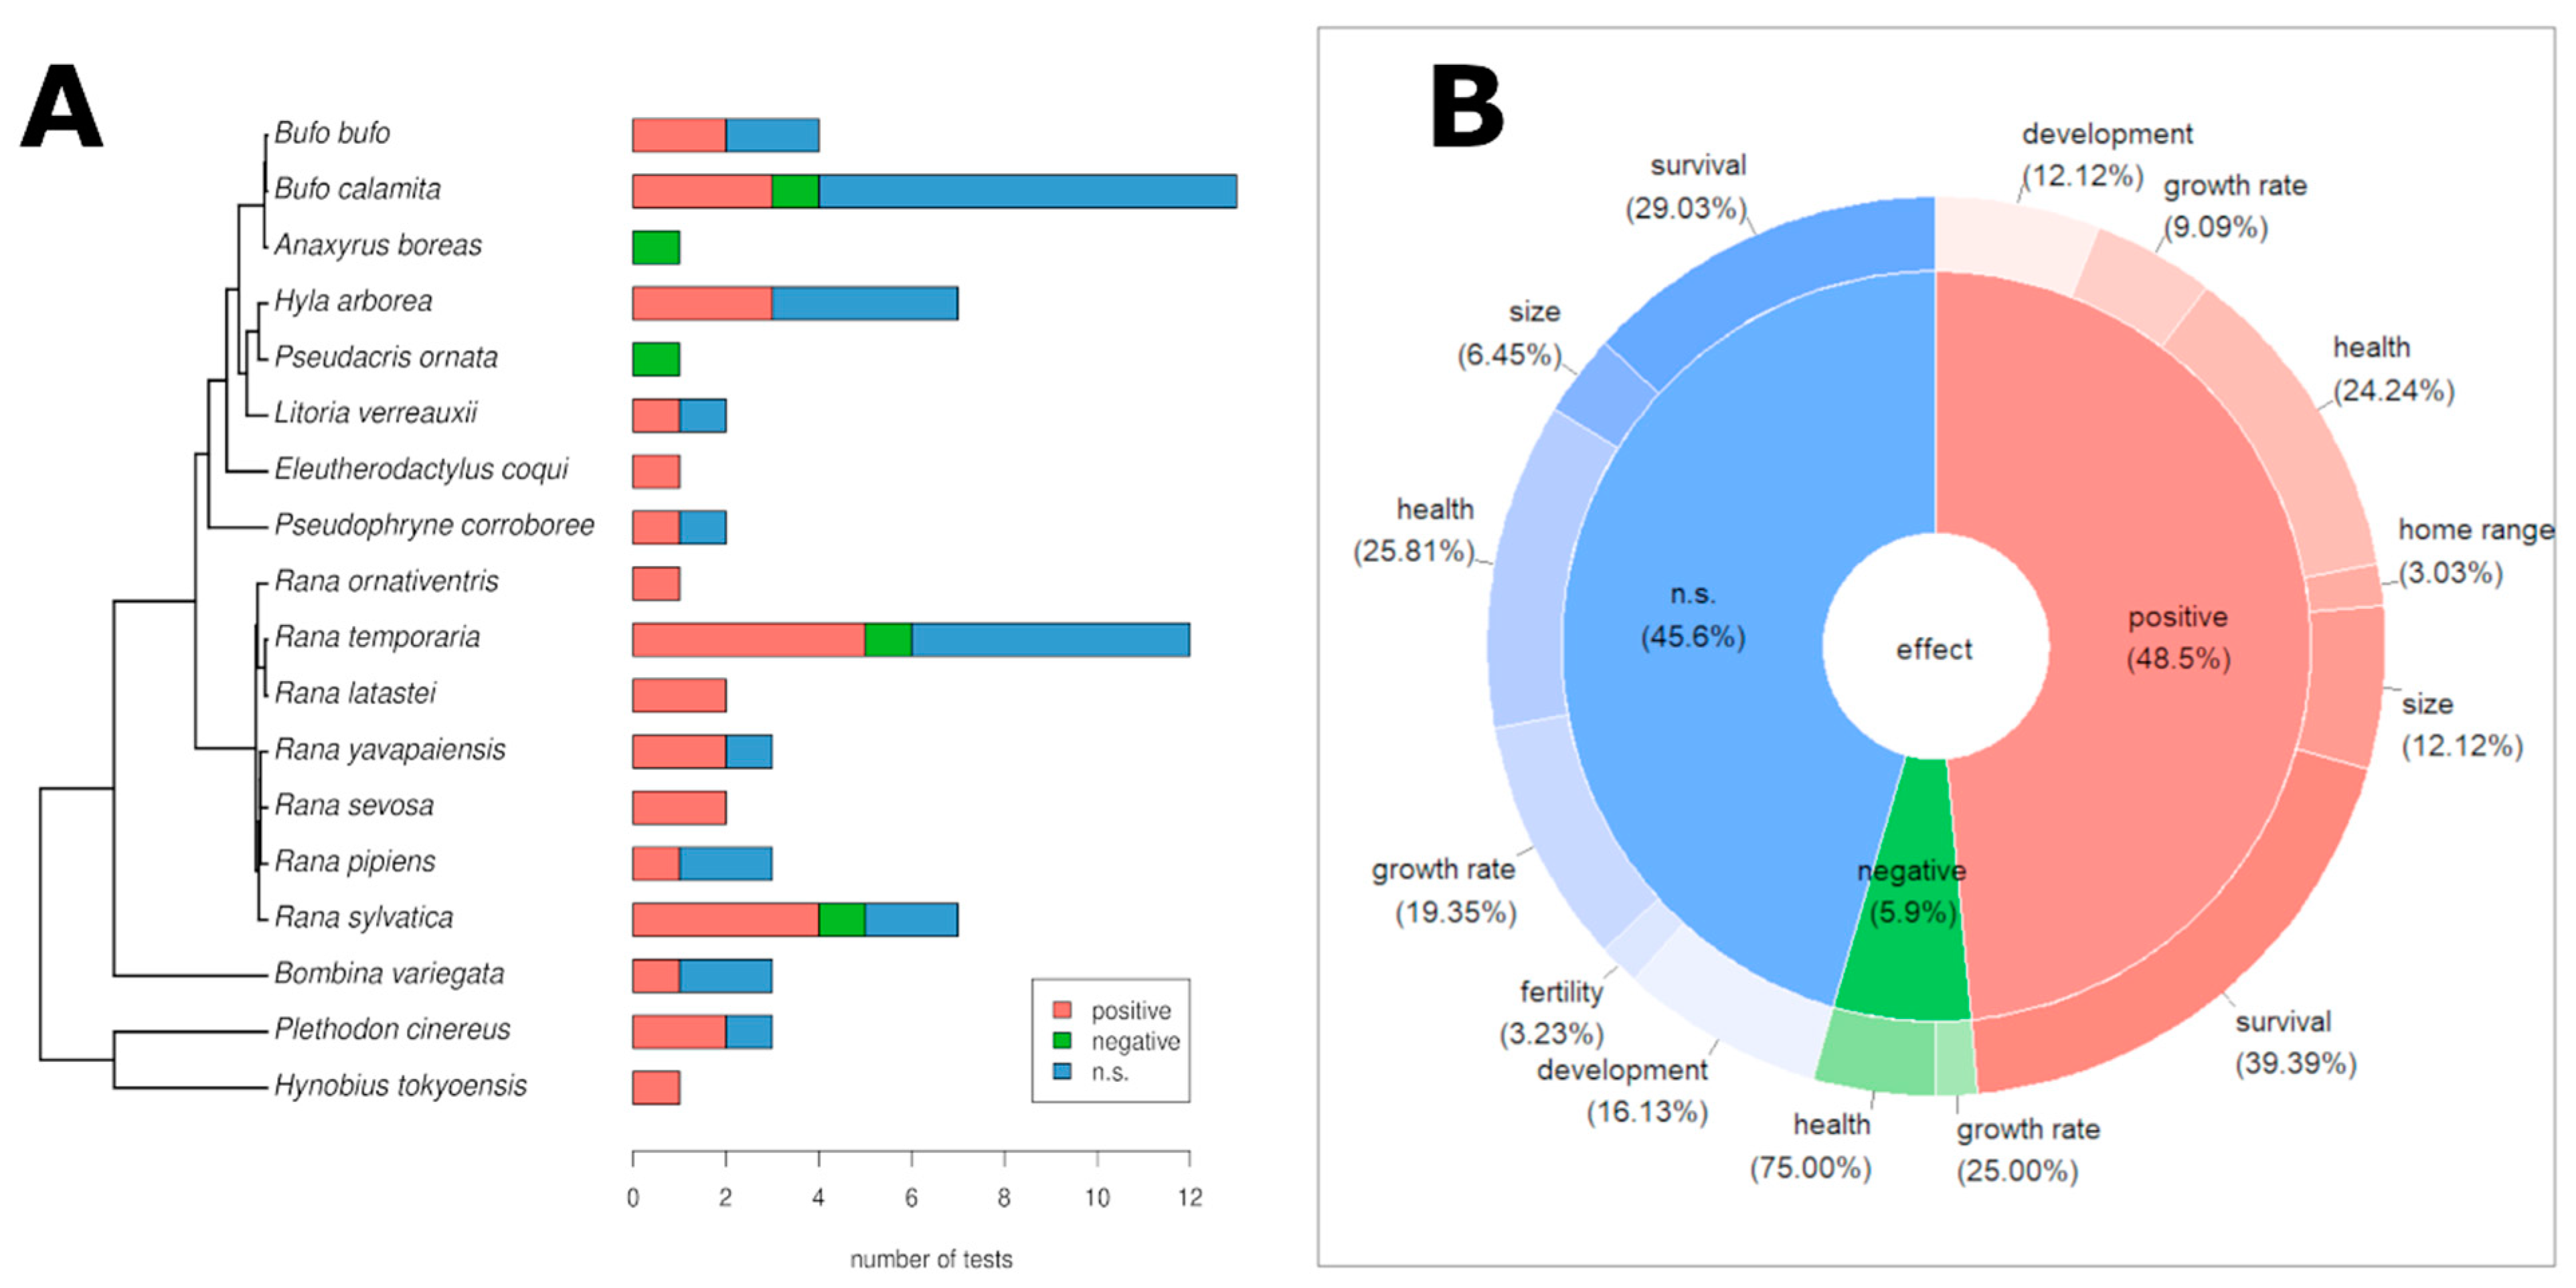
3.1. Study Overview
3.2. Genetic Diversity and Fitness

 . Those studies that contain information about GD and genetic loci associated with fitness appear twice in the table.
. Those studies that contain information about GD and genetic loci associated with fitness appear twice in the table.
. Those studies that contain information about GD and genetic loci associated with fitness appear twice in the table.| Species | Genetic Marker /Locus | Fitness Trait Correlated with GD | Correlation | Fitness trait Negatively Affected When Genetic Diversity Is Low | Fitness Traits Not Correlated with GD or Not Affected by Low GD | Citation |
|---|---|---|---|---|---|---|
| Bufo bufo | allozymes minisats | tadpole survival tadpole deformity | positive negative | tadpole survival tadpole deformity | [36] | |
| Bufo calamita | microsats | tadpole growth rate | positive | egg hatch rate | tadpole survival | [49] |
| Hyla arborea | allozymes | -- | -- | -- | egg hatch rate tadpole survival | [54] |
| Bufo calamita | microsats | -- | -- | -- | tadpole survival tadpole growth rate tadpole develop. rate tadpole time to metamorf. | [32] |
| Rana temporaria | microsats | -- | -- | -- | tadpole survival tadpole growth rate tadpole develop. rate tadpole time to metamorf. | [32] |
| Bufo calamita | microsats | tadpole survival tadpole growth rate | [48] | |||
| Rana temporaria | microsats | tadpole survival tadpole develop. rate tadpole growth rate | positive positive negative | [50] | ||
| Rana latastei | microsats | tadpole survival | positive | [55] | ||
| Rana sylvatica | microsats | sibship survival (eggs—tadpole stage) | positive | tadpole weight | [56] | |
| Rana sylvatica | RAPD | egg survival tadpole survival tadpole deformity | positive positive negative | [57] | ||
| Rana latastei | microsats | egg hatch rate | positive | [39] | ||
| Rana temporaria | microsats | tadpole body size tadpole survival | positive positive | [37] | ||
| Rana temporaria | microsats | tadpole weight | positive | age at metamorphosis | [58] | |
| Bufa calamita | AFLPs | tadpole survival | positive | [38] | ||
| Rana temporaria | microsats | tadpole growth rate tadpole survival | [40] | |||
| Hyla arborea | microsats | tadpole body mass tadpole length tadpole stage at 37 | positive positive positive * | [59] | ||
| Bufo calamita | microsats | Bd infection in population | positive | tadpole growth rate tadpole develop. time tadpole survival | [52] | |
| Hyla arborea | microsats | adult body size adult body condition reproductive investment | [60] | |||
| Lithobates sevosus | microsats | egg survival tadpole survival | positive positive | [61] | ||
| Anaxyrus boreas | microsats | adult Bd infection | positive | [45] | ||
| Lithobates yavapaiensis | microsats | adult Bd tolerance mortality | positive negative | infection intensity but GD lowest in uninfected pops. | [41] | |
| Pseudacris ornata | microsats | adult Bd infection | positive | [51] | ||
| Bombina variegata | microsats | adult Bd infection | [62] | |||
| Plethodon cinereus | microsats | adult home range size juvenile growth rate | positive positive | juvenile survival | [63] | |
| Hynobius tokyensis | microsats | egg survival | positive | [33] | ||
| Rana ornativentris | CytB | egg survival | positive | |||
| Pseudophryne cooroboree | SNPs | adult survival after Bd infection | positive | adult infection load | [42] | |
| Rana sylvatica | MHC II β | tadpole Ranavirus infection intensity | negative | Ranavirus infection prevalence | [64] | |
| Litoria verreauxii | genomic SNPs | adult Bd infection | negative | adult Bd infection intensity | [46] | |
| Bombina variegata | microsats | adult Bd infection | negative | adult Bd infection intensity | [65] | |
| Rana pipiens | MHC II β exon 2 microsats/mtDNA | adult Bd infection | negative | adult Bd infection intensity adult Bd infection and inf. intensity | [53] | |
| Eleutherodactylus coqui | genomic SNPs | adult Bd infection | negative | [66] | ||
| Genetic locus | ||||||
| Rana temporaria | MHC II β exon 2 | tadpole survival | allele C overrepresented, allele H underrepresented in dead tadpoles | [40] | ||
| Bufo calamita | MHC II β exon 2 | Bd infection in population | MHC diversity higher in uninfected populations | [52] | ||
| Lithobates yavapaiensis | MHC II β exon 2 | adult frog survival after Bd infection | MHC heterozygotes and Allele Q | [67] | ||
| Physalaemus pustulosus | MHC II β exon 1 | Bd infection | Bd resistant allele P9 at higher frequency in pop most affected by Bd | [68] | ||
| Pseudophryne corroboree | MHC I A | Bd infection | some alleles pos. associated with infection load and susceptibility | [42] | ||
| Rana sylvatica | MHC II β | Ranavirus infection | intensity lowest in individuals with genotype ST1/ST7 | [64] | ||
| Atelopus varius Atelopus zeteki | transcriptome sequences | survival of Bd infection | candidate genes related to immune system and skin integrity associated with survival | [69] | ||
| Rana pipiens | MHC II β exon 2 | Bd infection | Supertype 4 conveys increased risk of infection | [53] | ||
3.3. Effects of Genetic Diversity on Ecological Fitness Traits
3.4. Effects of Genetic Diversity on Demographic and Health-Related Fitness Traits
4. Discussion
4.1. Genetic–Fitness Correlations
4.2. Population Size and Fragmentation
4.3. Candidate Loci and Adaptive Markers
4.4. Interactions with Environmental Conditions
4.5. Recommendation for Further Studies
5. Conclusions
Supplementary Materials
Author Contributions
Funding
Informed Consent Statement
Data Availability Statement
Conflicts of Interest
References
- Frankham, R. Genetics and extinction. Biol. Conserv. 2005, 126, 131–140. [Google Scholar] [CrossRef]
- Allendorf, F.W. Genetics and the conservation of natural populations: Allozymes to genomes. Mol. Ecol. 2017, 26, 420–430. [Google Scholar] [CrossRef] [PubMed]
- Lande, R. Mutation and Conservation. Conserv. Biol. 1995, 9, 782–791. [Google Scholar] [CrossRef]
- Lynch, M.; Conery, J.; Burger, R. Mutation accumulation and the extinction of small populations. Am. Nat. 1995, 146, 489–518. [Google Scholar] [CrossRef]
- Keller, L.F.; Waller, D.M. Inbreeding effects in wild populations. Trends Ecol. Evol. 2002, 17, 230–241. [Google Scholar] [CrossRef]
- Reed, D.H.; Frankham, R. Correlation between fitness and genetic diversity. Conserv. Biol. 2003, 17, 230–237. [Google Scholar] [CrossRef]
- Meagher, S. Genetic diversity and Capillaria hepatica (Nematoda) prevalence in Michigan deer mouse populations. Evolution 1999, 53, 1318–1324. [Google Scholar] [CrossRef] [PubMed]
- Hitchings, S.P.; Beebee, T.J.C. Persistence of British natterjack toad Bufo calamita Laurenti (Anura: Bufonidae) populations despite low genetic diversity. Biol. J. Linn. Soc. 1996, 57, 69–80. [Google Scholar] [CrossRef]
- Broders, H.G.; Mahoney, S.P.; Montevecchi, W.A.; Davidson, W.S. Population genetic structure and the effect of founder events on the genetic variability of moose, Alces alces, in Canada. Mol. Ecol. 1999, 8, 1309–1315. [Google Scholar] [CrossRef] [PubMed]
- Reed, D.H. Albatrosses, eagles and newts, Oh My!: Exceptions to the prevailing paradigm concerning genetic diversity and population viability? Anim. Conserv. 2010, 13, 448–457. [Google Scholar] [CrossRef]
- Ujvari, B.; Madsen, T.; Kotenko, T.; Olsson, M.; Shine, R.; Wittzell, H. Low genetic diversity threatens imminent extinction for the Hungarian meadow viper (Vipera ursinii rakosiensis). Biol. Conserv. 2002, 105, 127–130. [Google Scholar] [CrossRef]
- Fredrickson, R.J.; Siminski, P.; Woolf, M.; Hedrick, P.W. Genetic rescue and inbreeding depression in Mexican wolves. Proc. R. Soc. B Biol. Sci. 2007, 274, 2365–2371. [Google Scholar] [CrossRef] [PubMed]
- Sundell, T.; Kammonen, J.I.; Mustanoja, E.; Biard, V.; Kunnasranta, M.; Niemi, M.; Nykanen, M.; Nyman, T.; Palo, J.U.; Valtonen, M.; et al. Genomic evidence uncovers inbreeding and supports translocations in rescuing the genetic diversity of a landlocked seal population. Conserv. Genet. 2023, 24, 155–165. [Google Scholar] [CrossRef]
- Evans, S.R.; Sheldon, B.C. Interspecific patterns of genetic diversity in birds: Correlations with extinction risk. Conserv. Biol. 2008, 22, 1016–1025. [Google Scholar] [CrossRef] [PubMed]
- Weeks, A.R.; Stoklosa, J.; Hoffmann, A.A. Conservation of genetic uniqueness of populations may increase extinction likelihood of endangered species: The case of Australian mammals. Front. Zool. 2016, 13, 31. [Google Scholar] [CrossRef] [PubMed]
- Weeks, A.R.; Sgro, C.M.; Young, A.G.; Frankham, R.; Mitchell, N.J.; Miller, K.A.; Byrne, M.; Coates, D.J.; Eldridge, M.D.B.; Sunnucks, P.; et al. Assessing the benefits and risks of translocations in changing environments: A genetic perspective. Evol. Appl. 2011, 4, 709–725. [Google Scholar] [CrossRef]
- Frankham, R. Genetic rescue of small inbred populations: Meta-analysis reveals large and consistent benefits of gene flow. Mol. Ecol. 2015, 24, 2610–2618. [Google Scholar] [CrossRef]
- Selkoe, K.A.; Toonen, R.J. Microsatellites for ecologists: A practical guide to using and evaluating microsatellite markers. Ecol. Lett. 2006, 9, 615–629. [Google Scholar] [CrossRef]
- Hohenlohe, P.A.; Funk, W.C.; Rajora, O.P. Population genomics for wildlife conservation and management. Mol. Ecol. 2021, 30, 62–82. [Google Scholar] [CrossRef]
- Hoffmann, M.; Hilton-Taylor, C.; Angulo, A.; Böhm, M.; Brooks, T.; Butchart, S.; Carpenter, K.E.; Chanson, J.; Collen, B.; Cox, N.A.; et al. The impact of conservation on the status of the world’s vertebrates. Science 2010, 330, 1503–1509. [Google Scholar] [CrossRef]
- IUCN. The IUCN Red List of Threatened Species. Available online: www.iucnredlist.com (accessed on 2 October 2023).
- Stuart, S.N.; Chanson, J.S.; Cox, N.A.; Young, B.E.; Rodrigues, A.S.L.; Fischman, D.L.; Waller, R.W. Status and trends of amphibian declines and extinctions worldwide. Science 2004, 306, 1783–1786. [Google Scholar] [CrossRef] [PubMed]
- Scheele, B.C.; Pasmans, F.; Skerratt, L.F.; Berger, L.; AnMartel; Beukema, W.; Acevedo, A.A.; Burrowes, P.A.; Carvalho, T.; Catenazzi, A.; et al. Amphibian fungal panzootic causes catastrophic and ongoing loss of biodiversity. Science 2019, 363, 1459–1463. [Google Scholar] [CrossRef] [PubMed]
- Hantzschmann, A.M.; Sinsch, U.; Gottlicher, C.; Prohl, H. Conservation genetics of yellow-bellied toads (Bombina variegata): A matter of geographical scale and isolation. Conserv. Genet. 2021, 22, 83–96. [Google Scholar] [CrossRef]
- Pröhl, H.; Auffarth, J.; Bergmann, T.; Buschmann, H.; Balkenhol, N. Conservation genetics of the yellow-bellied toad (Bombina variegata): Population structure, genetic diversity and landscape effects in an endangered amphibian. Conserv. Genet. 2021, 22, 513–529. [Google Scholar] [CrossRef]
- Blouin, M.S.; Phillipsen, I.C.; Monsen, K.J. Population structure and conservation genetics of the Oregon spotted frog, Rana pretiosa. Conserv. Genet. 2010, 11, 2179–2194. [Google Scholar] [CrossRef]
- Blank, L.; Sinai, I.; Bar-David, S.; Peleg, N.; Segev, O.; Sadeh, A.; Kopelman, N.M.; Templeton, A.R.; Merila, J.; Blaustein, L. Genetic population structure of the endangered fire salamander (Salamandra infraimmaculata) at the southernmost extreme of its distribution. Anim. Conserv. 2013, 16, 412–421. [Google Scholar] [CrossRef]
- Cushman, S.A. Effects of habitat loss and fragmentation on amphibians: A review and prospectus. Biol. Conserv. 2006, 128, 231–240. [Google Scholar] [CrossRef]
- Allentoft, M.E.; O’Brien, J. Global amphibian declines, loss of genetic diversity and fitness: A review. Diversity 2010, 2, 47–71. [Google Scholar] [CrossRef]
- Jetz, W.; Pyron, R.A. The interplay of past diversification and evolutionary isolation with present imperilment across the amphibian tree of life. Nat. Ecol. Evol. 2018, 2, 850–858. [Google Scholar] [CrossRef]
- Revell, L.J. phytools: An R package for phylogenetic comparative biology (and other things). Methods Ecol. Evol. 2012, 3, 217–223. [Google Scholar] [CrossRef]
- Rowe, G.; Beebee, T.J.C. Fitness and microsatellite diversity estimates were not correlated in two outbred anuran populations. Heredity 2001, 87, 558–565. [Google Scholar] [CrossRef] [PubMed]
- Okamiya, H.; Kusano, T. Lower genetic diversity and hatchability in amphibian populations isolated by urbanization. Popul. Ecol. 2018, 60, 347–360. [Google Scholar] [CrossRef]
- Belasen, A.M.; Amses, K.R.; Clemons, R.A.; Becker, C.G.; Toledo, L.F.; James, T.Y. Habitat fragmentation in the Brazilian Atlantic Forest is associated with erosion of frog immunogenetic diversity and increased fungal infections. Immunogenetics 2022, 74, 431–441. [Google Scholar] [CrossRef]
- Byrne, P.G.; Whiting, M.J. Effects of simultaneous polyandry on offspring fitness in an African tree frog. Behav. Ecol. 2011, 22, 385–391. [Google Scholar] [CrossRef]
- Hitchings, S.P.; Beebee, T.J.C. Loss of genetic diversity and fitness in Common Toad (Bufo bufo) populations isolated by inimical habitat. J. Evol. Biol. 1998, 11, 269–283. [Google Scholar] [CrossRef]
- Johansson, M.; Primmer, C.R.; Merila, J. Does habitat fragmentation reduce fitness and adaptability? A case study of the common frog (Rana temporaria). Mol. Ecol. 2007, 16, 2693–2700. [Google Scholar] [CrossRef]
- Rogell, B.; Thorngren, H.; Laurila, A.; Hoglund, J. Fitness costs associated with low genetic variation are reduced in a harsher environment in amphibian island populations. Conserv. Genet. 2010, 11, 489–496. [Google Scholar] [CrossRef]
- Ficetola, G.F.; Garner, T.W.; De Bernardi, F. Genetic diversity, but not hatching success, is jointly affected by postglacial colonization and isolation in the threatened frog, Rana latastei. Mol. Ecol. 2007, 16, 1787–1797. [Google Scholar] [CrossRef]
- Zeisset, I.; Beebee, T.J.C. Larval fitness, microsatellite diversity and MHC class II diversity in common frog (Rana temporaria) populations. Heredity 2010, 104, 423–430. [Google Scholar] [CrossRef]
- Savage, A.E.; Becker, C.G.; Zamudio, K.R. Linking genetic and environmental factors in amphibian disease risk. Evol. Appl. 2015, 8, 560–572. [Google Scholar] [CrossRef]
- Kosch, T.A.; Silva, C.N.S.; Brannelly, L.A.; Roberts, A.A.; Lau, Q.; Marantelli, G.; Berger, L.; Skerratt, L.F. Genetic potential for disease resistance in critically endangered amphibians decimated by chytridiomycosis. Anim. Conserv. 2019, 22, 238–250. [Google Scholar] [CrossRef]
- Pritchard, J.K.; Stephens, M.; Donnelly, P. Inference of population structure using multilocus genotype data. Genetics 2000, 155, 945–959. [Google Scholar] [CrossRef] [PubMed]
- Skotte, L.; Korneliussen, T.S.; Albrechtsen, A. Estimating Individual Admixture Proportions from Next Generation Sequencing Data. Genetics 2013, 195, 693–702. [Google Scholar] [CrossRef] [PubMed]
- Addis, B.R.; Lowe, W.H.; Hossack, B.R.; Allendorf, F.W. Population genetic structure and disease in montane boreal toads: More heterozygous individuals are more likely to be infected with amphibian chytrid. Conserv. Genet. 2015, 16, 833–844. [Google Scholar] [CrossRef]
- Banks, S.; Scheele, B.; Macris, A.; Hunter, D.; Jack, C.; Fraser, C. Chytrid fungus infection in alpine tree frogs is associated with individual heterozygosity and population isolation but not population-genetic diversity. Front. Biogeogr. 2020, 12. [Google Scholar] [CrossRef]
- Luquet, E.; Garner, T.W.; Lena, J.P.; Bruel, C.; Joly, P.; Lengagne, T.; Grolet, O.; Plenet, S. Genetic erosion in wild populations makes resistance to a pathogen more costly. Evolution 2012, 66, 1942–1952. [Google Scholar] [CrossRef]
- Rowe, G.; Beebee, T.J.C. Population on the verge of a mutational meltdown? Fitness costs of genetic load for an amphibian in the wild. Evolution 2003, 57, 177–181. [Google Scholar] [CrossRef]
- Rowe, G.; Beebee, T.J.C.; Burke, T. Microsatellite heterozygosity, fitness and demography in natterjack toads Bufo calamita. Anim. Conserv. 1999, 2, 85–92. [Google Scholar] [CrossRef]
- Lesbarrères, D.; Primmer, C.R.; Laurilà, A.; Merilà, J. Environmental and population dependency of genetic variability-fitness correlations in Rana temporaria. Mol. Ecol. 2005, 14, 311–323. [Google Scholar] [CrossRef]
- Horner, A.A.; Hoffman, E.A.; Tye, M.R.; Hether, T.D.; Savage, A.E. Cryptic chytridiomycosis linked to climate and genetic variation in amphibian populations of the southeastern United States. PLoS ONE 2017, 12, e0175843. [Google Scholar] [CrossRef]
- May, S.; Zeisset, I.; Beebee, T.J.C. Larval fitness and immunogenetic diversity in chytrid-infected and uninfected natterjack toad (Bufo calamita) populations. Conserv. Genet. 2011, 12, 805–811. [Google Scholar] [CrossRef]
- Trujillo, A.L.; Hoffman, E.A.; Becker, C.G.; Savage, A.E. Spatiotemporal adaptive evolution of an MHC immune gene in a frog-fungus disease system. Heredity 2021, 126, 640–655. [Google Scholar] [CrossRef] [PubMed]
- Edenhamn, P.; Hoggren, M.; Carlson, A. Genetic diversity and fitness in peripheral and central populations of the European tree frog Hyla arborea. Hereditas 2000, 133, 115–122. [Google Scholar] [CrossRef] [PubMed]
- Pearman, P.B.; Garner, T.W.J. Susceptibility of Italian agile frog populations to an emerging strain of Ranavirus parallels population genetic diversity. Ecol. Lett. 2005, 8, 401–408. [Google Scholar] [CrossRef]
- Halverson, M.A.; Skelly, D.K.; Caccone, A. Inbreeding Linked to Amphibian Survival in the Wild but Not in the Laboratory. J. Hered. 2006, 97, 499–507. [Google Scholar] [CrossRef] [PubMed]
- Weyrauch, S.L.; Grubb, T.C. Effects of the interaction between genetic diversity and UV-B radiation on wood frog fitness. Conserv. Biol. 2006, 20, 802–810. [Google Scholar] [CrossRef]
- Lesbarreres, D.; Schmeller, D.S.; Primmer, C.R.; Merila, J. Genetic variability predicts common frog (Rana temporaria) size at metamorphosis in the wild. Heredity 2007, 99, 41–46. [Google Scholar] [CrossRef]
- Luquet, E.; David, P.; Lena, J.P.; Joly, P.; Konecny, L.; Dufresnes, C.; Perrin, N.; Plenet, S. Heterozygosity-fitness correlations among wild populations of European tree frog (Hyla arborea) detect fixation load. Mol. Ecol. 2011, 20, 1877–1887. [Google Scholar] [CrossRef]
- Luquet, E.; Lena, J.P.; David, P.; Prunier, J.; Joly, P.; Lengagne, T.; Perrin, N.; Plenet, S. Within- and among-population impact of genetic erosion on adult fitness-related traits in the European tree frog Hyla arborea. Heredity 2013, 110, 347–354. [Google Scholar] [CrossRef]
- Richter, S.C.; Nunziata, S.O. Survival to metamorphosis is positively related to genetic variability in a critically endangered amphibian species. Anim. Conserv. 2014, 17, 265–274. [Google Scholar] [CrossRef]
- Wagner, N.; Neubeck, C.; Guicking, D.; Finke, L.; Wittich, M.; Weising, K.; Geske, C.; Veith, M. No evidence for effects of infection with the amphibian chytrid fungus on populations of yellow-bellied toads. Dis. Aquat. Org. 2017, 123, 55–65. [Google Scholar] [CrossRef] [PubMed]
- Liebgold, E.B.; Kramer, C.F.; Roomian, T.C.; Dolezar, G.M.; Cabe, P.R. Heterozygosity-behavior and heterozygosity-fitness correlations in a salamander with limited dispersal. Popul. Ecol. 2018, 60, 251–260. [Google Scholar] [CrossRef]
- Savage, A.E.; Muletz-Wolz, C.R.; Grant, E.H.C.; Fleischer, R.C.; Mulder, K.P. Functional variation at an expressed MHC class II locus associates with Ranavirus infection intensity in larval anuran populations. Immunogenetics 2019, 71, 335–346. [Google Scholar] [CrossRef] [PubMed]
- Oswald, P.; Rodriguez, A.; Bourke, J.; Wagner, N.; de Buhr, N.; Buschmann, H.; von Kockritz-Blickwede, M.; Prohl, H. Locality, time and heterozygosity affect chytrid infection in yellow-bellied toads. Dis. Aquat. Org. 2020, 142, 225–237. [Google Scholar] [CrossRef] [PubMed]
- Torres-Sanchez, M.; Longo, A.V. Linking pathogen-microbiome-host interactions to explain amphibian population dynamics. Mol. Ecol. 2022, 31, 5784–5794. [Google Scholar] [CrossRef] [PubMed]
- Savage, A.E.; Zamudio, K.R. MHC genotypes associate with resistance to a frog-killing fungus. Proc. Natl. Acad. Sci. USA 2011, 108, 16705–16710. [Google Scholar] [CrossRef]
- Kosch, T.A.; Bataille, A.; Didinger, C.; Eimes, J.A.; Rodriguez-Brenes, S.; Ryan, M.J.; Waldman, B. Major histocompatibility complex selection dynamics in pathogen-infected tungara frog (Physalaemus pustulosus) populations. Biol. Lett. 2016, 12, 20160345. [Google Scholar] [CrossRef]
- Byrne, A.Q.; Richards-Zawacki, C.L.; Voyles, J.; Bi, K.; Ibáñez, R.; Rosenblum, E.B. Whole exome sequencing identifies the potential for genetic rescue in iconic and critically endangered Panamanian harlequin frogs. Glob. Change Biol. 2021, 27, 50–70. [Google Scholar] [CrossRef]
- AmphibiaWeb. AmphibiaWeb: Information on Amphibian Biology and Conservation. Available online: http://amphibiaweb.org/ (accessed on 2 October 2023).
- Beebee, T.J.C. Conservation genetics of amphibians. Heredity 2005, 95, 423–427. [Google Scholar] [CrossRef]
- Plötner, J.; Köler, F.; Uzzell, T.; Beerli, P. Molecular systematics of amphibians. In Amphib Biol; Heatwole, H., Tyler, M.J., Eds.; Surrey Beatty & Sons: Cipping Norton, Australia, 2007; Volume VII. [Google Scholar]
- Dedukh, D.; Litvinchuk, J.; Svinin, A.; Litvinchuk, S.; Rosanov, J.; Krasikova, A. Variation in hybridogenetic hybrid emergence between populations of water frogs from the Pelophylax esculentus complex. PLoS ONE 2019, 14, e0224759. [Google Scholar] [CrossRef]
- Nunes-de-Almeida, C.H.L.; Haddad, C.F.B.; Toledo, L.F. A revised classification of the amphibian reproductive modes. Salamandra 2021, 57, 413–427. [Google Scholar]
- Liedtke, H.C.; Wiens, J.J.; Gomez-Mestre, I. The evolution of reproductive modes and life cycles in amphibians. Nat. Commun. 2022, 13, e7039. [Google Scholar] [CrossRef]
- Monzon, F.C.; Rodel, M.O.; Jeschke, J.M. Tracking Batrachochytrium dendrobatidis infection across the globe. EcoHealth 2020, 17, 270–279. [Google Scholar] [CrossRef] [PubMed]
- Fisher, M.C.; Garner, T.W.J. Chytrid fungi and global amphibian declines. Nat. Rev. Microbiol. 2020, 18, 332–343. [Google Scholar] [CrossRef] [PubMed]
- Spielman, D.; Brook, B.W.; Frankham, R. Most species are not driven to extinction before genetic factors impact them. Proc. Natl. Acad. Sci. USA 2004, 101, 15261–15264. [Google Scholar] [CrossRef] [PubMed]
- Warne, R.W.; Crespi, E.J. Larval growth rate and sex determine resource allocation and stress responsiveness across life stages in juvenile frogs. J. Exp. Zool. A 2015, 323, 191–201. [Google Scholar] [CrossRef] [PubMed]
- Tarvin, R.D.; Bermudez, C.S.; Briggs, V.S.; Warkentin, K.M. Carry-over effects of size at metamorphosis in red-eyed treefrogs: Higher survival but slower growth of larger metamorphs. Biotropica 2015, 47, 218–226. [Google Scholar] [CrossRef]
- Schmidt, B.R.; Hodl, W.; Schaub, M. From metamorphosis to maturity in complex life cycles: Equal performance of different juvenile life history pathways. Ecology 2012, 93, 657–667. [Google Scholar] [CrossRef]
- Cummins, D.; Kennington, W.J.; Rudin-Bitterli, T.; Mitchell, N.J. A genome-wide search for local adaptation in a terrestrial-breeding frog reveals vulnerability to climate change. Glob. Change Biol. 2019, 25, 3151–3162. [Google Scholar] [CrossRef]
- Beebee, T.J.C.; Griffiths, R.A. The amphibian decline crisis: A watershed for conservation biology? Biol. Conserv. 2005, 125, 271–285. [Google Scholar] [CrossRef]
- Beer, M.A.; Kane, R.A.; Micheletti, S.J.; Kozakiewicz, C.P.; Storfer, A. Landscape genomics of the streamside salamander: Implications for species management in the face of environmental change. Evol. Appl. 2022, 15, 220–236. [Google Scholar] [CrossRef]
- Maier, P.A.; Vandergast, A.G.; Bohonak, A.J. Using landscape genomics to delineate future adaptive potential for climate change in the Yosemite toad (Anaxyrus canorus). Evol. Appl. 2023, 16, 74–97. [Google Scholar] [CrossRef] [PubMed]
- Cayuela, H.; Dorant, Y.; Forester, B.R.; Jeffries, D.L.; Mccaffery, R.M.; Eby, L.A.; Hossack, B.R.; Gippet, J.M.W.; Pilliod, D.S.; Funk, W.C. Genomic signatures of thermal adaptation are associated with clinal shifts of life history in a broadly distributed frog. J. Anim. Ecol. 2022, 91, 1222–1238. [Google Scholar] [CrossRef] [PubMed]
- Hoban, S.; Bruford, M.W.; Funk, W.C.; Galbusera, P.; Griffith, M.P.; Grueber, C.E.; Heuertz, M.; Hunter, M.E.; Hvilsom, C.; Stroil, B.K.; et al. Global Commitments to Conserving and Monitoring Genetic Diversity Are Now Necessary and Feasible. Bioscience 2021, 71, 964–976. [Google Scholar] [CrossRef]
- Frankham, R.; Bradshaw, C.J.A.; Brook, B.W. Genetics in conservation management: Revised recommendations for the 50/500 rules, Red List criteria and population viability analyses. Biol. Conserv. 2014, 170, 56–63. [Google Scholar] [CrossRef]
- Pabijan, M.; Palomar, G.; Antunes, B.; Antoł, W.; Zieliński, P.; Babik, W. Evolutionary principles guiding amphibian conservation. Evol. Appl. 2020, 13, 857–878. [Google Scholar] [CrossRef]
- Aitken, S.N.; Whitlock, M.C. Assisted gene flow to facilitate local adaptation to climate change. Annu. Rev. Ecol. Evol. Syst. 2013, 44, 367–388. [Google Scholar] [CrossRef]
- Frankham, R.; Ballou, J.D.; Eldridge, M.D.B.; Lacy, R.C.; Ralls, K.; Dudash, M.R.; Fenster, C.B. Predicting the probability of outbreeding depression. Conserv. Biol. 2011, 25, 465–475. [Google Scholar] [CrossRef] [PubMed]
- Hoban, S.; Bruford, M.W.; Silva, J.M.d.; Funk, W.C.; Frankham, R.; Gill, M.J.; Grueber, C.E.; Heuertz, M.; Hunter, M.E.; Kershaw, F.; et al. Genetic diversity goals and targets have improved, but remain insufficient for clear implementation of the post-2020 global biodiversity framework. Conserv. Genet. 2023, 24, 181–191. [Google Scholar] [CrossRef] [PubMed]


| Species | Treatment | Fitness Trait | Result | Citation |
|---|---|---|---|---|
| Bufo calamita | food: low vs. high | tadpole survival tadpole growth rate tadpole develop. rate tadpole time to metamorphosis | All fitness traits were better under a high food regime. | [32] |
| Rana temporaria | food: low vs. high | tadpole survival tadpole growth rate tadpole develop. rate tadpole time to metamorphosis | All fitness traits were better under a high food regime. | [32] |
| Bufo calamita | predation: yes or no competition: yes or no desiccation: yes or no | tadpole survival tadpole growth rate | Reduced by predation and desiccation; IA with pop.; reduced by predation and competition; IA with pop. | [48] |
| Rana temporaria | temperature: 14 °C, 18 °C and 21 °C food: low vs. high | tadpole survival | IA: in stressful treatment (e.g., low food or cold temp.), survival was better at higher GD and less-related parents. | [50] |
| Rana latastei | exposure to Ranavirus: low vs. high | tadpole survival | Reduced by high exposure. IA: survival was better when GD was higher. | [55] |
| Rana sylvatica | UV-B light: sunlight, filter and acetate sheet | tadpole survival tadpole deformity | Lowest under direct sunlight. IA between GD and UV light was highest under direct sunlight. | [57] |
| Bufo calamita | temperature: 19 °C, 27 °C and variable | tadpole survival | Highest under cold treatment. IA with GD. | [38] |
| Rana temporaria | temperature: 10 °C, 14 °C and 21 °C | tadpole growth rate | Higher in medium and high treatment. | [40] |
| Lithobates yavapaiensis | Bd: yes or no | adult frog survival | Uninfected individuals survived better. | [67] |
| Hyla arborea | Bd: low vs. high dose | tadpole time to metamorphosis tadpole mass survival of froglets | Longer time at high Bd; mass reduced at high Bd; treatment n.s. | [47] |
| Species | Negative Effect of Isolation or Small Population Size | Citation |
|---|---|---|
| Bufo bufo | Survival was higher and deformity was lower in larger, less isolated populations. | [36] |
| Bufo calamita | Low hatch rate in the smallest isolated populations. | [49] |
| Hyla arborea | Tadpole survival was lower in isolated ponds. | [54] |
| Bufo calamita | Tadpole survival and growth rate were lower in small populations. | [48] |
| Rana latastei | Tadpole survival was reduced in isolated populations. | [55] |
| Rana latastei | Egg hatch rate was reduced in isolated populations. | [39] |
| Rana temporaria | Tadpole body size and survival was reduced in the fragmented compared to the continuous habitat. | [37] |
| Hyla arborea | Individual performances were reduced in isolated, small populations compared to large, non-fragmented populations. | [59] |
| Hyla arborea | Stronger high Bd dose effect on fitness traits (Table 2) in isolated populations. | [47] |
| Lithobates sevosus | Inbred tadpoles did not survive in isolated population. | [61] |
| Hynobius tokyoensis Rana ornativentris | Genetic diversity and egg survival were positively affected by the forested area. | [33] |
| Bombina variegata | Bd prevalence and Bd intensity were highest in two inbred, isolated populations. | [65] |
| Litoria verreauxii | No Bd infection in isolated populations. | [46] |
| Six tropical species (no data for single species) | Bd infection was higher in fragmented populations relative to continuous populations. | [34] |
Disclaimer/Publisher’s Note: The statements, opinions and data contained in all publications are solely those of the individual author(s) and contributor(s) and not of MDPI and/or the editor(s). MDPI and/or the editor(s) disclaim responsibility for any injury to people or property resulting from any ideas, methods, instructions or products referred to in the content. |
© 2023 by the authors. Licensee MDPI, Basel, Switzerland. This article is an open access article distributed under the terms and conditions of the Creative Commons Attribution (CC BY) license (https://creativecommons.org/licenses/by/4.0/).
Share and Cite
Pröhl, H.; Rodríguez, A. Importance of Genetic–Fitness Correlations for the Conservation of Amphibians. Animals 2023, 13, 3564. https://doi.org/10.3390/ani13223564
Pröhl H, Rodríguez A. Importance of Genetic–Fitness Correlations for the Conservation of Amphibians. Animals. 2023; 13(22):3564. https://doi.org/10.3390/ani13223564
Chicago/Turabian StylePröhl, Heike, and Ariel Rodríguez. 2023. "Importance of Genetic–Fitness Correlations for the Conservation of Amphibians" Animals 13, no. 22: 3564. https://doi.org/10.3390/ani13223564