
In-Line Registered Milk Fat-to-Protein Ratio for the Assessment of Metabolic Status in Dairy Cows

 ,
, 
Abstract
:Simple Summary
Abstract
1. Introduction
2. Materials and Methods
2.1. Housing Conditions of Study Animals
2.2. Experimental Design
2.3. Measurements
2.4. Statistical Analysis
3. Results
Descriptive Statistics
4. Discussion
5. Conclusions
Author Contributions
Funding
Institutional Review Board Statement
Informed Consent Statement
Data Availability Statement
Acknowledgments
Conflicts of Interest
References
- Pires, J.A.A.; Larsen, T.; Leroux, C. Milk Metabolites and Fatty Acids as Noninvasive Biomarkers of Metabolic Status and Energy Balance in Early-Lactation Cows. J. Dairy Sci. 2022, 105, 201–220. [Google Scholar] [CrossRef] [PubMed]
- Bondan, C.; Folchini, J.A.; Guimarães, L.; Noro, M.; Zanella, R.; Alves, L.P.; Fontaneli, R.S.; Gonzalez, F. Milk Yield and Composition in Dairy Cows with Post-Partum Disorders. Arq. Bras. Med. Vet. Zootec. 2021, 73, 639–646. [Google Scholar] [CrossRef]
- Benedet, A.; Manuelian, C.L.; Zidi, A.; Penasa, M.; Marchi, M.D. Invited Review: β-Hydroxybutyrate Concentration in Blood and Milk and Its Associations with Cow Performance. Animal 2019, 13, 1676–1689. [Google Scholar] [CrossRef] [PubMed]
- Djokovic, R.; Cincovic, M.; Ilic, Z.; Kurcubic, V.; Andjelic, B.; Petrovic, M.; Lalic, N.; Jasovic, B. Relationships between Contents of Biochemical Metabolites in Blood and Milk in Dairy Cows during Transition and Mid Lactation. Int. J. Appl. Res. Vet. Med. 2019, 17, 1–9. [Google Scholar]
- Bertoni, G.; Trevisi, E.; Han, X.; Bionaz, M. Effects of Inflammatory Conditions on Liver Activity in Puerperium Period and Consequences for Performance in Dairy Cows. J. Dairy Sci. 2008, 91, 3300–3310. [Google Scholar] [CrossRef] [PubMed]
- Gross, J.; van Dorland, H.A.; Bruckmaier, R.M.; Schwarz, F.J. Performance and Metabolic Profile of Dairy Cows during a Lactational and Deliberately Induced Negative Energy Balance with Subsequent Realimentation. J. Dairy Sci. 2011, 94, 1820–1830. [Google Scholar] [CrossRef]
- Leblanc, S. Monitoring Metabolic Health of Dairy Cattle in the Transition Period. J. Reprod. Dev. 2010, 56, S29–S35. [Google Scholar] [CrossRef]
- Bruckmaier, R.M.; Gross, J.J.; Bruckmaier, R.M.; Gross, J.J. Lactational Challenges in Transition Dairy Cows. Anim. Prod. Sci. 2017, 57, 1471–1481. [Google Scholar] [CrossRef]
- Liu, P.; He, X.; Yang, X.L.; Hou, X.L.; Han, J.B.; Han, Y.H.; Nie, P.; Fang, H.; Du, X.H. Bioactivity Evaluation of Certain Hepatic Enzymes in Blood Plasma and Milk of Holstein Cows. Pak. Vet. J. 2012, 32, 601–604. [Google Scholar]
- Duffield, T. Subclinical Ketosis in Lactating Dairy Cattle. Vet. Clin. N. Am. Food Anim. Pract. 2000, 16, 231–253. [Google Scholar] [CrossRef]
- Jenkins, N.T.; Peña, G.; Risco, C.; Barbosa, C.C.; Vieira-Neto, A.; Galvão, K.N. Utility of Inline Milk Fat and Protein Ratio to Diagnose Subclinical Ketosis and to Assign Propylene Glycol Treatment in Lactating Dairy Cows. Can. Vet. J. 2015, 56, 850–854. [Google Scholar] [PubMed]
- King, M.T.M.; LeBlanc, S.J.; Pajor, E.A.; DeVries, T.J. Cow-Level Associations of Lameness, Behavior, and Milk Yield of Cows Milked in Automated Systems. J. Dairy Sci. 2017, 100, 4818–4828. [Google Scholar] [CrossRef] [PubMed]
- Duffield, T.F.; Lissemore, K.D.; McBride, B.W.; Leslie, K.E. Impact of Hyperketonemia in Early Lactation Dairy Cows on Health and Production. J. Dairy Sci. 2009, 92, 571–580. [Google Scholar] [CrossRef] [PubMed]
- Plaizier, J.C.; Krause, D.O.; Gozho, G.N.; McBride, B.W. Subacute Ruminal Acidosis in Dairy Cows: The Physiological Causes, Incidence and Consequences. Vet. J. 2008, 176, 21–31. [Google Scholar] [CrossRef]
- Churakov, M.; Karlsson, J.; Edvardsson Rasmussen, A.; Holtenius, K. Milk Fatty Acids as Indicators of Negative Energy Balance of Dairy Cows in Early Lactation. Animal 2021, 15, 100253. [Google Scholar] [CrossRef]
- King, M.T.M.; LeBlanc, S.J.; Pajor, E.A.; Wright, T.C.; DeVries, T.J. Behavior and Productivity of Cows Milked in Automated Systems before Diagnosis of Health Disorders in Early Lactation. J. Dairy Sci. 2018, 101, 4343–4356. [Google Scholar] [CrossRef]
- Ehret, A.; Hochstuhl, D.; Krattenmacher, N.; Tetens, J.; Klein, M.S.; Gronwald, W.; Thaller, G. Short Communication: Use of Genomic and Metabolic Information as Well as Milk Performance Records for Prediction of Subclinical Ketosis Risk via Artificial Neural Networks. J. Dairy Sci. 2015, 98, 322–329. [Google Scholar] [CrossRef]
- Gross, J.J.; Bruckmaier, R.M. Review: Metabolic Challenges in Lactating Dairy Cows and Their Assessment via Established and Novel Indicators in Milk. Animal 2019, 13, s75–s81. [Google Scholar] [CrossRef]
- Heirbaut, S.; Børge Jensen, D.; Jing, X.P.; Stefańska, B.; Lutakome, P.; Vandaele, L.; Fievez, V. Different Reticuloruminal pH Metrics of High-Yielding Dairy Cattle during the Transition Period in Relation to Metabolic Health, Activity, and Feed Intake. J. Dairy Sci. 2022, 105, 6880–6894. [Google Scholar] [CrossRef]
- Zschiesche, M.; Mensching, A.; Sharifi, A.R.; Hummel, J. The Milk Fat-to-Protein Ratio as Indicator for Ruminal pH Parameters in Dairy Cows: A Meta-Analysis. Dairy 2020, 1, 259–268. [Google Scholar] [CrossRef]
- Süss, D.; Drillich, M.; Klein-Jöbstl, D.; Wagener, K.; Krieger, S.; Thiel, A.; Meyer, L.; Schwendenwein, I.; Iwersen, M. Measurement of β-Hydroxybutyrate in Capillary Blood Obtained from an Ear to Detect Hyperketonemia in Dairy Cows by Using an Electronic Handheld Device. J. Dairy Sci. 2016, 99, 7362–7369. [Google Scholar] [CrossRef] [PubMed]
- Nikkhah, A.; Furedi, C.J.; Kennedy, A.D.; Crow, G.H.; Plaizier, J.C. Effects of Feed Delivery Time on Feed Intake, Milk Production, and Blood Metabolites of Dairy Cows. J. Dairy Sci. 2008, 91, 4249–4260. [Google Scholar] [CrossRef] [PubMed]
- Televičius, M.; Juozaitiene, V.; Malašauskienė, D.; Antanaitis, R.; Rutkauskas, A.; Urbutis, M.; Baumgartner, W. Inline Milk Lactose Concentration as Biomarker of the Health Status and Reproductive Success in Dairy Cows. Agriculture 2021, 11, 38. [Google Scholar] [CrossRef]
- Reist, M.; Erdin, D.; von Euw, D.; Tschuemperlin, K.; Leuenberger, H.; Chilliard, Y.; Hammon, H.M.; Morel, C.; Philipona, C.; Zbinden, Y.; et al. Estimation of Energy Balance at the Individual and Herd Level Using Blood and Milk Traits in High-Yielding Dairy Cows. J. Dairy Sci. 2002, 85, 3314–3327. [Google Scholar] [CrossRef]
- Buttchereit, N.; Stamer, E.; Junge, W.; Thaller, G. Evaluation of Five Lactation Curve Models Fitted for Fat:Protein Ratio of Milk and Daily Energy Balance. J. Dairy Sci. 2010, 93, 1702–1712. [Google Scholar] [CrossRef] [PubMed]
- Heuer, C.; Schukken, Y.H.; Dobbelaar, P. Postpartum Body Condition Score and Results from the First Test Day Milk as Predictors of Disease, Fertility, Yield, and Culling in Commercial Dairy Herds. J. Dairy Sci. 1999, 82, 295–304. [Google Scholar] [CrossRef]
- Gonzalez-Mejia, A.; Styles, D.; Wilson, P.; Gibbons, J. Metrics and Methods for Characterizing Dairy Farm Intensification Using Farm Survey Data. PLoS ONE 2018, 13, e0195286. [Google Scholar] [CrossRef]
- Belay, T.K.; Dagnachew, B.S.; Kowalski, Z.M.; Ådnøy, T. An Attempt at Predicting Blood β-Hydroxybutyrate from Fourier-Transform Mid-Infrared Spectra of Milk Using Multivariate Mixed Models in Polish Dairy Cattle. J. Dairy Sci. 2017, 100, 6312–6326. [Google Scholar] [CrossRef]
- Mäntysaari, P.; Juga, J.; Lidauer, M.H.; Häggman, J.; Mehtiö, T.; Christensen, J.M.; Mäntysaari, E.A. The Relationships between Early Lactation Energy Status Indicators and Endocrine Fertility Traits in Dairy Cows. J. Dairy Sci. 2022, 105, 6833–6844. [Google Scholar] [CrossRef]
- Mensching, A.; Hummel, J.; Sharifi, A.R. Statistical Modeling of Ruminal pH Parameters from Dairy Cows Based on a Meta-Analysis. J. Dairy Sci. 2020, 103, 750–767. [Google Scholar] [CrossRef]
- Humer, E.; Petri, R.M.; Aschenbach, J.R.; Bradford, B.J.; Penner, G.B.; Tafaj, M.; Südekum, K.-H.; Zebeli, Q. Invited Review: Practical Feeding Management Recommendations to Mitigate the Risk of Subacute Ruminal Acidosis in Dairy Cattle. J. Dairy Sci. 2018, 101, 872–888. [Google Scholar] [CrossRef] [PubMed]
- Enemark, J.; Jorgensen, R.; Enemark, P. Rumen Acidosis with Special Emphasis on Diagnostic Aspects of Subclinical Rumen Acidosis: A Review. Vet. Ir Zootech. 2002, 20, 16–29. [Google Scholar]
- Li, S.; Gozho, G.N.; Gakhar, N.; Khafipour, E.; Krause, D.O.; Plaizier, J.C. Evaluation of Diagnostic Measures for Subacute Ruminal Acidosis in Dairy Cows. Can. J. Anim. Sci. 2012, 92, 353–364. [Google Scholar] [CrossRef]
- Stein, S.K. Determination of Subclinical Metabolic Disorders in Transition Dairy Cows. Ph.D. Thesis, University of Kassel, Kassel, Germany, 2017. [Google Scholar]
- Danscher, A.M.; Li, S.; Andersen, P.H.; Khafipour, E.; Kristensen, N.B.; Plaizier, J.C. Indicators of Induced Subacute Ruminal Acidosis (SARA) in Danish Holstein Cows. Acta Vet. Scand. 2015, 57, 39. [Google Scholar] [CrossRef]
- Sutton, J.D. Altering Milk Composition by Feeding. J. Dairy Sci. 1989, 72, 2801–2814. [Google Scholar] [CrossRef]
- Harvatine, K.J.; Boisclair, Y.R.; Bauman, D.E. Recent Advances in the Regulation of Milk Fat Synthesis. Animal 2009, 3, 40–54. [Google Scholar] [CrossRef]
- Kleen, J.L.; Cannizzo, C. Incidence, Prevalence and Impact of SARA in Dairy Herds. Anim. Feed Sci. Technol. 2012, 172, 4–8. [Google Scholar] [CrossRef]
- Villot, C.; Meunier, B.; Bodin, J.; Martin, C.; Silberberg, M. Relative Reticulo-Rumen pH Indicators for Subacute Ruminal Acidosis Detection in Dairy Cows. Animal 2018, 12, 481–490. [Google Scholar] [CrossRef]
- Li, G.; Ma, X.; Deng, L.; Zhao, X.; Wei, Y.; Gao, Z.; Jia, J.; Xu, J.; Sun, C. Fresh Garlic Extract Enhances the Antimicrobial Activities of Antibiotics on Resistant Strains in Vitro. Jundishapur J. Microbiol. 2015, 8, e14814. [Google Scholar] [CrossRef]
- Dann, H.M.; Morin, D.E.; Bollero, G.A.; Murphy, M.R.; Drackley, J.K. Prepartum Intake, Postpartum Induction of Ketosis, and Periparturient Disorders Affect the Metabolic Status of Dairy Cows. J. Dairy Sci. 2005, 88, 3249–3264. [Google Scholar] [CrossRef]
- Drackley, J.K.; Overton, T.R.; Douglas, G.N. Adaptations of Glucose and Long-Chain Fatty Acid Metabolism in Liver of Dairy Cows during the Periparturient Period. J. Dairy Sci. 2001, 84, E100–E112. [Google Scholar] [CrossRef]
- Andjelić, B.; Djoković, R.; Cincović, M.; Bogosavljević-Bošković, S.; Petrović, M.; Mladenović, J.; Čukić, A. Relationships between Milk and Blood Biochemical Parameters and Metabolic Status in Dairy Cows during Lactation. Metabolites 2022, 12, 733. [Google Scholar] [CrossRef] [PubMed]
- Kessel, S.; Stroehl, M.; Meyer, H.H.D.; Hiss, S.; Sauerwein, H.; Schwarz, F.J.; Bruckmaier, R.M. Individual Variability in Physiological Adaptation to Metabolic Stress during Early Lactation in Dairy Cows Kept under Equal Conditions. J. Anim. Sci. 2008, 86, 2903–2912. [Google Scholar] [CrossRef] [PubMed]
- van Dorland, H.A.; Richter, S.; Morel, I.; Doherr, M.G.; Castro, N.; Bruckmaier, R.M. Variation in Hepatic Regulation of Metabolism during the Dry Period and in Early Lactation in Dairy Cows. J. Dairy Sci. 2009, 92, 1924–1940. [Google Scholar] [CrossRef]
- Nielsen, N.I.; Ingvartsen, K.L. Propylene Glycol for Dairy Cows: A Review of the Metabolism of Propylene Glycol and Its Effects on Physiological Parameters, Feed Intake, Milk Production and Risk of Ketosis. Anim. Feed Sci. Technol. 2004, 115, 191–213. [Google Scholar] [CrossRef]
- Weng, X.; Zhao, W.; Neethirajan, S.; Duffield, T. Microfluidic Biosensor for β-Hydroxybutyrate (βHBA) Determination of Subclinical Ketosis Diagnosis. J. Nanobiotechnol. 2015, 13, 13. [Google Scholar] [CrossRef]
- McArt, J.A.A.; Nydam, D.V.; Oetzel, G.R. Epidemiology of Subclinical Ketosis in Early Lactation Dairy Cattle. J. Dairy Sci. 2012, 95, 5056–5066. [Google Scholar] [CrossRef]
- Ospina, P.A.; McArt, J.A.; Overton, T.R.; Stokol, T.; Nydam, D.V. Using Nonesterified Fatty Acids and β-Hydroxybutyrate Concentrations during the Transition Period for Herd-Level Monitoring of Increased Risk of Disease and Decreased Reproductive and Milking Performance. Vet. Clin. Food Anim. Pract. 2013, 29, 387–412. [Google Scholar] [CrossRef]
- Herdt, T.H. Ruminant Adaptation to Negative Energy Balance: Influences on the Etiology of Ketosis and Fatty Liver. Vet. Clin. N. Am. Food Anim. Pract. 2000, 16, 215–230. [Google Scholar] [CrossRef]
- Toni, F.; Vincenti, L.; Grigoletto, L.; Ricci, A.; Schukken, Y.H. Early Lactation Ratio of Fat and Protein Percentage in Milk Is Associated with Health, Milk Production, and Survival. J. Dairy Sci. 2011, 94, 1772–1783. [Google Scholar] [CrossRef]
- Mohamed, G. Investigation of some enzymes level in blood and milk serum in two stages of milk yield dairy cows at assiut city. Assiut Vet. Med. J. 2014, 60, 110–120. [Google Scholar] [CrossRef]
- Jóźwik, A.; Strzałkowska, N.; Bagnicka, E.; Grzybek, W.; Krzyżewski, J.; Poławska, E.; Kołataj, A.; Horbańczuk, J.O. Relationship between Milk Yield, Stage of Lactation, and Some Blood Serum Metabolic Parameters of Dairy Cows. Czech J. Anim. Sci. 2012, 57, 353–360. [Google Scholar] [CrossRef]
- Wang, X.P.; Luoreng, Z.M.; Zan, L.S.; Raza, S.H.A.; Li, F.; Li, N.; Liu, S. Expression Patterns of miR-146a and miR-146b in Mastitis Infected Dairy Cattle. Mol. Cell. Probes 2016, 30, 342–344. [Google Scholar] [CrossRef]
- Stauder, A.; Humer, E.; Neubauer, V.; Reisinger, N.; Kaltenegger, A.; Zebeli, Q. Distinct Responses in Feed Sorting, Chewing Behavior, and Ruminal Acidosis Risk between Primiparous and Multiparous Simmental Cows Fed Diets Differing in Forage and Starch Levels. J. Dairy Sci. 2020, 103, 8467–8481. [Google Scholar] [CrossRef]
- Morar, D.; Văduva, C.; Morar, A.; Imre, M.; Tulcan, C.; Imre, K. Paraclinical Changes Occurring in Dairy Cows with Spontaneous Subacute Ruminal Acidosis under Field Conditions. Animals 2022, 12, 2466. [Google Scholar] [CrossRef] [PubMed]
- Moehlenpah, A.N.; Ribeiro, L.P.S.; Puchala, R.; Goetsch, A.L.; Beck, P.; Pezeshki, A.; Gross, M.A.; Holder, A.L.; Lalman, D.L. Water and Forage Intake, Diet Digestibility, and Blood Parameters of Beef Cows and Heifers Consuming Water with Varying Concentrations of Total Dissolved Salts. J. Anim. Sci. 2021, 99, skab282. [Google Scholar] [CrossRef] [PubMed]
- Puppel, K.; Kuczyńska, B. Metabolic Profiles of Cow’s Blood; a Review. J. Sci. Food Agric. 2016, 96, 4321–4328. [Google Scholar] [CrossRef]
- Negussie, E.; Strandén, I.; Mäntysaari, E.A. Genetic Associations of Test-Day Fat:Protein Ratio with Milk Yield, Fertility, and Udder Health Traits in Nordic Red Cattle. J. Dairy Sci. 2013, 96, 1237–1250. [Google Scholar] [CrossRef]
- Toscano, A.; Giannuzzi, D.; Pegolo, S.; Vanzin, A.; Bisutti, V.; Gallo, L.; Trevisi, E.; Cecchinato, A.; Schiavon, S. Associations between the Detailed Milk Mineral Profile, Milk Composition, and Metabolic Status in Holstein Cows. J. Dairy Sci. 2023, 106, 6577–6591. [Google Scholar] [CrossRef]


| N | Mean | Standard Deviation | Std. Error | 95% Confidence Interval for Mean | Minimum | Maximum | |||
|---|---|---|---|---|---|---|---|---|---|
| Lower Bound | Upper Bound | ||||||||
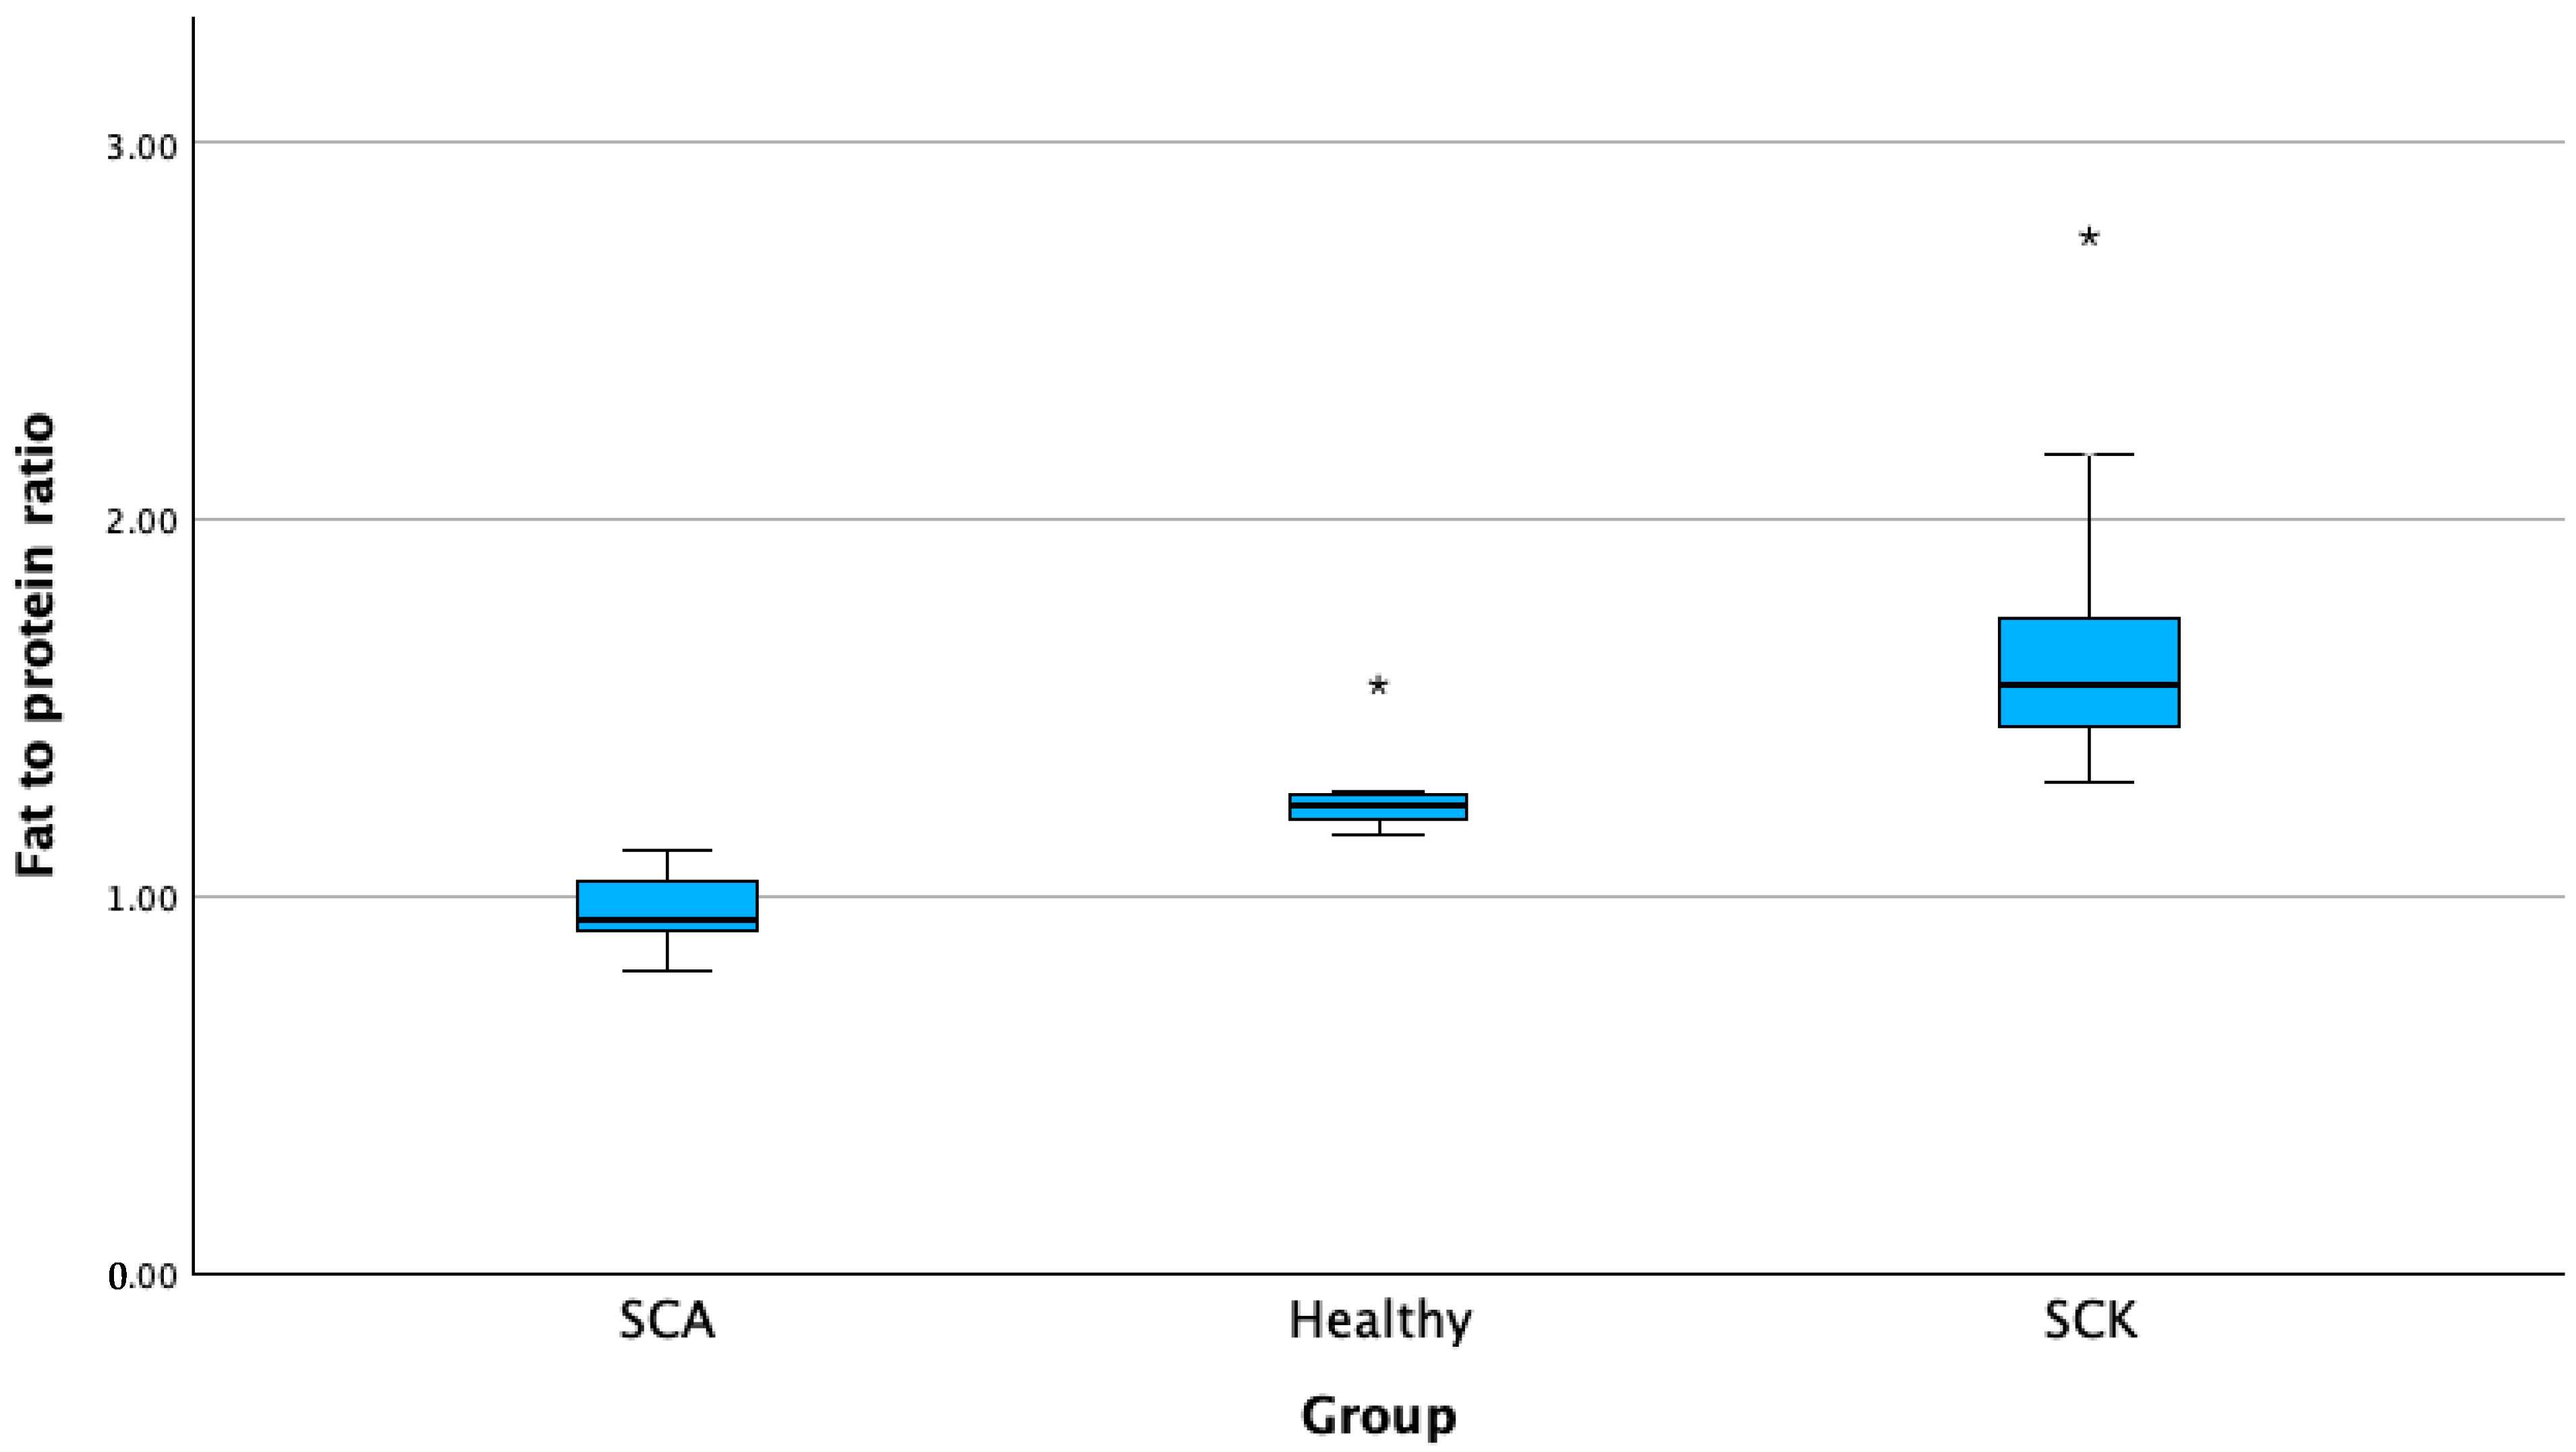
| Milk fat-to-protein ratio | SCK A | 62 | 1.66 B,C | 0.29 | 0.00 | 1.58 | 1.73 | 1.33 | 2.75 |
| H B | 20 | 1.22 | 0.07 | 0.01 | 1.19 | 1.26 | 1.07 | 1.34 | |
| SCAC | 14 | 0.93 | 0.10 | 0.02 | 0.86 | 0.99 | 0.70 | 1.08 | |
| Total | 96 | 1.46 | 0.36 | 0.03 | 1.38 | 1.53 | 0.70 | 2.75 | |
| Capillary glucose (mmol/L) | SCK | 61 | 2.83 | 0.32 | 0.04 | 2.75 | 2.92 | 2.1 | 3.6 |
| H | 20 | 2.82 | 0.29 | 0.06 | 2.68 | 2.96 | 2.4 | 3.5 | |
| SCA | 14 | 2.58 | 0.46 | 0.12 | 2.31 | 2.85 | 1.1 | 3.0 | |
| Total | 95 | 2.79 | 0.35 | 0.03 | 2.72 | 2.87 | 1.1 | 3.6 | |
| Capillary BHBA (mmol/L) | SCK | 62 | 0.42 | 0.35 | 0.0451 | 0.336 | 0.516 | 0.1 | 1.8 |
| H | 20 | 0.32 | 0.12 | 0.0289 | 0.265 | 0.385 | 0.1 | 0.5 | |
| SCA | 14 | 0.45 | 0.44 | 0.1189 | 0.200 | 0.714 | 0.1 | 1.9 | |
| Total | 96 | 0.40 | 0.33 | 0.0344 | 0.341 | 0.478 | 0.1 | 1.9 | |
| DIM | SCK | 62 | 42.79 | 30.03 | 3.81 | 35.16 | 50.42 | 5 | 29 |
| H | 20 | 45.85 | 27.32 | 6.11 | 33.06 | 58.64 | 7 | 30 | |
| SCA | 14 | 94.14 | 45.45 | 12.14 | 67.90 | 120.38 | 9 | 28 | |
| Total | 96 | 50.92 | 36.54 | 3.72 | 43.51 | 58.32 | 7 | 29 | |
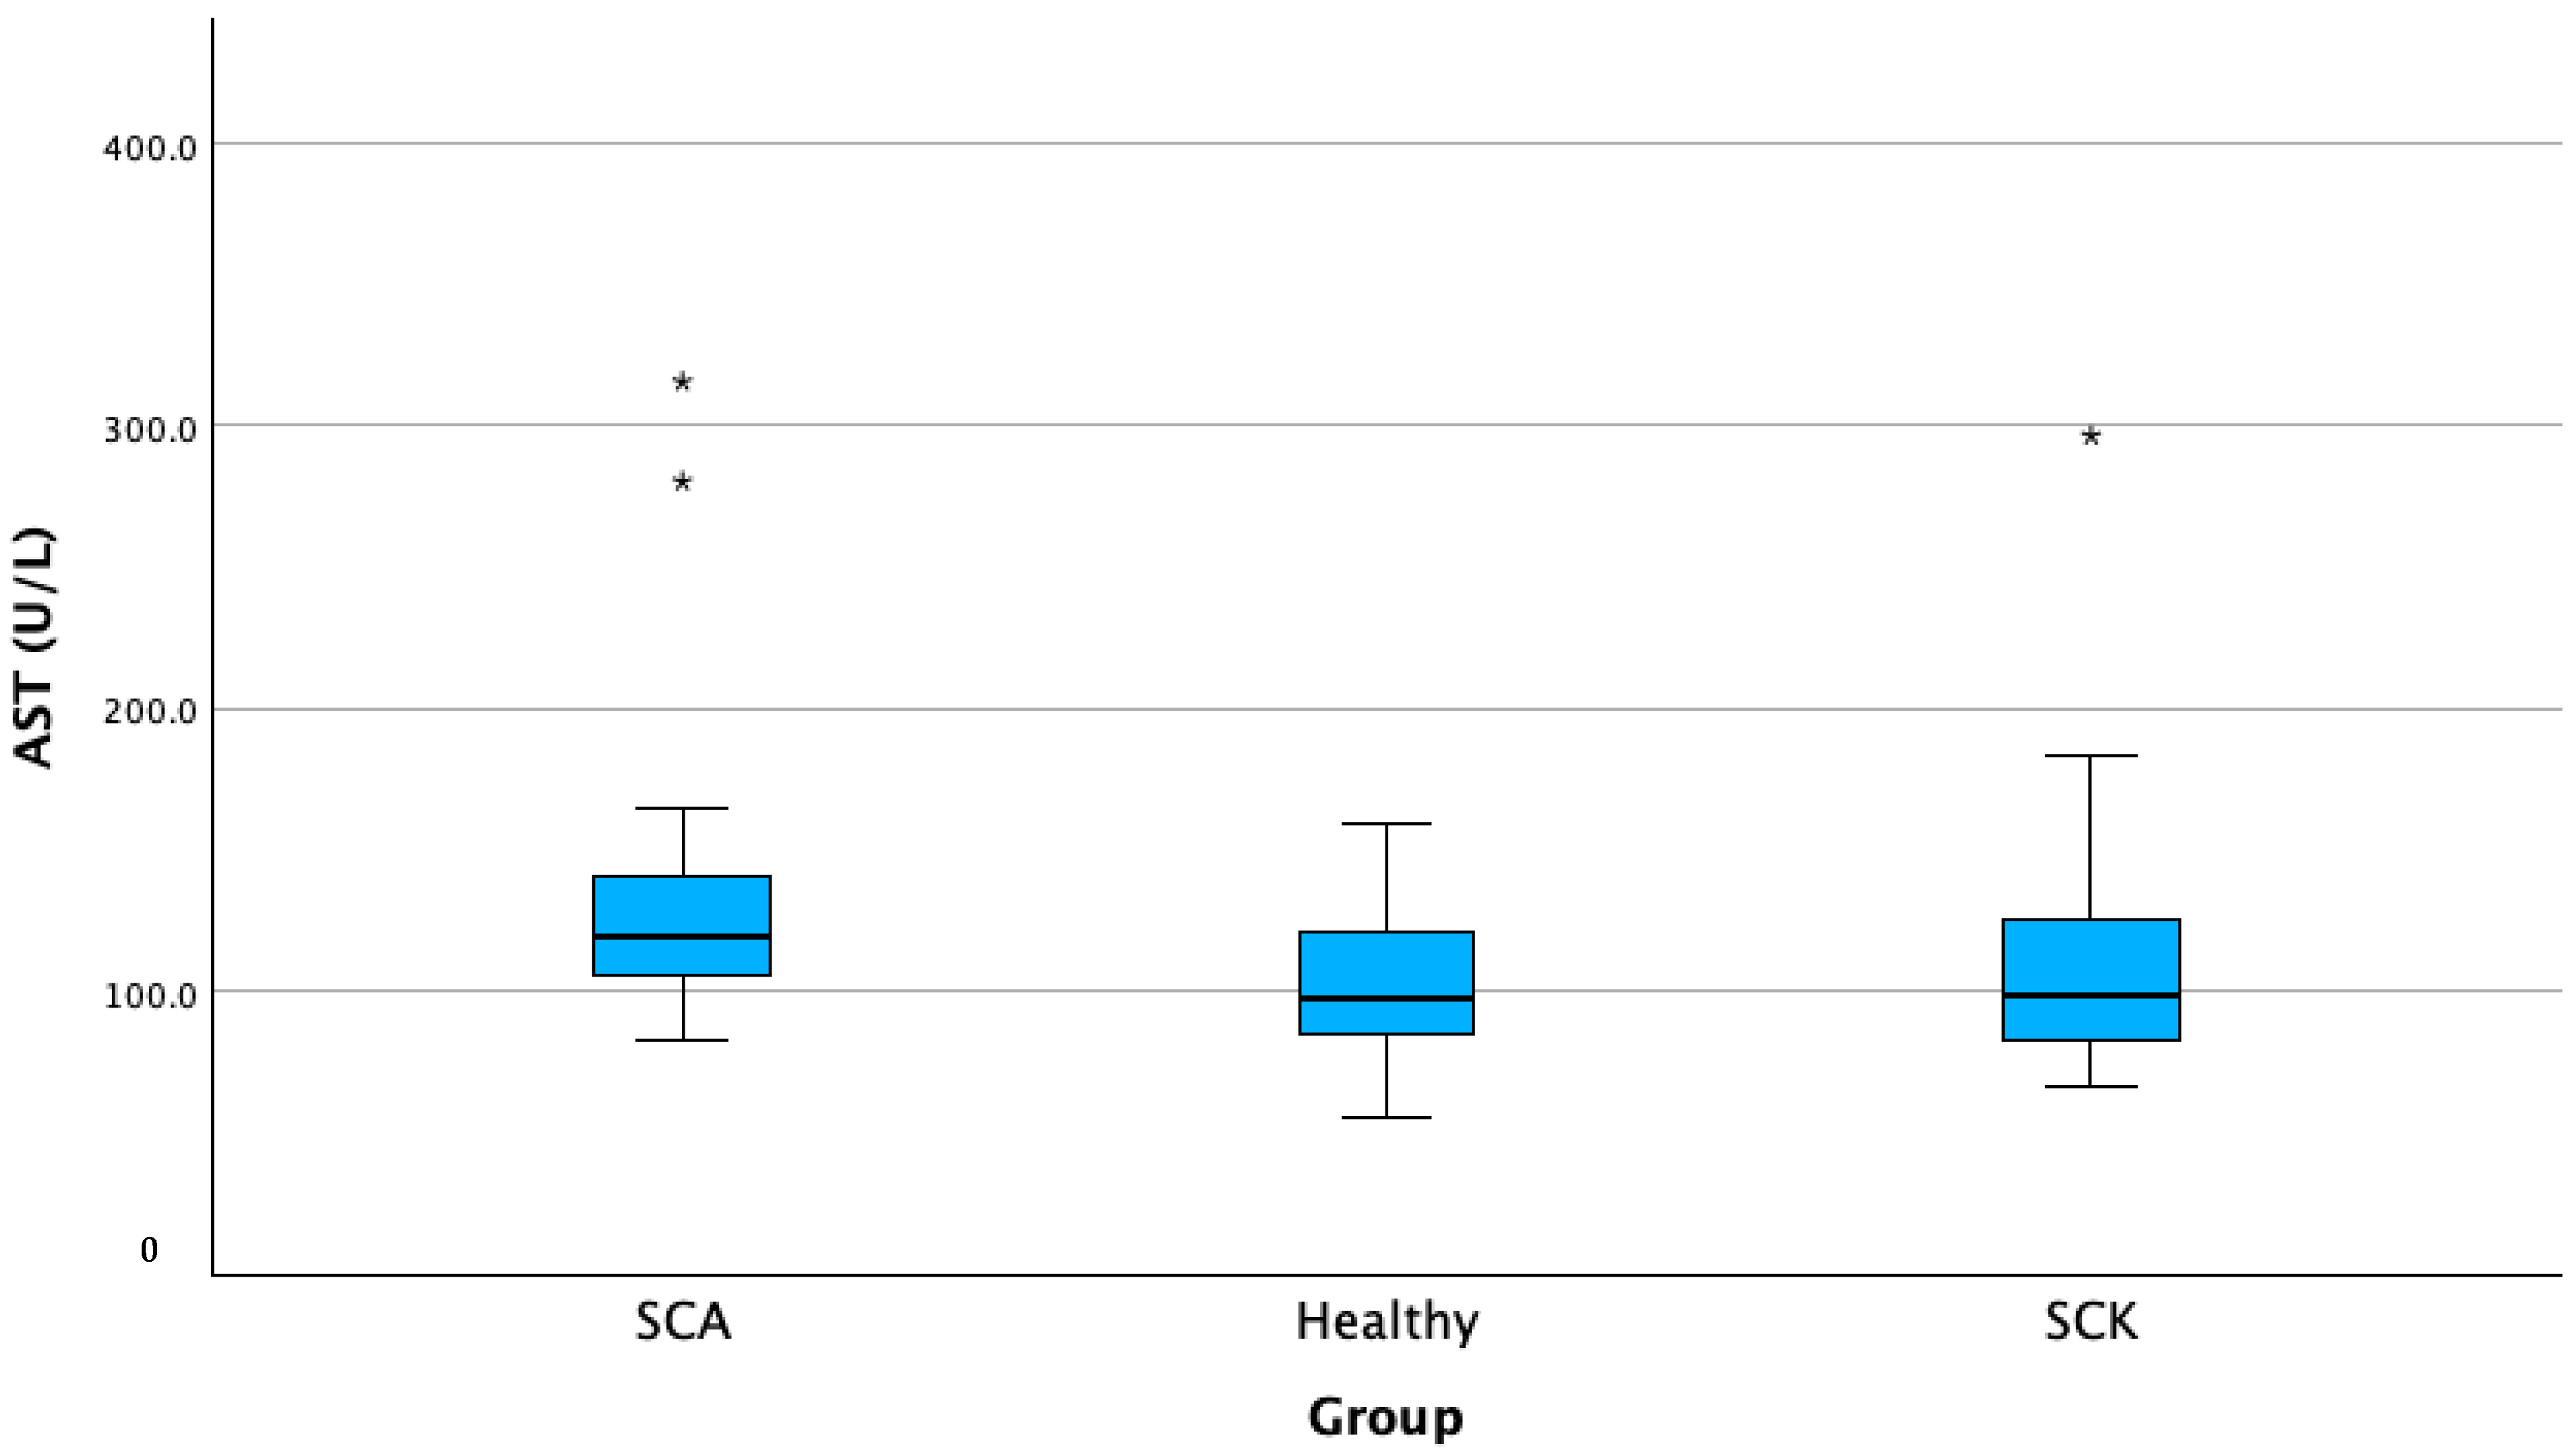
| Serum AST (U/L) | SCK A | 62 | 109.72 | 40.58 | 5.15 | 99.41 | 120.03 | 66.0 | 296.6 |
| H B | 20 | 102.66 | 29.17 | 6.52 | 89.01 | 116.31 | 55.2 | 159.6 | |
| SCA C | 14 | 143.92 B | 67.63 | 18.07 | 104.87 | 182.98 | 95.0 | 315.7 | |
| Total | 96 | 113.24 | 44.99 | 4.59 | 104.12 | 122.35 | 55.2 | 315.7 | |
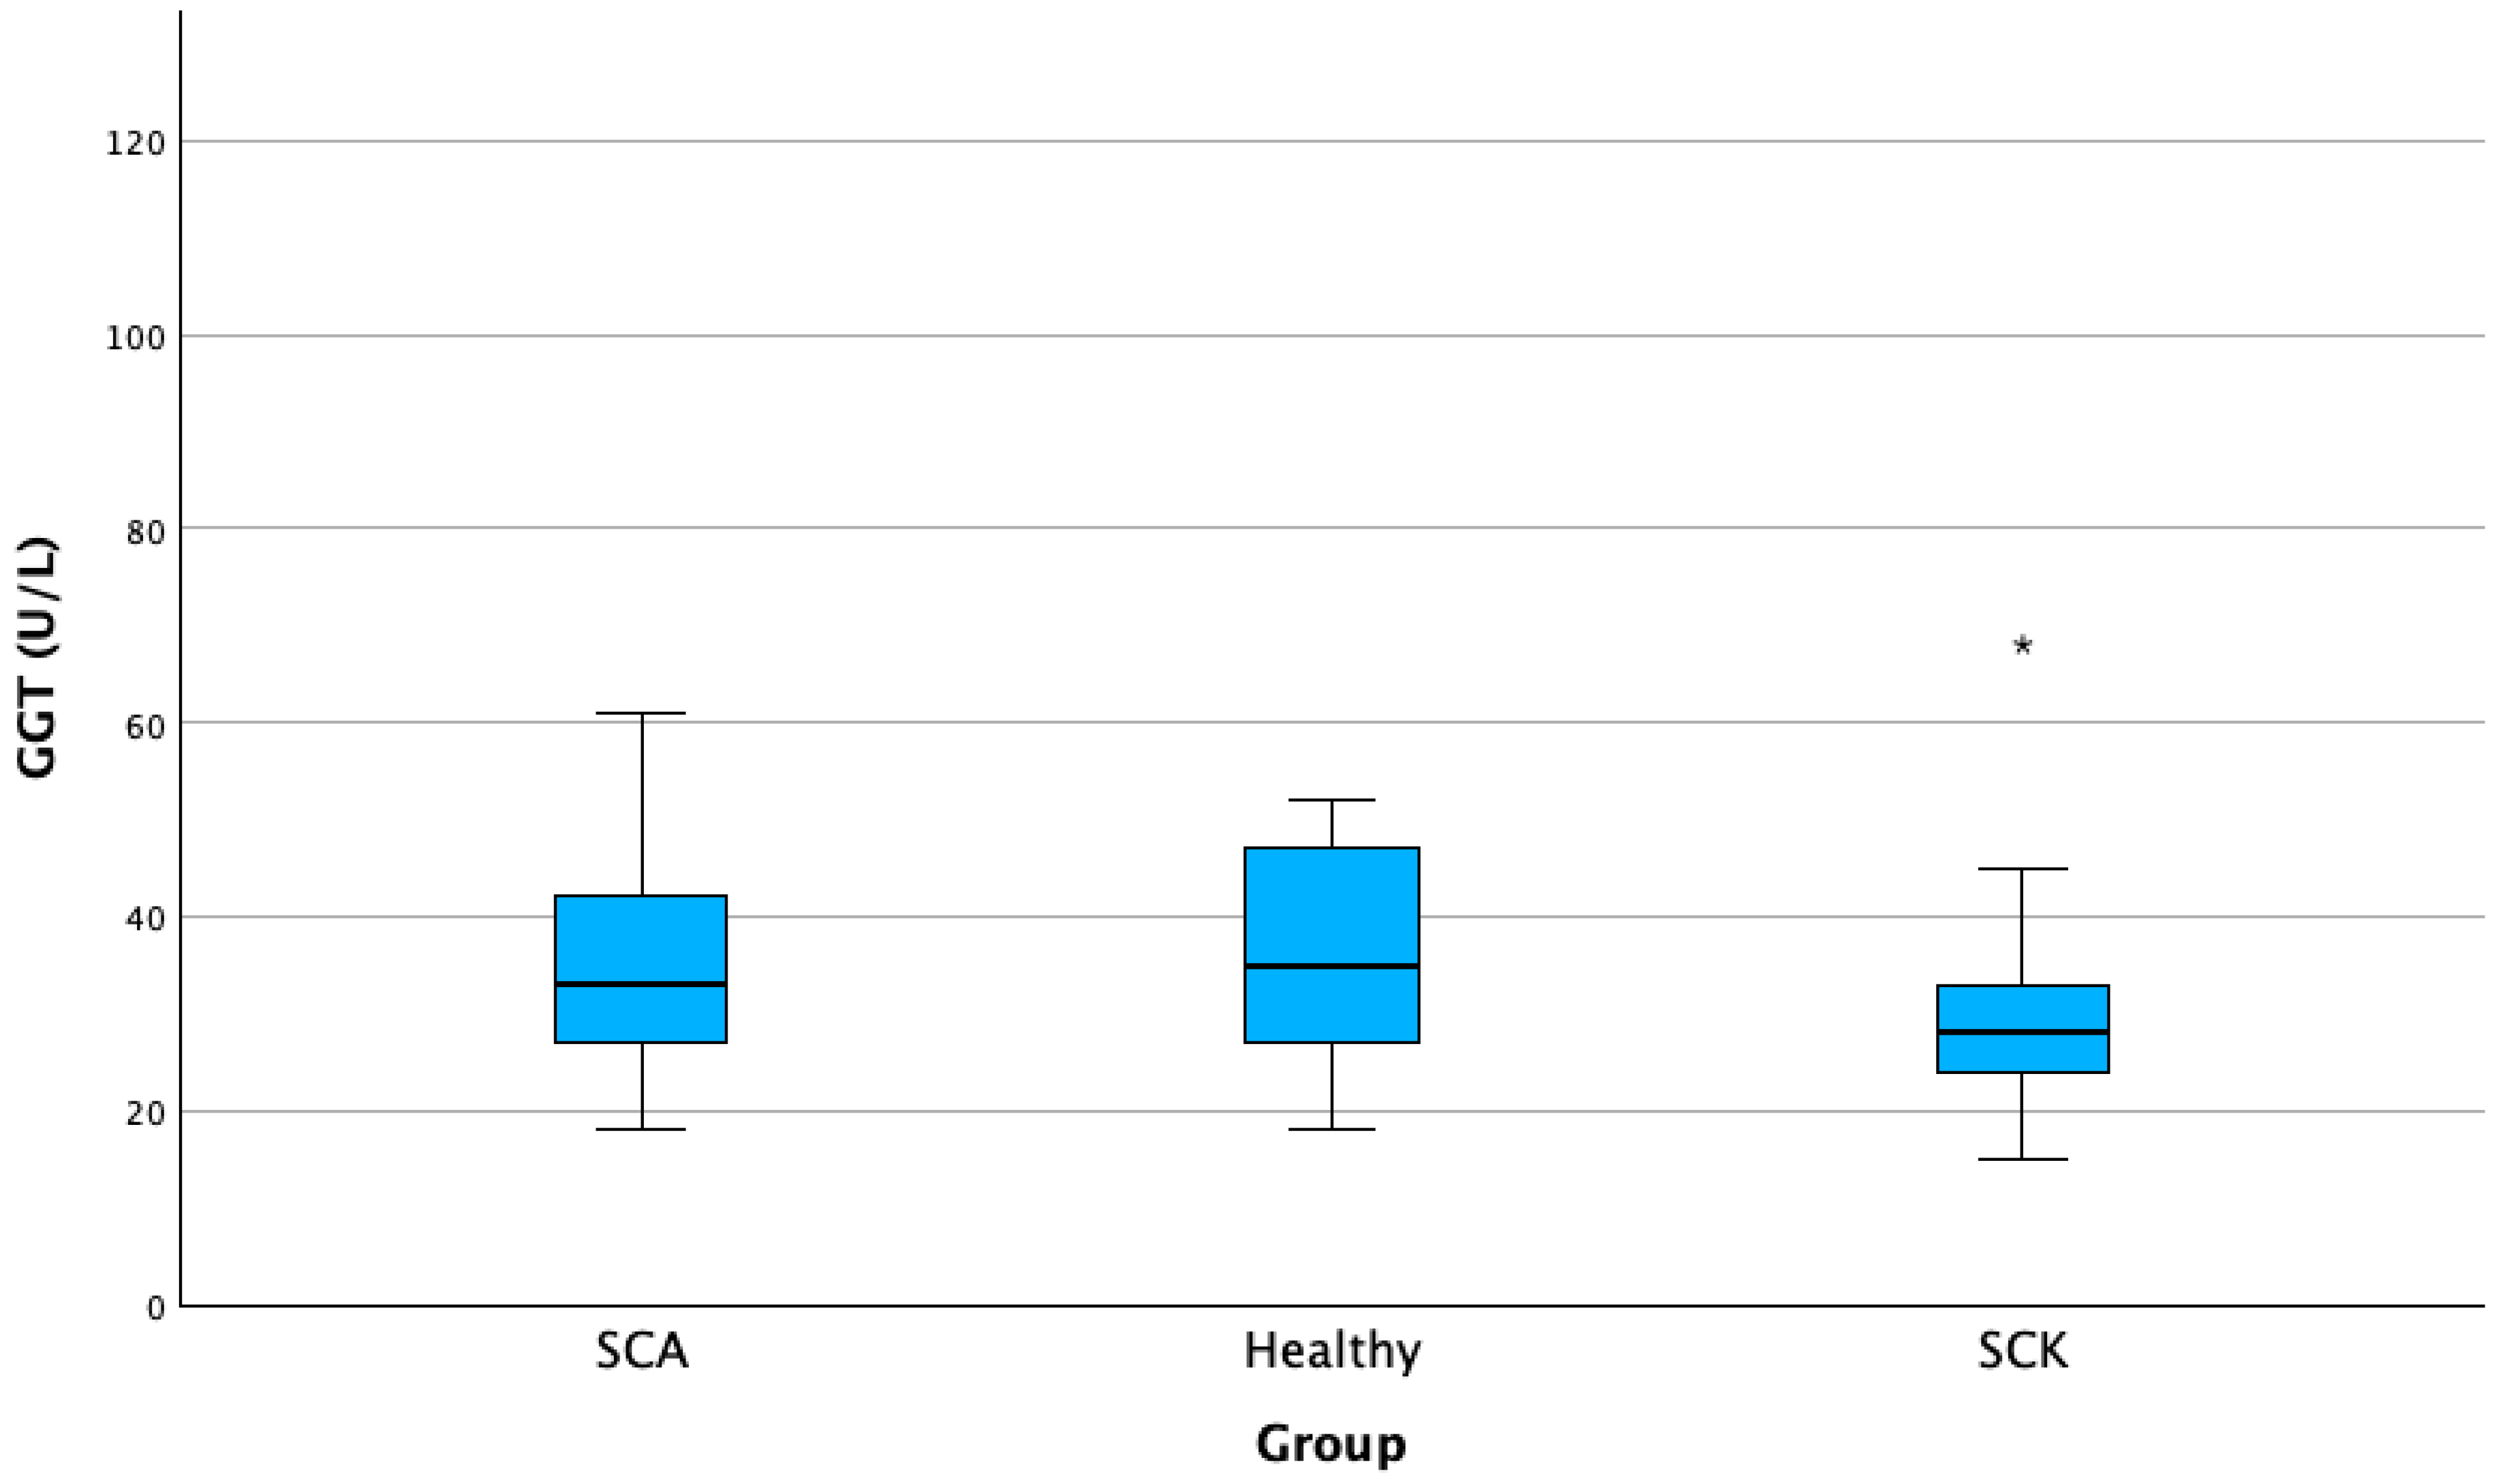
| Serum GGT (U/L) | SCK A | 62 | 30.65 | 9.62 | 1.22 | 28.20 | 33.09 | 15 | 68 |
| H B | 20 | 34.10 | 19.65 | 4.39 | 24.90 | 43.30 | 16 | 105 | |
| SCA C | 14 | 39.07 B | 14.68 | 3.92 | 30.59 | 47.55 | 24 | 78 | |
| Total | 96 | 32.59 | 13.24 | 1.35 | 29.91 | 35.28 | 15 | 105 | |
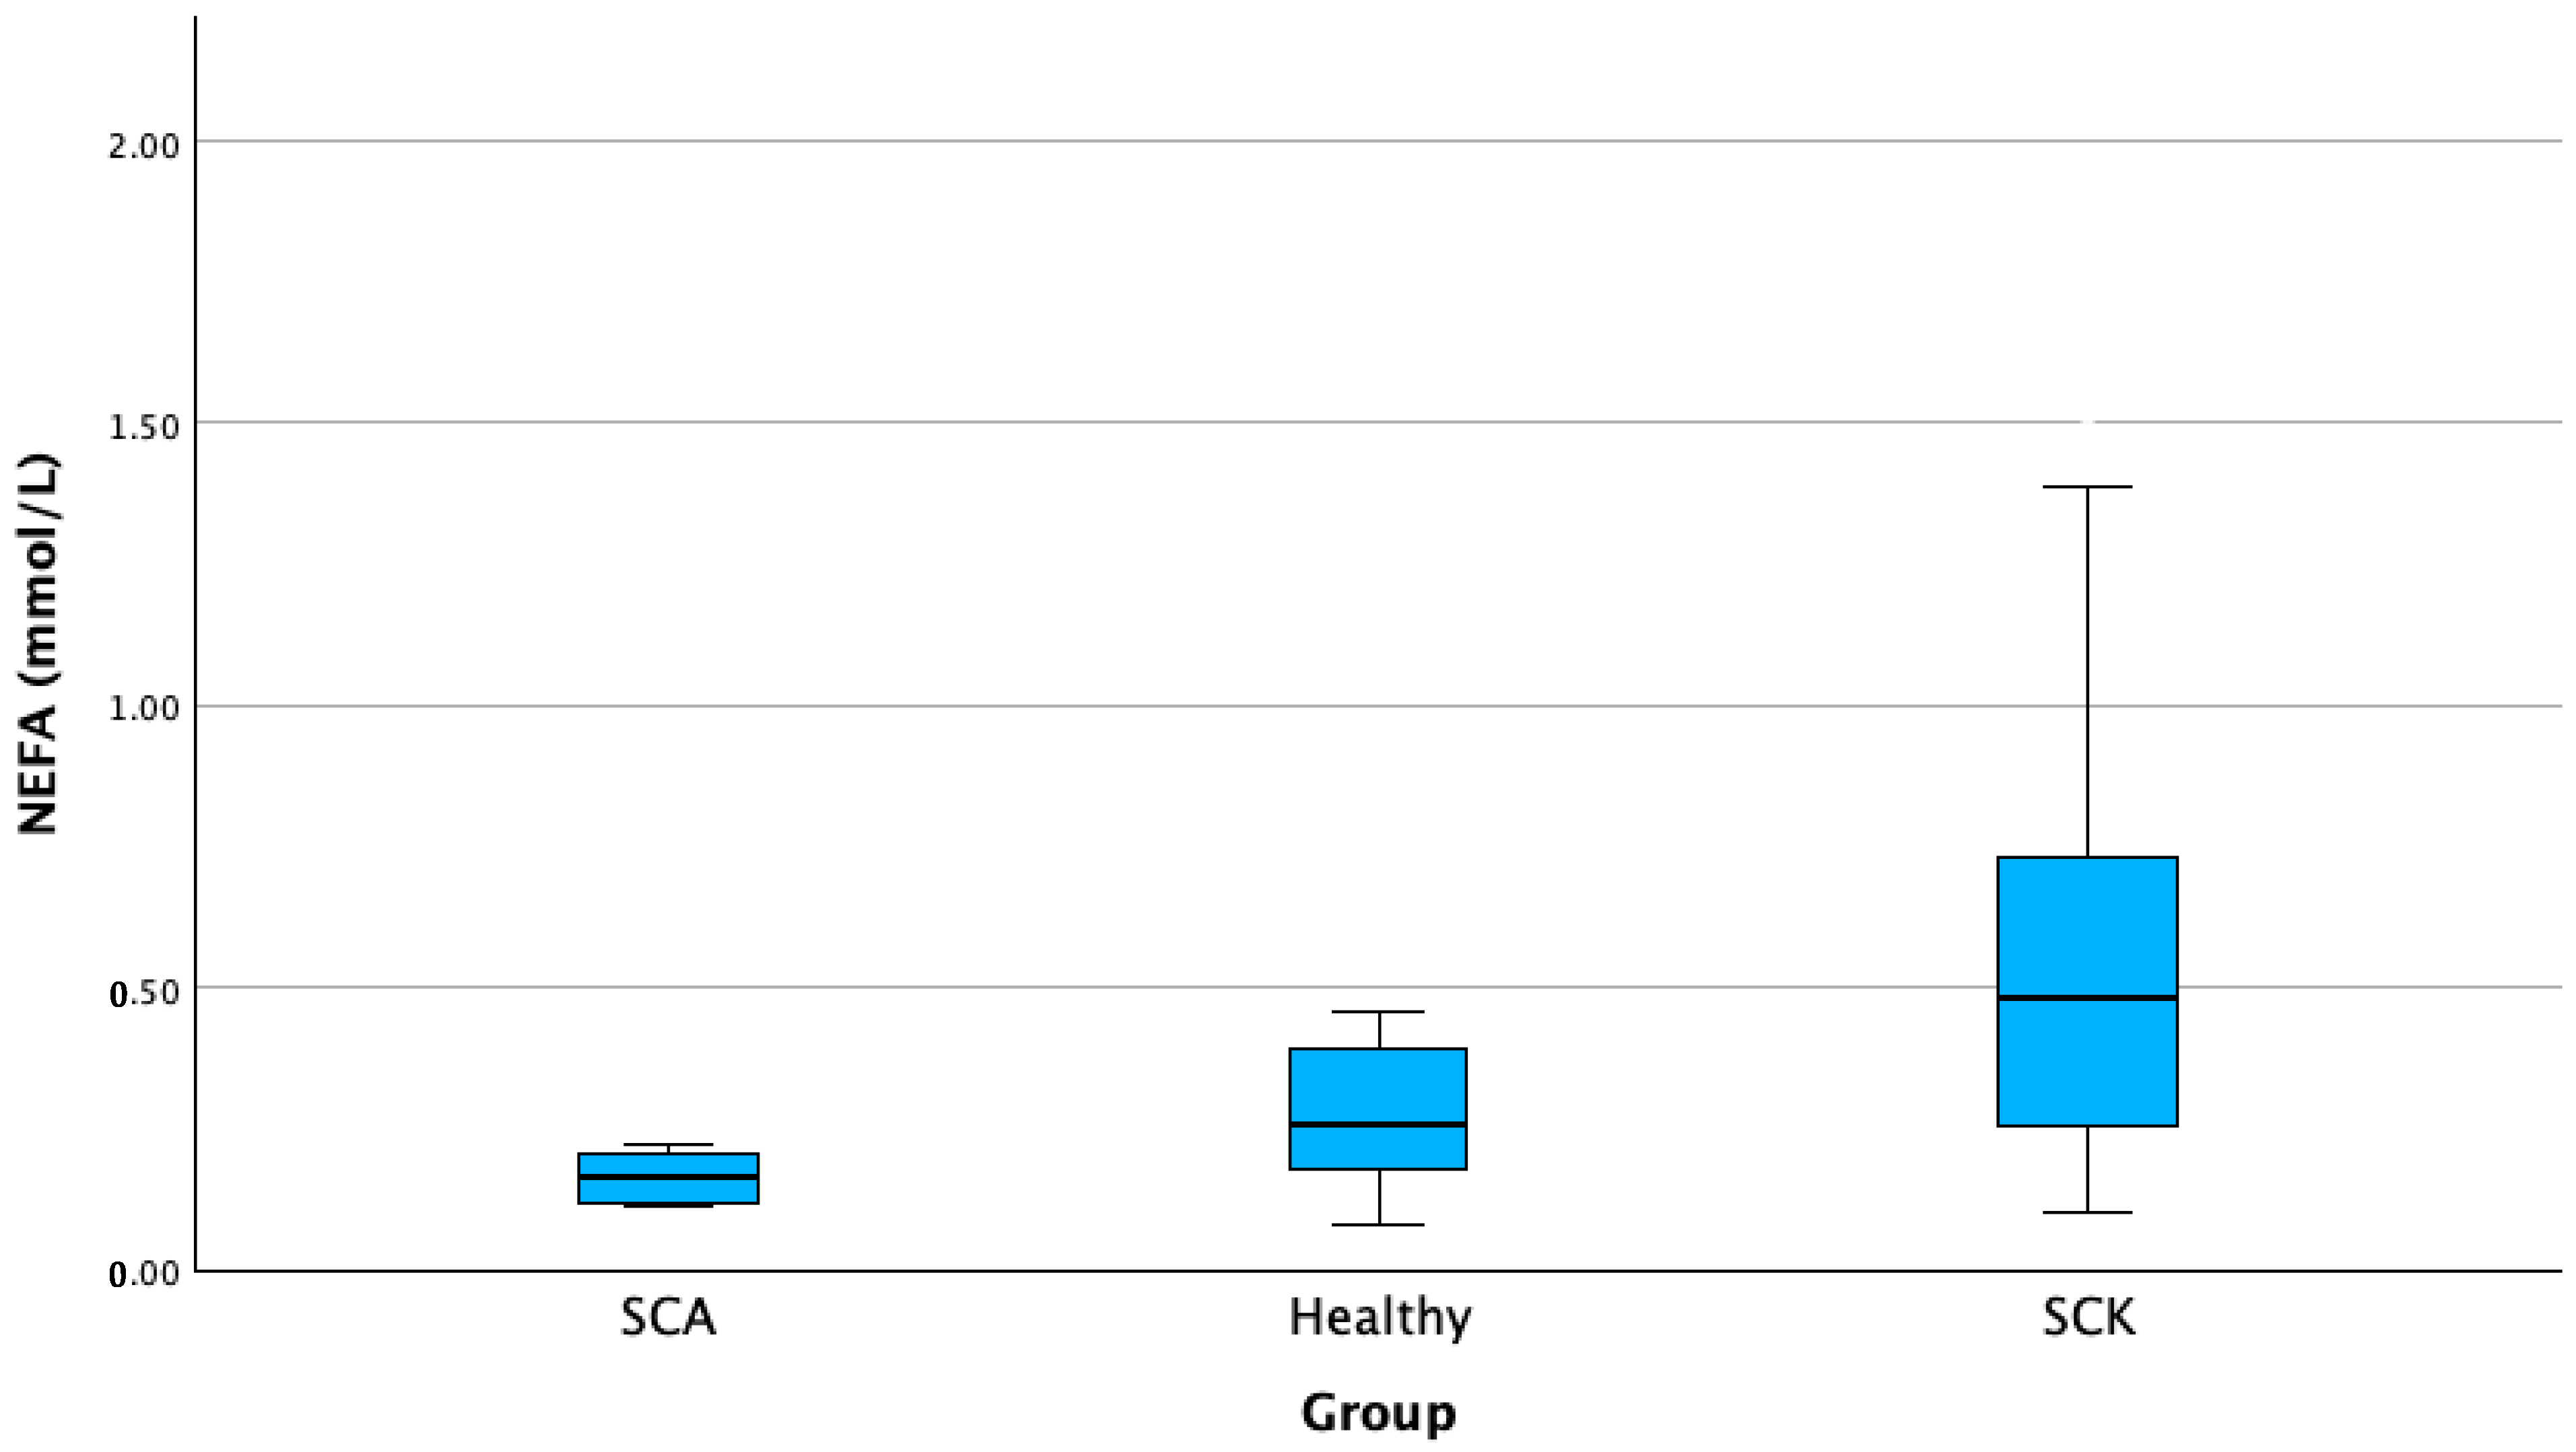
| Serum NEFA (mmol/L) | SCK A | 62 | 0.527 B | 0.32 | 0.04 | 0.44 | 0.60 | 0.10 | 1.52 |
| H B | 20 | 0.316 | 0.25 | 0.05 | 0.19 | 0.43 | 0.08 | 1.12 | |
| SCA C | 14 | 0.183 | 0.08 | 0.02 | 0.13 | 0.23 | 0.11 | 0.41 | |
| Total | 96 | 0.433 | 0.31 | 0.03 | 0.36 | 0.49 | 0.08 | 1.52 | |
| Serum albumin (g/L) | SCK | 62 | 35.98 | 2.23 | 0.28 | 35.41 | 36.55 | 29.2 | 39.9 |
| H | 20 | 36.16 | 2.09 | 0.46 | 35.18 | 37.14 | 31.1 | 39.4 | |
| SCA | 14 | 36.87 | 1.97 | 0.52 | 35.73 | 38.02 | 32.9 | 40.4 | |
| Total | 96 | 36.15 | 2.17 | 0.22 | 35.71 | 36.59 | 29.2 | 40.4 | |
| Lactation number | SCK | 62 | 2.27 | 1.681 | 0.213 | 1.85 | 2.70 | 2 | 4 |
| H | 20 | 2.00 | 1.124 | 0.251 | 1.47 | 2.53 | 2 | 5 | |
| SCA | 14 | 1.93 | 0.730 | 0.195 | 1.51 | 2.35 | 2 | 3 | |
| Total | 96 | 2.17 | 1.470 | 0.150 | 1.87 | 2.46 | 2 | 4 | |
| Correlations | ||||||||||
|---|---|---|---|---|---|---|---|---|---|---|
| Fat-to-Protein Ratio | Serum GGT | Serum AST | Lactation Number | DIM | Capillary Glucose | Capillary BHBA | Serum NEFA | Serum Albumin | ||
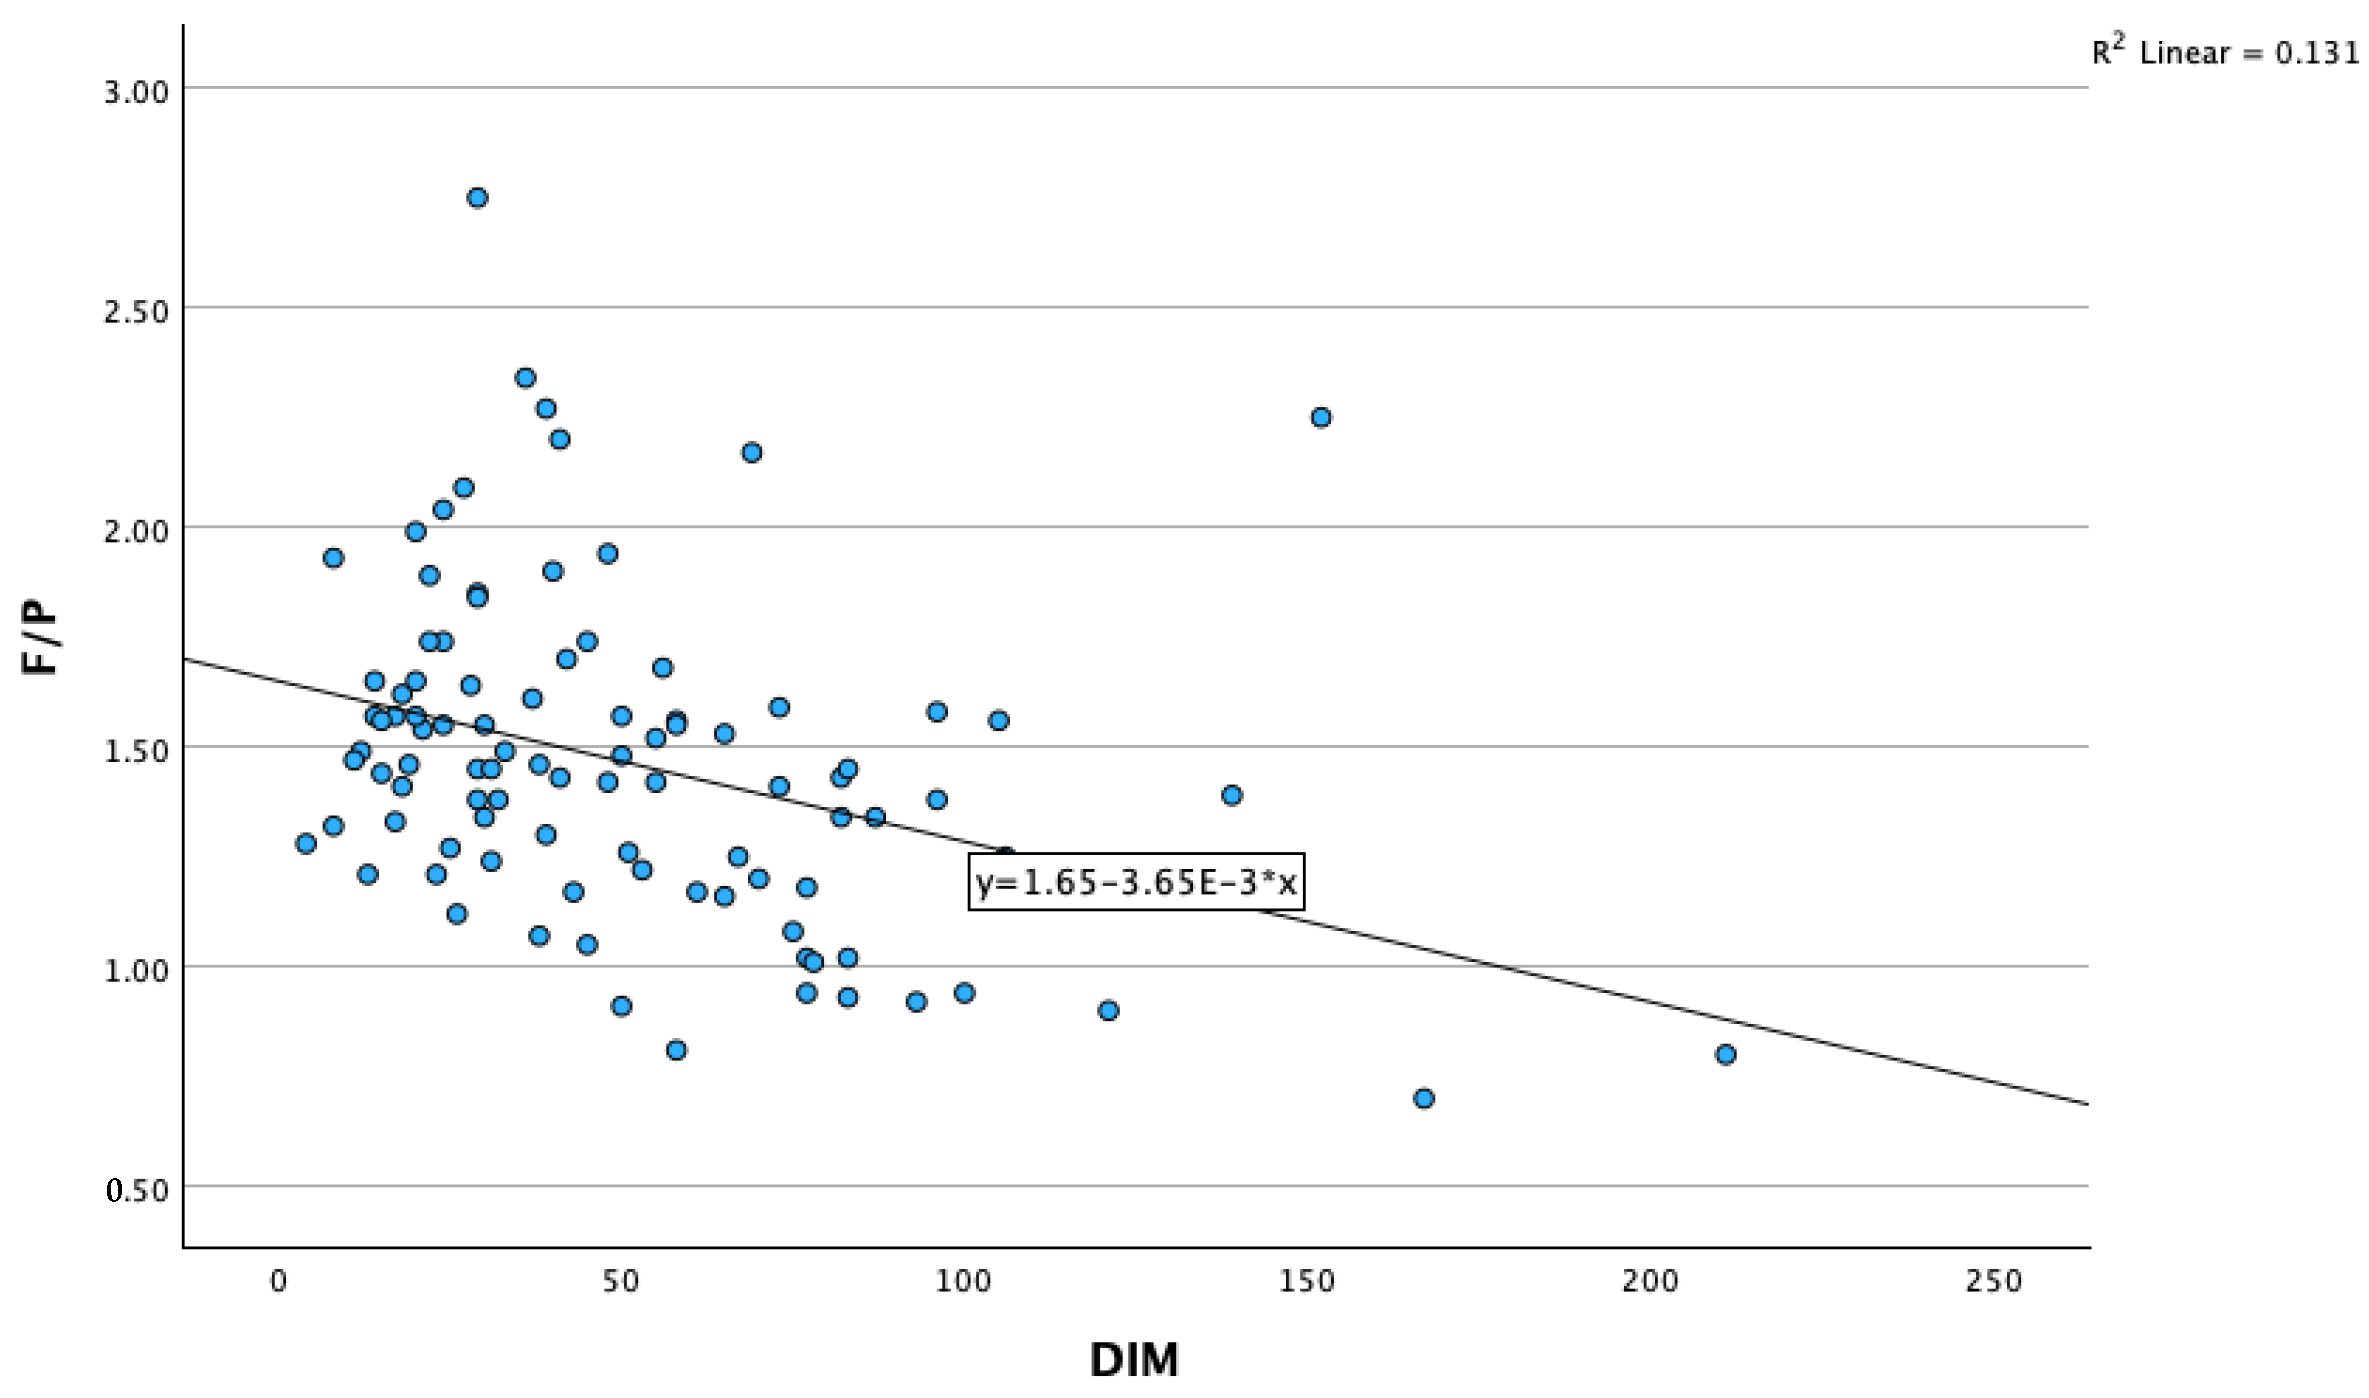
| Fat-to-protein ratio | Pearson‘s correlation | 1 | –0.161 | –0.052 | 0.171 | –0.363 ** | 0.287 ** | 0.195 | 0.499 ** | –0.282 ** |
| sig. (two-tailed) | 0.118 | 0.612 | 0.096 | <0.001 | 0.005 | 0.057 | <0.001 | 0.005 | ||
| N | 96 | 96 | 96 | 96 | 96 | 95 | 96 | 96 | 96 | |
| Serum GGT | Pearson’s correlation | –0.161 | 1 | 0.623 ** | 0.179 | 0.273 ** | 0.059 | –0.109 | 0.072 | –0.107 |
| sig. (two-tailed) | 0.118 | <0.001 | 0.075 | 0.006 | 0.571 | 0.289 | 0.477 | 0.288 | ||
| N | 96 | 100 | 100 | 100 | 100 | 96 | 97 | 100 | 100 | |
| Serum AST | Pearson’s correlation | –0.052 | 0.623 ** | 1 | 0.115 | 0.140 | –0.028 | 0.105 | 0.258 ** | –0.053 |
| sig. (two-tailed) | 0.612 | <0.001 | 0.255 | 0.166 | 0.783 | 0.308 | 0.009 | 0.603 | ||
| N | 96 | 100 | 100 | 100 | 100 | 96 | 97 | 100 | 100 | |
| Lactation number | Pearson’s correlation | 0.171 | 0.179 | 0.115 | 1 | 0.035 | –0.210 * | 0.329 ** | 0.135 | –0.077 |
| sig. (two-tailed) | 0.096 | 0.075 | 0.255 | 0.731 | 0.040 | 0.001 | 0.179 | 0.445 | ||
| N | 96 | 100 | 100 | 100 | 100 | 96 | 97 | 100 | 100 | |
| DIM | Pearson’s correlation | –0.363 ** | 0.273 ** | 0.140 | 0.035 | 1 | –0.052 | –0.155 | –0.460 ** | 0.084 |
| sig. (two-tailed) | <0.001 | 0.006 | 0.166 | 0.731 | 0.618 | 0.129 | <0.001 | 0.407 | ||
| N | 96 | 100 | 100 | 100 | 100 | 96 | 97 | 100 | 100 | |
| Capillary glucose | Pearson’s correlation | 0.287 ** | 0.059 | –0.028 | –0.210 * | –0.052 | 1 | –0.330 ** | 0.156 | –0.003 |
| sig. (two-tailed) | 0.005 | 0.571 | 0.783 | 0.040 | 0.618 | 0.001 | 0.128 | 0.979 | ||
| N | 95 | 96 | 96 | 96 | 96 | 96 | 96 | 96 | 96 | |
| Capillary BHBA | Pearson’s correlation | 0.195 | –0.109 | 0.105 | 0.329 ** | –0.155 | –0.330 ** | 1 | 0.321 ** | –0.123 |
| sig. (two-tailed) | 0.057 | 0.289 | 0.308 | 0.001 | 0.129 | 0.001 | 0.001 | 0.229 | ||
| N | 96 | 97 | 97 | 97 | 97 | 96 | 97 | 97 | 97 | |
| Serum NEFA | Pearson’s correlation | 0.499 ** | 0.072 | 0.258 ** | 0.135 | –0.460 ** | 0.156 | 0.321 ** | 1 | –0.073 |
| sig. (two-tailed) | <0.001 | 0.477 | 0.009 | 0.179 | <0.001 | 0.128 | 0.001 | 0.468 | ||
| N | 96 | 100 | 100 | 100 | 100 | 96 | 97 | 100 | 100 | |
| Serum albumin | Pearson’s correlation | –0.282 | –0.107 | –0.053 | –0.077 | 0.084 | –0.003 | –0.123 | –0.073 | 1 |
| sig. (two-tailed) | 0.005 | 0.288 | 0.603 | 0.445 | 0.407 | 0.979 | 0.229 | 0.468 | ||
| N | 96 | 100 | 100 | 100 | 100 | 96 | 97 | 100 | 100 | |
Disclaimer/Publisher’s Note: The statements, opinions and data contained in all publications are solely those of the individual author(s) and contributor(s) and not of MDPI and/or the editor(s). MDPI and/or the editor(s) disclaim responsibility for any injury to people or property resulting from any ideas, methods, instructions or products referred to in the content. |
© 2023 by the authors. Licensee MDPI, Basel, Switzerland. This article is an open access article distributed under the terms and conditions of the Creative Commons Attribution (CC BY) license (https://creativecommons.org/licenses/by/4.0/).
Share and Cite
Antanaitis, R.; Džermeikaitė, K.; Januškevičius, V.; Šimonytė, I.; Baumgartner, W. In-Line Registered Milk Fat-to-Protein Ratio for the Assessment of Metabolic Status in Dairy Cows. Animals 2023, 13, 3293. https://doi.org/10.3390/ani13203293
Antanaitis R, Džermeikaitė K, Januškevičius V, Šimonytė I, Baumgartner W. In-Line Registered Milk Fat-to-Protein Ratio for the Assessment of Metabolic Status in Dairy Cows. Animals. 2023; 13(20):3293. https://doi.org/10.3390/ani13203293
Chicago/Turabian StyleAntanaitis, Ramūnas, Karina Džermeikaitė, Vytautas Januškevičius, Ieva Šimonytė, and Walter Baumgartner. 2023. "In-Line Registered Milk Fat-to-Protein Ratio for the Assessment of Metabolic Status in Dairy Cows" Animals 13, no. 20: 3293. https://doi.org/10.3390/ani13203293