Does Size Matter? Testicular Volume and Its Predictive Ability of Sperm Production in Rams

 , , , , ,
  , , and
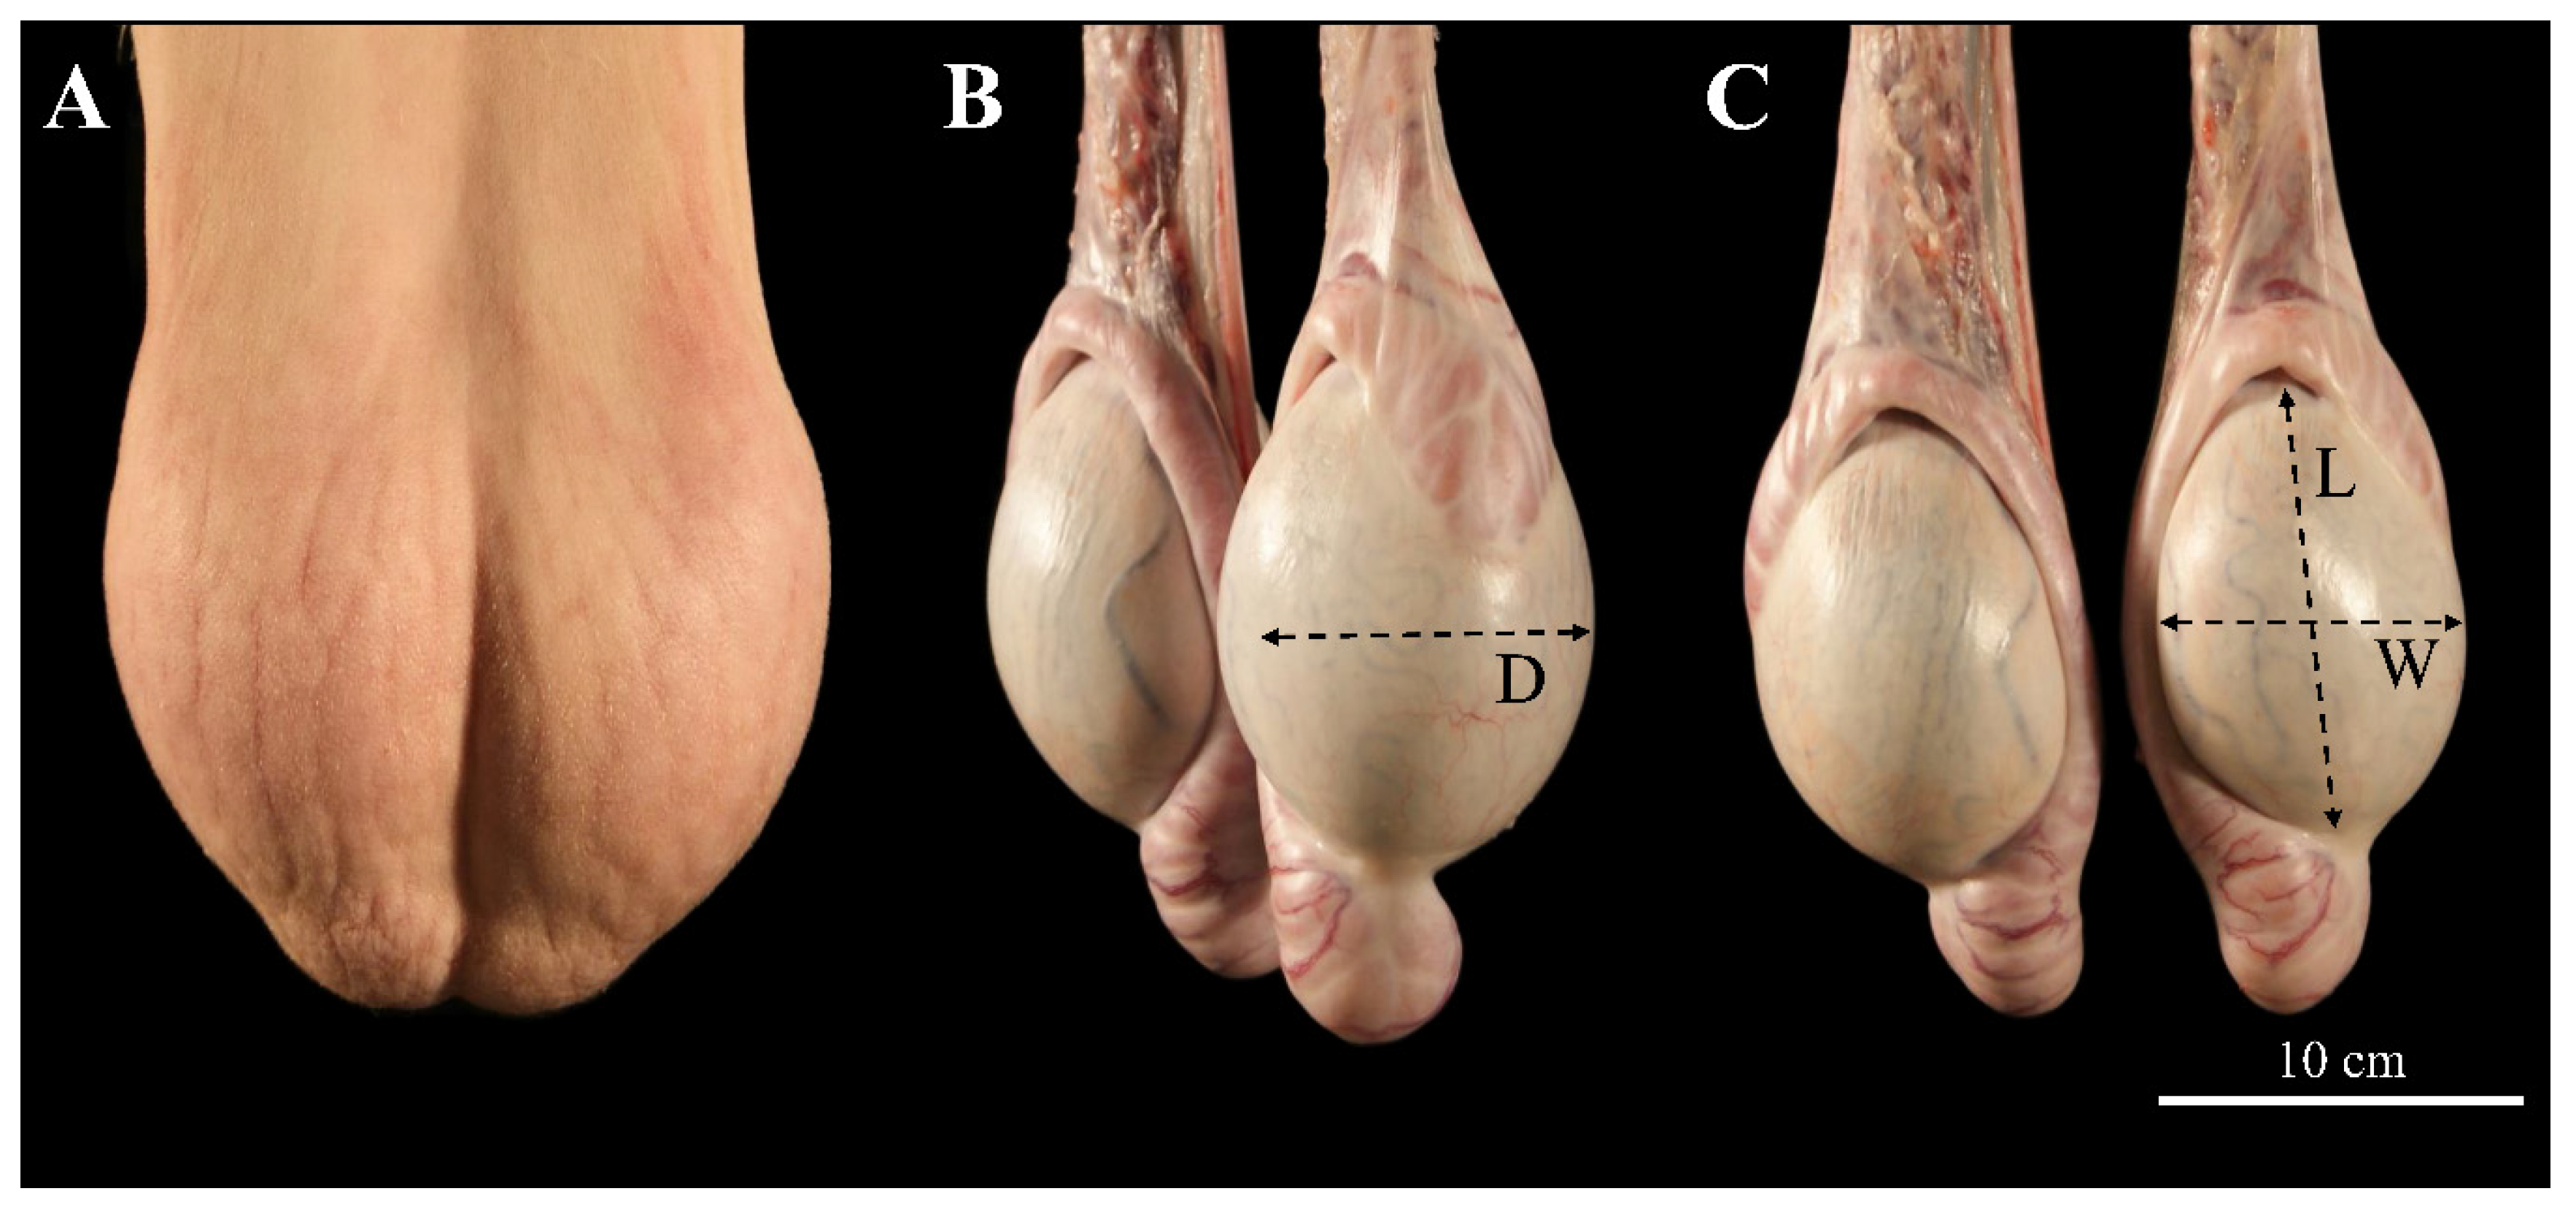
Abstract
:Simple Summary
Abstract
1. Introduction
2. Materials and Methods
2.1. Animals
2.2. Experimental Design
2.2.1. Experiment 1: Determination of Testicular Volume and the Most Suitable Formula
2.2.2. Experiment 2: Analysis of the Sperm Production under Different Field Conditions
2.3. Clinical Examination and Testicular Size Determination by Calipers
2.4. Ultrasound Examination
2.5. Accurate Testicular Volume (ATV) Determination
2.6. Blood Obtention and Determination of Serum Testosterone
2.7. Statistical Analyses
3. Results
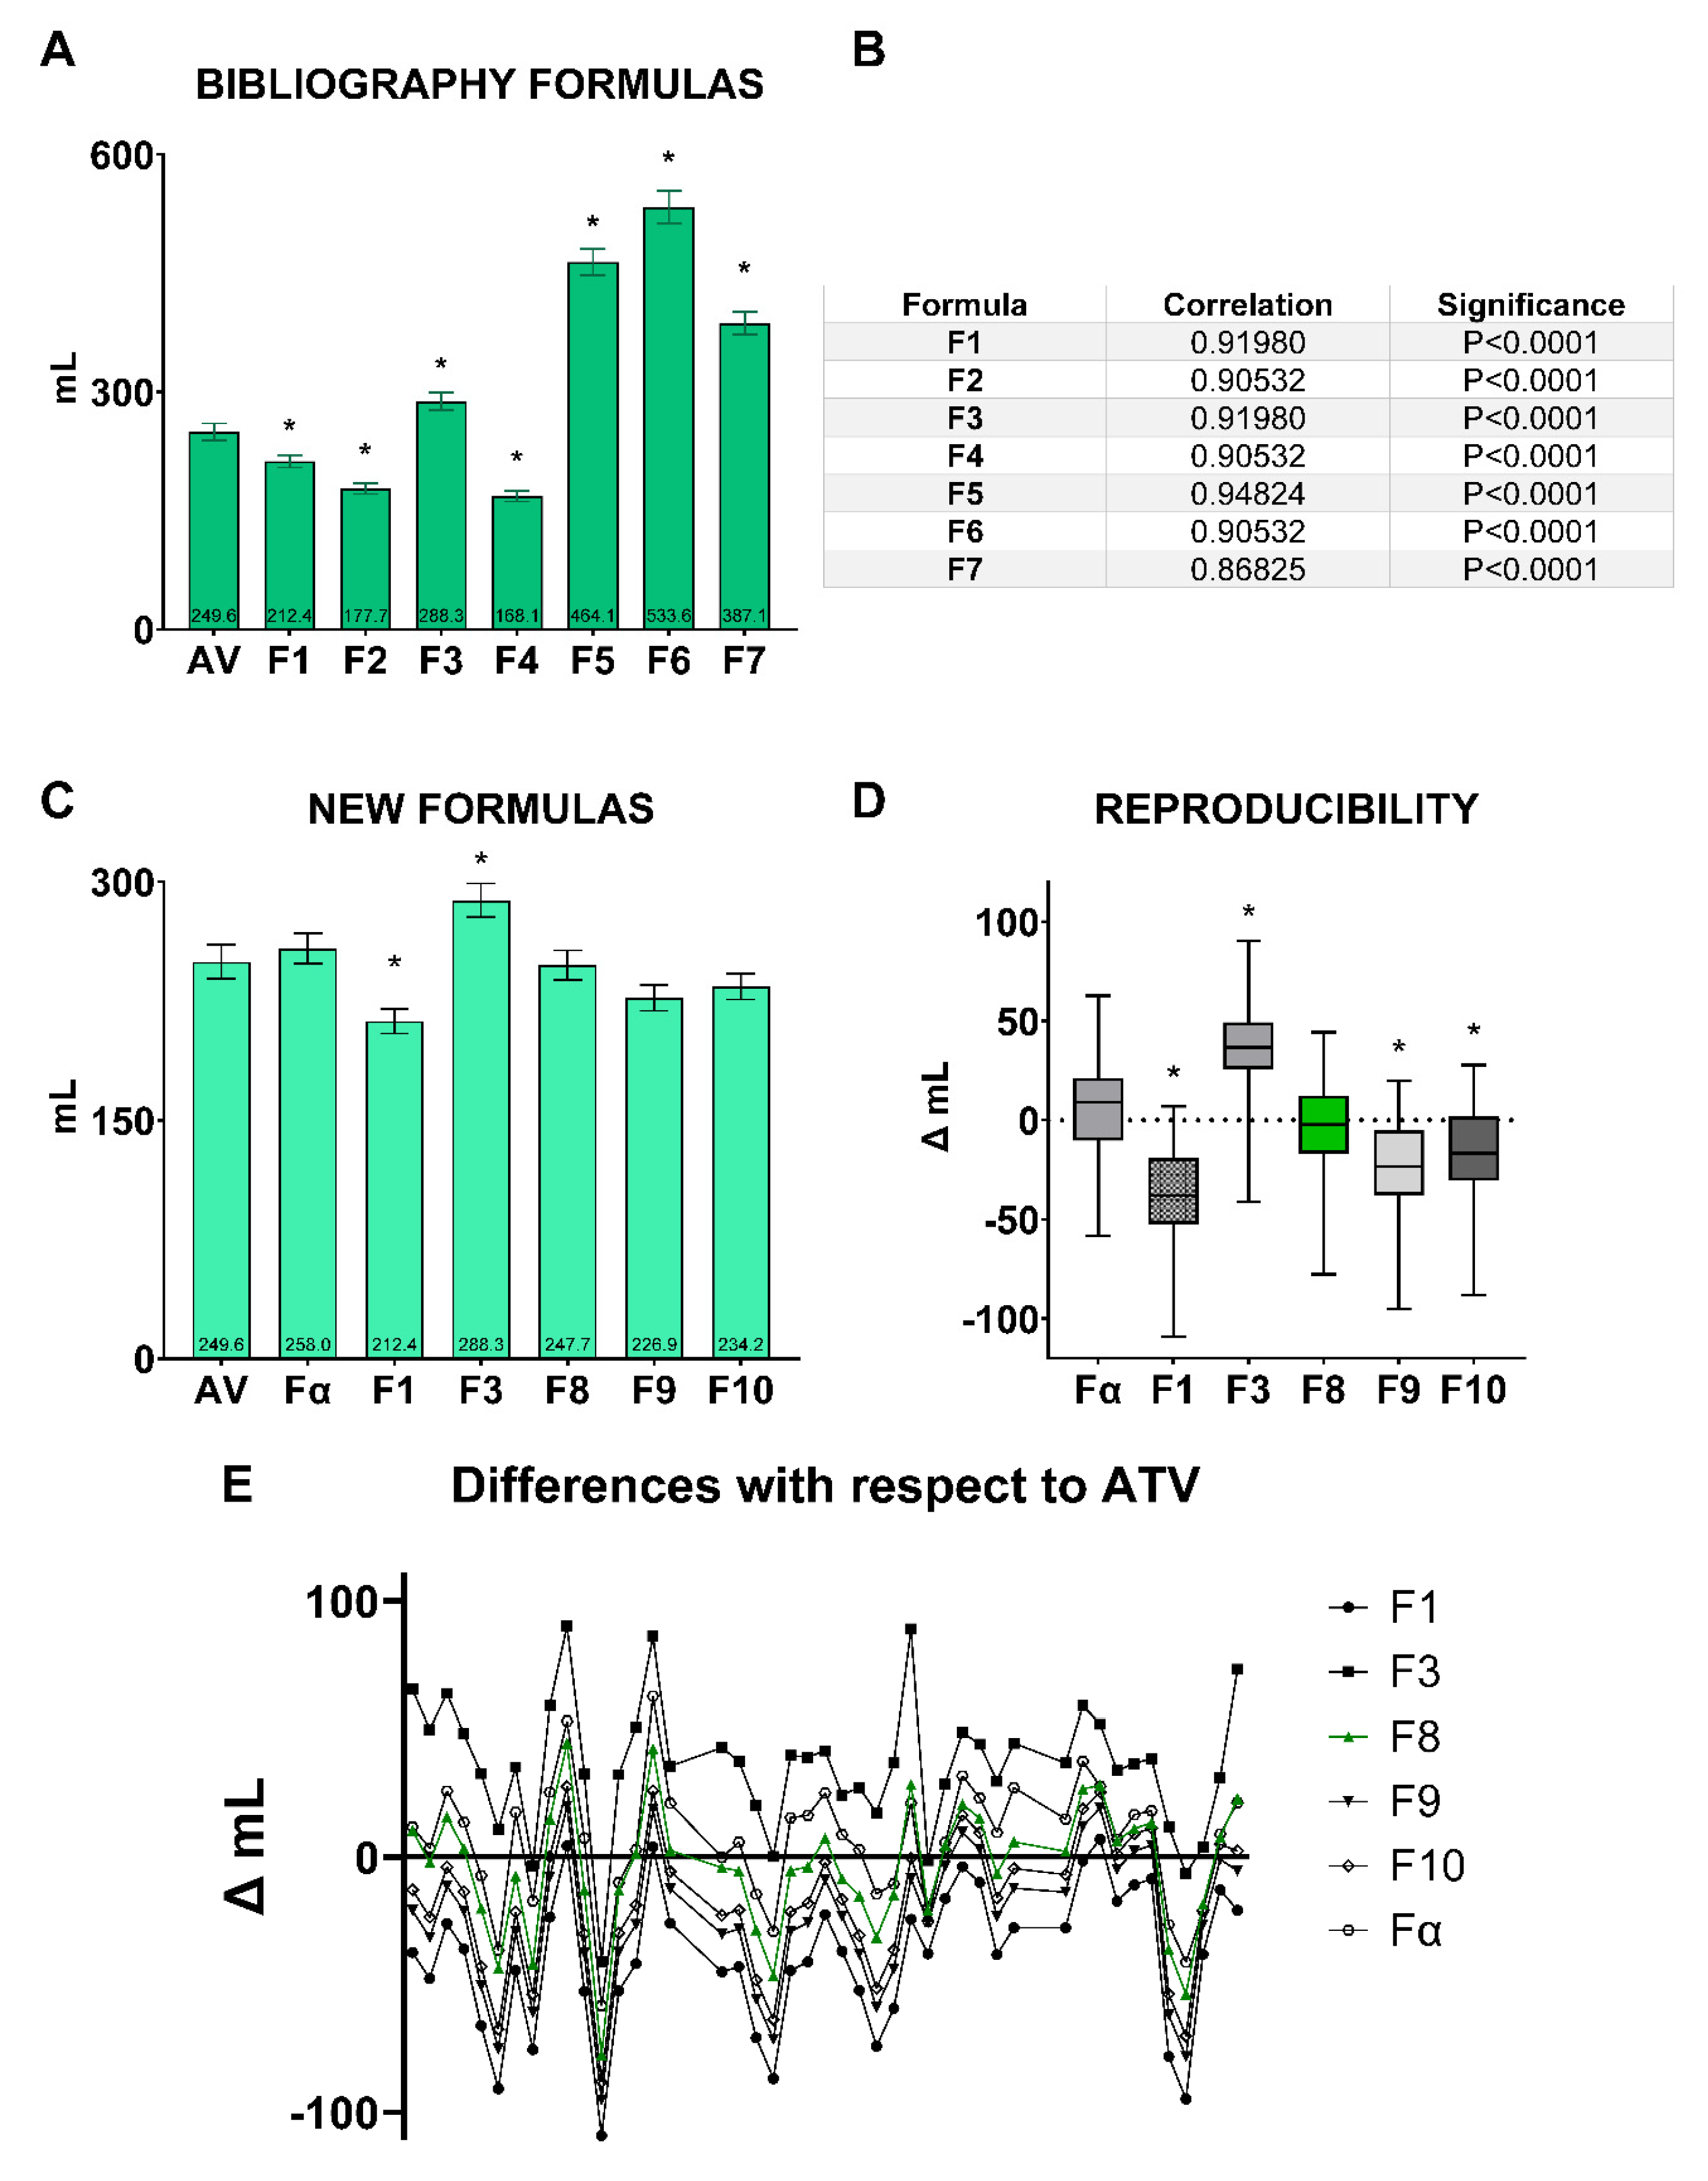
3.1. Reproducibility of the Measuring Tool
3.2. Testicular Measurements and the Most Suitable Formula to Calculate Testicular Volume
3.3. Semen Collection and Ram Working Method in a Reproduction Center under Field Conditions
3.4. Application of Testicular Volume and Serum Testosterone to Estimate Sperm Production
4. Discussion
5. Conclusions
Author Contributions
Funding
Institutional Review Board Statement
Informed Consent Statement
Data Availability Statement
Acknowledgments
Conflicts of Interest
References
- MacLaren, A.P.C. Ram Fertility in South-West Scotland. Br. Vet. J. 1988, 144, 45–54. [Google Scholar] [CrossRef]
- Pardos, L.; Maza, M.T.; Fantova, E.; Sepúlveda, W. The Diversity of Sheep Production Systems in Aragón (Spain): Characterisation and Typification of Meat Sheep Farms. Span. J. Agric. Res. 2008, 6, 497–507. [Google Scholar] [CrossRef]
- Cameron, A.W.N.; Tilbrook, A.J.; Lindsay, D.R.; Keogh, E.J.; Fairnie, I.J. The Effect of Testicular Weight and Insemination Technique on Fertility of Sheep. Anim. Reprod. Sci. 1986, 12, 189–194. [Google Scholar] [CrossRef]
- Kimberling, C.V.; Parsons, G.A. Breeding Soundness Evaluation and Surgical Sterilization of the Ram, 2nd ed.; Elsevier Inc.: St. Louis, MO, USA, 2006; ISBN 9780721693231. [Google Scholar]
- Aguirre, V.; Orihuela, A.; Vázquez, R. Effect of Semen Collection Frequency on Seasonal Variation in Sexual Behaviour, Testosterone, Testicular Size and Semen Characteristics of Tropical Hair Rams (Ovis aries). Trop. Anim. Health Prod. 2007, 39, 271–277. [Google Scholar] [CrossRef] [PubMed]
- Hussein, H.A.; Hassaneen, A.S.A.; Ali, M.E.; Sindi, R.A.; Ashour, A.M.; Fahmy, S.M.; Swelum, A.A.; Ahmed, A.E. The Impact of Rumen-Protected L-Arginine Oral Supplementation on Libido, Semen Quality, Reproductive Organ Biometry, and Serum Biochemical Parameters of Rams. Front. Vet. Sci. 2022, 9, 899434. [Google Scholar] [CrossRef] [PubMed]
- Ortega-Ferrusola, C.; Gracia-Calvo, L.; Ezquerra, J.; Pena, F. Use of Colour and Spectral Doppler Ultrasonography in Stallion Andrology. Reprod. Domest. Anim. 2014, 49, 88–96. [Google Scholar] [CrossRef]
- El-Alamy, M.A.A.; Foote, R.H.H.; Hare, E. Sperm Output and Hormone Concentrations in Finn and Dorset Rams Exposed to Long- and Short-Day Lighting. Theriogenology 2001, 56, 839–854. [Google Scholar] [CrossRef]
- Brito, L.F.; Silva, A.E.D.; Barbosa, R.T.; Kastelic, J.P. Testicular Thermoregulation in Bos Indicus, Crossbred and Bos Taurus Bulls: Relationship with Scrotal, Testicular Vascular Cone and Testicular Morphology, and Effects on Semen Quality and Sperm Production. Theriogenology 2004, 61, 511–528. [Google Scholar] [CrossRef]
- Lunstra, D.D.; Cundiff, L. V Growth and Pubertal Development in Brahman-, Boran-, Tuli-, Belgian Blue-, Hereford- and Angus-Sired F1 Bulls. J. Anim. Sci. 2003, 81, 1414–1426. [Google Scholar] [CrossRef]
- Gouletsou, P.G.; Galatos, A.D.; Leontides, L.S. Comparison between Ultrasonographic and Caliper Measurements of Testicular Volume in the Dog. Anim. Reprod. Sci. 2008, 108, 1–12. [Google Scholar] [CrossRef]
- Milczewski, V.; Chahad-Ehlers, S.; Spercoski, K.M.; Morais, R.N.; Thomaz Soccol, V. Quantifying the Effect of Seasonality on Testicular Function of Suffolk Ram in Lower Latitude. Small Rumin. Res. 2015, 124, 68–75. [Google Scholar] [CrossRef]
- Pozor, M.A.; Nolin, M.; Roser, J.; Runyon, S.; Macpherson, M.L.; Kelleman, A. Doppler Indices of Vascular Impedance as Indicators of Testicular Dysfunction in Stallions. J. Equine Vet. Sci. 2014, 34, 38–39. [Google Scholar] [CrossRef]
- Zelli, R.; Troisi, A.; Elad Ngonput, A.; Cardinali, L.; Polisca, A. Evaluation of Testicular Artery Blood Flow by Doppler Ultrasonography as a Predictor of Spermatogenesis in the Dog. Res. Vet. Sci. 2013, 95, 632–637. [Google Scholar] [CrossRef] [PubMed]
- Samir, H.; Sasaki, K.; Ahmed, E.; Karen, A.; Nagaoka, K.; El Sayed, M.; Taya, K.; Watanabe, G. Effect of a Single Injection of Gonadotropin-Releasing Hormone (GnRH) and Human Chorionic Gonadotropin (HCG) on Testicular Blood Flow Measured by Color Doppler Ultrasonography in Male Shiba Goats. J. Vet. Med. Sci. 2015, 77, 549–556. [Google Scholar] [CrossRef]
- Camela, E.S.C.C.; Nociti, R.P.; Santos, V.J.C.C.; Macente, B.I.; Murawski, M.; Vicente, W.R.R.R.; Bartlewski, P.M.; Oliveira, M.E.F. Changes in Testicular Size, Echotexture, and Arterial Blood Flow Associated with the Attainment of Puberty in Dorper Rams Raised in a Subtropical Climate. Reprod. Domest. Anim. 2019, 54, 131–137. [Google Scholar] [CrossRef]
- Hsieh, M.L.; Huang, S.T.; Huang, H.C.; Chen, Y.; Hsu, Y.C. The Reliability of Ultrasonographic Measurements for Testicular Volume Assessment: Comparison of Three Common Formulas with True Testicular Volume. Asian J. Androl. 2009, 11, 261–265. [Google Scholar] [CrossRef]
- Prader, A. Testicular Size: Assessment and Clinical Importance. Triangle 1966, 7, 240–243. [Google Scholar]
- Takihara, H.; Sakatoku, J.; Fujii, M.; Nasu, T.; Cosentino, M.J.; Cockett, A.T. Significance of Testicular Size Measurement in Andrology. I. A New Orchiometer and Its Clinical Application. Fertil. Steril. 1983, 39, 836–840. [Google Scholar] [CrossRef]
- de Souza, M.B.; da Cunha Barbosa, C.; Pereira, B.S.; Monteiro, C.L.B.; Pinto, J.N.; Linhares, J.C.S.; da Silva, L.D.M. Doppler Velocimetric Parameters of the Testicular Artery in Healthy Dogs. Res. Vet. Sci. 2014, 96, 533–536. [Google Scholar] [CrossRef]
- de Souza, M.B.; England, G.C.W.; Mota Filho, A.C.; Ackermann, C.L.; Sousa, C.V.S.; de Carvalho, G.G.; Silva, H.V.R.; Pinto, J.N.; Linhares, J.C.S.; Oba, E.; et al. Semen Quality, Testicular B-Mode and Doppler Ultrasound, and Serum Testosterone Concentrations in Dogs with Established Infertility. Theriogenology 2015, 84, 805–810. [Google Scholar] [CrossRef]
- England, G.C.W.; Bright, L.; Pritchard, B.; Bowen, I.M.; de Souza, M.B.; Silva, L.D.M.; Moxon, R. Canine Reproductive Ultrasound Examination for Predicting Future Sperm Quality. Reprod. Domest. Anim. 2017, 52, 202–207. [Google Scholar] [CrossRef]
- Bailey, T.; Hudson, R.; Powe, T.; Riddell, M.; Wolfe, D.; Carson, R. Caliper and Ultrasonographic Measurements of Bovine Testicles and a Mathematical Formula for Determining Testicular Volume and Weight in Vivo. Theriogenology 1998, 49, 581–594. [Google Scholar] [CrossRef] [PubMed]
- Auclair, D.; Sowerbutts, S.F.; Setchell, B.P. Effect of Active Immunization against Testosterone on Plasma Gonadotrophin Concentrations, Spermatogenic Function, Testicular Blood Flow, Epididymis Mass and Mating Behaviour in Adult Rams. J. Reprod. Fertil. 1995, 104, 17–26. [Google Scholar] [CrossRef] [PubMed]
- Lambert, B. The Frequency of Mumps and of Mumps Orchitis: Consequences for Sexuality and Fertility. Acta Genet. Stat. Med. 1951, 2 (Suppl. S1), 1–6. [Google Scholar] [CrossRef]
- Hedia, M.G.; El-Belely, M.S.; Ismail, S.T.; Abo El-Maaty, A.M. Monthly Changes in Testicular Blood Flow Dynamics and Their Association with Testicular Volume, Plasma Steroid Hormones Profile and Semen Characteristics in Rams. Theriogenology 2019, 123, 68–73. [Google Scholar] [CrossRef] [PubMed]
- Moxon, R.; Bright, L.; Pritchard, B.; Bowen, I.M.; de Souza, M.B.; da Silva, L.D.M.; England, G.C.W. Digital Image Analysis of Testicular and Prostatic Ultrasonographic Echogencity and Heterogeneity in Dogs and the Relation to Semen Quality. Anim. Reprod. Sci. 2015, 160, 112–119. [Google Scholar] [CrossRef] [PubMed]
- Sakamoto, H.; Yajima, T.; Nagata, M.; Okumura, T.; Suzuki, K.; Ogawa, Y. Relationship between Testicular Size by Ultrasonography and Testicular Function: Measurement of Testicular Length, Width, and Depth in Patients with Infertility. Int. J. Urol. 2008, 15, 529–533. [Google Scholar] [CrossRef] [PubMed]
- Schiff, J.D.; Li, P.S.; Goldstein, M. Correlation of Ultrasonographic and Orchidometer Measurements of Testis Volume in Adults. BJU Int. 2004, 93, 1015–1017. [Google Scholar] [CrossRef]
- Strina, A.; Corda, A.; Nieddu, S.; Solinas, G.; Lilliu, M.; Zedda, M.T.; Pau, S.; Ledda, S. Annual Variations in Resistive Index (RI) of Testicular Artery, Volume Measurements and Testosterone Levels in Bucks. Comp. Clin. Pathol. 2016, 25, 409–413. [Google Scholar] [CrossRef]
- Elmaz, Ö.; Cirit, Ü.; Demir, H. Relationship of Testicular Development with Age, Body Weight, Semen Characteristics and Testosterone in Kivircik Ram Lambs. S. Afr. J. Anim. Sci. 2007, 37, 269–274. [Google Scholar] [CrossRef]
- Giffin, J.L.; Bartlewski, P.M.; Hahnel, A.C. Correlations among Ultrasonographic and Microscopic Characteristics of Prepubescent Ram Lamb Testes. Exp. Biol. Med. 2014, 239, 1606–1618. [Google Scholar] [CrossRef] [PubMed]
- Steger, K.; Wrobel, K.H. Immunohistochemical Demonstration of Cytoskeletal Proteins in the Ovine Testis during Postnatal Development. Anat. Embryol. 1994, 189, 521–530. [Google Scholar] [CrossRef]
- Ribeiro, M.d.S.; Quirino, C.R.; Bartholazzi Junior, A.; Pacheco, A. Biometry and Ultrasound Evaluation of Testicles and Accessory Glands in Santa Ines Rams. Rev. Bras. Zootec. 2017, 46, 317–323. [Google Scholar] [CrossRef]
- Handelsman, D.J.; Staraj, S. Testicular Size: The Effects of Aging, Malnutrition, and Illness. J. Androl. 1985, 6, 144–151. [Google Scholar] [CrossRef] [PubMed]
- Rivkees, S.A.; Hall, D.A.; Boepple, P.A.; Crawford, J.D. Accuracy and Reproducibility of Clinical Measures of Testicular Volume. J. Pediatr. 1987, 110, 914–917. [Google Scholar] [CrossRef]
- Amann, R.P.; Hammerstedt, R.H. In Vitro Evaluation of Sperm Quality: An Opinion. J. Androl. 1993, 14, 397–406. [Google Scholar]
- Giffin, J.L.; Franks, S.E.; Rodriguez-Sosa, J.R.; Hahnel, A.; Bartlewski, P.M. A Study of Morphological and Haemodynamic Determinants of Testicular Echotexture Characteristics in the Ram. Exp. Biol. Med. 2009, 234, 794–801. [Google Scholar] [CrossRef]
- Han, Y.; Liu, G.; Jiang, X.; Ijaz, N.; Tesema, B.; Xie, G. KISS1 Can Be Used as a Novel Target for Developing a DNA Immunocastration Vaccine in Ram Lambs. Vaccine 2015, 33, 777–782. [Google Scholar] [CrossRef]
- Fernandez-Abella, D.; Becu-Villalobos, D.; Lacau-Mengido, I.M.; Villegas, N.; Bentancur, O. Sperm Production, Testicular Size, Serum Gonadotropins and Testosterone Levels in Merino and Corriedale Breeds. Reprod. Nutr. Dev. 1999, 39, 617–624. [Google Scholar] [CrossRef]
- Montes-Garrido, R.; Riesco, M.F.; Anel-Lopez, L.; Neila-Montero, M.; Palacin-Martinez, C.; Boixo, J.C.; de Paz, P.; Ortega-Ferrusola, C.; Hassan, M.A.A.; Anel, L.; et al. Application of Ultrasound Technique to Evaluate the Testicular Function and Its Correlation to the Sperm Quality after Different Collection Frequency in Rams. Front. Vet. Sci. 2022, 9, 1869. [Google Scholar] [CrossRef]
- Neila-Montero, M.; Riesco, M.F.; Montes-Garrido, R.; Palacin-Martinez, C.; Chamorro, C.; De Paz, P.; Alvarez, M.; Anel, L.; Anel-Lopez, L. An Optimized Centrifugation Protocol for Ram Sperm Ensuring High Sample Yield, Quality and Fertility. Theriogenology 2022, 191, 179–191. [Google Scholar] [CrossRef] [PubMed]
- Sakamoto, H.; Saito, K.; Oohta, M.; Inoue, K.; Ogawa, Y.; Yoshida, H. Testicular Volume Measurement: Comparison of Ultrasonography, Orchidometry, and Water Displacement. Urology 2007, 69, 152–157. [Google Scholar] [CrossRef] [PubMed]
- Zamiri, M.J.; Khalili, B.; Jafaroghli, M.; Farshad, A. Seasonal Variation in Seminal Parameters, Testicular Size, and Plasma Testosterone Concentration in Iranian Moghani Rams. Small Rumin. Res. 2010, 94, 132–136. [Google Scholar] [CrossRef]
- Pricking, S.; Bollwein, H.; Spilker, K.; Martinsson, G.; Schweizer, A.; Thomas, S.; Oldenhof, H.; Sieme, H. Testicular Volumetry and Prediction of Daily Sperm Output in Stallions by Orchidometry and Two- and Three-Dimensional Sonography. Theriogenology 2017, 104, 149–155. [Google Scholar] [CrossRef]
- Paltiel, H.J.; Diamond, D.A.; Di Canzio, J.; Zurakowski, D.; Borer, J.G.; Atala, A. Testicular Volume: Comparison of Orchidometer and US Measurements in Dogs. Radiology 2002, 222, 114–119. [Google Scholar] [CrossRef] [PubMed]
- Gouletsou, P.G. Ultrasonographic Examination of the Scrotal Contents in Rams. Small Rumin. Res. 2017, 152, 100–106. [Google Scholar] [CrossRef]
- Abdel-Razek, A.K.; Ali, A. Developmental Changes of Bull (Bos Taurus) Genitalia as Evaluated by Caliper and Ultrasonography. Reprod. Domest. Anim. 2005, 40, 23–27. [Google Scholar] [CrossRef]
- Lin, C.C.; Huang, W.J.S.; Chen, K.K. Measurement of Testicular Volume in Smaller Testes: How Accurate Is the Conventional Orchidometer? J. Androl. 2009, 30, 685–689. [Google Scholar] [CrossRef]
- Avdi, M.; Banos, G.; Stefos, K.; Chemineau, P. Seasonal Variation in Testicular Volume and Sexual Behavior of Chios and Serres Rams. Theriogenology 2004, 62, 275–282. [Google Scholar] [CrossRef]
- Palacin-Martinez, C.; Alvarez, M.; Montes-Garrido, R.; Neila-Montero, M.; Anel-lopez, L.; de Paz, P.; Anel, L.; Riesco, M.F.; de Paz, P.; Anel, L.; et al. Frequency of Semen Collection Affects Ram Sperm Cryoresistance. Animals 2022, 12, 1492. [Google Scholar] [CrossRef]
- Kafi, M.; Safdarian, M.; Hashemi, M. Seasonal Variation in Semen Characteristics, Scrotal Circumference and Libido of Persian Karakul Rams. Small Rumin. Res. 2004, 53, 133–139. [Google Scholar] [CrossRef]
- Taha, T.A.; Abdel-Gawad, E.I.; Ayoub, M.A. Monthly Variations in Some Reproductive Parameters of Barki and Awassi Rams throughout 1 Year under Subtropical Conditions 1. Semen Characteristics and Hormonal Levels. Anim. Sci. 2000, 71, 317–324. [Google Scholar] [CrossRef]
- Zamiri, M.J.; Khodaei, H.R. Seasonal Thyroidal Activity and Reproductive Characteristics of Iranian Fat-Tailed Rams. Anim. Reprod. Sci. 2005, 88, 245–255. [Google Scholar] [CrossRef]
- Tajangookeh, H.D.; Shahneh, A.Z.; Shahrebabak, M.M.; Shakeri, M. Monthly Variation of Plasma Concentrations of Testosterone and Thyroid Hormones and Reproductive Characteristics in Three Breeds of Iranian Fat-Tailed Rams throughout One Year. Pak. J. Biol. Sci. 2007, 10, 3420–3424. [Google Scholar] [CrossRef] [PubMed]
- Casao, A.; Pérez-Pé, R.; Abecia, J.A.; Forcada, F.; Muiño-Blanco, T.; Cebrián-Pérez, J.Á. The Effect of Exogenous Melatonin during the Non-Reproductive Season on the Seminal Plasma Hormonal Profile and the Antioxidant Defence System of Rasa Aragonesa Rams. Anim. Reprod. Sci. 2013, 138, 168–174. [Google Scholar] [CrossRef]
- Rekik, M.; Taboubi, R.; Ben Salem, I.; Fehri, Y.; Sakly, C.; Lassoued, N.; Hilali, M.E. Melatonin Administration Enhances the Reproductive Capacity of Young Rams under a Southern Mediterranean Environment. Anim. Sci. J. 2015, 86, 666–672. [Google Scholar] [CrossRef]
- Deng, S.L.; Wang, Z.P.; Jin, C.; Kang, X.L.; Batool, A.; Zhang, Y.; Li, X.Y.; Wang, X.X.; Chen, S.R.; Chang, C.S.; et al. Melatonin Promotes Sheep Leydig Cell Testosterone Secretion in a Co-Culture with Sertoli Cells. Theriogenology 2018, 106, 170–177. [Google Scholar] [CrossRef]
- Meehan, T.; Schlatt, S.; O’Bryan, M.K.; De Kretser, D.M.; Loveland, K.L. Regulation of Germ Cell and Sertoli Cell Development by Activin, Follistatin, and FSH. Dev. Biol. 2000, 220, 225–237. [Google Scholar] [CrossRef]
- Reiter, R.J. The Pineal and Its Hormones in the Control of Reproduction in Mammals. Endocr. Rev. 1980, 1, 109–131. [Google Scholar] [CrossRef]
- Frungieri, M.B.; Calandra, R.S.; Rossi, S.P. Local Actions of Melatonin in Somatic Cells of the Testis. Int. J. Mol. Sci. 2017, 18, 1170. [Google Scholar] [CrossRef]
- Reiter, R.J. Pineal Melatonin: Cell Biology of Its Synthesis and of Its Physiological Interactions. Endocr. Rev. 1991, 12, 151–180. [Google Scholar] [CrossRef] [PubMed]
- Shalet, S.M. Normal Testicular Function and Spermatogenesis. Pediatr. Blood Cancer 2009, 53, 285–288. [Google Scholar] [CrossRef]
- Awoniyi, C.A.; Zirkin, B.R.; Chandrashekar, V.; Schlaff, W.D. Exogenously Administered Testosterone Maintains Spermatogenesis Quantitatively in Adult Rats Actively Immunized against Gonadotropin-Releasing Hormone. Endocrinology 1992, 130, 3283–3288. [Google Scholar] [CrossRef]
- Tapanainen, J.S.; Vaskivuo, T.; Aittomäki, K.; Huhtaniemi, I.T. Inactivating FSH Receptor Mutations and Gonadal Dysfunction. Mol. Cell. Endocrinol. 1998, 145, 129–135. [Google Scholar] [CrossRef]
- Kumar, T.R.; Wang, Y.; Lu, N.; Matzuk, M.M. Follicle Stimulating Hormone Is Required for Ovarian Follicle Maturation but Not Male Fertility. Nat. Genet. 1997, 15, 201–204. [Google Scholar] [CrossRef]
- Plant, T.M.; Marshall, G.R. The Functional Significance of FSH in Spermatogenesis and the Control of Its Secretion in Male Primates. Endocr. Rev. 2001, 22, 764–786. [Google Scholar] [CrossRef]
- Senger, P.L. Pathways to Pregnancy & Parturition, 3rd ed.; Senger, P.L., Ed.; Current Conceptions, Inc.: Washington, DC, USA, 2012; ISBN 0965764834. [Google Scholar]
- Thompson, J.A.; Love, C.C.; Stich, K.L.; Brinsko, S.P.; Blanchard, T.L.; Varner, D.D. A Bayesian Approach to Prediction of Stallion Daily Sperm Output. Theriogenology 2004, 62, 1607–1617. [Google Scholar] [CrossRef]
- Kavak, A.; Lundeheim, N.; Aidnik, M.; Einarsson, S. Testicular Measurements and Daily Sperm Output of Tori and Estonian Breed Stallions. Reprod. Domest. Anim. 2003, 38, 167–169. [Google Scholar] [CrossRef] [PubMed]
- Magalhaes, H.B.; Canuto, L.E.F.; Zhao, F.; Li, M.; Li, X.; Ji, C.; Canisso, I.F. Daily Sperm Output, Spermatogenic Efficiency, and Sexual Behavior of Dezhou Donkey Jacks Mounting Jennies in Estrus. J. Equine Vet. Sci. 2021, 101, 103420. [Google Scholar] [CrossRef] [PubMed]


Disclaimer/Publisher’s Note: The statements, opinions and data contained in all publications are solely those of the individual author(s) and contributor(s) and not of MDPI and/or the editor(s). MDPI and/or the editor(s) disclaim responsibility for any injury to people or property resulting from any ideas, methods, instructions or products referred to in the content. |
© 2023 by the authors. Licensee MDPI, Basel, Switzerland. This article is an open access article distributed under the terms and conditions of the Creative Commons Attribution (CC BY) license (https://creativecommons.org/licenses/by/4.0/).
Share and Cite
Montes-Garrido, R.; Anel-Lopez, L.; Riesco, M.F.; Neila-Montero, M.; Palacin-Martinez, C.; Soriano-Úbeda, C.; Boixo, J.C.; de Paz, P.; Anel, L.; Alvarez, M. Does Size Matter? Testicular Volume and Its Predictive Ability of Sperm Production in Rams. Animals 2023, 13, 3204. https://doi.org/10.3390/ani13203204
Montes-Garrido R, Anel-Lopez L, Riesco MF, Neila-Montero M, Palacin-Martinez C, Soriano-Úbeda C, Boixo JC, de Paz P, Anel L, Alvarez M. Does Size Matter? Testicular Volume and Its Predictive Ability of Sperm Production in Rams. Animals. 2023; 13(20):3204. https://doi.org/10.3390/ani13203204
Chicago/Turabian StyleMontes-Garrido, Rafael, Luis Anel-Lopez, Marta F. Riesco, Marta Neila-Montero, Cristina Palacin-Martinez, Cristina Soriano-Úbeda, Juan Carlos Boixo, Paulino de Paz, Luis Anel, and Mercedes Alvarez. 2023. "Does Size Matter? Testicular Volume and Its Predictive Ability of Sperm Production in Rams" Animals 13, no. 20: 3204. https://doi.org/10.3390/ani13203204