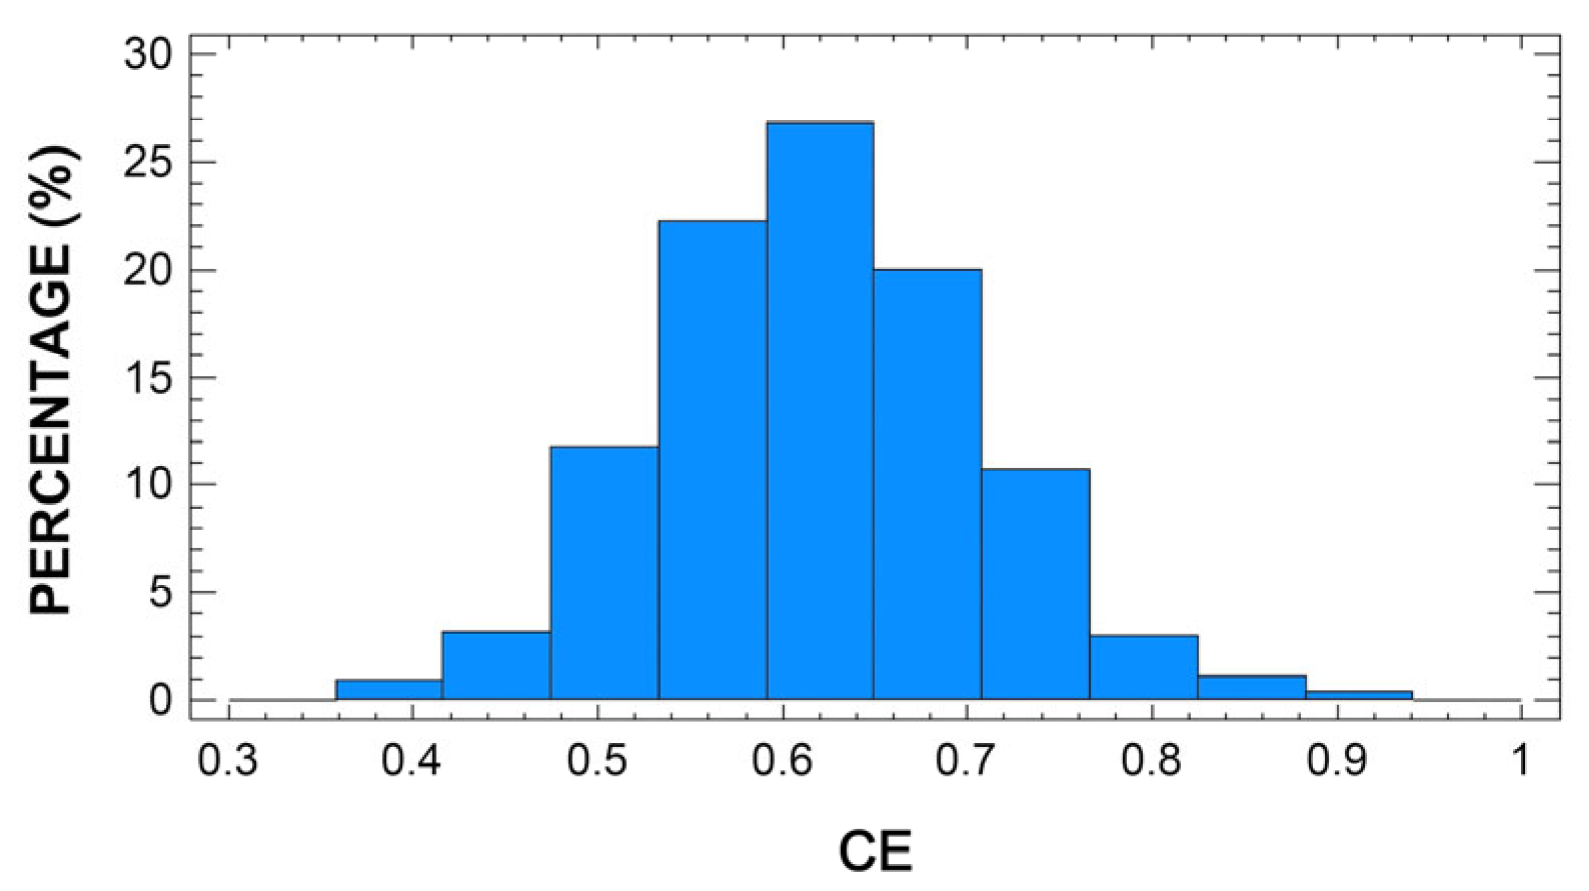
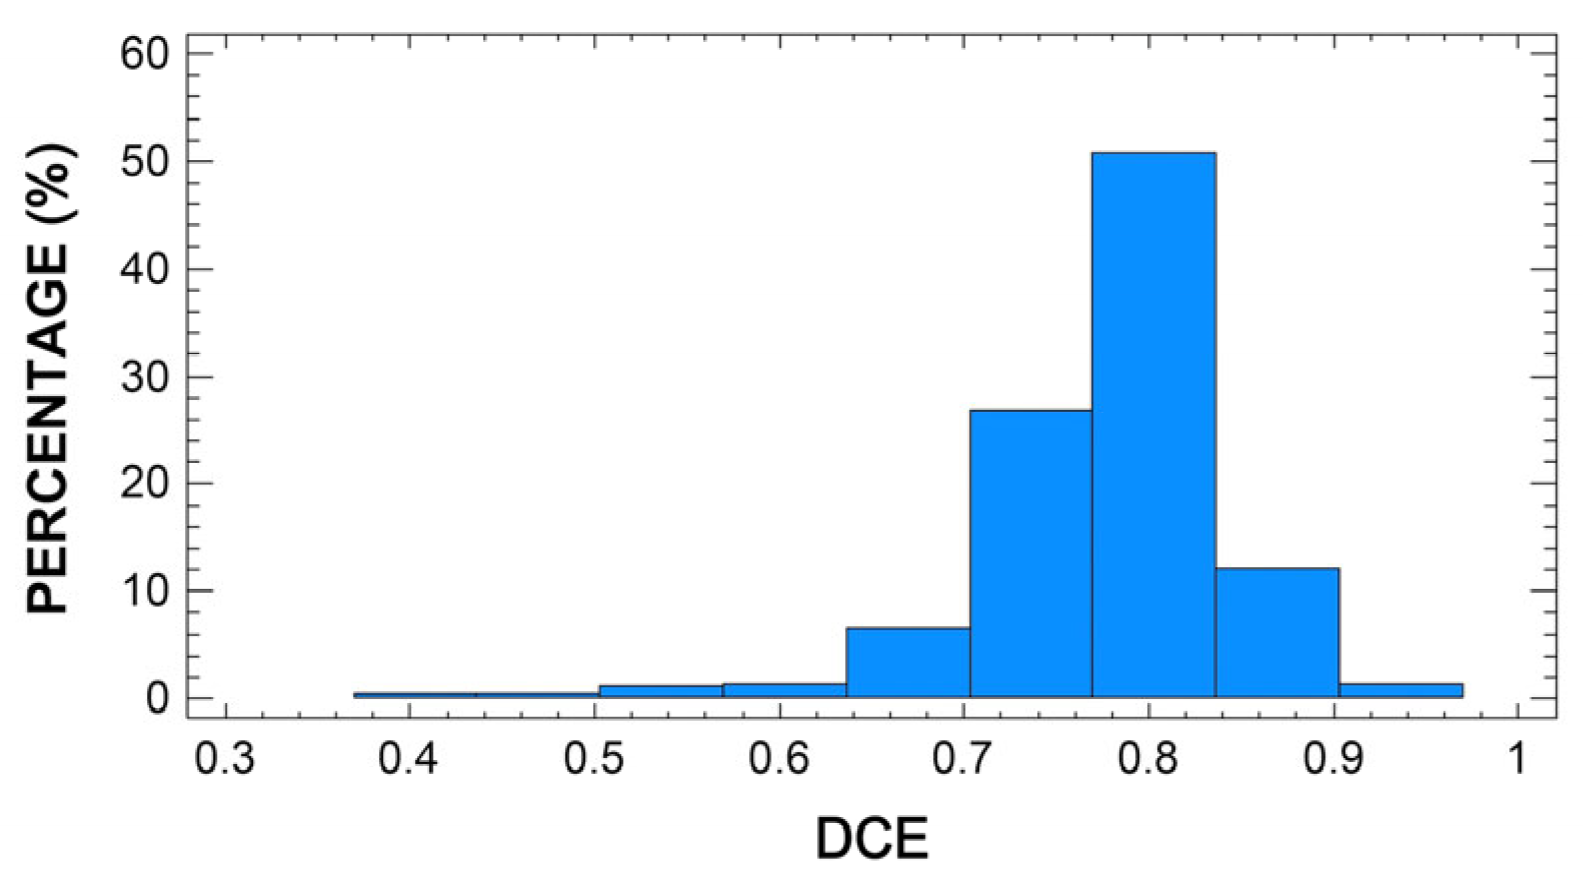
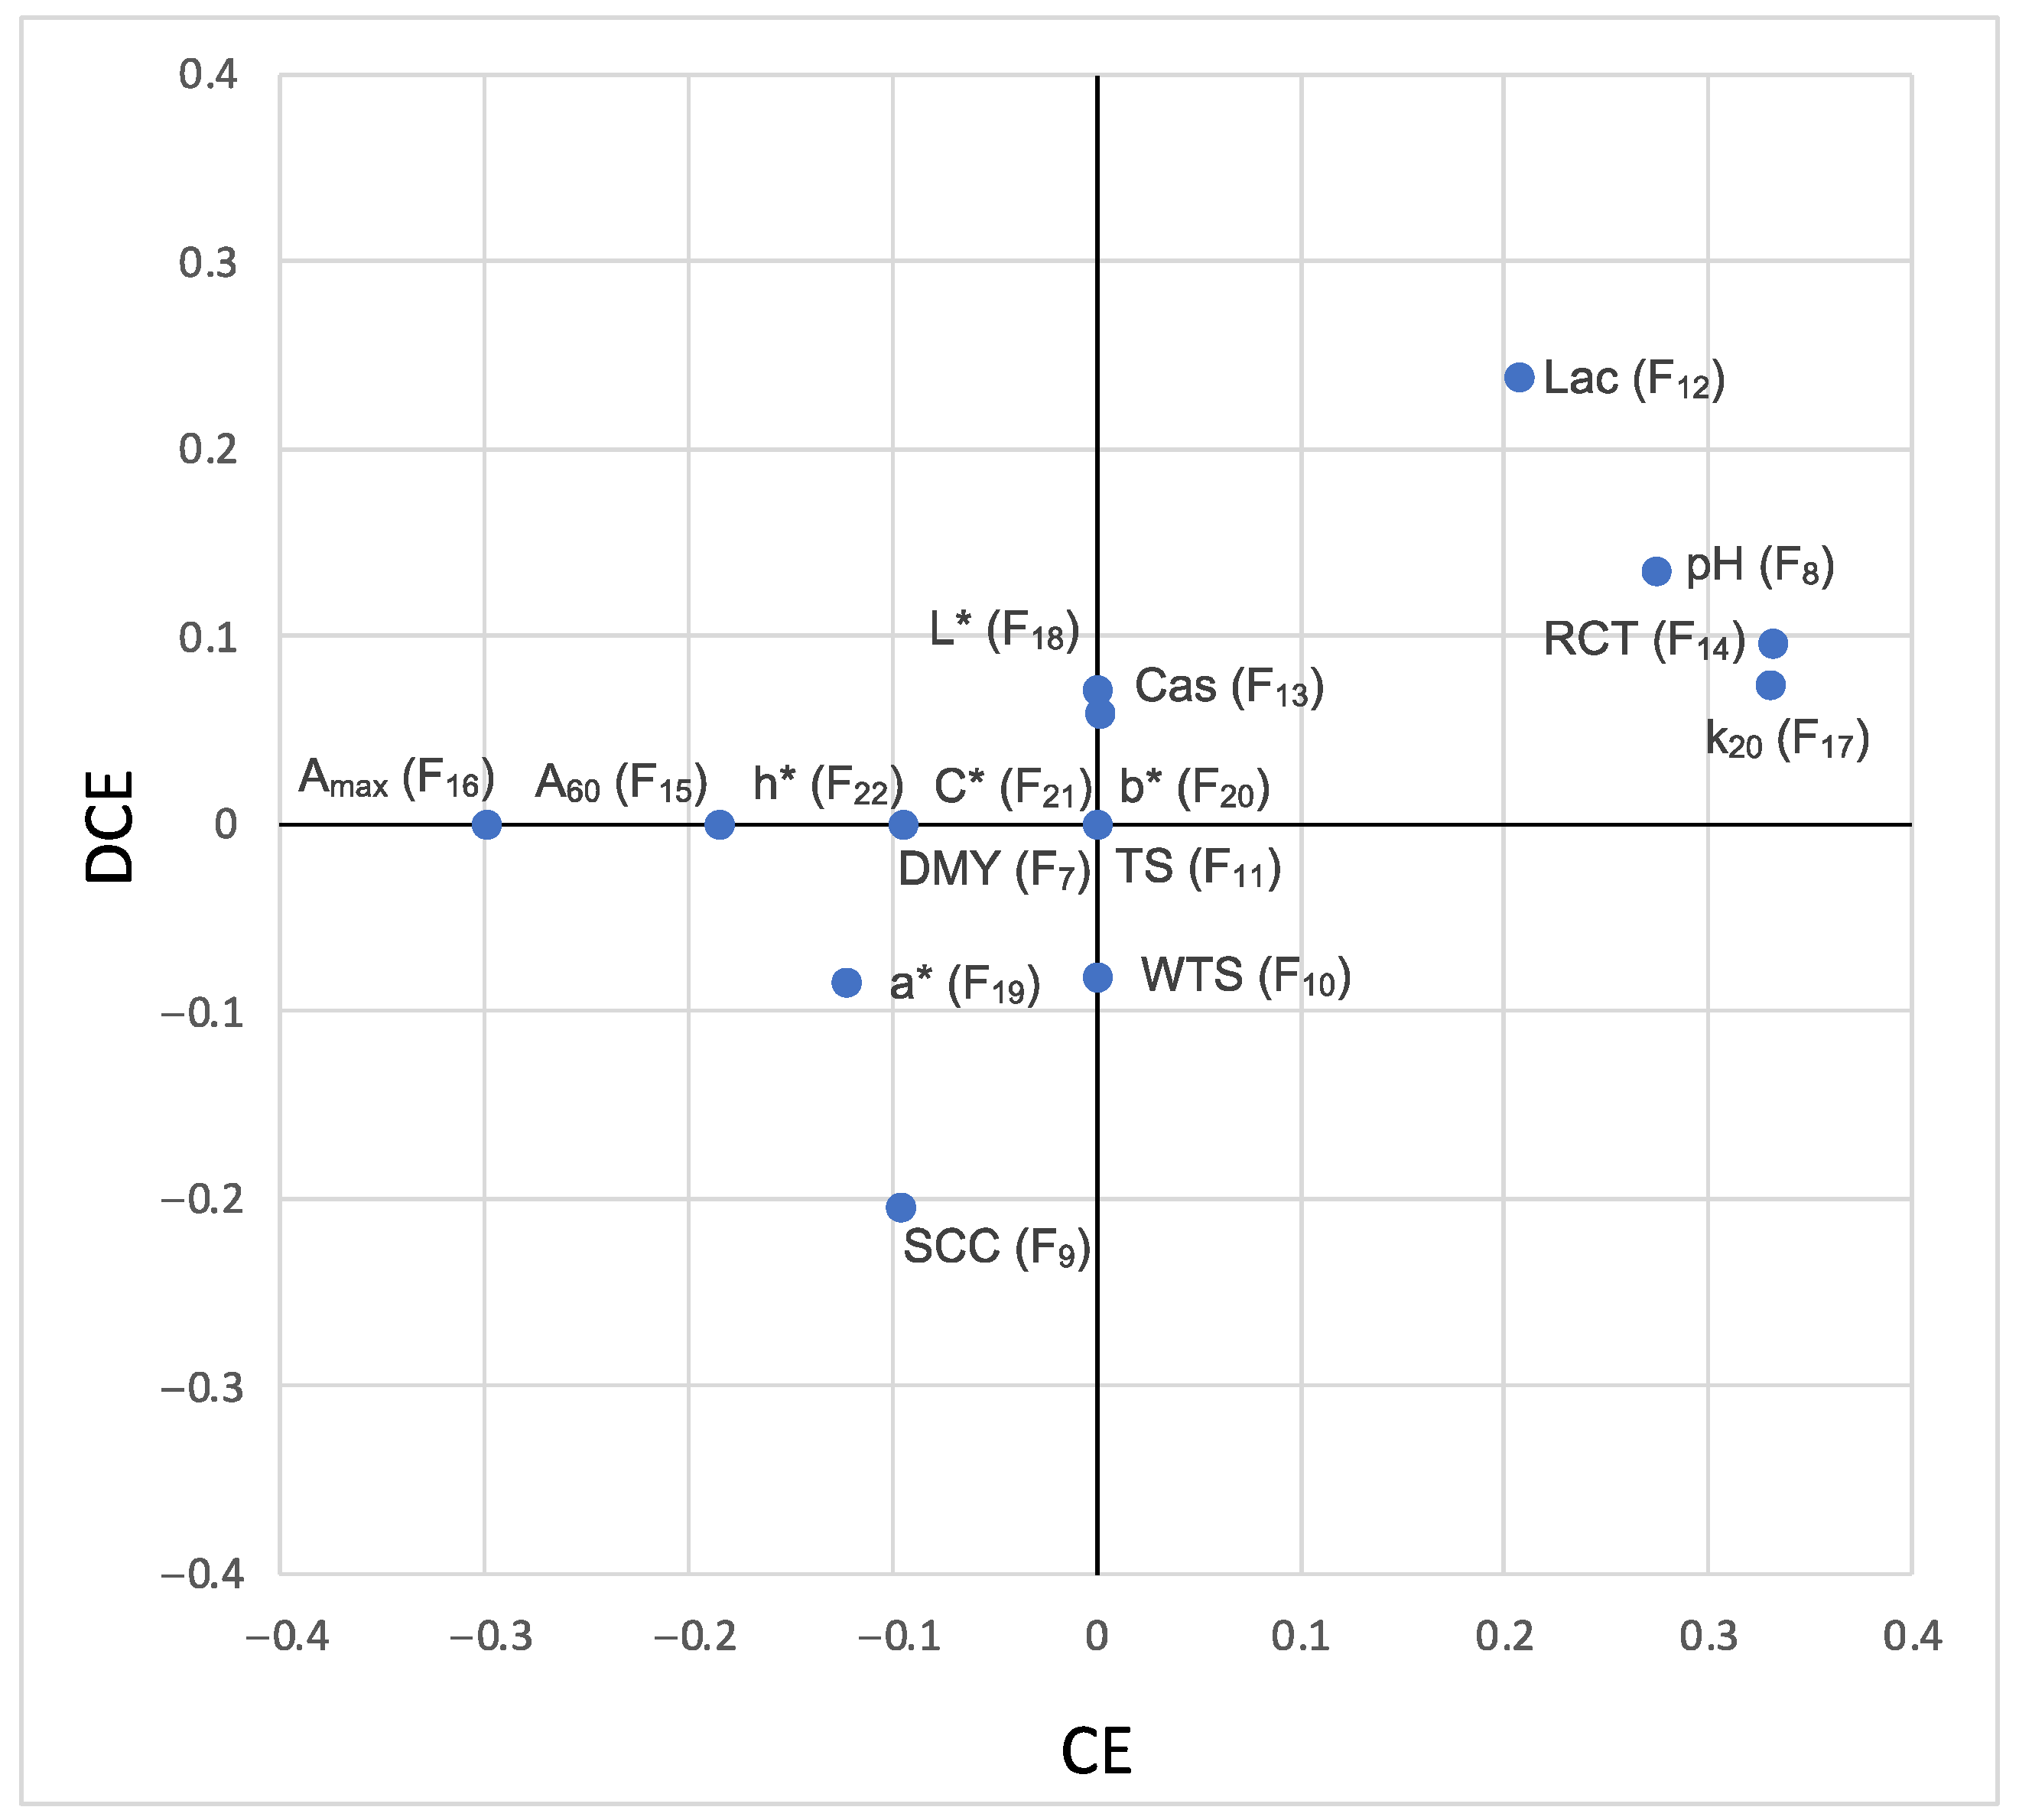
3.2.1. Bivariate Associations
The quantitative and categorical variables included in the bivariate analysis are presented in
Figure 4 and
Figure 5, respectively. Of the 18 covariable factors analyzed, only 5 and 2 were significantly correlated with CE and DCE, respectively, although this association was fairly weak (
Figure 4). DCE was negatively correlated with SCS and positively with lactose content, the latter being also positively correlated with CE. The strongest correlations were observed between CE and variables related to coagulation process: positives for pH, k
20, and RCT, and negative for A
max.
In both models, a positive correlation of efficiency with lactose content was observed (r = 0.21 for CE and r = 0.24 for DCE), which is in line with the results published for sheep [
25] and for goat [
26], where it was reported that an increase in lactose levels is linked to an improvement of curd yield. As low lactose contents have been reported to be indicative of poor udder health conditions, the aforementioned studies also support the negative correlation observed between DCE and SCS (r = −0.20), as well as a negative tendency between DCE and WTS (r = −0.08), since an increase in somatic cell levels reduces lactose concentration content, consequently increasing the loss of nutrients during curd draining and reducing yield.
According to studies performed in dairy cows [
3] and studies comparing dairy cows and sheep [
1], milk coagulation properties and curd yield are not so much affected by milk composition as expected, which is evident in the DCE model. However, the CE model shows that the most efficient milk samples correspond to those with a more alkaline pH (r = 0.27), longer RCT (r = 0.33), higher k
20 (r = 0.33), and lower A
max (r = −0.30). These values would correspond to milk with “worse” coagulation parameters, resulting in a softer and more hydrated curd and poor drainage. Again, the CE model seems to be conditioned by the percentage of moisture retained in the curd, in agreement with Johnson et al. [
27], who associated slow RCTs with an increase in moisture in the curd.
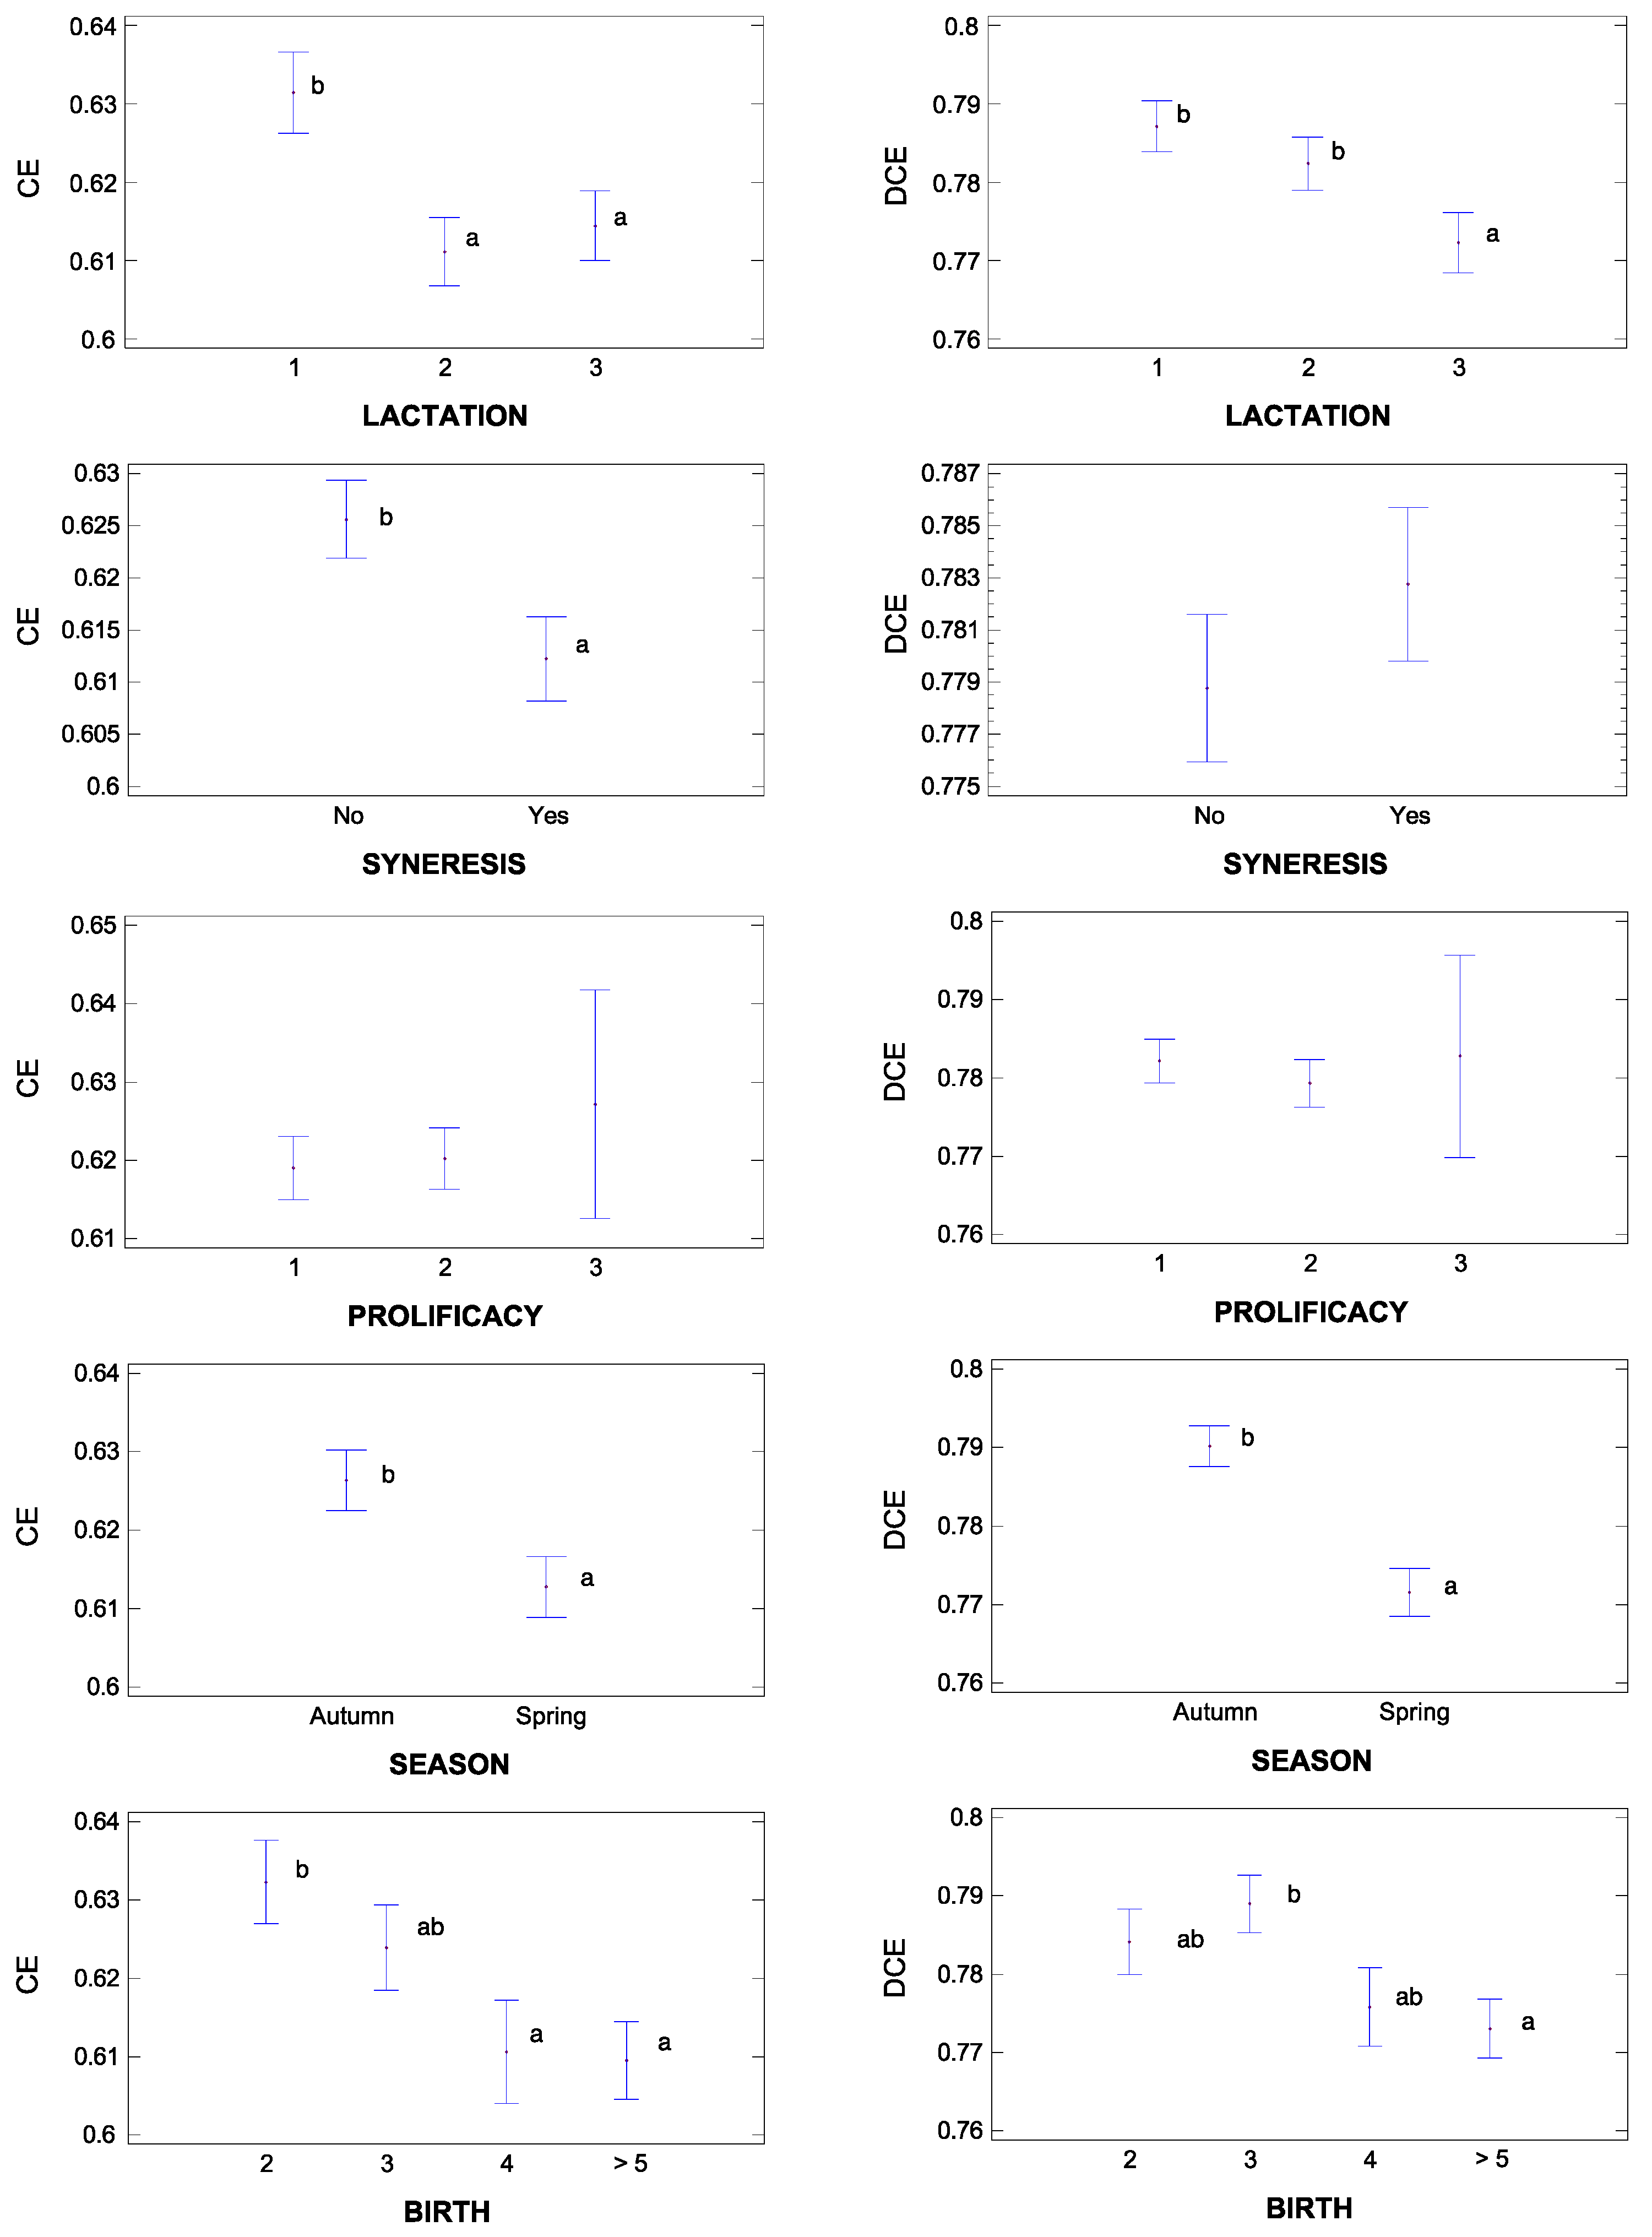
Three categorical factors were significantly associated with CE and DCE (
p < 0.05): season of lambing (Season), stage of lactation (SOL), and parity number (Parity) (
Figure 5). These three factors affect CE and DCE in the same direction.
Thus, autumn lactations show improved CE and DCE compared to spring lactations. By all means, as sheep are seasonal animals [
28], shorter days lead to a decrease in milk yield, resulting in higher concentrations of fat and protein and, as a consequence, in an improvement in milk’s performance.
Secondly, a lower efficiency is observed as lactation progresses. This result is contrary to that reported by other authors who described that, as lactation progresses and the amount of milk ordered decreases, there is a concentration effect of milk components [
29] and, as a consequence, an improvement in performance [
30]. However, our results are in line with other authors [
31,
32], who measured a progressive decrease in lactose content as lactation progresses, associating it with a worsening of the health status of the udder and, as a consequence, with a reduced efficiency. This same interpretation would apply to parity. According to Vacca et al. [
25], SCS increases with parity, due to a deterioration of the udder related to decreasing contents of lactose in milk.
The occurrence of syneresis significantly affected CE (
p < 0.05) but not DCE, diminishing efficiency. This may be due to the fact that the syneresis process is nothing but a rapid draining of the curd [
33] and, as mentioned before, the CE model is determined to a large extent by the retention of water in the curd. Overall, differences between both efficiency indicators could be based on the phenomenon of water retention in CE, which is obviously separated from DCE. In any case, it would be very difficult to obtain clear conclusions with this type of analysis, fundamentally due to the existing interactions between the different variables studied. For this reason, other statistical analyses have been carried out to give greater clarity to the results.
3.2.2. Multivariate Analysis of Covariance (MANCOVA)
MANCOVA analysis was used to identify the factors that determine yield efficiency, considering, simultaneously, the two variables (CE and DCE) and their pattern of correlation [
20]. As the test statistics used yielded monotonous results, only those obtained with Wilks’ λ test are shown. The best results were obtained with the model shown in
Table 4.
The variables TS, RCT, A60, and C* were not included in this model, as they strongly intensify multicollinearity. Eight variables were found to be significant factors for both CE and DCE coagulation efficiency models. The λ and F statistics suggest that the main factor causing inefficiency is Lac, followed by k20 and Amax. Cas, initial pH, and Season were also identified as causes of inefficiency, although they have a lesser impact. Lastly, and with a moderate effect, the model highlights Flock and SCS. The set of variables that most impacts the efficiency of the coagulation process is chemical composition (Lac and Cas), followed by coagulation properties (Amax and k20), and finally the hygienic-sanitary quality of the milk (pH and SCS). Season had a moderate effect, while none of the colorimetric variables were significant.
3.2.3. Generalized Linear Models (GLM)
Causes of inefficiency were analyzed using GLM, considering each dependent variable (CE and DCE) separately.
Table 5 shows the results obtained for CE. The adjusted coefficient of determination reached a value of 22.5% and the mean absolute error was 0.06, so the model fit is considered poor, probably due to the great variability in coagulation efficiency because of the interactions between the studied parameters. The VIF of the regression coefficients fluctuated between 1.2 and 2.4, so there is no multicollinearity problem. The Kolmogorov–Smirnov test proved that the residuals adjust to a Gaussian distribution (
p > 0.05). In addition, White’s test did not evidence heteroscedasticity (
p > 0.05) and the Durbin–Watson test (
p > 0.05) indicated no autocorrelation. Thus, the data were considered suitable for GLM analysis. GLM showed that seven out of twenty-four factors significantly affected curd yield efficiency. The
F statistics highlighted the following variables as the most important determinants of CE: Lac, A
max, Casein, and initial pH. Other variables such as Season, Parity, and Flock showed a more moderate impact. Regression coefficients revealed that spring lactations, second and third lambing, pH, lactose content, and casein content had a positive effect on CE. Contrastingly, autumn lactations, high parity numbers (≥4), and A
max showed a negative effect.
Table 6 reports GLM results obtained for DCE. The adjusted coefficient of determination reached a value of 15.5%, and the mean absolute error was 0.04, so the model fit is considered poor. The VIF of the regression coefficients fluctuated between 1.2 and 1.8, evidencing no multicollinearity problem. The Kolmogorov–Smirnov test showed that the residuals fit a Gaussian distribution (
p > 0.05). In addition, White’s test did not show heteroscedasticity (
p > 0.05) and the Durbin–Watson test (
p > 0.05) indicated no autocorrelation. GLM showed that six factors significantly affected dry curd yield efficiency of Manchega sheep’s milk. The
F statistics revealed the most important determinants of DCE were Lac, Cas, and pH of milk and, to a lower extent, k
20 and SCS. Regression coefficients revealed a positive effect of pH, Lac, and Cas on DCE, while SCS and k
20 seemed to have a negative effect.
Both models indicate that there seems to be an improvement in efficiency when pH increases. However, it is well known that the pH of milk has a great impact on coagulation, since higher values slow the coagulation process. Taking into account that the average pH value in the present study was 6.61, we believe that this improvement in efficiency is not due to a significant alkalinization of milk. Rather, we believe that, unlike other studies that reported greater efficiency in samples with a pH close to 6.5, coagulation is favored by slight increases in pH that bring the values to the normal pH range of milk.
Likewise, other authors observed in goat milk that slightly higher pH values (and similar to our mean values) are related to a greater recovery of nutrients in the curd [
26]. In addition, the increase in lactose content (responsible for osmotic regulation in milk) [
34] and casein (active component in the coagulation process) [
35] boost efficiency in both models. However, the two models are contradictory when it comes to the influence of coagulation parameters. In this way, CE increases when the firmness of the clot is lower, evidencing the effect of water retention in the curd for this model, while DCE increases with higher curd firming times, which result in a faster draining. This is consistent with Cipolat-Gotet et al. [
36], who concluded that curd moisture contributes significantly to individual CY variability. Finally, it should be noted that, contrastingly with the CE model, DCE was not affected by any of the categorical variables related to the progress of lactation and a resulting progressive deterioration of the udder, which would be evidenced by a worsening of coagulation parameters, as was observed in the case of CE.
3.2.4. Causes of Inefficiency
Table 7 summarizes the determinants of efficiency obtained with both methodologies. Four variables were identified as common causes of inefficiency for CE and DCE by both the GLM and MANCOVA models: Flock, pH, lactose content, and casein content. These factors also affect CE and DCE in the same way. The efficiency of the curd development process improves with greater lactose and casein contents, and pH of milk within normal ranges. Causes of inefficiency for DCE identified by GLM and MANCOVA included SCS and coagulation rate. However, for CE, only A
max was evidenced as a cause of inefficiency.
Of all studied variables, high lactose content is the main determinant of curd yield performance, leading to an increase in both CE and DCE. This is in alignment with results obtained by Vacca et al. [
25], who observed that a decrease in the percentage of lactose in milk induces a lower aggregation of protein in the curd, leading to a greater loss of nutrients in the whey and, consequently, to a poorer performance. Regarding categorical variables, it is worth highlighting the effect of Flock on both efficiency indices, although to a lesser extent on CE. As discussed in Garzón et al. [
12], this effect is very difficult to define, since, according to other authors [
37], it involves many factors (including variables such as management, nutrition, hygiene, milking routine, etc.), which can directly affect the characteristics of the milk and, therefore, its performance and efficiency.


