Article

Effects of the Expressions and Variants of the CAST Gene on the Fatty Acid Composition of the Longissimus Thoracis Muscle of Grazing Sonid Sheep

1
The State Key Laboratory of Reproductive Regulation and Breeding of Grassland Livestock, School of Life Sciences, Inner Mongolia University, Hohhot 010021, China
2
Inner Mongolia Agriculture Animal Husbandry Fishery and Biology Experiment Research Centre, Inner Mongolia Agricultural University, Hohhot 010010, China
3
Department of Agrobiology, Faculty of Agriculture, Niigata University, Niigata 950-2181, Japan
4
Institute of Animal Science, Inner Mongolia Academy of Agricultural and Animal Husbandry Sciences, Hohhot 010031, China
5
College of Food Science and Engineering, Inner Mongolia Agricultural University, Hohhot 010010, China
*
Authors to whom correspondence should be addressed.
These authors contributed equally to this work.
Animals 2023, 13(2), 195; https://doi.org/10.3390/ani13020195
Submission received: 16 November 2022 / Revised: 20 December 2022 / Accepted: 31 December 2022 / Published: 4 January 2023

Abstract

:

Simple Summary

This study aimed to evaluate the relationship between the expression levels of the CAST gene and the fatty acid (FA) composition in the longissimus thoracis (LL) muscle and to identify novel variants of CAST and perform association analysis with the FA composition in grazing Sonid sheep. The correlation results showed that high expression levels of CAST are correlated with better FA compositions and classes in LL. Four c.646G>C (G216R), c.1210C>T (R404C), c.1437G>A (479T), and c.2097C>T (699G) mutations were identified in the CAST gene of Sonid sheep. The association studies showed that c.1210C>T is associated with C14:0, C18:0, C18:1n9c, C18:3n3, n3, C12:0, n6, and n6/n3; c.646G>C and c.1437G>A in linkage disequilibrium-Mongolia (r2 = 0.964) were associated with C14:0, C18:0, SFA, C18:1n9c, n3, C10:0, C18:1n9t, and n6/n3; and c.2097C>T was associated with C18:3n3, n3, C10:0, and n6/n3 in the LL of Sonid sheep. Thus, the correlation results and associated mutations were expected to be genetic selection markers for the FA composition and meat quality of Sonid sheep muscle and provide new insight into sheep meat quality traits influenced by the ovine CAST gene.

Abstract

Fatty acid (FA) composition has an important impact on the nutrition and flavor of meat, and on consumer health, and is receiving more attention in the sheep industry. This study aimed to evaluate the relationship between the expression levels of the CAST gene and the FA composition in the longissimus thoracis (LL) muscle, to identify novel variants of CAST, and to perform association analysis with the FA composition in grazing Sonid lambs. The correlation results showed that high expression levels of CAST are correlated with better FA compositions and classes in LL. For association studies, the results showed that c.1210C>T and c.1437G>A in LD-M, and c.2097C>T mutations are associated with some compositions and classes of FA in the LL of grazing Sonid sheep. Two missense c.646G>C (G216R) and c.1210C>T (R404C) mutations were predicted to influence the Calpain_inhib domains of CAST. Thus, the correlation results and associated mutations are expected to be genetic selection markers for the FA composition and meat quality of grazing Sonid lamb muscle and provide new insights into sheep meat quality traits influenced by the ovine CAST gene.

1. Introduction

In China, the annual lamb consumption per person increased from 2.99 kg in 2011 to 3.93 kg in 2021. China has the largest number of sheep in the world, with nearly 200 million before 2022. Among them, the Mongolia sheep population is the most widely distributed and the most numerous. Mongolia sheep, an old and primitive sheep breed, is mainly distributed in the grassland, desert, and agricultural areas in northern China, Mongolia, and Central Asia and is the common ancestor of Chinese short fat-tailed sheep breeds, such as the Sonid, Ujimqin, Hulunbuir, Tan, Bayanbulak, Small-tailed Han, Duolang, and Hu sheep (China National Commission of Animal Genetic Resources) [1]. Recently, the meat of Mongolia sheep populations was recognized as a natural green food and has become increasingly popular in China.
The fatty acid (FA) composition of lamb meat is an important trait for the determination of flavor and nutrition, and this meat can provide essential FA for human health [2]. The types and levels of FA are influenced by polygenic and environmental factors [3,4]. A better knowledge of the molecular architecture of meat FA composition is important as it may generate new opportunities for more effective marker-assisted breeding, leading to economic benefits for the sheep industry [5]. Nevertheless, compared to beef and pork, the studies of genetic effects, including the mutation and expression of candidate genes, on the FA composition of lamb are few.
Calpastatin (CAST) is involved in the calpain–calpastatin system, which influences many important processes, including muscle development and growth [6], and is also known to regulate the degradation of myofibrillar proteins both in living and in post-mortem muscle tissue [7,8]. To date, many polymorphisms of the CAST gene have been identified and associated with meat quality traits, such as tenderness, color, and intramuscular fat (IMF) content, as well as carcass traits in cattle and pigs [9,10,11,12,13,14]. However, research focusing on the relationship between the CAST gene and meat quality, especially FA composition, in sheep is limited. A report showed that a polymorphic variant by PCR-SSCP in intron 12 of the ovine CAST gene is associated with IMF content in two Polish synthetic lines of sheep [15]. Therefore, the CAST gene could be considered a potential candidate gene for meat quality traits in sheep.
Thus, the aims of this study reported herein were to (1) evaluate the effects of the expression levels of CAST on the FA composition in the longissimus thoracis muscle of sheep, (2) identify novel variants of CAST and perform association analysis with the FA composition in Sonid sheep, and (3) predict the effect of the novel variants on the feature and structure of the mRNA and protein of the ovine CAST gene. Our study may facilitate effective marker-assisted selection to promote the meat quality in Mongolia sheep populations and provide new insights into the effect of the ovine CAST gene on sheep meat quality traits.

2. Materials and Methods

2.1. Animals and Samples

The study was carried out on 378 castrated ram lambs (approximately 6 months old) of Sonid sheep, born in 2020. The lambs were raised until weaning in an outdoor extensive grazing system, feeding on natural pastures as usual in the Sonid grassland of Inner Mongolia. After weaning, the castrated male lambs were grazed under the same conditions as usual in the Sonid grassland until 6 months old. All the experimental animals were healthy. The 378 lambs were the progeny of different sires and dams, and any relationship between the parents was not recorded. These lambs were the progeny of more than 20 unrelated sires.
Lambs were slaughtered in accordance with the Chinese industry standard (NY/T 1564-2021). After being slaughtered, the longissimus thoracis (LL) muscle tissues (at least 500 g between the 12 and 13th ribs) of 378 animals (left half of the carcass) were removed on ice, taken to the laboratory, frozen, and stored at −35 °C until analysis for FA composition. Of the 378 lambs, the LL samples of 90 animals were randomly selected and frozen in liquid nitrogen immediately after slaughter and stored at −80 °C until used for RNA extraction. Three lambs were randomly selected to sample the LL, semitendinosus, heart, subcutaneous fat, liver, lung, spleen, kidney, large intestine, small intestine, and stomach, which were taken and stored in liquid nitrogen for tissue expression profile analysis of the CAST gene.

2.2. Determination of Fatty Acid Composition

The fatty acid profile was determined after extracting the total lipids and performing esterification and methylation processes using the method in accordance with Folch et al. [16]. After the extracted lipid was converted to fatty acid methyl esters (FAMEs), the FA profiles were analyzed using a gas chromatography–flame ionization detector (Varian 450-GC, Bruker Daltonics Inc., Fremont, CA, USA). Injector and detector temperatures were held at 260 °C. The oven temperature was initially 120 °C for 5 min and was increased to 230 °C at 3 °C/min and held at that temperature for 3 min, and then increased to 240 °C at a rate of 1.5 °C/min and held for 5 min. The samples containing FAMEs in hexane (1.0 μL) were injected through the split injection port (10:1) onto an RT-2560 capillary column (100 m length, 0.25 mm internal diameter, 0.20 μm film thickness; RESTEK, Bellefonte, PA, USA). Individual FAMEs were identified by comparing their retention times with those of authenticated standards, and the results were expressed as a percentage of the total FAMEs. In addition, individual FAs were used to calculate the sums of saturated fatty acids (SFA), monounsaturated fatty acids (MUFA), and polyunsaturated fatty acids (PUFA).

2.3. RNA Extraction and Real-Time Quantitative Amplification

Total RNA from the LL of 90 Sonid sheep was extracted using RNAiso Plus (Takara Bio Inc., Dalian, China), and cDNA synthesis was performed using a PrimeScriptTM RT Reagent Kit with gDNA Eraser (Takara Bio Inc., Dalian, China) according to the manufacturer’s protocol. Real-time polymerase chain reaction (PCR) analyses were performed on a BIO-RAD Real-time PCR system in a 20 μL reaction volume, including 10 μL of 2 × SYBR® Premix Ex TaqTMII (Takara Bio Inc., Dalian, China), 0.8 μL of forward and reverse primers (10 μL), 0.4 μL of ROX Reference Dye, 2.0 μL of template cDNA, and 6.0 μL of nuclease-free water. The real-time PCR conditions were as follows: 95 °C for 30 s, 40 cycles of 95 °C for 5 s, and 60 °C for 34 s. We tested the gene suitability of the glyceraldehyde-3-phosphate dehydrogenase (GAPDH) gene as the internal housekeeping gene in this experiment. The gene expression stability value was less than 0.05, which met the stability required to be a housekeeping gene [17]. The expression of each gene was normalized against GAPDH (Table 1), and relative expression levels were determined using the 2−∆∆Ct method [18].

2.4. Resequencing and Variant Detection in CAST

Genomic DNA was isolated from the LL using the Wizard® Genomic DNA Purification Kit (Promega Corp., Madison, WI, USA). The quality and quantity of the extracted DNA were tested with a NanoDrop 1000 spectrophotometer (Thermo Fisher Scientific, Waltham, MA, USA). The quality of the genomic DNA preparations was also verified using agarose gel electrophoresis. Genomic DNA with absorbance at OD260 nm/OD280 nm of ≥1.80 and no RNA or protein in the agarose gel was used as a template. The DNA of 10 Sonid sheep was randomly selected and sent to Beijing Novogene Company for 10 × genome resequencing.

2.5. Polymorphism Genotyping Using iPLEX MassARRAY

Four target variants were genotyped with the MassARRAY® SNP genotyping system (Agena Bioscience, San Diego, CA, USA) in the 378 Sonid sheep. PCR and extension primers were designed from sequences containing each target mutation and ~100 upstream and downstream bases with Assay Design Suite (http://agenabio.com/assay-design-suite-20-software) using the default settings (Table 2). The genotype of each SNP was analyzed using the Sequenom MassARRAY iPLEX platform (Sequenom, San Diego, CA, USA) [19]. The resulting data were analyzed using MassARRAY Typer 4.0 Analyzer software (Agena Bioscience, San Diego, CA, USA).

2.6. Bioinformatics Analysis

Alignment of the wild-type sequence in various species of mutations in the coding region of the CAST gene was performed with Clustal Omega using UniProt (http://www.uniprot.org, accessed on 13 June 2022) online tools. Using ProtParam, we predicted the fundamental properties of CAST proteins (http://www.expasy.org/tools/protparam.html, accessed on 16 June 2022). The transmembrane domains were speculated using TMHMM (https://services.healthtech.dtu.dk/service.php?TMHMM-2.0, accessed on 16 June 2022). SMART (Simple Molecular Architecture Research Tool; http://smart.embl-heidelberg.de/, accessed on 16 June 2022) was used to forecast the conserved domain of CAST. Using NetNGlyc (https://services.healthtech.dtu.dk/service.php?NetNGlyc-1.0, accessed on 16 June 2022) and NetPhos (https://services.healthtech.dtu.dk/service.php?NetPhos-3.1, accessed on 16 June 2022), we predicted phosphorylation and N-glycosylation sites. ProtScale (http://web.expasy.org/protscale/, accessed on 16 June 2022) was used to determine the hydrophilicity and average flexibility index of ovine CAST amino acid sequences. The secondary structure of the sheep’s CAST gene was predicted using RNAfold (http://rna.tbi.univie.ac.at/cgi-bin/RNAWebSuite/RNAfold.cgi, accessed on 18 June 2022). SOPMA was used to predict the secondary structure of the ovine CAST protein (https://npsa-prabi.ibcp.fr/cgi-bin/npsa_automat.pl?page=npsa_sopma.html, accessed on 18 June 2022). The tertiary structure of ovine CAST was predicted using SWISS-MODEL (https://www.swissmodel.expasy.org/, accessed on 19 June 2022) and AlphaFold (https://alphafold.ebi.ac.uk/, accessed on 19 June 2022) [20,21]. Multiple alignments and molecular phylogenetic tree construction were performed using NCBI Blast (https://blast.ncbi.nlm.nih.gov/Blast.cgi, accessed on 13 June 2022) and MEGA-X.

2.7. Statistical Analysis

Genotypic and allelic frequencies and Hardy–Weinberg equilibrium were calculated for the Sonid sheep in this study. Population genetic indices, observed heterozygosity (Ho), expected heterozygosity (He), effective allele numbers (ne), and the polymorphism information content (PIC) were calculated using Nei’s methods [22]. The allelic frequency of each variant was compared using a χ2 test. The LD, including D’ and r2, was assessed using HaploView 4.2 software [23]. Haplotypes were obtained using SHEsis [24]. The associations between FA composition/class and different genotypes of the four novel variants and three haplotypes in the Sonid sheep were analyzed using SPSS 24.0 (SPSS, Inc., Chicago, IL, USA). The statistical linear model was as follows: Yi = μ + Gi + ei, where Yi is the observed value of fatty acid composition traits, μ is the mean of each measurement, Gi means the fixed effect of the genotypes, and ei means standard error. When the number of sheep with a given genotype was less than 10, their associations and effects could not be reliably estimated. Therefore, animals with this genotype were excluded from the analysis. The Bonferroni correction was used to adjust p values [25]. Correlation analyses between any two traits of FA compositions and FA classes, and between expression levels of CAST and each of the FA compositions and FA classes, were calculated using SPSS 24.0, and results are presented as the Pearson correlation coefficient (SPSS, Inc., Chicago, IL, USA).

3. Results

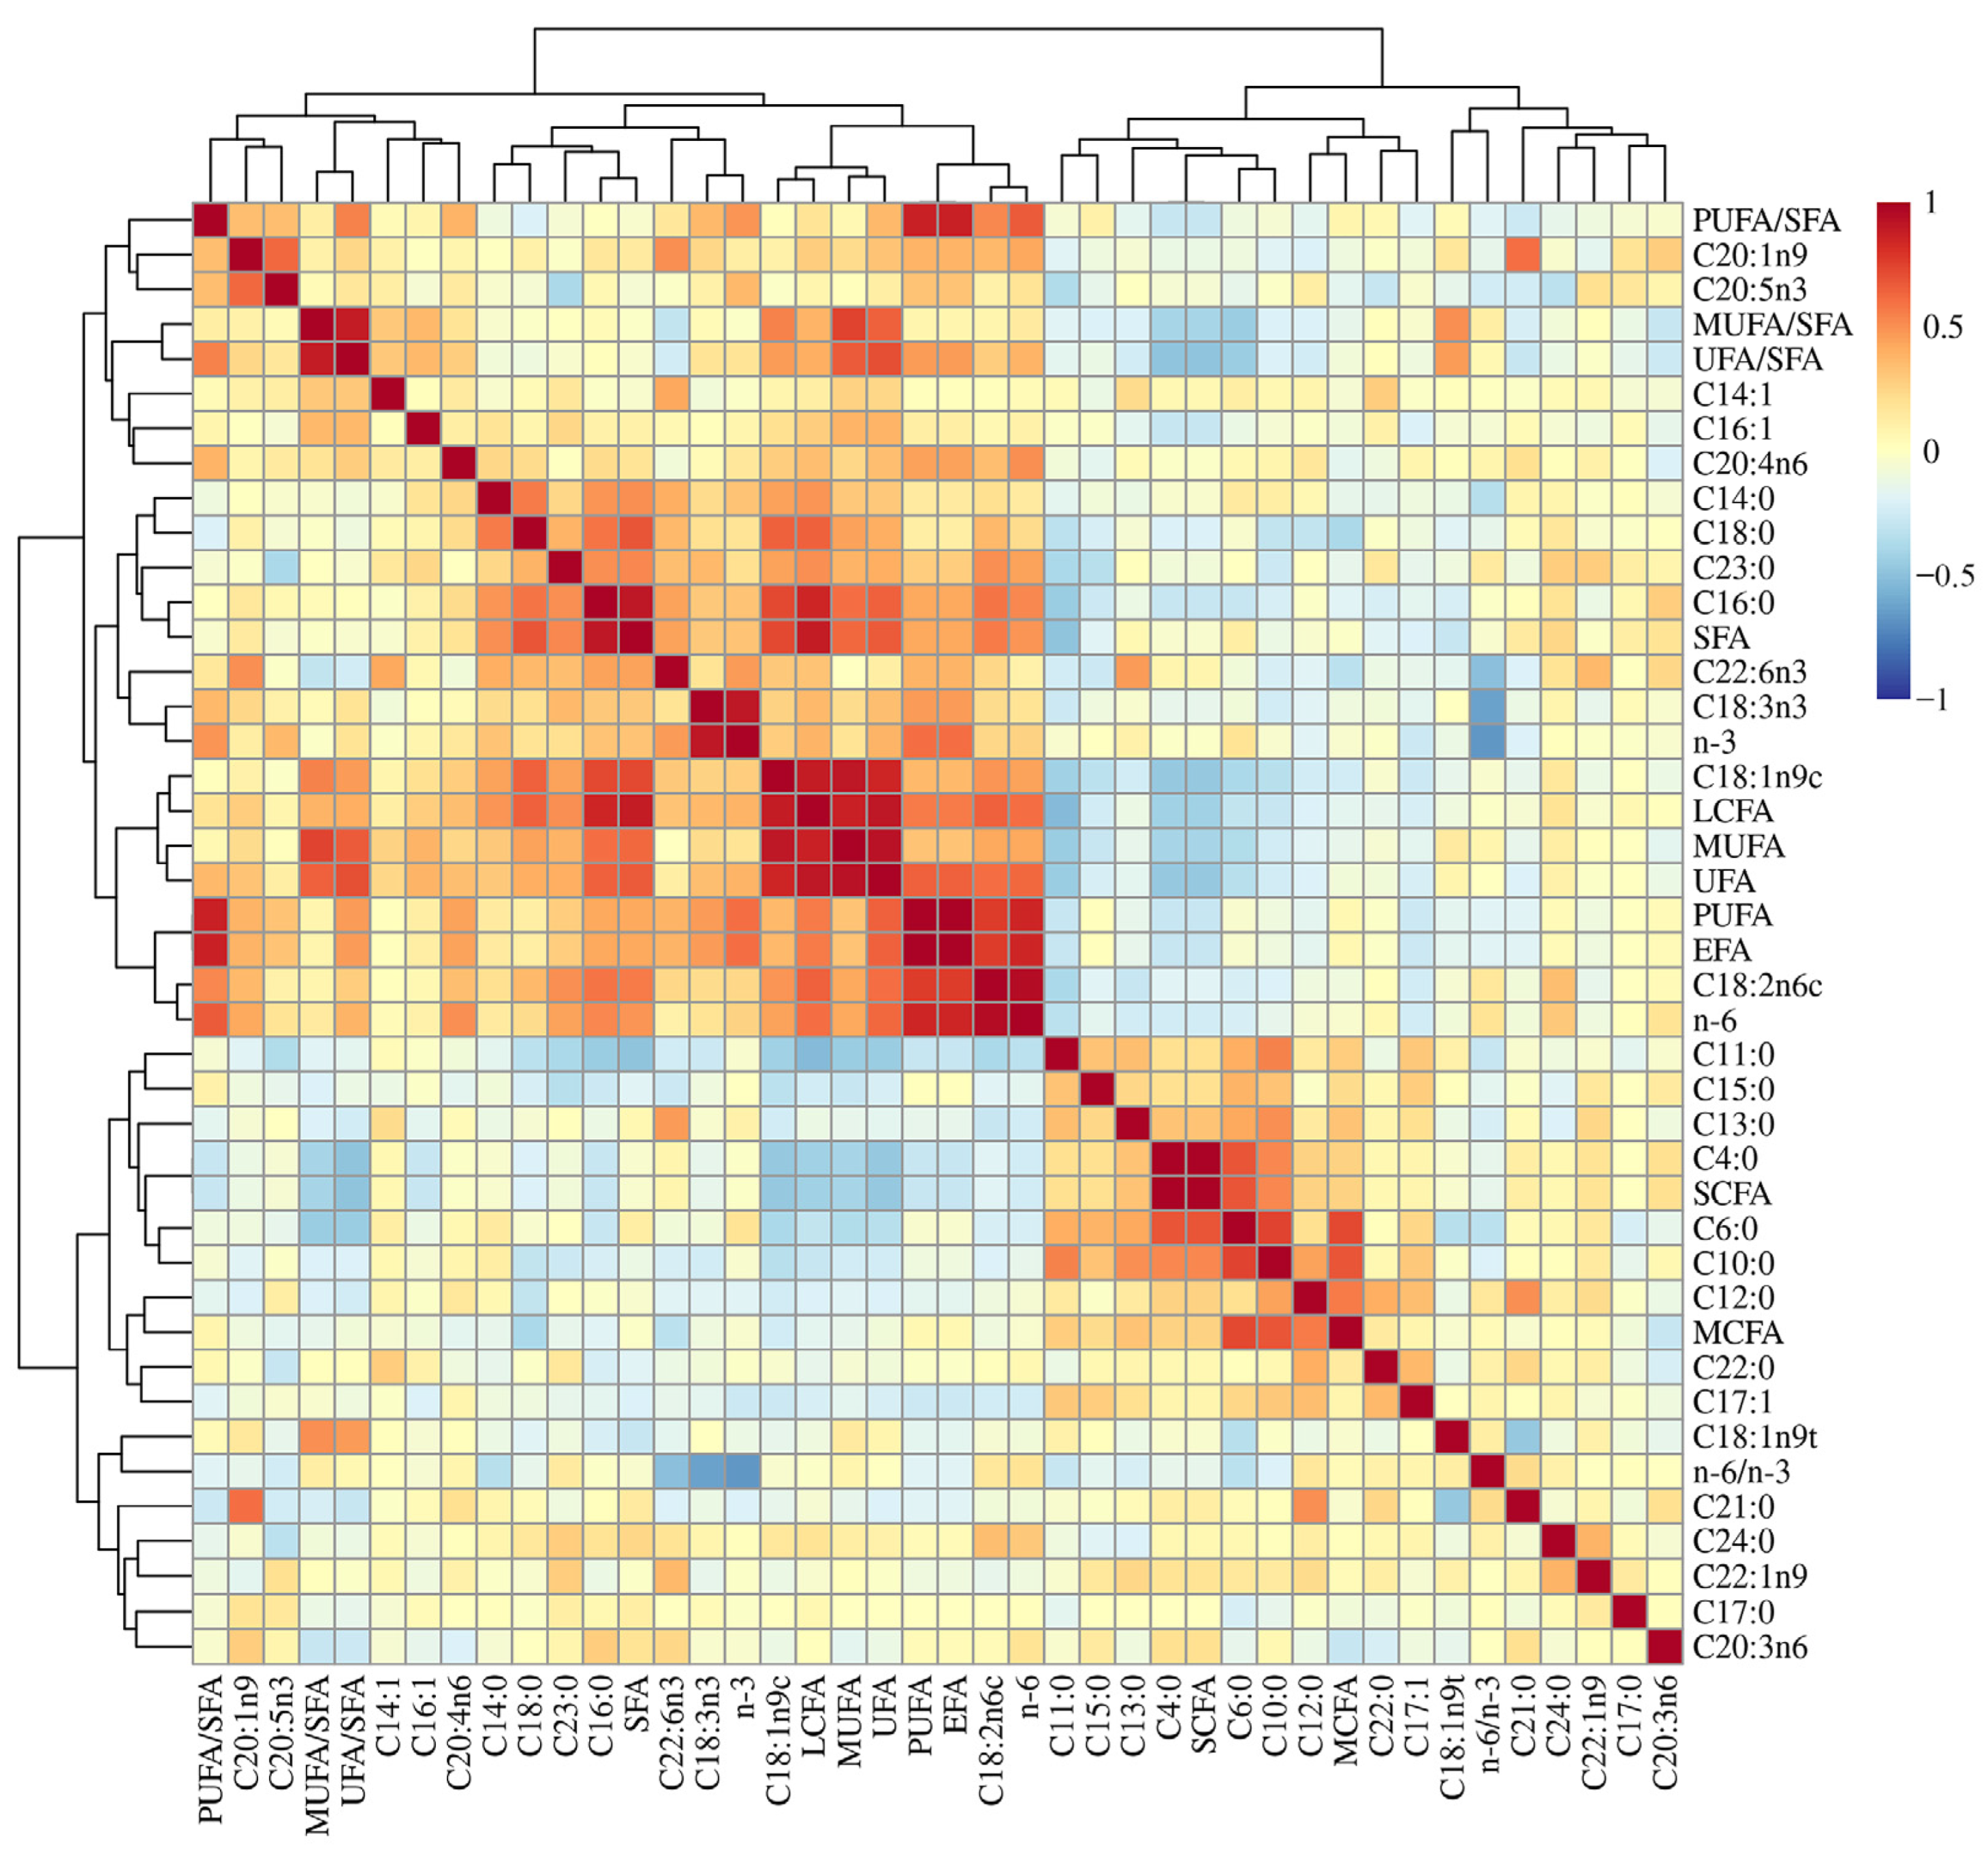
3.1. Fatty Acid Profiles of the Longissimus Thoracis Muscle

The analyzed FA compositions and FA classes in the LL of the 378 Sonid sheep are listed in Table S1, including 15 kinds of SFA, 7 kinds of MUFA, and 6 kinds of PUFA. The correlation analyses between any two traits of FA compositions and FA classes are graphically represented in Figure 1, and the correlation coefficients and relative p values are reported in Table S2. For SFA, the LL content of capric acid (C10:0) was strongly correlated with caproic acid (C6:0), undecanoic acid (C11:0), tridecanoic acid (C13:0), butyric acid (C4:0), and lauric acid (C12:0), with r values ranging from 0.748 to 0.454 and p < 0.001 (Figure 1, Table S2). The content of C4:0 was strongly correlated with C6:0, C11:0 was strongly correlated with pentadecanoic acid (C15:0), and tricosanoic acid (C23:0) was strongly correlated with tetracosanoic acid (C24:0), with r values ranging from 0.680 to 0.292 and p < 0.001 (Figure 1, Table S2). The content of palmitic acid (C16:0) was positively correlated with stearic acid (C18:0), C23:0, and myristic acid (C14:0), with r values ranging from 0.590 to 0.485 and p < 0.001 (Figure 1, Table S2). The content of C18:0 was positively correlated with C14:0 and C23:0, with r values ranging from 0.567 to 0.387 and p < 0.001 (Figure 1, Table S2). In contrast, the correlation analyses of unsaturated fatty acid (UFA) revealed that linoleic acid (C18:2n6c) showed significant correlations with oleic acid (C18:1n9c), eicosenoic acid (C20:1n9), and arachidonic acid (C20:4n6), and the content of C18:1n9c was strongly correlated with α-linolenic acid (C18:3n3), with r values ranging from 0.484 to 0.266 and p < 0.001 (Figure 1, Table S2). In addition, C18:1n9c showed strong positive correlations with C16:0, C18:0, C14:0, and C23:0, with r values ranging from 0.723 to 0.451 and p < 0.001 (Figure 1, Table S2). The content of C18:2n6c was positively correlated with C16:0, C23:0, C18:0, and C24:0, with r values ranging from 0.579 to 0.362 and p < 0.001 (Figure 1, Table S2). The content of C18:3n3 was positively correlated with C23:0 and C16:0, with r values ranging from 0.369 to 0.299 and p < 0.001 (Figure 1, Table S2).
Meanwhile, the content of C18:1n9c showed strong negative correlations with C12:0, C13:0, C15:0, C10:0, C6:0, C11:0, and C4:0, with r values ranging from −0.238 to −0.467 and p < 0.01 (Figure 1, Table S2). The content of C11:0 showed strong negative correlations with C18:3n3 and eicosapentaenoic acid (C20:5n3), with r values ranging from −0.261 to −0.357 and p < 0.01 (Figure 1, Table S2). The content of C18:2n6c showed strong negative correlations with C15:0, C13:0, and C11:0, with r values ranging from −0.188 to −0.383 and p < 0.01 (Figure 1, Table S2). The content of C16:0 showed strong negative correlations with ginkgolic acid (C17:1) and elaidic acid (C18:1n9t), with r values ranging from −0.171 to −0.228 and p < 0.01 (Figure 1, Table S2).

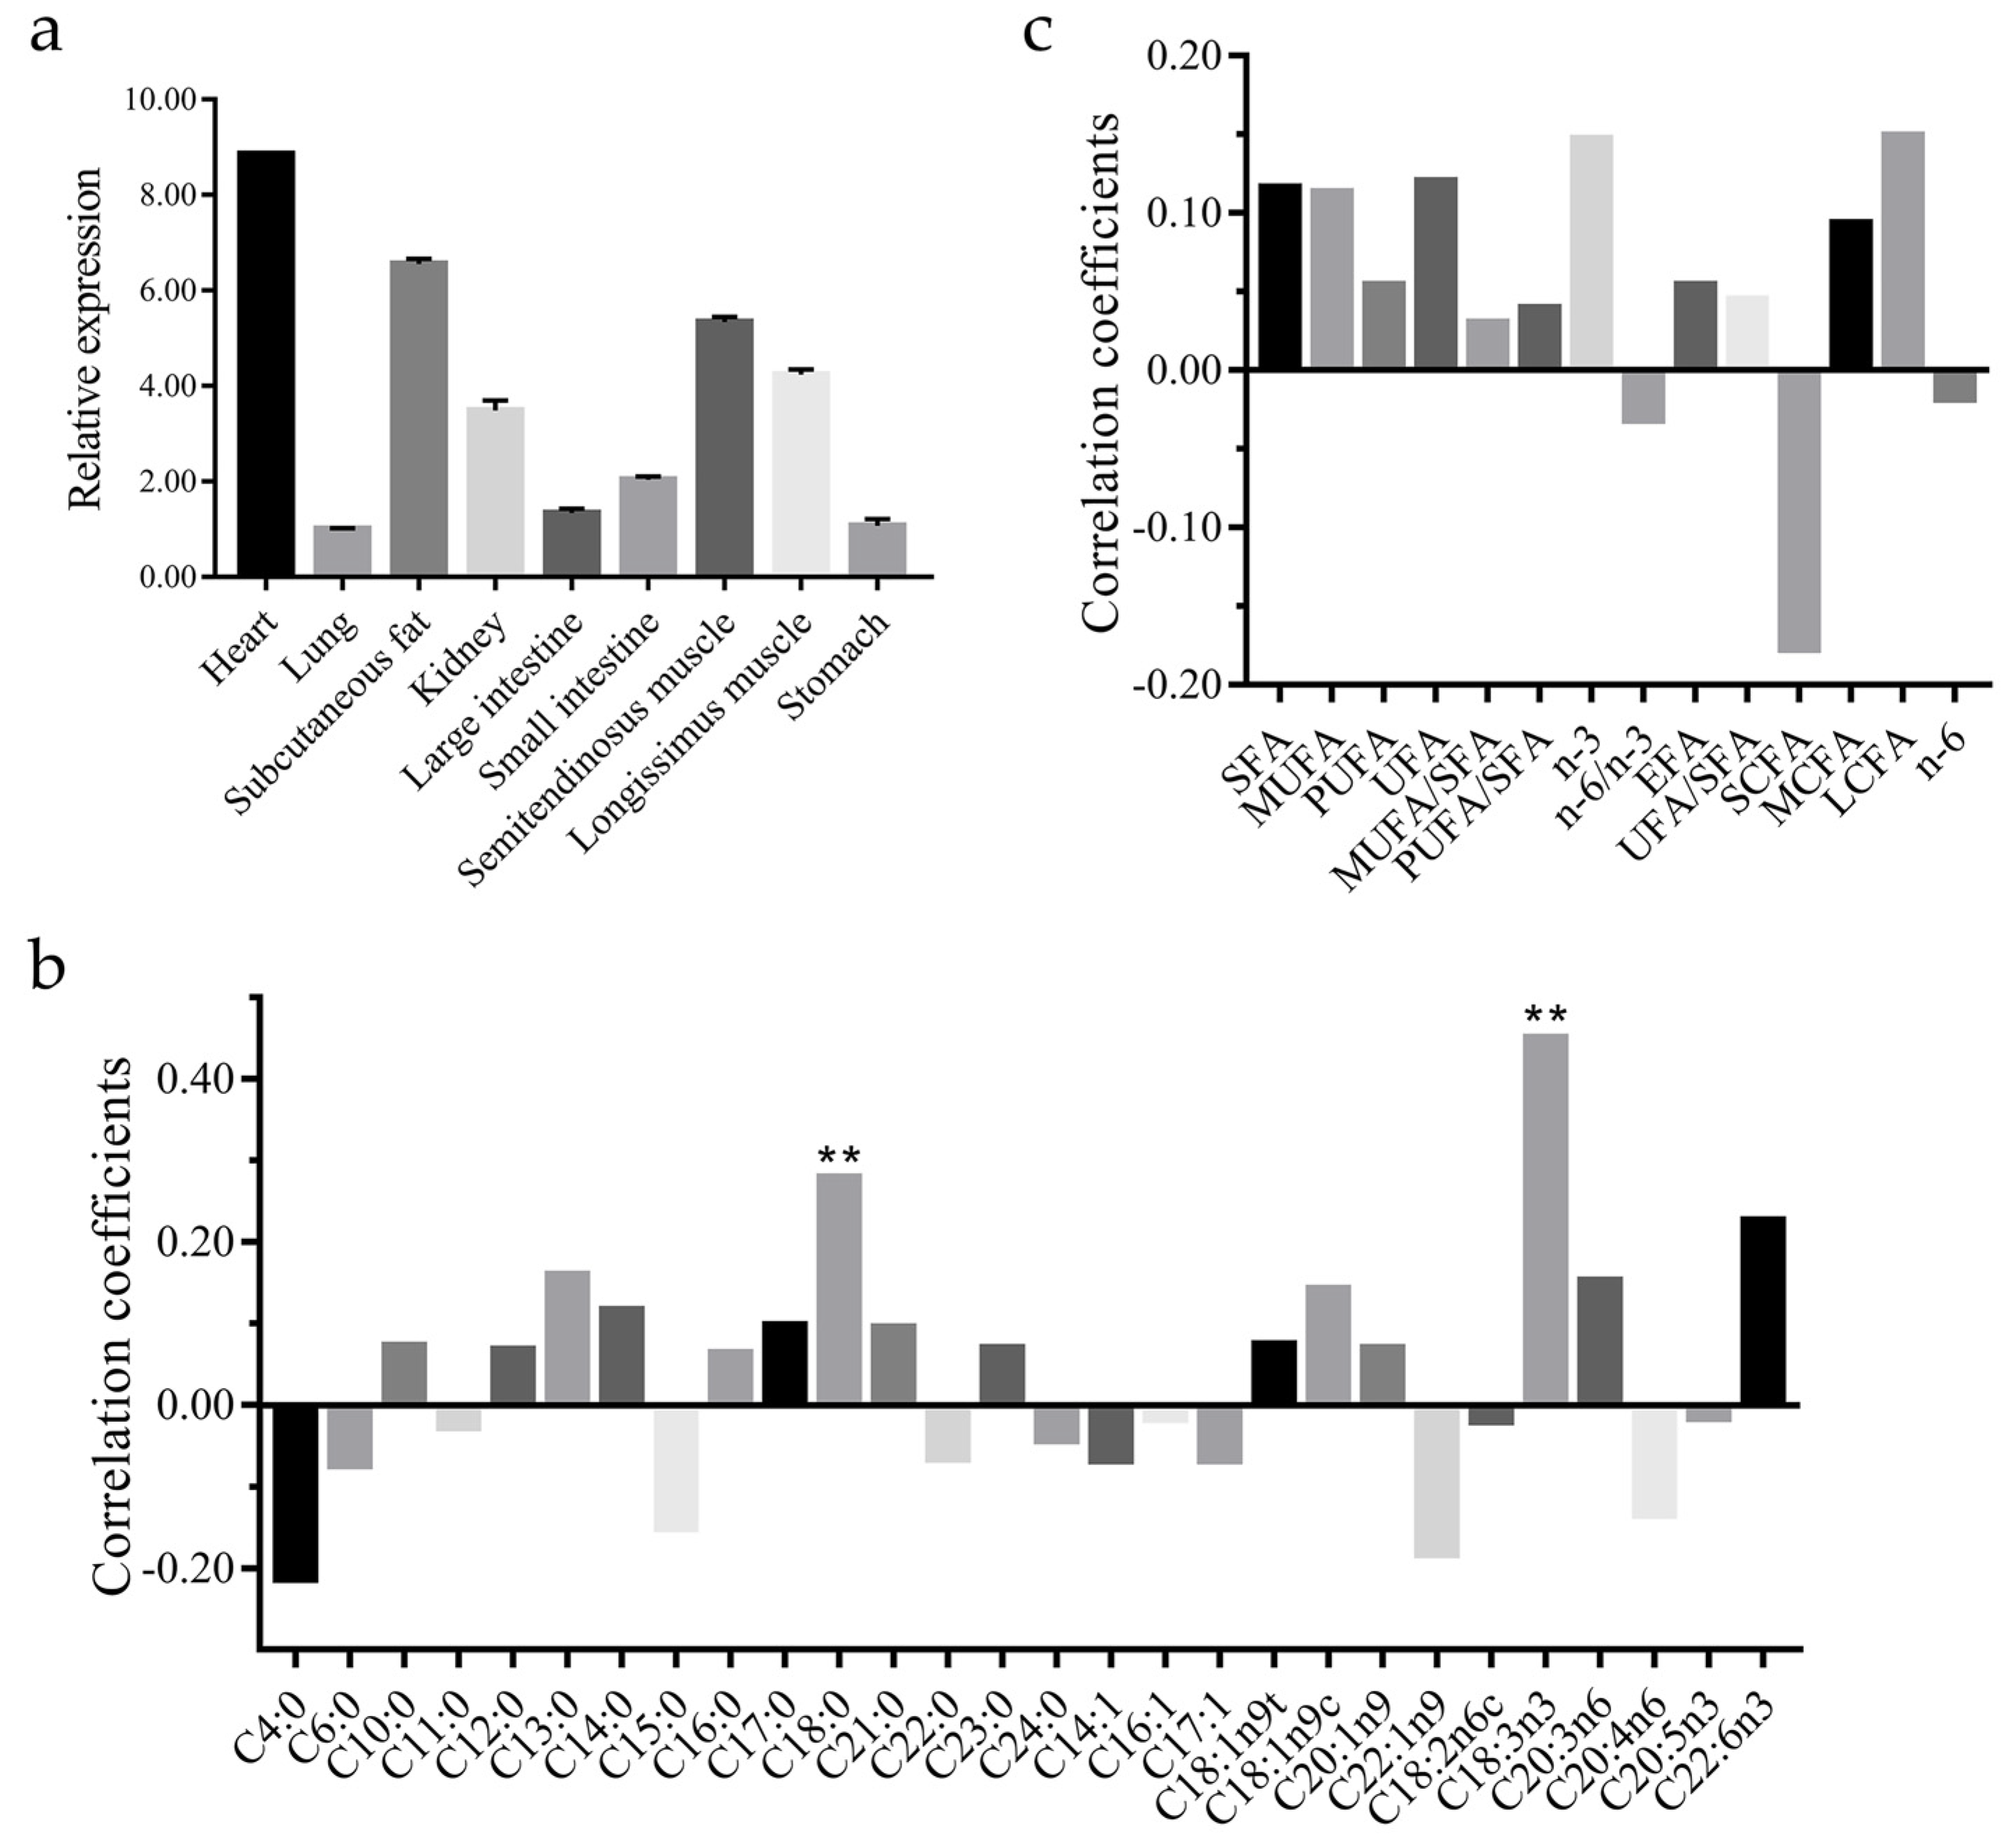
3.2. CAST Gene Expression Profiles in Sheep

CAST gene expression profiles in various tissues of Sonid sheep are shown in Figure 2a. CAST gene expressions were significant higher in heart tissue, subcutaneous fat, the LL, and semitendinosus muscle than in other tissues (Figure 2a; statistical difference of the CAST gene expression between different tissues are shown in Table S3). CAST gene expressions were significantly positively correlated with C18:0 and C18:3n3 (p < 0.01; Figure 2b,c).

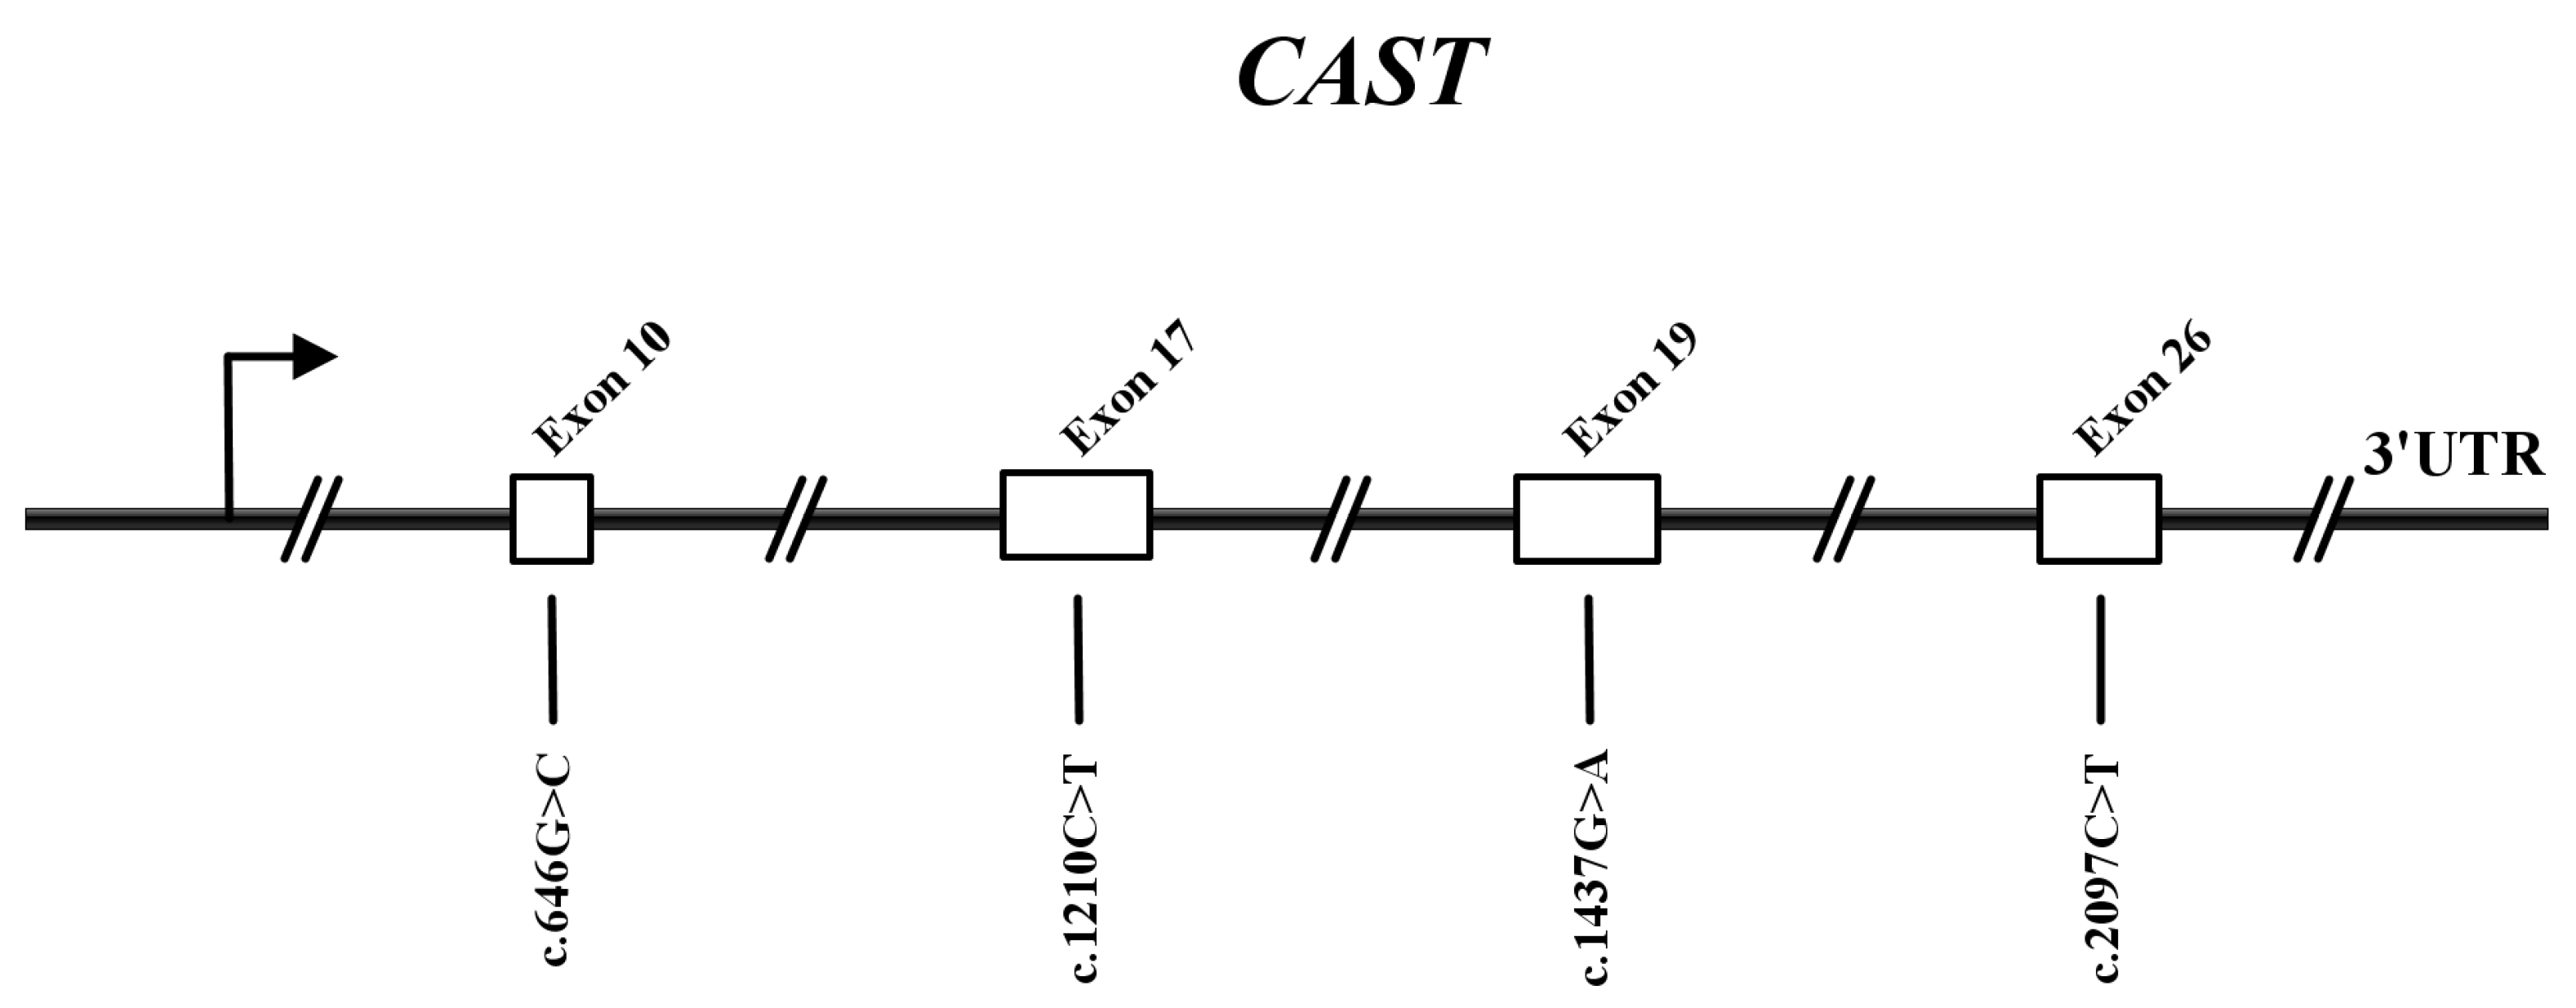
3.3. Variant Discovery in the CAST of Sonid Sheep

Sequence analysis revealed four novel variants in the CAST gene of Sonid sheep. Among them, the c.646G>C, c.1210C>T, c.1437G>A, and c.2097C>T variants are in exons 10, 17, 19, and 26 of CAST, respectively (Figure 3).
The c.646G>C and c.1210C>T mutations in exons 10 and 17 of CAST caused missense mutation at the 216 (glycine to arginine) and 404 (arginine to cysteine) positions in the amino acid sequence of the CAST protein, respectively. The c.1437G>A and c.2097C>T mutations in exons 19 and 26 of CAST caused silent mutation at the 479 (threonine) and 699 (glycine) positions in the amino acid sequence of the CAST protein, respectively (Figure 4).
For each variant, the frequencies of the two alleles and three genotypes in the MG breed are listed in Table S4, as are the genetic indices (Ho, He, ne, PIC, and Hardy–Weinberg equilibrium). The results of the population diversity test showed that four polymorphic loci of the CAST gene were low polymorphic or moderate polymorphic in Sonid sheep. No significant departures at the 5% level were detected by any test for each variant in Sonid sheep. The values of the PIC of the three variants (c.646G>C, c.1437G>A, and c.2097C>T) presented with related low polymorphism in Sonid sheep. The values of the PIC of the c.1210C>T variant presented with related moderate polymorphism in the Sonid sheep population (Table S4).

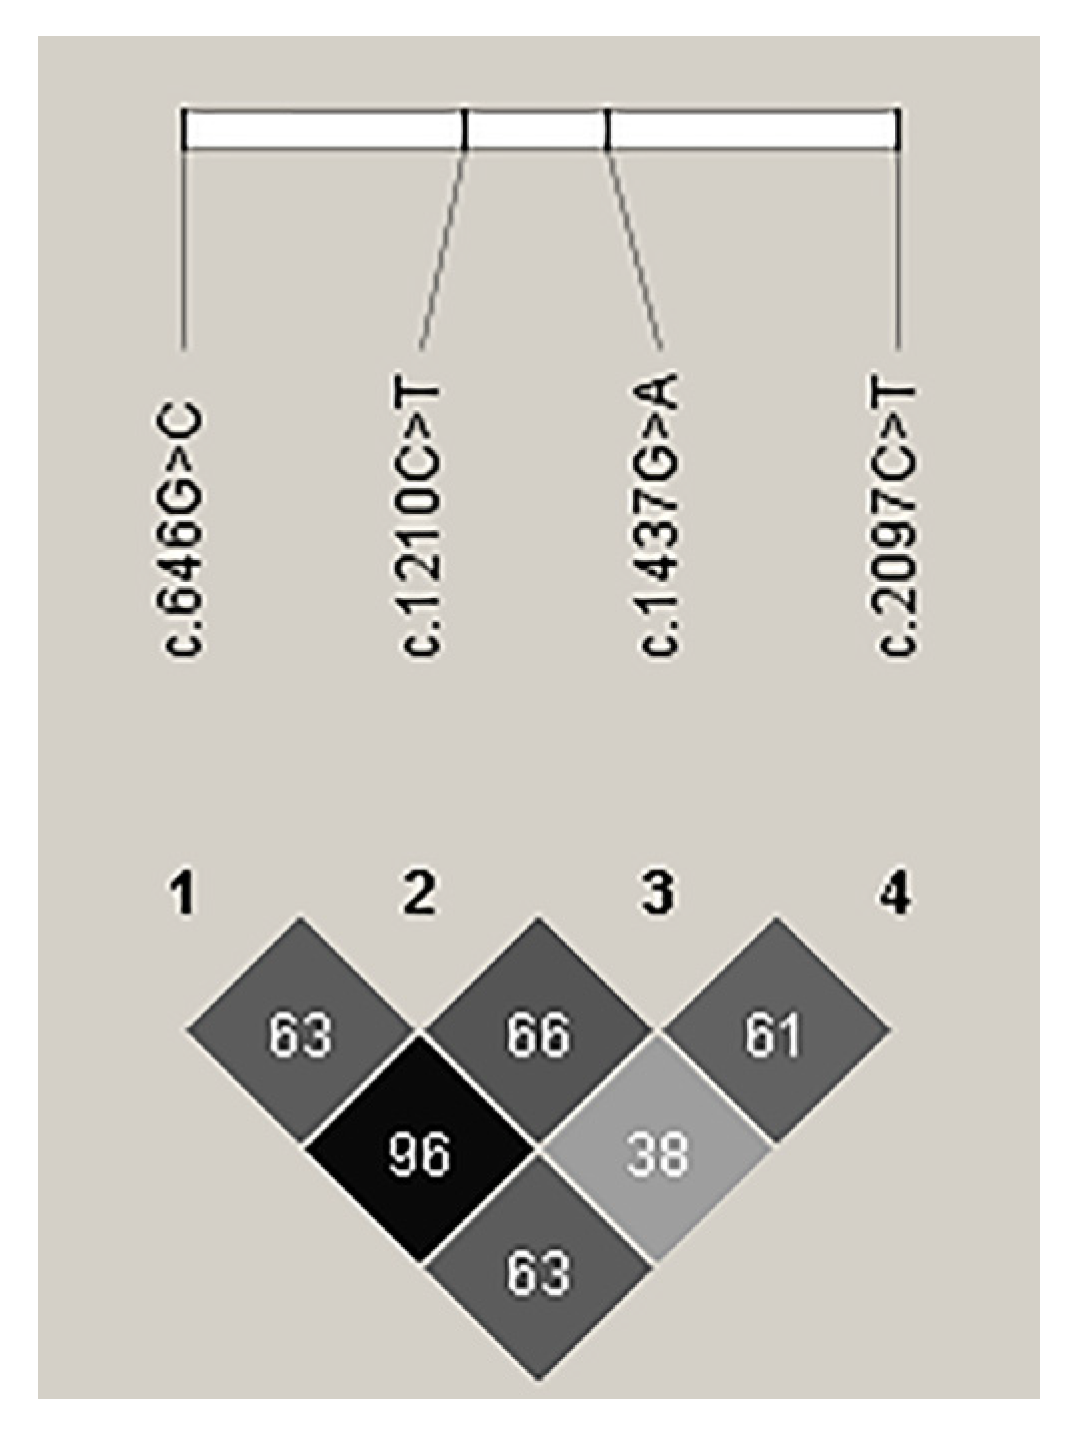
3.4. Linkage Disequilibrium Analysis of Novel Variants of CAST

To identify the linkage relationships among the four variants, D’ and r2 were estimated for the experimental Sonid sheep. The c.646G>C and c.1437C>T variants were in nearly complete LD in the experimental Sonid sheep by r2 = 0.964 (Figure 5). Thus, these LD groups were analyzed together and marked as a single locus, designated LD-M. D’ and r2 for the experimental Sonid sheep are shown in Table S5.

3.5. Associations between Variants in CAST and Fatty Acid

The significant effects of the four novel variants of the CAST gene on FA compositions and FA classes in the LL of Sonid sheep are shown in Table 3, and other results are presented in Table S6. For c.1210C>T, the contents of C14:0 (p < 0.01), C18:0 (p < 0.05), C18:1n9c (p < 0.05), and C18:3n3 (p < 0.05) of the CC genotype individuals were significantly higher than those of the CT genotype individuals; the contents of n3-PUFA of the CC genotype individuals were significantly higher than those of the CT and TT genotype individuals (p < 0.01); the content of C12:0 of the CC genotype individuals was significantly lower than that of CT genotype individuals (p < 0.05); the content of n6-PUFA of the CC genotype individuals was significantly lower than that of TT genotype individuals (p < 0.01); and the ratio of n6/n3-PUFA of the CC genotype individuals was significantly lower than that of the CT and TT genotype individuals (p < 0.01; Table 3). For c.1437G>A in LD-M, compared to the GA genotype, the GG genotype individuals had significantly higher contents of C14:0 (p < 0.01), C18:0 (p < 0.01), SFA (p < 0.05), C18:1n9c (p < 0.05), and n3-PUFA (p < 0.01), and the GG genotype individuals had significantly lower C10:0 (p < 0.05) and C18:1n9t (p < 0.05) contents and the ratio of n6/n3-PUFA (p < 0.01; Table 3). For c.2097C>T, sheep with the CC genotype had significantly higher C18:3n3 and n3-PUFA levels when compared to sheep with the CT genotype (p < 0.05), and the content of C10:0 and the ratio of n6/n3-PUFA of the CC genotype individuals were significantly lower than those of the CT genotype individuals (p < 0.05 and p < 0.01, respectively) in the LL of Sonid sheep (Table 3).

3.6. Associations between Haplotypes of CAST and Fatty Acid

Using the online tool SHEsis, different haplotypes were constructed in the experimental population of Sonid sheep in order to analyze the associations between FA composition and haplotypes. A haplotype with a frequency of >3% was considered a distinguishable haplotype, while haplotypes with a relative frequency of <3% were pooled into a single group. Thus, haplotype 1 (GCGC, H1) had the highest frequency (0.798), followed by haplotype 2 (CTAT, H2, 0.101) and haplotype 3 (GTGC, H3, 0.053); see Table 4.
Table 4 shows the significant effects of the haplotype of the CAST gene on FA composition and FA classes in the LL of Sonid sheep, and other results are presented in Table S7. By haplotype-based association analyses, we found that the content of C12:0 of the H1H1 haplotype individuals was significantly lower than that of the H1H3 haplotype individuals (p < 0.05), and the content of heneicosylic acid (C21:0) of the H1H3 haplotype individuals were significantly higher than that of H1H1 (p < 0.01) and H1H2 (p < 0.05) haplotype individuals (Table 5). Compared to the H1H2 haplotype, the H1H1 haplotype individuals had significantly higher contents of C18:3n3 (p < 0.05) and n3-PUFA (p < 0.01; Table 5). The ratio of n6/n3-PUFA of the H1H1 haplotype individuals was significantly lower than that of H1H2 (p < 0.05) and H1H3 (p < 0.05) haplotype individuals (Table 5).

3.7. Bioinformatics analysis of ovine CAST

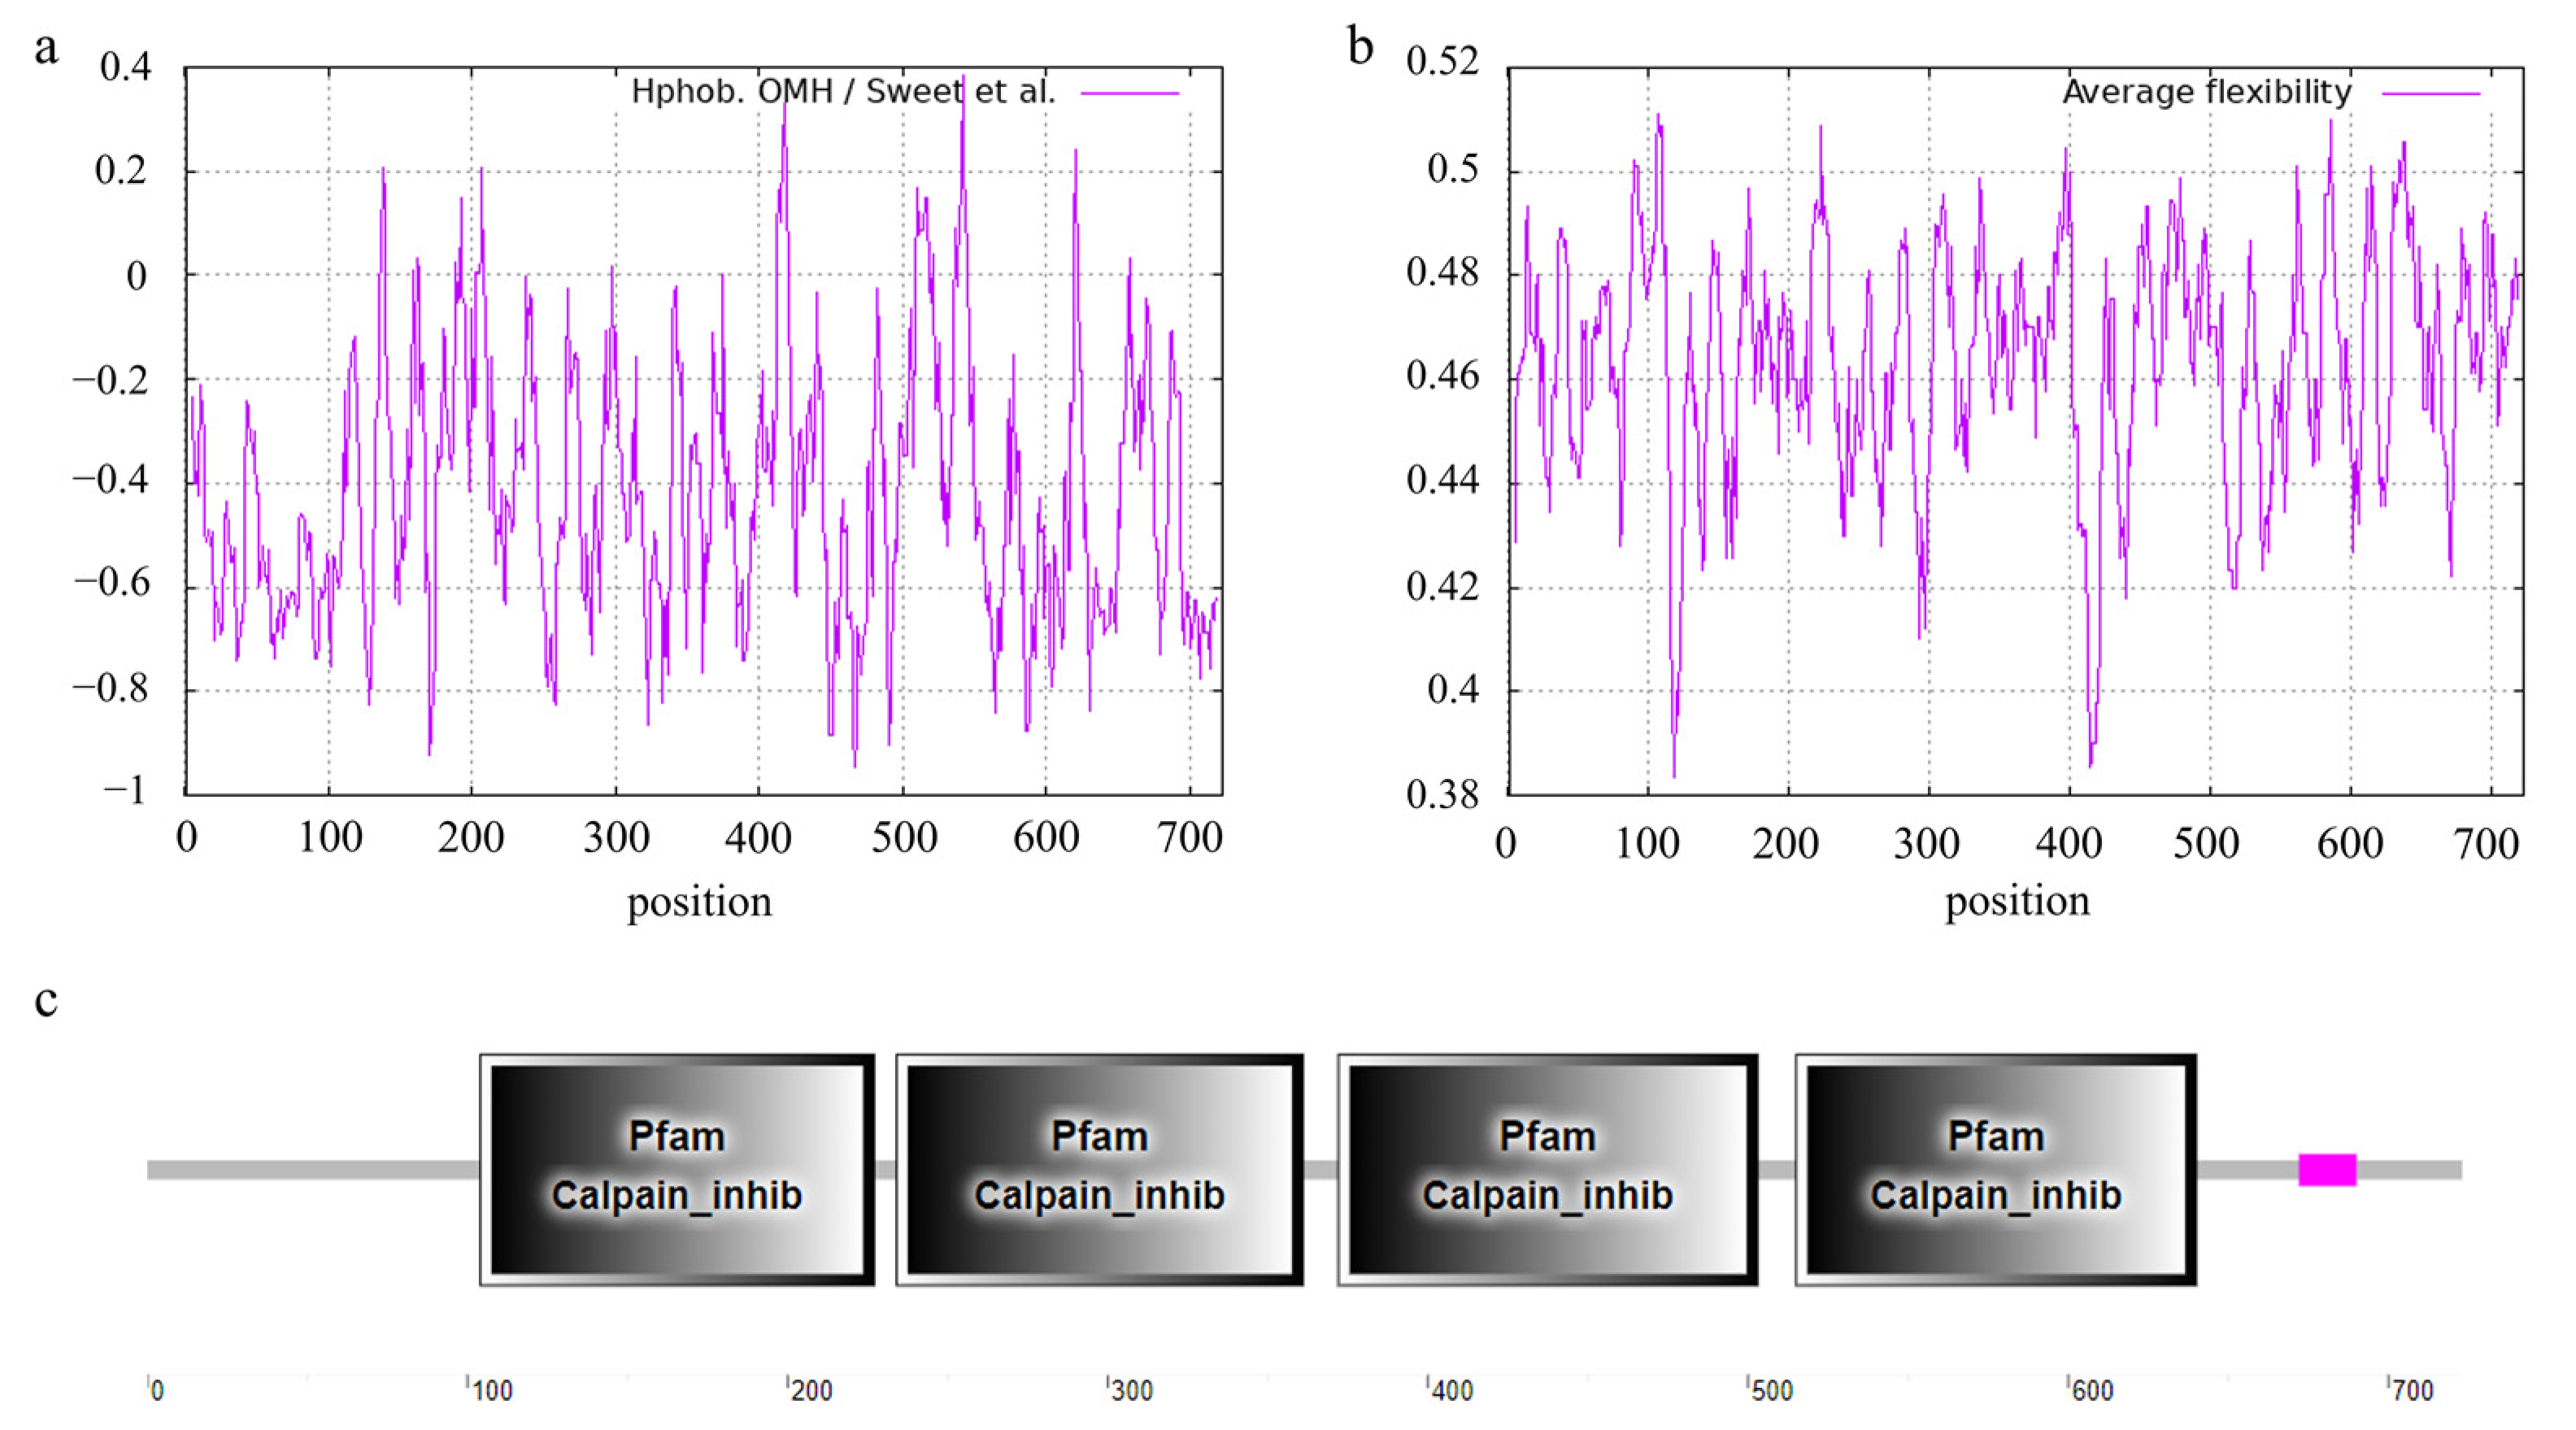
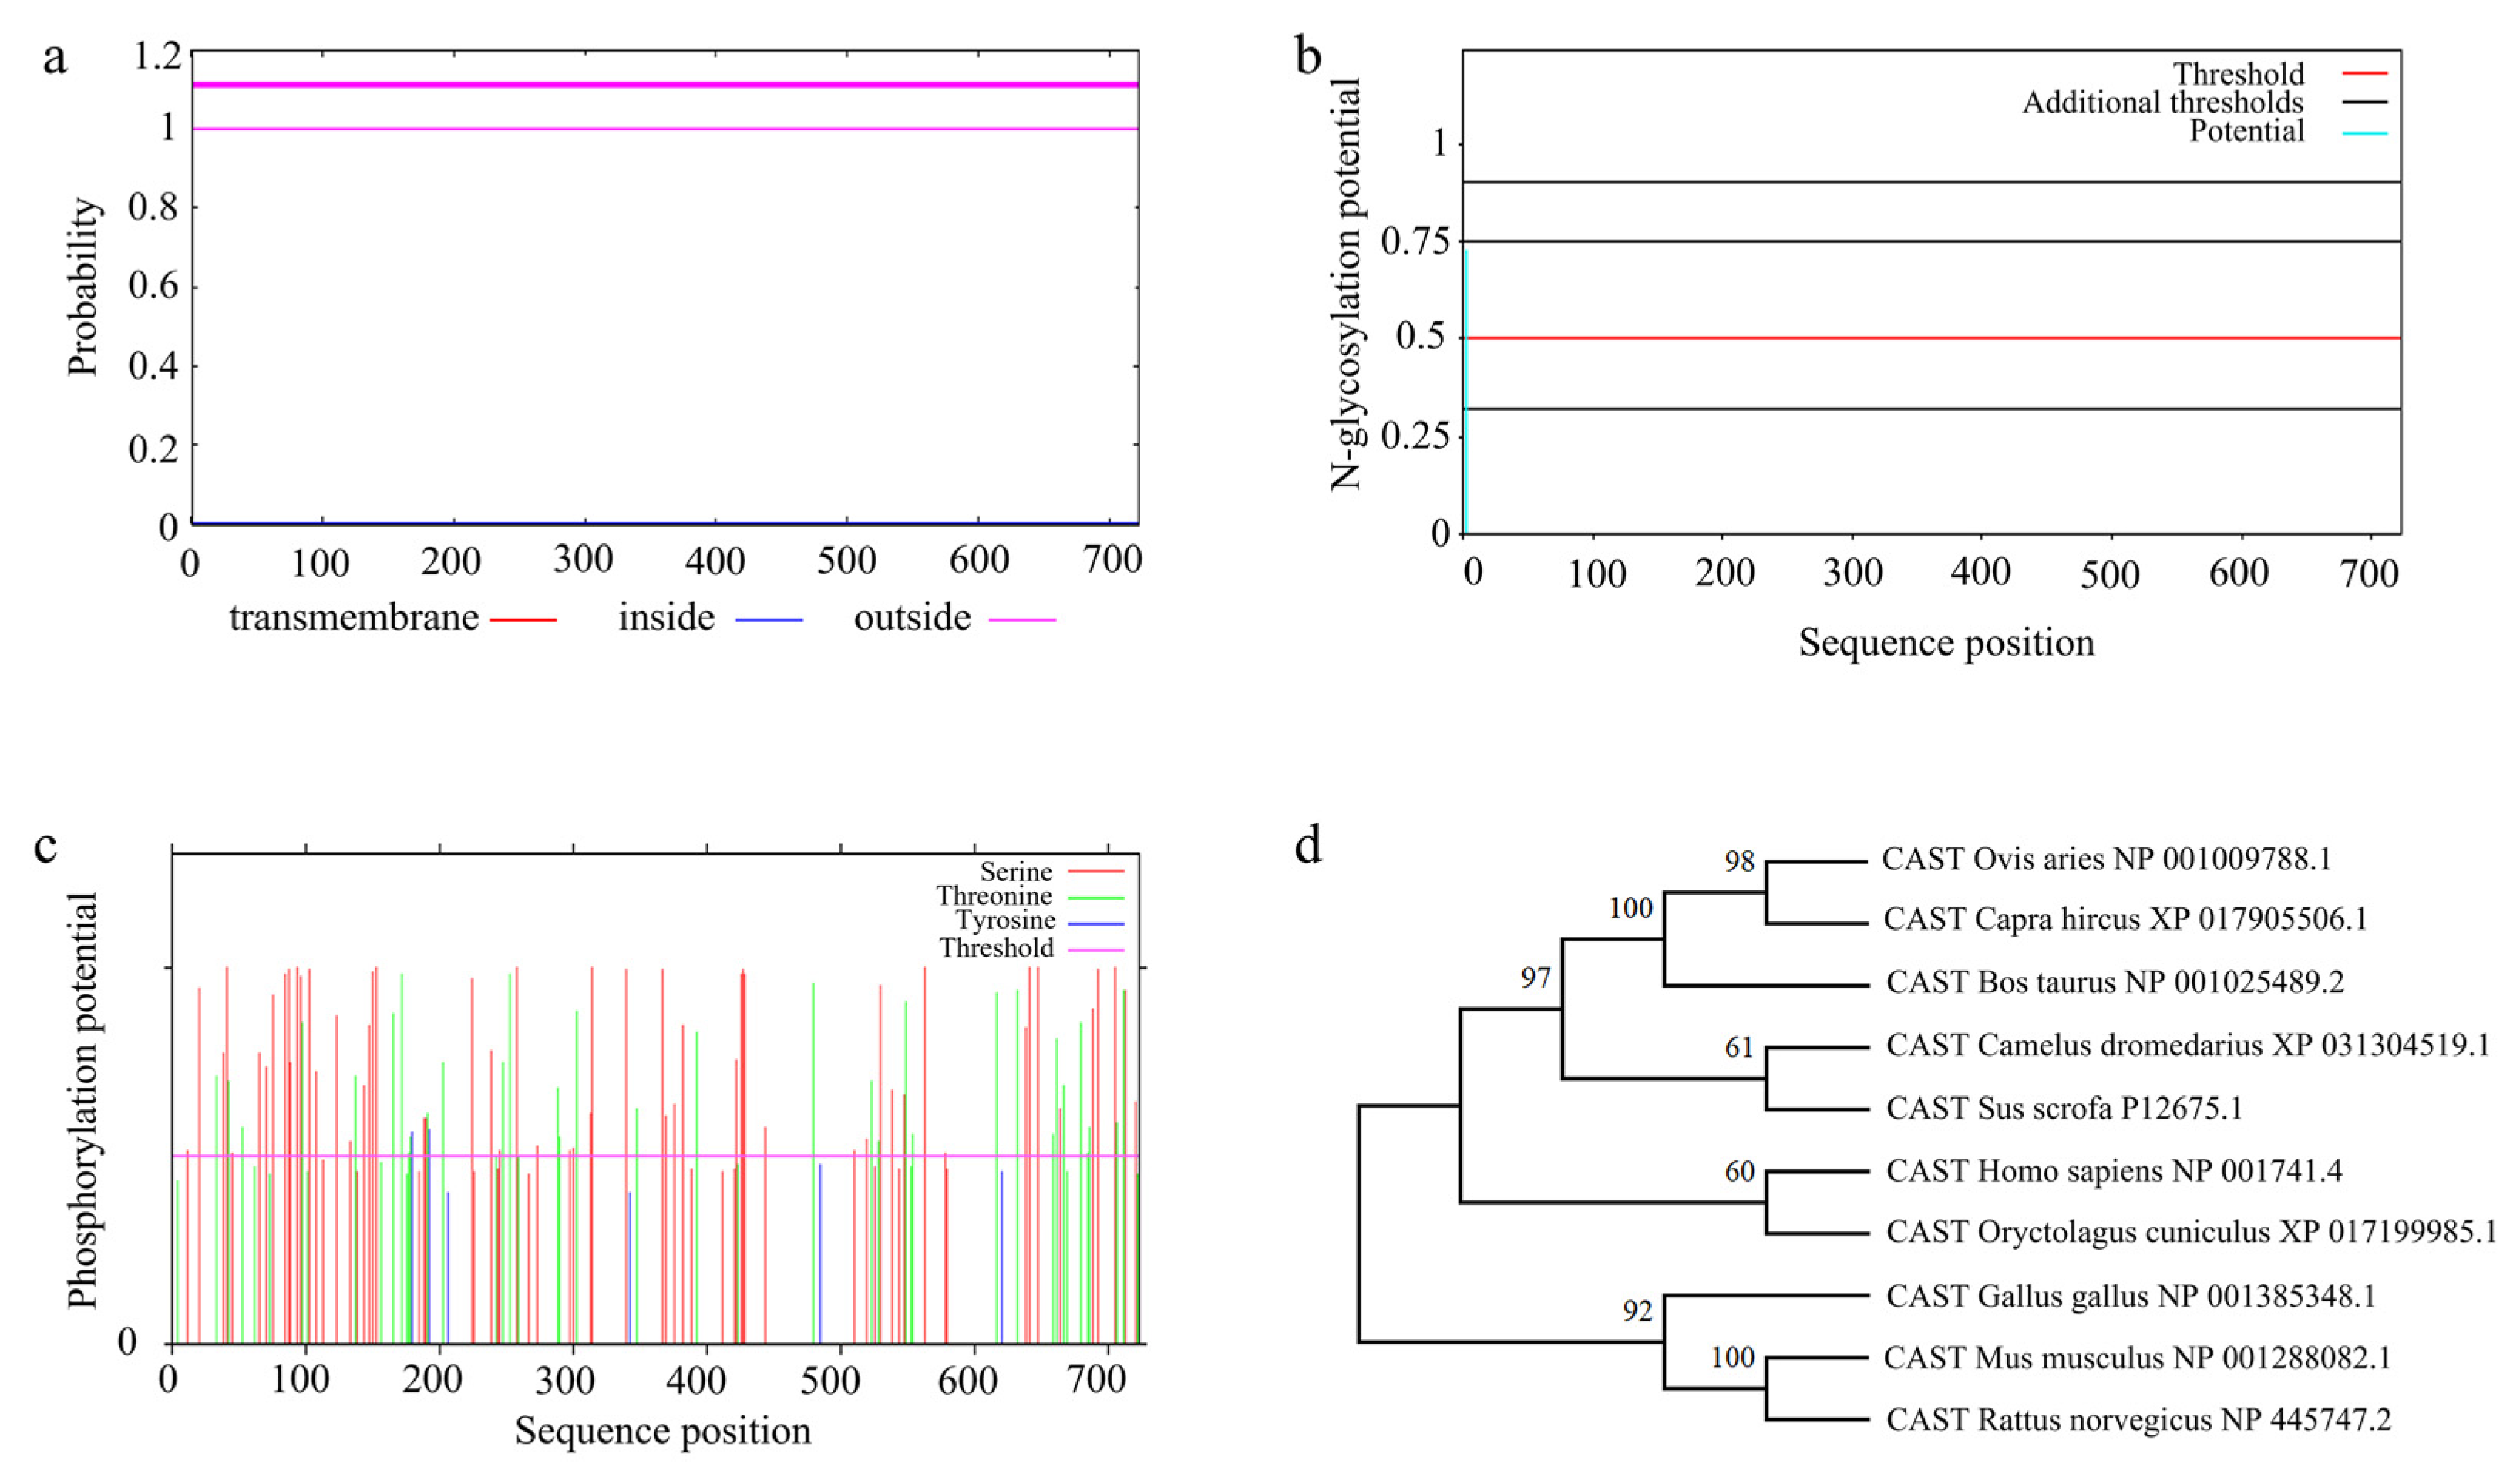
3.7.1. Feature and Structure Prediction of the Ovine CAST Protein

Hydrophobicity analysis of the ovine CAST protein indicated that the maximum hydrophobicity value was 2.189 in the position of 542 aa and the minimum was −3.544 in the position of 25 aa (Figure 6a). The maximum and minimum average flexibility index values of ovine CAST were 0.511 for the 107 aa position and 0.383 for the 118 aa position, respectively (Figure 6b). SMART was used to predict the conservative domain. There were four Calpain_inhib domains at 104–227, 234–361, 372–503, and 515–640 aa, and one low-complexity region at 672–690 aa (Figure 6c).

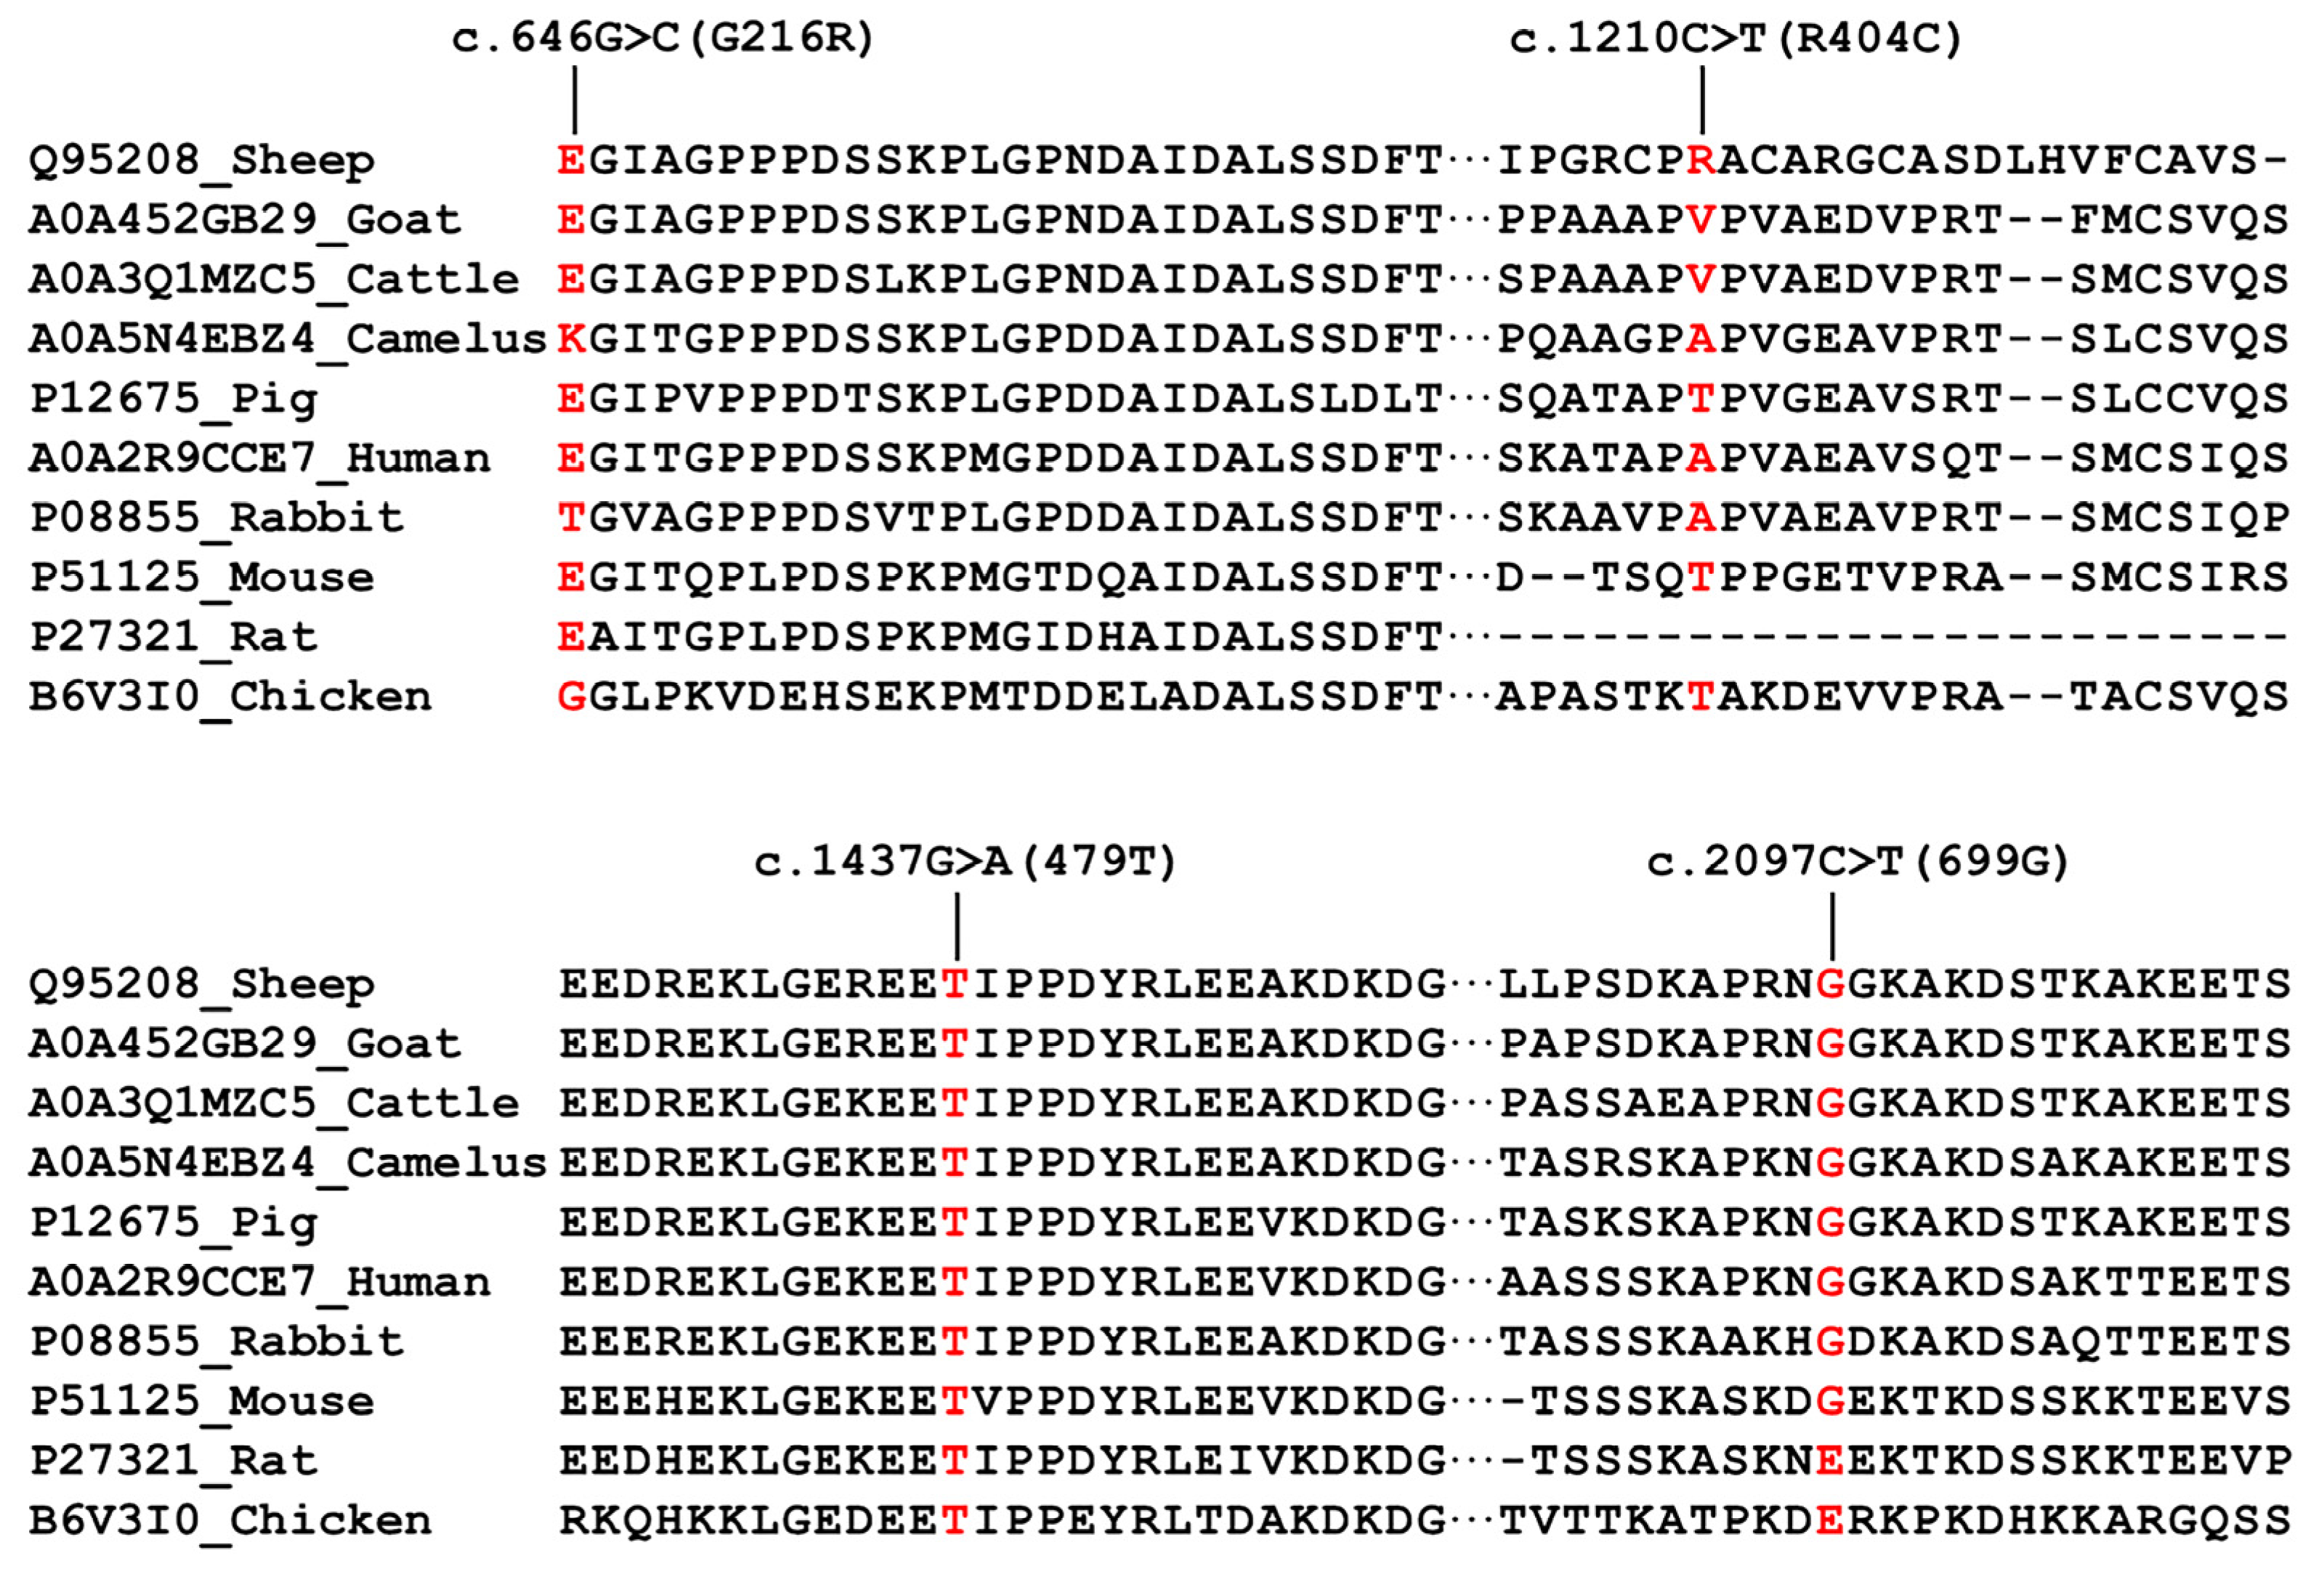
3.7.2. Amino Acid Sequence Analysis of Ovine CAST

ProtParam was used to predict the physicochemical properties of amino acid sequences. The molecular weight and isoelectric point of ovine CAST were 78,998.90 Da and 6.08, respectively. The amino acid composition of the CAST protein showed that the highest proportion of the CAST protein was 13.4% for lysine and the lowest was 0.1% for tryptophan.
TMHMM was used to predict subcellular localization based on the protein function and the physical and chemical environment in vivo. There was no transmembrane helix position on the CAST protein (Figure 7a). We predicted 1 N-glycosylation site (Asn) and 95 phosphorylation sites (composed of 59 Ser, 34 Thr, and 2 Tyr) in CAST (Figure 7b,c).

3.7.3. Multiple Sequence Alignment and Phylogenetic

To construct phylogenetic trees for the gene identified as homologous to ovine CAST, the amino acid sequence of CAST in some models and domesticated animals was used. After that, a molecular phylogenetic tree was constructed using the maximum-parsimony method, and 1000 Bootstrap replications were carried out using MEGA software (Version X).

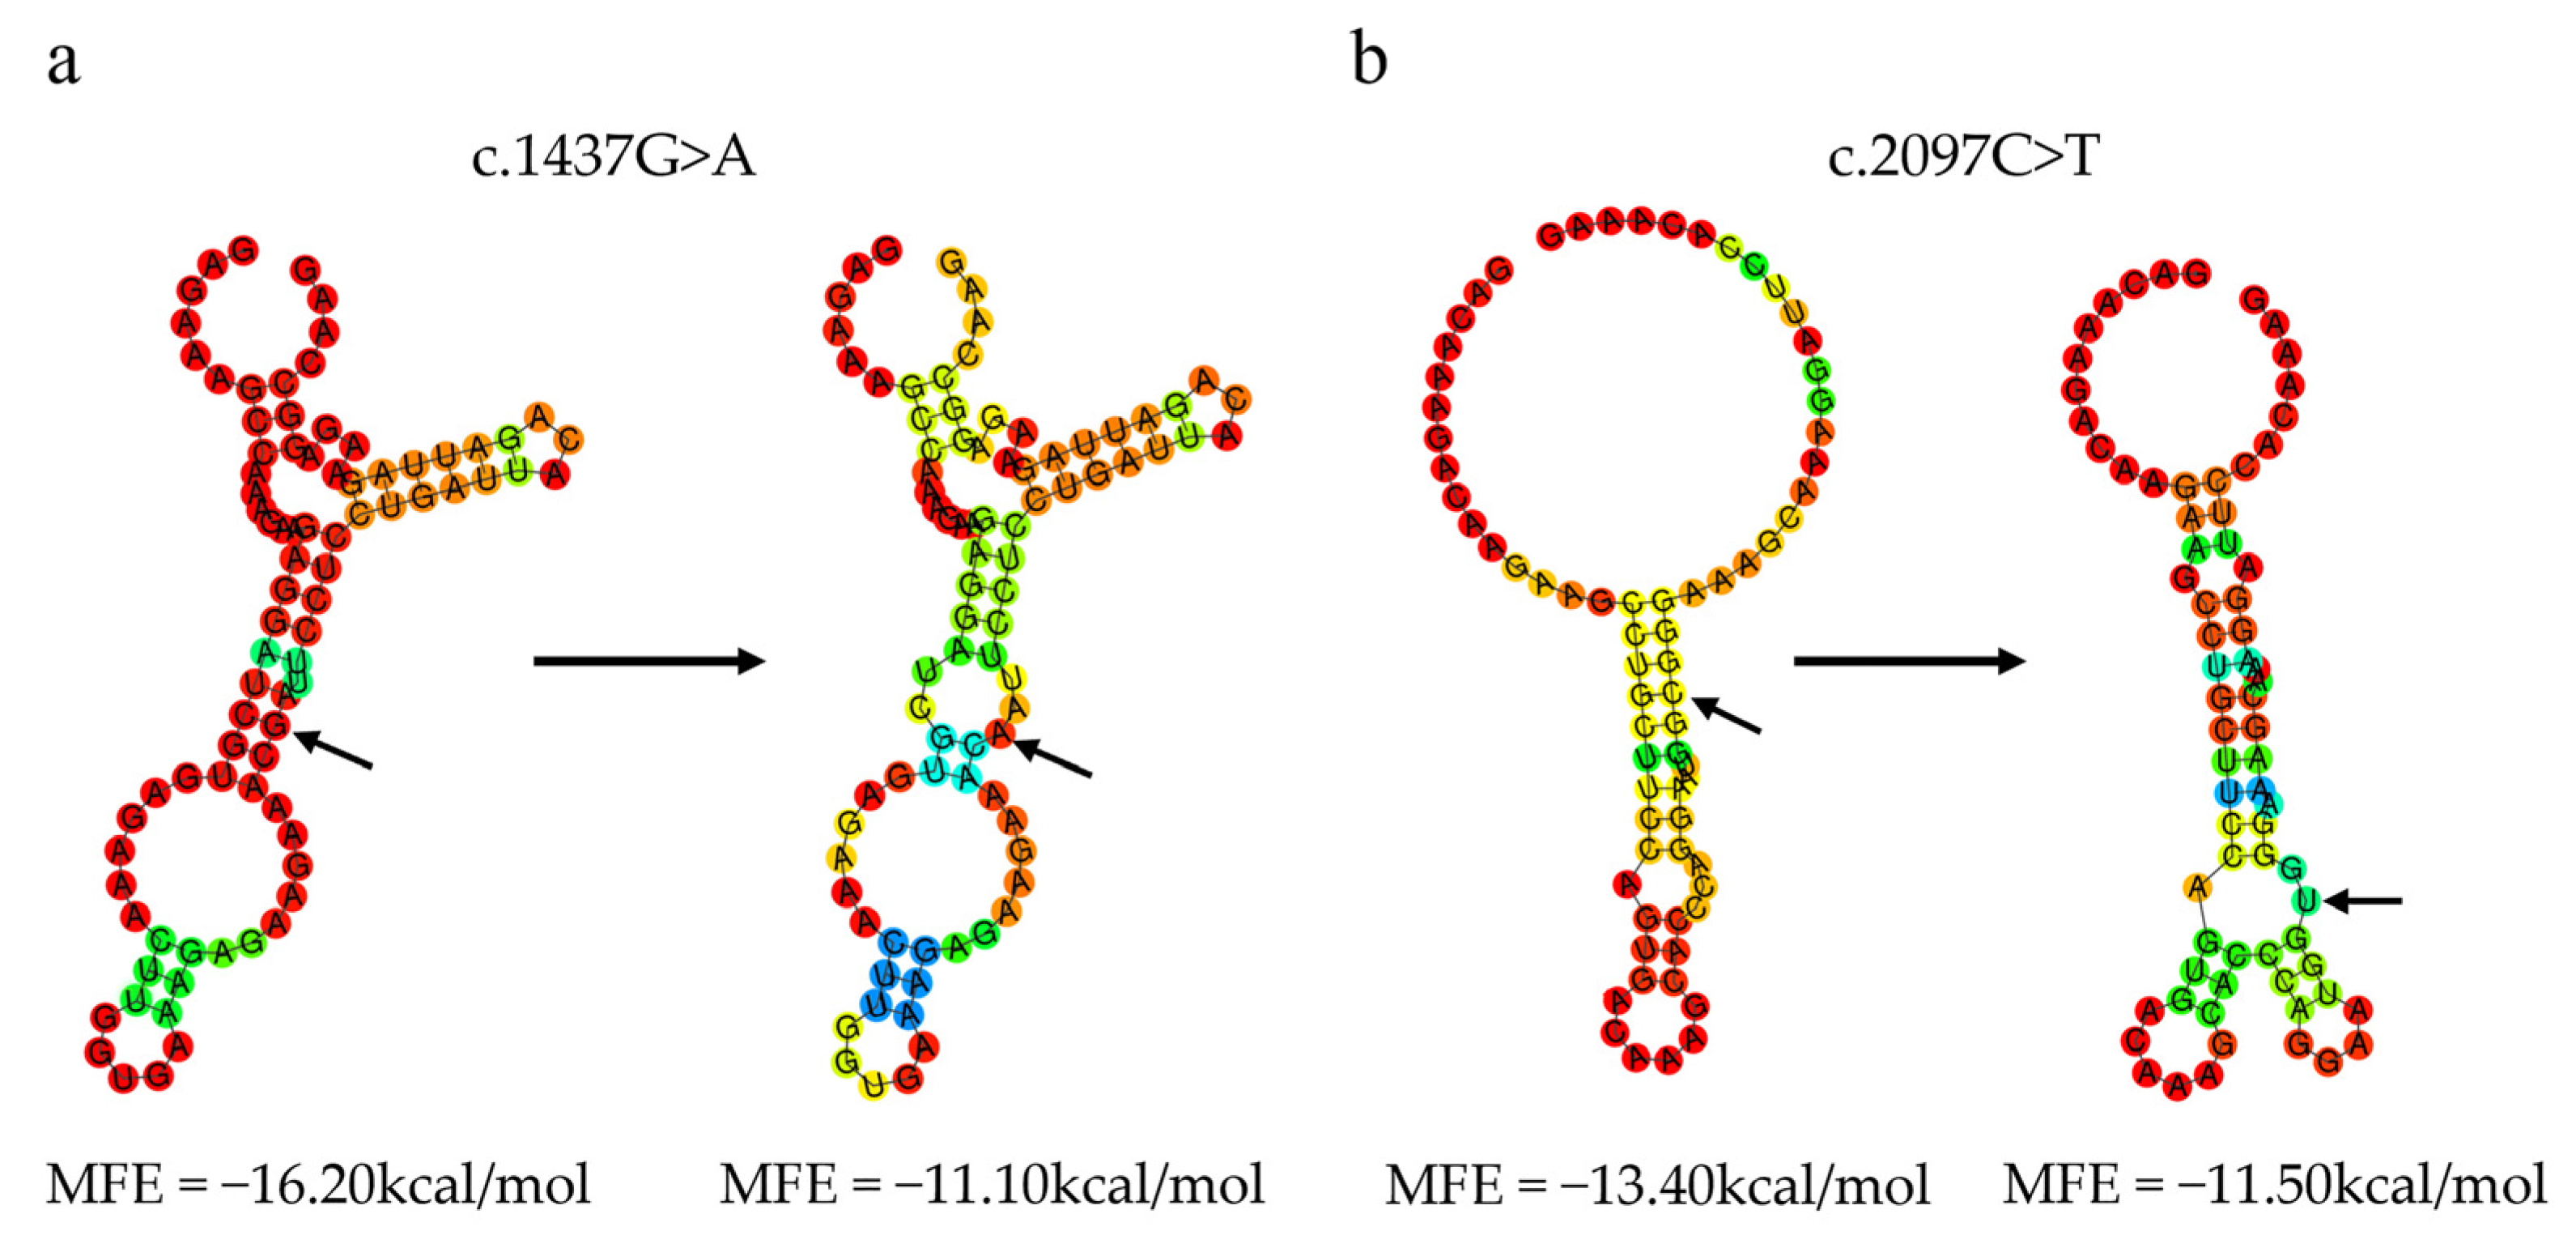
3.7.4. Effect of Variants on the mRNA Secondary Structure of the Ovine CAST Gene

Using minimum free energy (MFE)-based RNAfold platform analysis, the results can show a difference in the secondary structure of a point mutation [26]. The MFE of exonic mRNA sequences with wild types at the c.1437G>A in exon 19 and c.2097C>T in exon 26 were −16.20 kcal/mol and −13.40 kcal/mol, respectively. The MFE of the c.1437G>A and c.2097C>T mutations reduced to −11.10 kcal/mol and −11.50 kcal/mol, respectively. As a result of these mutations, the mRNA secondary structure of CAST also changed (Figure 8).

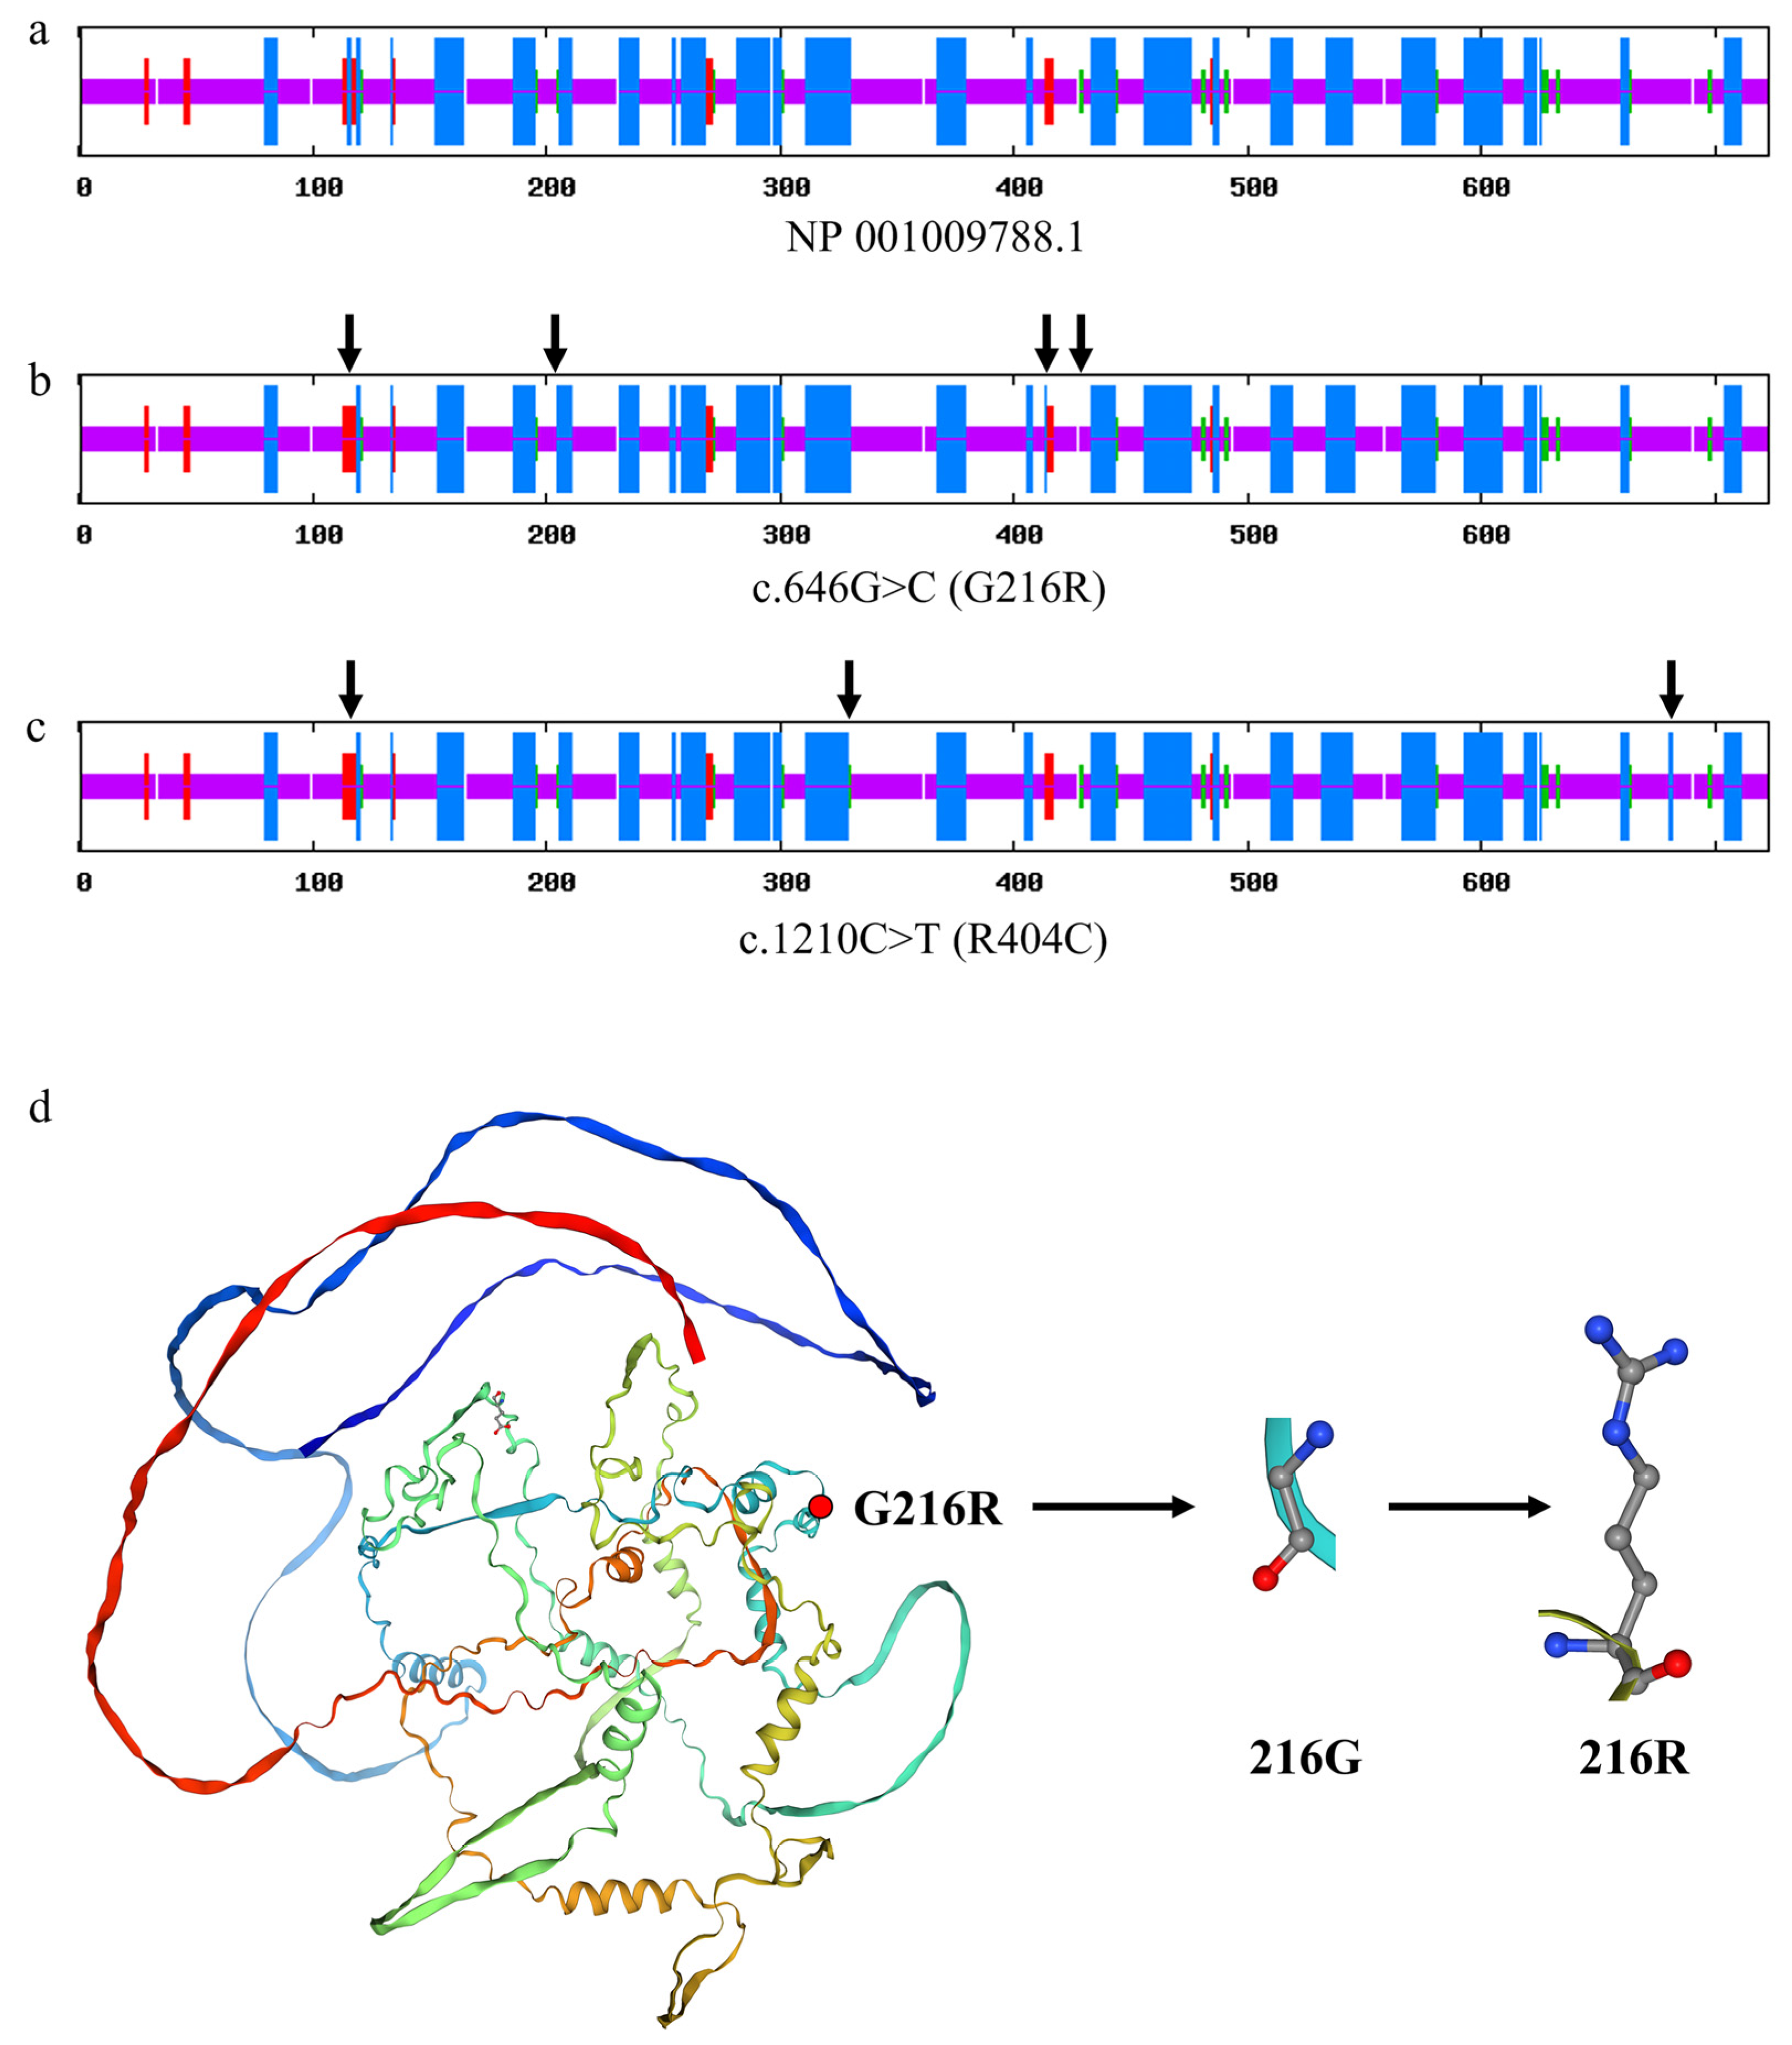
3.7.5. Effect of Variants on the Secondary and Tertiary Structure of the Ovine CAST Protein

SOPMA software was used to analyze the secondary structures of the coding proteins of ovine CAST, and the results showed that the percentages of the alpha helix, beta turn, random coil, and extended strand of CAST (CAST Protein ID: NP_001009788.1) were 31.12%, 2.90%, 63.49%, and 2.49%, respectively (Figure 9a). The black arrows indicate four changes in the secondary structure of the protein when the sequence of amino acids changed from glycine to arginine at the c.646G>C (G216R) locus (Figure 9b), and the percentages of the alpha helix, beta turn, random coil, and extended strand of CAST changed to 31.26%, 2.49%, 63.62%, and 2.63%, respectively. The black arrows indicate three changes in the secondary structure of the protein when the amino acid sequence changed from arginine to cysteine of at the c.1210C>T (R404C) locus. (Figure 9c), and the percentages of the alpha helix, beta turn, random coil, and extended strand of CAST changed to 31.40%, 3.04%, 62.79%, and 2.77%, respectively.
AlphaFold and SWISS-MODEL were used to predict the tertiary structure of the ovine CAST protein (UniProtKB: Q95208). The calcium-dependent complex between calpain-2 and calpastatin (sequence identity 67.06%) was used as a template for modeling (PDB ID: 3DF0.1.C). It was predicted that the amino acid change at the G216R (c.646G>C) site would cause visible changes in the CAST structure (Figure 9d).

4. Discussion

The CAST gene has been considered a major functional gene related to carcass traits and meat quality in cattle and pig [9,10,11,12,13,14]. However, studies on associations of the expression levels and genetic variants of CAST with FA in sheep are rare. In this study, the results of CAST expression analyses showed that the expression levels of CAST are significantly positive correlated with C18:0 and C18:3n and show a trend of positive correlation with n3, medium-chain fatty acids (MCFA), and long-chain fatty acids (LCFA). In contrast, the expression levels of CAST showed a trend of a negative correlation with n6, short-chain fatty acids (SCFA), and n6/n3. Therefore, the high expression levels of CAST are more desirable for a better FA composition. Sheep meat generally contains higher levels of SFA, which are widely correlated with health problems, such as heart disease, stroke, and obesity [27], so consumers favor leaner meats containing less SFA and high levels of PUFA [28,29]. PUFA, mainly long-chain omega-3 FAs, are considered beneficial for human health as they reduce serum low-density lipoprotein-cholesterol and total cholesterol and modulate immune functions [30]. Additionally, the desirable sensorial characteristic of meat is associated with PUFA and MUFA [31]. Importantly, sheep meat is rich in omega-3 FA, which is beneficial for human health and immunity [32]. Meat production with a higher PUFA and lower SFA content is, therefore, important to improve human health without requiring substantial changes in customers’ habits of meat consumption [33]. Thus, based on the results of expression analyses, the CAST gene could be considered an important candidate gene for a better FA composition and class of meat quality in the sheep industry.
The missense c.646G>C (G216R) and c.1210C>T (R404C) mutations, as well as the silent c.1437G>A (479T) and c.2097C>T (699G) mutations, are the first variants in the CAST gene to have a confirmed association with FA in sheep. The amino acid sequence is not altered by synonymous mutations, but they can affect mRNA expression, splicing, stability [34,35,36], and secondary structure [37,38], as well as protein translation, folding [39], and function [40]. In this study, the MFE of the silent c.1437G>A (479T) and c.2097C>T (699G) mutations changed from −16.20 kcal/mol to −11.10 kcal/mol and −13.40 kcal/mol to −11.50 kcal/mol, respectively. As MFE decreases, mRNA’s secondary structure could become more stable [37,38]. Additionally, the c.1437G>A (479T) and c.2097C>T (699G) mutations are predicted to change the mRNA secondary structure of CAST. The secondary structure and stability of mRNA can be altered by even single base-pair exchanges, according to some studies [41,42]. According to the results of association studies and bioinformatics analysis, the synonymous c.1437G>A (479T) and c.2097C>T (699G) mutations might be potentially functional mutations in CAST for the meat quality of sheep. They could affect the FA synthesis in sheep by altering the mRNA stability and secondary structure of CAST. However, further experiments are required to test this hypothesis.
Among the two missense mutations (c.646G>C (G216R) and c.1210C>T (R404C)) identified in this study, c.646G>C (G216R) was modeled in the tertiary structure of the CAST protein, and it was predicted that a visible structure change would occur. Both c.646G>C (G216R) and c.1210C>T (R404C) are located within the Calpain_inhib domain (104–227 aa and 372–503 aa, respectively), which is a conserved domain predicted by SMART. CAST plays an important role in the calpain–calpastatin system, which is an endogenous calcium-dependent proteinase system that mediates the proteolysis of key myofibrillar proteins during the postmortem storage of carcasses and tenderization [7,8,43]. Calpain can be inhibited by CAST, preventing calpain proteolytic activation, membrane binding, and catalytic activity [44]. This may be confirmed by the predominant isoform of CAST, which contains four inhibitory domains (Figure 6c), each of which may inhibit calpain activity, with one molecule of calpastatin able to inhibit four calpain molecules [45]. Therefore, we hypothesize that the missense mutations c.646G>C (G216R) and c.1210C>T (R404C) might change the structure of two Calpain_inhib domains to influence the interaction with calpain, which results in the dynamic change in FA synthesis and FA metabolism in sheep. Of course, this hypothesis still requires further experiments.
Based on the results of the expression and association analyses in this study, the CAST gene could be considered an important candidate gene for better FA compositions and meat quality of sheep. FA composition is influenced by diet, genetics, breed, sex, and environmental factors [46,47]. Nevertheless, FA composition is the well-defined compounds describing phenotypic traits, which are possible to improve through genetic selection. FA compositions show moderate-to-high heritability ranging from 0.15 to 0.63 [48,49]. Identification of genetic factors controlling FA composition could be implemented in breeding programs to select animals that produce higher PUFA and lower SFA in meat. Hence, the c.646G>C (G216R), c.1210C>T (R404C), c.1437G>A (479T), and c.2097C>T (699G) mutations of CAST identified in this study could be considered useful molecular markers for the purpose of optimizing the composition and class of FA in sheep breeding and industry.

5. Conclusions

In summary, this study revealed that the high expression levels of the CAST gene are positively correlated with the better FA composition and FA class of grazing Sonid lambs and indicated significant associations between the c.646G>C (G216R), c.1210C>T (R404C), c.1437G>A (479T), and c.2097C>T (699G) mutations of the CAST gene and the FA composition and class of grazing Sonid lambs. These association results give breeders more and higher possibilities to select sheep by different favorable alleles of these markers in the breeding of Sonid sheep. Therefore, these findings suggest that the favorable allele in each mutation of the CAST gene could be a potentially useful genetic marker for breeding programs aimed at improving the FA composition and class of meat quality of Sonid sheep.

Supplementary Materials

The following supporting information can be downloaded at https://www.mdpi.com/article/10.3390/ani13020195/s1: Table S1: Descriptive statistics for the studied traits in longissimus thoracis with the number of considered Sonid sheep, the mean value, and the standard deviation (SD); Table S2: Correlation analyses between any two traits of fatty acid compositions and classes; Table S3: Statistical difference of the CAST gene expression between different tissues in Sonid sheep; Table S4: Genotypic frequencies, allelic frequencies, and diversity parameters of four polymorphisms in the Sonid population; Table S5: Linkage disequilibrium as measured by D’ and r2 among four mutations in the CAST gene; Table S6: Associations of CAST variants with fatty acid composition in the longissimus thoracis muscle of Sonid sheep; Table S7: Associations between the haplotypes of CAST and fatty acid composition in the longissimus thoracis muscle of Sonid sheep.

Author Contributions

Conceptualization, M.C. and B.T.; data curation, B.T.; formal analysis, X.G., D.L., T.Y., and J.L.; funding acquisition, X.L., S.B., G.B., and B.T.; investigation, X.G., D.L., X.L., S.B., G.B., and B.T.; methodology, T.L., T.Y., J.L., G.B., M.C., and B.T.; project administration, B.T.; resources, B.T.; supervision, B.T.; validation, X.G., T.L., D.L., and M.C.; visualization, X.G.; writing—original draft, X.G., T.L., and D.L.; writing—review and editing, M.C. and B.T. All authors have read and agreed to the published version of the manuscript.

Funding

This research was funded by grants from the Inner Mongolia Science & Technology Plan (nos. 2019ZD08 and 2020ZD0007), the Xilingol Science & Technology Plan (nos. 202002 and 202120), the State Key Laboratory for Reproductive Regulation and Breeding of Grassland Livestock (nos. 2019ZD031 and 2021ZZ0204), the “Grassland Talents” Program (no. CYYC6068) of the Inner Mongolia Autonomous Region, the High-level Talents Import Program of Inner Mongolia University (no. 21400-5165112), and the High Level Overseas Talents Project ([2018] no. 190) from the Ministry of Human Resources and Social Security of China.

Institutional Review Board Statement

The animal care and experiments were conducted according to the Administration of Affairs Concerning Experimental Animals (Ministry of Science and Technology, 2004), China. The protocol was approved on 15/05/2015 by the Institutional Animal Care and Use Ethics Committee of Inner Mongolia University, with the permit number for conducting animal experiments being IMU-2015-03.

Informed Consent Statement

Not applicable.

Data Availability Statement

Not applicable.

Acknowledgments

The authors thank the Engineering Research Center of Fine Livestock’s Scale Breeding Ministry of Education of China and the Inner Mongolia Engineering Technology Research Center of Germplasm Resources Conservation and Utilization (21400-222526) of China.

Conflicts of Interest

The authors declare no conflict of interest.

References

  1. China National Commission of Animal Genetic Resources (CNCAGR). Animal Genetic Resources in China: Bovines; China Agriculture Press: Beijing, China, 2011; pp. 15–20. [Google Scholar]
  2. Hoy, A.J.; Nagarajan, S.R.; Butler, L.M. Tumour fatty acid metabolism in the context of therapy resistance and obesity. Nat. Rev. Cancer 2021, 21, 753–766. [Google Scholar] [CrossRef]
  3. Wood, J.D.; Enser, M.; Fisher, A.V.; Nute, G.R.; Sheard, P.R.; Richardson, R.I.; Hughes, S.I.; Whittington, F.M. Fat deposition, fatty acid composition and meat quality: A review. Meat Sci. 2008, 78, 343–358. [Google Scholar] [CrossRef]
  4. Ladeira, M.M.; Schoonmaker, J.P.; Swanson, K.C.; Duckett, S.K.; Gionbelli, M.P.; Rodrigues, L.M.; Teixeira, P.D. Review: Nutrigenomics of marbling and fatty acid profile in ruminant meat. Animal 2018, 12, s282–s294. [Google Scholar] [CrossRef] [PubMed] [Green Version]
  5. Pannier, L.; Gardner, G.E.; O’Reilly, R.A.; Pethick, D.W. Factors affecting lamb eating quality and the potential for their integration into an MSA sheepmeat grading model. Meat Sci. 2018, 144, 43–52. [Google Scholar] [CrossRef] [PubMed] [Green Version]
  6. Koohmaraie, M.; Geesink, G.H. Contribution of postmortem muscle biochemistry to the delivery of consistent meat quality with particular focus on the calpain system. Meat Sci. 2006, 74, 34–43. [Google Scholar] [CrossRef] [Green Version]
  7. Koohmaraie, M.; Kent, M.P.; Shackelford, S.D.; Veiseth, E.; Wheeler, T.L. Meat tenderness and muscle growth: Is there any relationship? Meat Sci. 2002, 62, 345–352. [Google Scholar] [CrossRef] [PubMed] [Green Version]
  8. Kemp, C.M.; Sensky, P.L.; Bardsley, R.G.; Buttery, P.J.; Parr, T. Tenderness--an enzymatic view. Meat Sci. 2010, 84, 248–256. [Google Scholar] [CrossRef] [Green Version]
  9. Calvo, J.H.; Iguacel, L.P.; Kirinus, J.K.; Serrano, M.; Ripoll, G.; Casasus, I.; Joy, M.; Perez-Velasco, L.; Sarto, P.; Alberti, P.; et al. A new single nucleotide polymorphism in the calpastatin (CAST) gene associated with beef tenderness. Meat Sci. 2014, 96, 775–782. [Google Scholar] [CrossRef]
  10. Ropka-Molik, K.; Bereta, A.; Tyra, M.; Rozycki, M.; Piorkowska, K.; Szyndler-Nedza, M.; Szmatola, T. Association of calpastatin gene polymorphisms and meat quality traits in pig. Meat Sci. 2014, 97, 143–150. [Google Scholar] [CrossRef]
  11. Davoli, R.; Schivazappa, C.; Zambonelli, P.; Braglia, S.; Rossi, A.; Virgili, R. Association study between single nucleotide polymorphisms in porcine genes and pork quality traits for fresh consumption and processing into Italian dry-cured ham. Meat Sci. 2017, 126, 73–81. [Google Scholar] [CrossRef]
  12. Castro, S.; Rios, M.; Ortiz, Y.; Manrique, C.; Jimenez, A.; Ariza, F. Association of single nucleotide polymorphisms in CAPN1, CAST and MB genes with meat color of Brahman and crossbreed cattle. Meat Sci. 2016, 117, 44–49. [Google Scholar] [CrossRef] [PubMed]
  13. Lee, H.J.; Jin, S.; Kim, H.J.; Bhuiyan, M.S.A.; Lee, D.H.; Lee, S.H.; Jang, S.B.; Han, M.H.; Lee, S.H. Validation Study of SNPs in CAPN1-CAST Genes on the Tenderness of Muscles (Longissimus thoracis and Semimembranosus) in Hanwoo (Korean Cattle). Animals 2019, 9, 691. [Google Scholar] [CrossRef] [PubMed] [Green Version]
  14. Fadhil, M.; Zulkadir, U. Association between polymorphisms of Myf5, MSTN and CAST genes and fattening performance in Brown Swiss and Holstein cattle breeds. Anim. Biotechnol. 2021, 32, 121–129. [Google Scholar] [CrossRef] [PubMed]
  15. Gregula-Kania, M.; Gruszecki, T.M.; Junkuszew, A.; Juszczuk-Kubiak, E.; Florek, M. Association of CAST gene polymorphism with carcass value and meat quality in two synthetic lines of sheep. Meat Sci. 2019, 154, 69–74. [Google Scholar] [CrossRef] [PubMed]
  16. Folch, J.; Lees, M.; Sloane Stanley, G.H. A simple method for the isolation and purification of total lipids from animal tissues. J. Biol. Chem. 1957, 226, 497–509. [Google Scholar] [CrossRef]
  17. Tong, B.; Gao, G.Q.; Muramatsu, Y.; Ohta, T.; Kose, H.; Li, G.P.; Fatchiyah, F.; Yamada, T. Association of the expression levels in the longissimus muscle and a SNP in the CDC10 gene with marbling in Japanese Black beef cattle. Meat Sci. 2015, 108, 28–31. [Google Scholar] [CrossRef]
  18. Schmittgen, T.D.; Livak, K.J. Analyzing real-time PCR data by the comparative C(T) method. Nat. Protoc. 2008, 3, 1101–1108. [Google Scholar] [CrossRef]
  19. Gabriel, S.; Ziaugra, L.; Tabbaa, D. SNP genotyping using the Sequenom MassARRAY iPLEX platform. Curr. Protoc. Hum. Genet. 2009, 60, 2.12.1–2.12.18. [Google Scholar] [CrossRef]
  20. Jumper, J.; Evans, R.; Pritzel, A.; Green, T.; Figurnov, M.; Ronneberger, O.; Tunyasuvunakool, K.; Bates, R.; Zidek, A.; Potapenko, A.; et al. Highly accurate protein structure prediction with AlphaFold. Nature 2021, 596, 583–589. [Google Scholar] [CrossRef]
  21. Varadi, M.; Anyango, S.; Deshpande, M.; Nair, S.; Natassia, C.; Yordanova, G.; Yuan, D.; Stroe, O.; Wood, G.; Laydon, A.; et al. AlphaFold Protein Structure Database: Massively expanding the structural coverage of protein-sequence space with high-accuracy models. Nucleic Acids Res 2022, 50, D439–D444. [Google Scholar] [CrossRef]
  22. Nei, M.; Roychoudhury, A.K. Sampling variances of heterozygosity and genetic distance. Genetics 1974, 76, 379–390. [Google Scholar] [CrossRef] [PubMed]
  23. Barrett, J.C.; Fry, B.; Maller, J.; Daly, M.J. Haploview: Analysis and visualization of LD and haplotype maps. Bioinformatics 2005, 21, 263–265. [Google Scholar] [CrossRef] [PubMed] [Green Version]
  24. Yong, Y.; He, L. SHEsis, a powerful software platform for analyses of linkage disequilibrium, haplotype construction, and genetic association at polymorphism loci. Cell Res. 2005, 15, 97–98. [Google Scholar] [CrossRef] [PubMed] [Green Version]
  25. Gao, Y.Y.; Cheng, G.; Cheng, Z.X.; Bao, C.; Yamada, T.; Cao, G.F.; Bao, S.Q.; Schreurs, N.M.; Zan, L.S.; Tong, B. Association of variants in FABP4, FASN, SCD, SREBP1 and TCAP genes with intramuscular fat, carcass traits and body size in Chinese Qinchuan cattle. Meat Sci. 2022, 192, 108882. [Google Scholar] [CrossRef]
  26. Mathews, D.H.; Disney, M.D.; Childs, J.L.; Schroeder, S.J.; Zuker, M.; Turner, D.H. Incorporating chemical modification constraints into a dynamic programming algorithm for prediction of RNA secondary structure. Proc. Natl. Acad. Sci. USA 2004, 101, 7287–7292. [Google Scholar] [CrossRef] [Green Version]
  27. Biesalski, H.K. Meat as a component of a healthy diet—Are there any risks or benefits if meat is avoided in the diet? Meat Sci. 2005, 70, 509–524. [Google Scholar] [CrossRef]
  28. McNeill, S.H. Inclusion of red meat in healthful dietary patterns. Meat Sci. 2014, 98, 452–460. [Google Scholar] [CrossRef]
  29. Micha, R.; Michas, G.; Lajous, M.; Mozaffarian, D. Processing of meats and cardiovascular risk: Time to focus on preservatives. BMC Med. 2013, 11, 136. [Google Scholar] [CrossRef] [Green Version]
  30. Stables, M.J.; Gilroy, D.W. Old and new generation lipid mediators in acute inflammation and resolution. Prog. Lipid Res. 2011, 50, 35–51. [Google Scholar] [CrossRef]
  31. Wood, J.D. Fat Deposition and the Quality of Fat Tissue in Meat Animals. Fats in Animal Nutrition; Wiseman, J., Ed.; Butterworths: London, UK, 1984; pp. 407–435. [Google Scholar]
  32. Jacob, R.H.; Pethick, D.W. Animal factors affecting the meat quality of Australian lamb meat. Meat Sci. 2014, 96, 1120–1123. [Google Scholar] [CrossRef]
  33. Gunawan, A.; Listyarini, K.; Harahap, R.S.; Jakaria; Roosita, K.; Sumantri, C.; Inounu, I.; Akter, S.H.; Islam, M.A.; Uddin, M.J. Hepatic transcriptome analysis identifies genes, polymorphisms and pathways involved in the fatty acids metabolism in sheep. PLoS ONE 2021, 16, e0260514. [Google Scholar] [CrossRef]
  34. Duan, J.; Wainwright, M.S.; Comeron, J.M.; Saitou, N.; Sanders, A.R.; Gelernter, J.; Gejman, P.V. Synonymous mutations in the human dopamine receptor D2 (DRD2) affect mRNA stability and synthesis of the receptor. Hum. Mol. Genet. 2003, 12, 205–216. [Google Scholar] [CrossRef] [PubMed]
  35. Kimchi-Sarfaty, C.; Oh, J.M.; Kim, I.-W.; Sauna, Z.E.; Calcagno, A.M.; Ambudkar, S.V.; Gottesman, M.M. A "Silent" Polymorphism in the MDR1 Gene Changes Substrate Specificity. Science 2007, 315, 525–528. [Google Scholar] [CrossRef] [PubMed] [Green Version]
  36. Pagani, F.; Raponi, M.; Baralle, F.E. Synonymous mutations in CFTR exon 12 affect splicing and are not neutral in evolution. Proc. Natl. Acad. Sci. USA 2005, 102, 6368–6372. [Google Scholar] [CrossRef] [PubMed] [Green Version]
  37. Goswami, A.M. α-Adducin nsSNPs affect mRNA secondary structure, protein modification and stability. Meta Gene 2018, 17, 153–162. [Google Scholar] [CrossRef]
  38. Soemedi, R.; Cygan, K.J.; Rhine, C.L.; Glidden, D.T.; Taggart, A.J.; Lin, C.-L.; Fredericks, A.M.; Fairbrother, W.G. The effects of structure on pre-mRNA processing and stability. Methods 2017, 125, 36–44. [Google Scholar] [CrossRef]
  39. Sauna, Z.E.; Kimchi-Sarfaty, C. Understanding the contribution of synonymous mutations to human disease. Nat. Rev. Genet. 2011, 12, 683–691. [Google Scholar] [CrossRef]
  40. Fung, K.L.; Pan, J.; Ohnuma, S.; Lund, P.E.; Pixley, J.N.; Kimchi-Sarfaty, C.; Ambudkar, S.V.; Gottesman, M.M. MDR1 synonymous polymorphisms alter transporter specificity and protein stability in a stable epithelial monolayer. Cancer Res. 2014, 74, 598–608. [Google Scholar] [CrossRef] [Green Version]
  41. Bevilacqua, P.C.; Ritchey, L.E.; Su, Z.; Assmann, S.M. Genome-Wide Analysis of RNA Secondary Structure. Annu. Rev. Genet. 2016, 50, 235–266. [Google Scholar] [CrossRef] [Green Version]
  42. Rose, J.; Kraft, T.; Brenner, B.; Montag, J. Hypertrophic cardiomyopathy MYH7 mutation R723G alters mRNA secondary structure. Physiol. Genom. 2020, 52, 15–19. [Google Scholar] [CrossRef]
  43. Warner, R.D.; Greenwood, P.L.; Pethick, D.W.; Ferguson, D.M. Genetic and environmental effects on meat quality. Meat Sci. 2010, 86, 171–183. [Google Scholar] [CrossRef] [PubMed] [Green Version]
  44. Huff Lonergan, E.; Zhang, W.; Lonergan, S.M. Biochemistry of postmortem muscle—Lessons on mechanisms of meat tenderization. Meat Sci. 2010, 86, 184–195. [Google Scholar] [CrossRef] [PubMed]
  45. Emori, Y.; Kawasaki, H.; Imajoh, S.; Minami, Y.; Suzuki, K. All four repeating domains of the endogenous inhibitor for calcium-dependent protease independently retain inhibitory activity. Expression of the cDNA fragments in Escherichia coli. J. Biol. Chem. 1988, 263, 2364–2370. [Google Scholar] [CrossRef] [PubMed]
  46. Fiego, D.P.L.; Santoro, P.; Macchioni, P.; De Leonibus, E. Influence of genetic type, live weight at slaughter and carcass fatness on fatty acid composition of subcutaneous adipose tissue of raw ham in the heavy pig. Meat Sci. 2005, 69, 107–114. [Google Scholar] [CrossRef] [PubMed]
  47. Pena, R.N.; Ros-Freixedes, R.; Tor, M.; Estany, J. Genetic Marker Discovery in Complex Traits: A Field Example on Fat Content and Composition in Pigs. Int. J. Mol. Sci. 2016, 17, 2100. [Google Scholar] [CrossRef] [PubMed] [Green Version]
  48. Inoue, K.; Shoji, N.; Honda, T.; Oyama, K. Genetic relationships between meat quality traits and fatty acid composition in Japanese black cattle. Anim. Sci. J. 2017, 88, 11–18. [Google Scholar] [CrossRef] [PubMed]
  49. Sellier, P.; Maignel, L.; Bidanel, J.P. Genetic parameters for tissue and fatty acid composition of backfat, perirenal fat and longissimus muscle in Large White and Landrace pigs. Animal 2010, 4, 497–504. [Google Scholar] [CrossRef]
Figure 1. Correlogram of the correlation analyses between any two traits of FA compositions and classes. The correlation matrix was reordered according to the correlation coefficient, aiming to make the clusters of correlated variables more evident. Positive correlations are displayed in red and negative correlations in blue color. The color intensity and size of circles are proportional to the size of the correlation coefficients.
Animals 13 00195 g001
Figure 2. CAST gene expression profiles in sheep. (a) Relative expression levels of the CAST gene in nine different tissues of Sonid sheep (n = 3). (b) Correlations between fatty acid composition and expression levels of CAST in the longissimus thoracis muscle of 90 Sonid sheep. (c) Correlations between fatty acid classes and expression levels of CAST in the longissimus thoracis muscle of 90 Sonid sheep. ** p < 0.01.
Animals 13 00195 g002
Figure 3. The physical locations of the four novel variants of the ovine CAST gene identified in this study are shown. The variant sites were according to chromosome 5 in Oar_rambouillet_v2.0 (GenBank accession: NM_001009788.1).
Animals 13 00195 g003
Figure 4. Alignment of the wild-type sequence in various species in the CAST amino acid. CAST multispecies alignment in the region of missense mutations. Using the Uniprot database, CAST amino acid sequences were obtained for each species.
Animals 13 00195 g004
Figure 5. Linkage disequilibrium estimated among CAST variations in Sonid sheep. 1: c.646G>C, 2: c.1210C>T, 3: c.1437G>A, 4: c.2097C>T.
Animals 13 00195 g005
Figure 6. Feature and structure prediction of the ovine CAST protein. (a) CAST protein hydrophilicity was analyzed using ProtScale. (b) CAST protein average flexibility index was analyzed using ProtScale. (c) CAST protein conservative domains were predicted with SMART.
Animals 13 00195 g006
Figure 7. Amino acid sequence analysis of ovine CAST and its multiple sequence alignments. (a) CAST protein transmembrane helices were predicted. (b) CAST protein N-glycosylation sites were predicted. (c) CAST protein phosphorylation sites were predicted. (d) A phylogenetic tree was constructed based on CAST homology amino acid sequences.
Animals 13 00195 g007
Figure 8. The minimum free energy (MFE) of secondary structure in exons 19 and 26 of the CAST gene. MFE prediction in terms of the secondary structure and free energy. (a) The secondary structure for the wild-type mRNA sequence of exon 19 with the G allele at the c.1437G>A site and the secondary structure for the mRNA sequence of exon 19 with the A allele at the c.1437G>A site. (b) The secondary structure for the wild-type mRNA sequence of exon 26 with the C allele at the c.2097C>T site and the secondary structure for the mRNA sequence of exon 26 with the T allele at the c.2097C>T site. The structure above is colored according to base-pairing probabilities.
Animals 13 00195 g008
Figure 9. Secondary and tertiary structural changes of the ovine CAST protein. (a) Wild-type ovine CAST coding protein secondary structure. (b) The protein’s secondary structure changes when glycine changes to arginine at the c.646G>C (G216R) locus. (c) The protein’s secondary structure changes when arginine changes to cysteine at the c.1210C>T (R404C) locus. The long blue vertical line represents the alpha helix. The red line represents the extended strand. The short green line represents the beta turn. The purple line represents the random coil. The black arrow indicates where the secondary structure changes. (d) The prediction of ovine CAST tertiary structures. It was predicted that the amino acid change at the G216R (c.646G>C) site would cause visible changes in the CAST structure.
Animals 13 00195 g009
Table 1. The primers of GAPDH and CAST genes for real-time PCR.
GenePrimer Sequences (5′-3′)Product Length (bp)Annealing Temperature (°C)Accession Number
GAPDHF: AATACTGAGATGTCCTTC14053.8NM_001190390.1
R: TTTATGGTGGTTGATTTC
CASTF: ATCCAGAAGACGGAAAGCCT14461.3NM_001009788.1
R: GCAGTGGTTTTCCGTCTTTATCCTT
Note: F: forward primer; R: reverse primer.
Table 2. Primer sequence information of the variant locus of the CAST gene.
PolymorphismPrimers (5′-3′)Tm (°C)
c.646G>C (G216R)F: ACGTTGGATGCTTGCCTTCTCAGCATCATC52.2
R: ACGTTGGATGTAAACTCACCGAGGAGTCTG
E: GAGGCCCTGCGATCC
c.1210C>T (R404C)F: ACGTTGGATGGTTGTGTCTGCTGCTTTCTG70.4
R: ACGTTGGATGTGACTGCACAGAACACATGG
E: CCGGCATCCCCGGCCGCTGCCCC
c.1437G>A (479T)F: ACGTTGGATGAGCCAAAGAAGAGGATCGTG45.3
R: ACGTTGGATGCCTTGGCCTCTTCTAATCTG
E: ATCTGTAATCAGGAGGAAT
c.2097C>T (699G)F: ACGTTGGATGAAGACAAGAAGCCTGCTTCC52.0
R: ACGTTGGATGGACACAACCGAGCTTTGAAC
E: GTGGAATCCTTTGCTTTCCC
Note: F: forward primer sequence; R: reverse primer sequence; E: extended primer sequence.
Table 3. Associations of CAST variants with fatty acid composition in the longissimus thoracis muscle of Sonid sheep.
Fatty Acid Compositionc.1210C>T (R404C)c.1437G>A in LD-Mc.2097C>T
GenotypeGenotypeGenotype
CC (253)CT (114)TT (11)GG (288)GA (84)CC (287)CT (89)
C10:00.31 ± 0.010.34 ± 0.020.35 ± 0.050.31 ± 0.01 a0.36 ± 0.02 b0.31 ± 0.01 a0.37 ± 0.02 b
C12:00.44 ± 0.02 a0.59 ± 0.07 b0.52 ± 0.16 ab0.47 ± 0.030.56 ± 0.080.47 ± 0.030.57 ± 0.07
C14:01.56 ± 0.04 A1.36 ± 0.05 B1.32 ± 0.15 AB1.56 ± 0.04 A1.30 ± 0.06 B1.51 ± 0.041.44 ± 0.06
C18:09.24 ± 0.13 a8.64 ± 0.18 b8.95 ± 0.58 ab9.24 ± 0.12 A8.50 ± 0.21 B9.12 ± 0.128.84 ± 0.22
SFA36.12 ± 0.3534.79 ± 0.4336.84 ± 1.4136.22 ± 0.32 a34.45 ± 0.50 b35.91 ± 0.3035.04 ± 0.59
C18:1n9t1.71 ± 0.142.17 ± 0.221.80 ± 0.061.71 ± 0.12 a2.30 ± 0.27 b1.76 ± 0.122.28 ± 0.34
C18:1n9c16.19 ± 0.28 a14.96 ± 0.40 b16.09 ± 0.94 ab16.14 ± 0.27 a14.77 ± 0.42 b15.99 ± 0.2615.29 ± 0.46
C18:3n31.76 ± 0.04 a1.55 ± 0.08 b1.51 ± 0.24 ab1.74 ± 0.041.53 ± 0.091.75 ± 0.04 a1.53 ± 0.08 b
n-65.45 ± 0.09 A5.47 ± 0.14 AB6.44 ± 0.40 B5.43 ± 0.085.61 ± 0.185.43 ± 0.085.69 ± 0.18
n-32.76 ± 0.06 A2.51 ± 0.09 B2.36 ± 0.30 B2.73 ± 0.06 A2.50 ± 0.10 B2.76 ± 0.06 a2.42 ± 0.09 b
n-6/n-31.97 ± 0.23 A2.18 ± 0.59 B2.73 ± 1.22 B1.99 ± 0.24 A2.24 ± 0.71 B1.97 ± 0.28 A2.35 ± 0.56 B
Note: Values are shown as the means ± standard error. Values with different superscripts within the same column differ significantly at p < 0.05 (a, b), p < 0.01 (A, B) after Bonferroni correction.
Table 4. Main haplotypes and their frequencies of CAST in Sonid sheep.
Haplotypec.646G>Cc.1210C>Tc.1437G>Ac.2097C>TFrequency
H1 (604)GCGC0.798
H2 (77)CTAT0.101
H3 (40)GTGC0.053
Table 5. Associations between haplotypes of CAST and fatty acid composition in the longissimus thoracis muscle of Sonid sheep.
Fatty Acid CompositionGenotype of Combination (Number)
H1H1 (238)H1H2 (64)H1H3 (35)
(GGCCGGCC)(GCCTGACT)(GGCTGGCC)
C12:00.44 ± 0.02 a0.59 ± 0.09 ab0.69 ± 0.15 b
C21:00.54 ± 0.03 A0.52 ± 0.06 a1.2 ± 0.52 Bb
C18:3n31.77 ± 0.05 a1.52 ± 0.11 b1.59 ± 0.14 ab
n-32.78 ± 0.06 A2.44 ± 0.11 B2.51 ± 0.17 AB
n-6/n-31.96 ± 0.24 a2.28 ± 0.73 b2.12 ± 0.96 b
Note: Values are shown as the means ± standard error. Values with different superscripts within the same column differ significantly at p < 0.05 (a, b), p < 0.01 (A, B) after Bonferroni correction.
Disclaimer/Publisher’s Note: The statements, opinions and data contained in all publications are solely those of the individual author(s) and contributor(s) and not of MDPI and/or the editor(s). MDPI and/or the editor(s) disclaim responsibility for any injury to people or property resulting from any ideas, methods, instructions or products referred to in the content.

