
Multi-Trait Single-Step Genomic Prediction for Milk Yield and Milk Components for Polish Holstein Population
 , , , , , and
Abstract
:Simple Summary
Abstract
1. Introduction
2. Materials and Methods
2.1. Materials
2.2. Methods
2.2.1. Quality Control and Data Preparation
2.2.2. Data Analysis
2.2.3. Single-Trait and Multi-Trait Genomic Prediction Models
3. Results
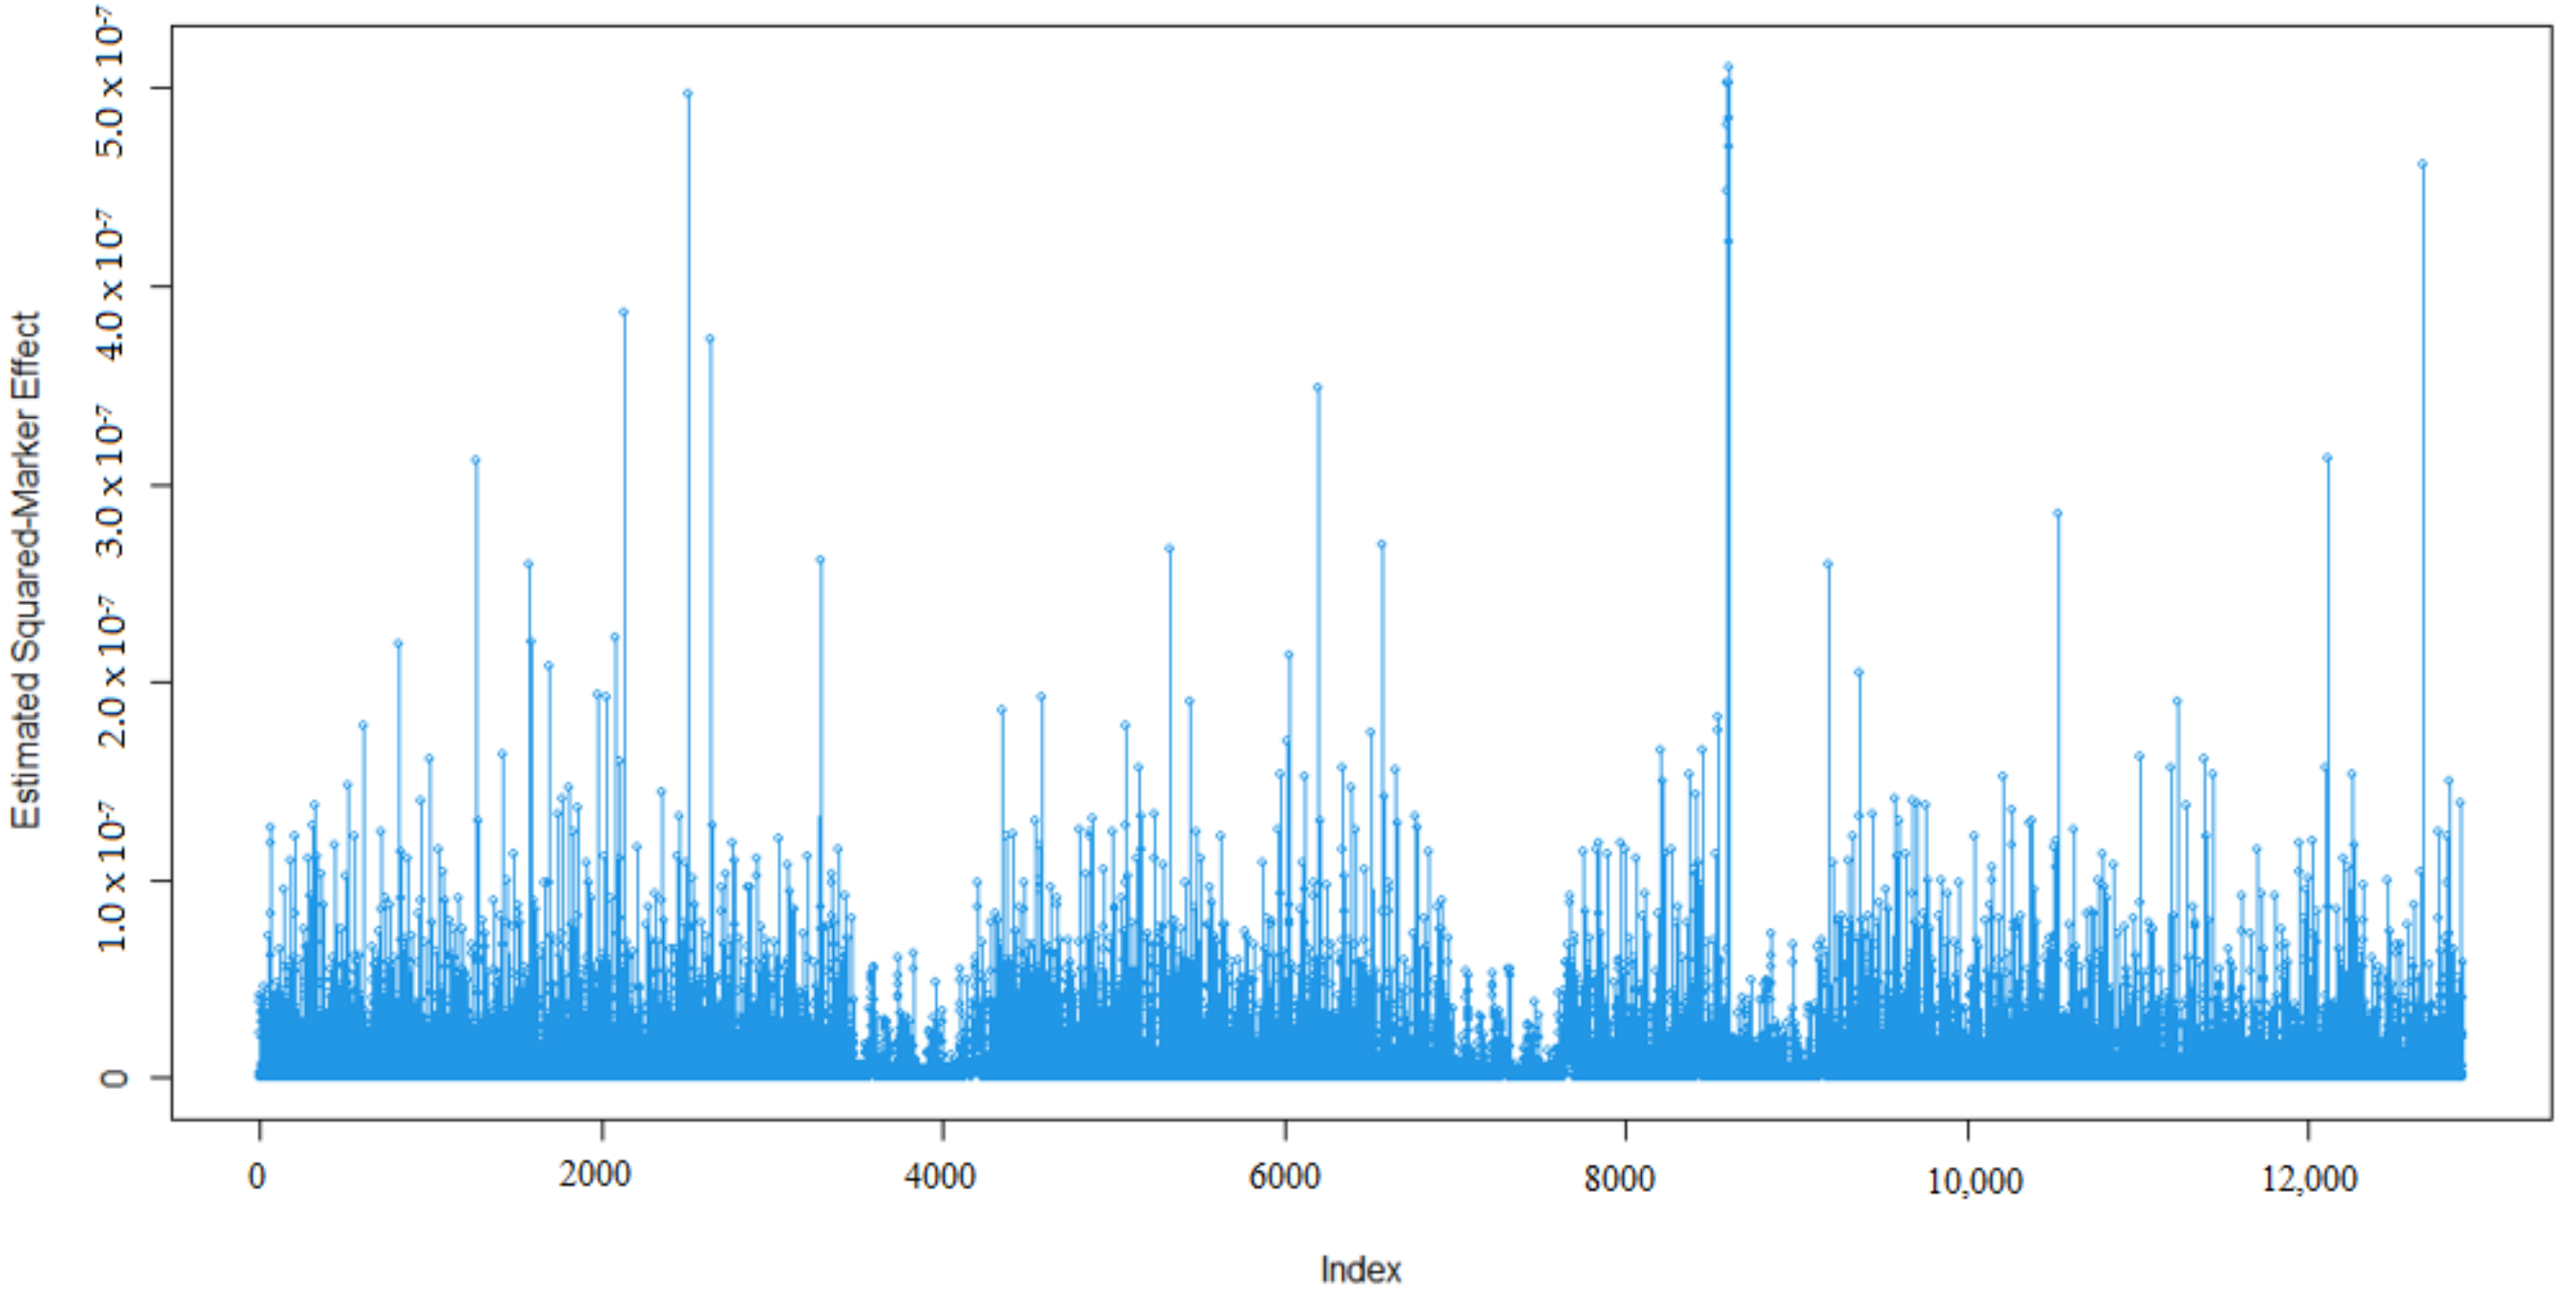
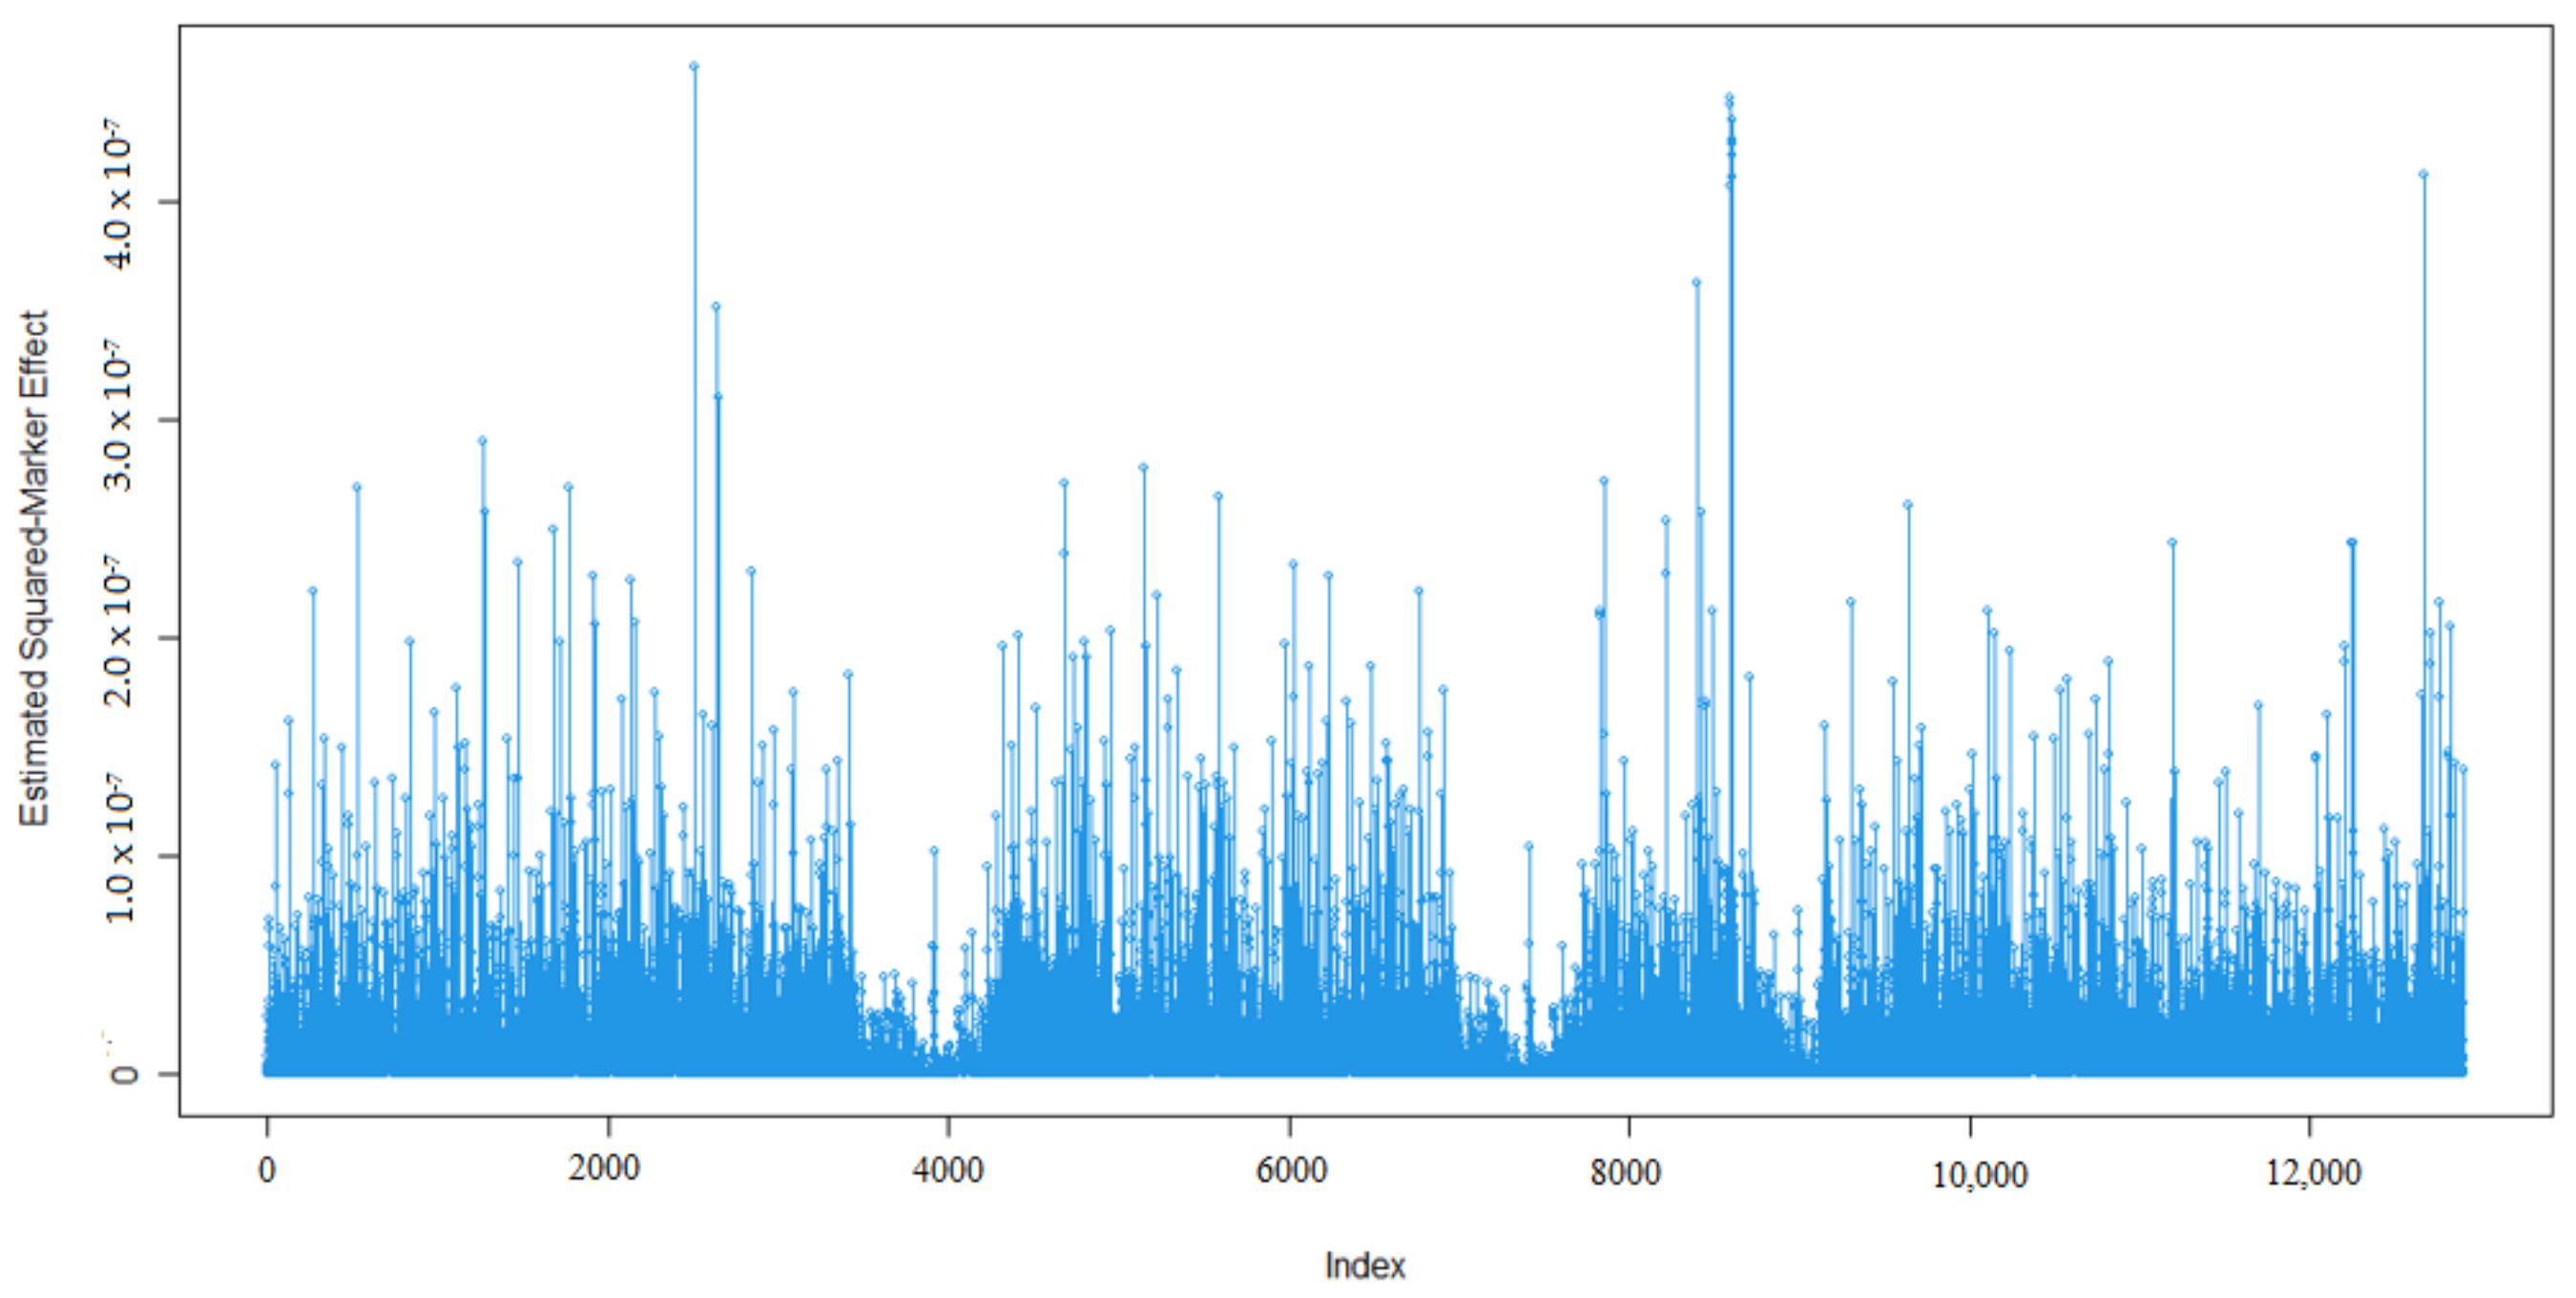
3.1. Marker Effects
3.2. Accuracy
3.3. Genetic Parameters
4. Discussion
5. Conclusions
Author Contributions
Funding
Institutional Review Board Statement
Informed Consent Statement
Data Availability Statement
Conflicts of Interest
References
- Olfaz, M.; Tırınk, C.; Önder, H. Use of CART and CHAID algorithms in Karayaka sheep breeding. Kafkas Univ. Vet. Fak. Derg. 2019, 25, 105–110. [Google Scholar] [CrossRef]
- Goddard, M.E.; Hayes, B.J. Genomic selection. J. Anim. Breed. Genet. 2007, 124, 323–330. [Google Scholar]
- Weller, J.I.; Ezra, E.; Ron, M. Invited review: A perspective on the future of genomic selection in dairy cattle. J. Dairy Sci. 2017, 100, 8633–8644. [Google Scholar] [CrossRef]
- Meuwissen, T.H.E.; Hayes, B.J.; Goddard, M.E. Prediction of total genetic value using genome-wide dense marker maps. Genetics 2001, 157, 1819–1829. [Google Scholar]
- De Koning, D.J. Meuwissen et al. on genomic selection. Genetics 2016, 203, 5–7. [Google Scholar] [CrossRef] [PubMed]
- Ding, X.; Zhang, Z.; Li, X.; Wang, S.; Wu, X.; Sun, D.; Yu, Y.; Liu, J.; Wang, Y.; Zhang, Y.; et al. Accuracy of genomic prediction for milk production traits in the Chinese Holstein population using a reference population consisting of cows. J. Dairy Sci. 2013, 96, 5315–5323. [Google Scholar] [CrossRef]
- Abacı, S.H.; Önder, H. Comparison of BLUP and Bayesian methods for different sizes of training population in genomic selection. Turk J. Vet. Anim. Sci. 2020, 44, 994–1002. [Google Scholar] [CrossRef]
- Taylor, J.F.; Taylor, K.H.; Decker, J.E. Holsteins are the genomic selection poster cows. Proc. Natl. Acad. Sci. USA 2016, 113, 7690–7692. [Google Scholar] [CrossRef]
- VanRaden, P.M. Symposium review: How to implement genomic selection. J. Dairy Sci. 2020, 103, 5291–5301. [Google Scholar] [CrossRef]
- Obšteter, J.; Jenko, J.; Gorjanc, G. Genomic selection for any dairy breeding program via optimized investment in phenotyping and genotyping. Front. Genet. 2021, 12, 637017. [Google Scholar] [CrossRef]
- Guinan, F.L.; Wiggans, G.R.; Norman, H.D.; Dürr, J.W.; Cole, J.B.; Van Tassell, C.P.; Misztal, I.; Lourenco, D. Changes in genetic trends in US dairy cattle since the implementation of genomic selection. J. Dairy Sci. 2023, 106, 1110–1129. [Google Scholar] [CrossRef]
- Lee, Y.M.; Dang, C.G.; Alam, M.Z.; Kim, Y.S.; Cho, K.H.; Park, K.D.; Kim, J.J. The effectiveness of genomic selection for milk production traits of Holstein dairy cattle. Asian-Australas. J. Anim. Sci. 2020, 33, 382–389. [Google Scholar] [CrossRef]
- Kudinov, A.A.; Mäntysaari, E.A.; Pitkänen, T.J.; Saksa, E.I.; Aamand, G.P.; Uimari, P.; Strandén, I. Single-step genomic evaluation of Russian dairy cattle using internal and external information. Anim. Breed. Genet. 2021, 2021, 259–270. [Google Scholar] [CrossRef]
- Ceserani, A.; Biffani, S.; Garcia, A.; Lourenco, D.; Bertolini, G.; Neglia, G.; Misztal, I.; Macciotta, N.P.P. Genomic inves-tigation of milk production in Italian buffalo. Ital. J. Anim. Sci. 2021, 20, 539–547. [Google Scholar] [CrossRef]
- Mancin, E.; Tuliozi, B.; Sartori, C.; Guzzo, N.; Mantovani, R. Genomic prediction in local breeds: The Rendena cattle as a case study. Animals 2021, 11, 1815. [Google Scholar] [CrossRef]
- Jia, Y.; Jannink, J.L. Multiple-trait genomic selection methods increase genetic value prediction accuracy. Genetics 2012, 192, 1513–1522. [Google Scholar] [CrossRef]
- Guo, G.; Zhao, F.; Wang, Y.; Zhang, Y.; Du, L. Comparison of single-trait and multiple-trait genomic prediction models. BMC Genet. 2014, 15, 30. [Google Scholar] [CrossRef]
- Karaman, E.; Lund, M.S.; Anche, M.T.; Janss, L.; Su, G. Genomic prediction using multi-trait weighted GBLUP accounting for heterogeneous variances and covariances across the genome. Genes Genomes Genet. 2018, 8, 3549–3558. [Google Scholar] [CrossRef]
- Shahi, D.; Guo, J.; Pradhan, S.; Khan, J.; Avci, M.; Khan, N.; McBreen, J.; Bai, G.; Reynolds, M.; Foulkes, J.; et al. Multi-trait genomic prediction using in-season physiological parameters increases prediction accuracy of complex traits in US wheat. BMC Genom. 2022, 23, 298. [Google Scholar] [CrossRef]
- Tiezzi, F.; Maltecca, C. Accounting for trait architecture in genomic predictions of us holstein cattle using a weighted realized relationship matrix. Genet. Sel. Evol. 2015, 47, 24. [Google Scholar] [CrossRef]
- Kolenda, M.; Sitkowska, B.; Kamola, D.; Lambert, B.D. Composite genotypes of progestogen-associated endometrial protein gene and their association with composition and quality of dairy cattle milk. Anim. Biosci. 2021, 34, 1283–1289. [Google Scholar] [CrossRef]
- Gaire, R.; de Arruda, M.P.; Mohammadi, M.; Brown-Guedira, G.; Kolb, F.L.; Rutkoski, J. Multi-trait genomic selection can increase selection accuracy for deoxynivalenol accumulation resulting from fusarium head blight in wheat. Plant Genome 2021, 15, e20188. [Google Scholar] [CrossRef]
- Luan, T.; Nordbø, Ø.; Andersen-Ranberg, I.; Meuwissen, T.H.E. Multi-trait genomic prediction in pigs using single and multistep methods based on the absorption of ungenotyped animals. Anim. Breed. Genet. 2023, 140, 473–484. [Google Scholar] [CrossRef]
- Mehrban, H.; Naserkheil, M.; Lee, D.; Ibáñez-Escriche, N. Multi-trait single-step GBLUP improves accuracy of genomic prediction for carcass traits using yearling weight and ultrasound traits in Hanwoo. Front. Genet. 2021, 12, 692356. [Google Scholar] [CrossRef]
- Sandhu, K.S.; Patil, S.S.; Aoun, M.; Carter, A.H. Multi-trait multi-environment genomic prediction for end-use quality traits in winter wheat. Front. Genet. 2022, 13, 831020. [Google Scholar] [CrossRef]
- Bhatta, M.; Gutierrez, L.; Cammarota, L.; Cardozo, F.; Germán, S.; Gómez-Guerrero, B.; Fernanda Pardo, M.; Lanaro, V.; Sayas, M.; Castro, A.J. Multi-trait genomic prediction model increased the predictive ability for agronomic and malting quality traits in barley (Hordeum vulgare L.). Genes Genomes Genet. 2020, 10, 1113–1124. [Google Scholar] [CrossRef]
- Guo, J.; Khan, J.; Pradhan, S.; Shahi, D.; Khan, N.; Avci, M.; Mcbreen, J.; Harrison, S.; Brown-Guedira, G.; Murphy, J.P.; et al. Multi-trait genomic prediction of yield-related traits in US soft wheat under variable water regimes. Genes 2020, 11, 1270. [Google Scholar] [CrossRef]
- Cheng, H.; Kizilkaya, K.; Zeng, J.; Garrick, D.; Fernando, R. Genomic prediction from multiple-trait bayesian regression methods using mixture priors. Genetics 2018, 209, 89–103. [Google Scholar] [CrossRef]
- Makgahlela, M.L.; Mantysaari, E.A.; Stranden, I.; Koivula, M.; Nielsen, U.S.; Sillanpaa, M.J.; Juga, J. Across breed multi-trait random regression genomic predictions in the Nordic Red dairy cattle. J. Anim. Breed. Genet. 2013, 130, 10–19. [Google Scholar] [CrossRef]
- Colombani, C.; Croiseau, P.; Fritz, S.; Guillaume, F.; Legarra, A.; Durocq, V.; Robert-Granié, C. A comparison of partial least squares (PLS) and sparse PLS regressions in genomic selection in French dairy cattle. J. Dairy Sci. 2012, 95, 2120–2131. [Google Scholar] [CrossRef]
- Kemper, K.E.; Bowman, P.J.; Hayes, B.J.; Visscher, P.M.; Goddard, M.E. A multi-trait Bayesian method for mapping QTL and genomic prediction. Genet. Sel. Eval. 2018, 50, 10. [Google Scholar] [CrossRef]
- Manzanilla-Pech, C.I.V.; Gordo, D.; Difford, G.F.; Løvendahl, P.; Lassen, J. Multitrait genomic prediction of methane emissions in Danish Holstein cattle. J. Dairy Sci. 2020, 103, 9195–9206. [Google Scholar] [CrossRef]
- Calus, M.P.L.; Veerkamp, R.F. Accuracy of multi-trait genomic selection using different methods. Genet. Sel. Eval. 2011, 43, 26. [Google Scholar] [CrossRef]
- Aspilcueta-Borquis, R.R.; Araujo Neto, F.F.; Santos, D.J.A.; Hurtado-Lugo, N.A.; Silva, J.A.V.; Tonhati, H. Multiple-trait genomic evaluation for milk yield and milk quality traits using genomic and phenotypic data in buffalo in Brazil. Genet. Mol. Res. 2015, 14, 18009–18017. [Google Scholar] [CrossRef]
- Antanaitis, R.; Juozaitiene, V.; Jonike, V.; Cukauskas, V.; Urbšiene, D.; Urbšys, A.; Baumgartner, W.; Paulauskas, A. Relationship between Temperament and Stage of Lactation, Productivity and Milk Composition of Dairy Cows. Animals 2021, 11, 1840. [Google Scholar] [CrossRef]
- Liu, L.; Zhou, J.; Chen, C.J.; Zhang, J.; Wen, W.; Tian, J.; Zhang, Z.; Gu, Y. GWAS-Based Identification of New Loci for Milk Yield, Fat, and Protein in Holstein Cattle. Animals 2020, 10, 2048. [Google Scholar] [CrossRef]
- Dadpasand, M.; Zamiri, M.J.; Atashi, H. Genetic correlation of average somatic cell score at different stages of lactation with milk yield and composition in Holstein cows. Iran. J. Vet. Res. 2013, 14, 190–196. [Google Scholar]


| MF | MP | ML | MDM | |
|---|---|---|---|---|
| MY | −0.155 | −0.142 | 0.008 | −0.150 |
| MF | 0.201 | 0.015 | 0.603 ** | |
| MP | 0.015 | 0.309 * | ||
| ML | 0.072 |
| MT | ST | Accuracy Differences (MT-ST) | |||
|---|---|---|---|---|---|
| r | b | r | b | ||
| MY | 0.854 | 1.456 | 0.849 | 1.431 | 0.005 |
| MF | 0.880 | 1.578 | 0.870 | 1.499 | 0.010 |
| MP | 0.869 | 1.356 | 0.866 | 1.402 | 0.003 |
| ML | 0.770 | 1.102 | 0.773 | 1.127 | −0.003 |
| MDM | 0.882 | 1.620 | 0.876 | 1.532 | 0.006 |
| MY | MF | MP | ML | MDM | |
|---|---|---|---|---|---|
| MY | 0.2424 ± 0.002 | −0.374 * | −0.270 | −0.005 | −0.362 * |
| MF | −0.104 | 0.2223 ± 0.0002 | 0.582 * | −0.021 | 0.942 ** |
| MP | −0.092 | 0.132 | 0.3029 ± 0.003 | −0.015 | 0.780 ** |
| ML | 0.001 | 0.017 | 0.021 | 0.2171 ± 0.002 | 0.141 |
| MDM | −0.080 | 0.499 * | 0.218 | 0.041 | 0.2437 ± 0.0002 |
Disclaimer/Publisher’s Note: The statements, opinions and data contained in all publications are solely those of the individual author(s) and contributor(s) and not of MDPI and/or the editor(s). MDPI and/or the editor(s) disclaim responsibility for any injury to people or property resulting from any ideas, methods, instructions or products referred to in the content. |
© 2023 by the authors. Licensee MDPI, Basel, Switzerland. This article is an open access article distributed under the terms and conditions of the Creative Commons Attribution (CC BY) license (https://creativecommons.org/licenses/by/4.0/).
Share and Cite
Önder, H.; Sitskowska, B.; Kurnaz, B.; Piwczyński, D.; Kolenda, M.; Şen, U.; Tırınk, C.; Çanga Boğa, D. Multi-Trait Single-Step Genomic Prediction for Milk Yield and Milk Components for Polish Holstein Population. Animals 2023, 13, 3070. https://doi.org/10.3390/ani13193070
Önder H, Sitskowska B, Kurnaz B, Piwczyński D, Kolenda M, Şen U, Tırınk C, Çanga Boğa D. Multi-Trait Single-Step Genomic Prediction for Milk Yield and Milk Components for Polish Holstein Population. Animals. 2023; 13(19):3070. https://doi.org/10.3390/ani13193070
Chicago/Turabian StyleÖnder, Hasan, Beata Sitskowska, Burcu Kurnaz, Dariusz Piwczyński, Magdalena Kolenda, Uğur Şen, Cem Tırınk, and Demet Çanga Boğa. 2023. "Multi-Trait Single-Step Genomic Prediction for Milk Yield and Milk Components for Polish Holstein Population" Animals 13, no. 19: 3070. https://doi.org/10.3390/ani13193070