
Global Terrapin Character-Based DNA Barcodes: Assessment of the Mitochondrial COI Gene and Conservation Status Revealed a Putative Cryptic Species

Abstract
:Simple Summary
Abstract
1. Introduction
2. Materials and Methods
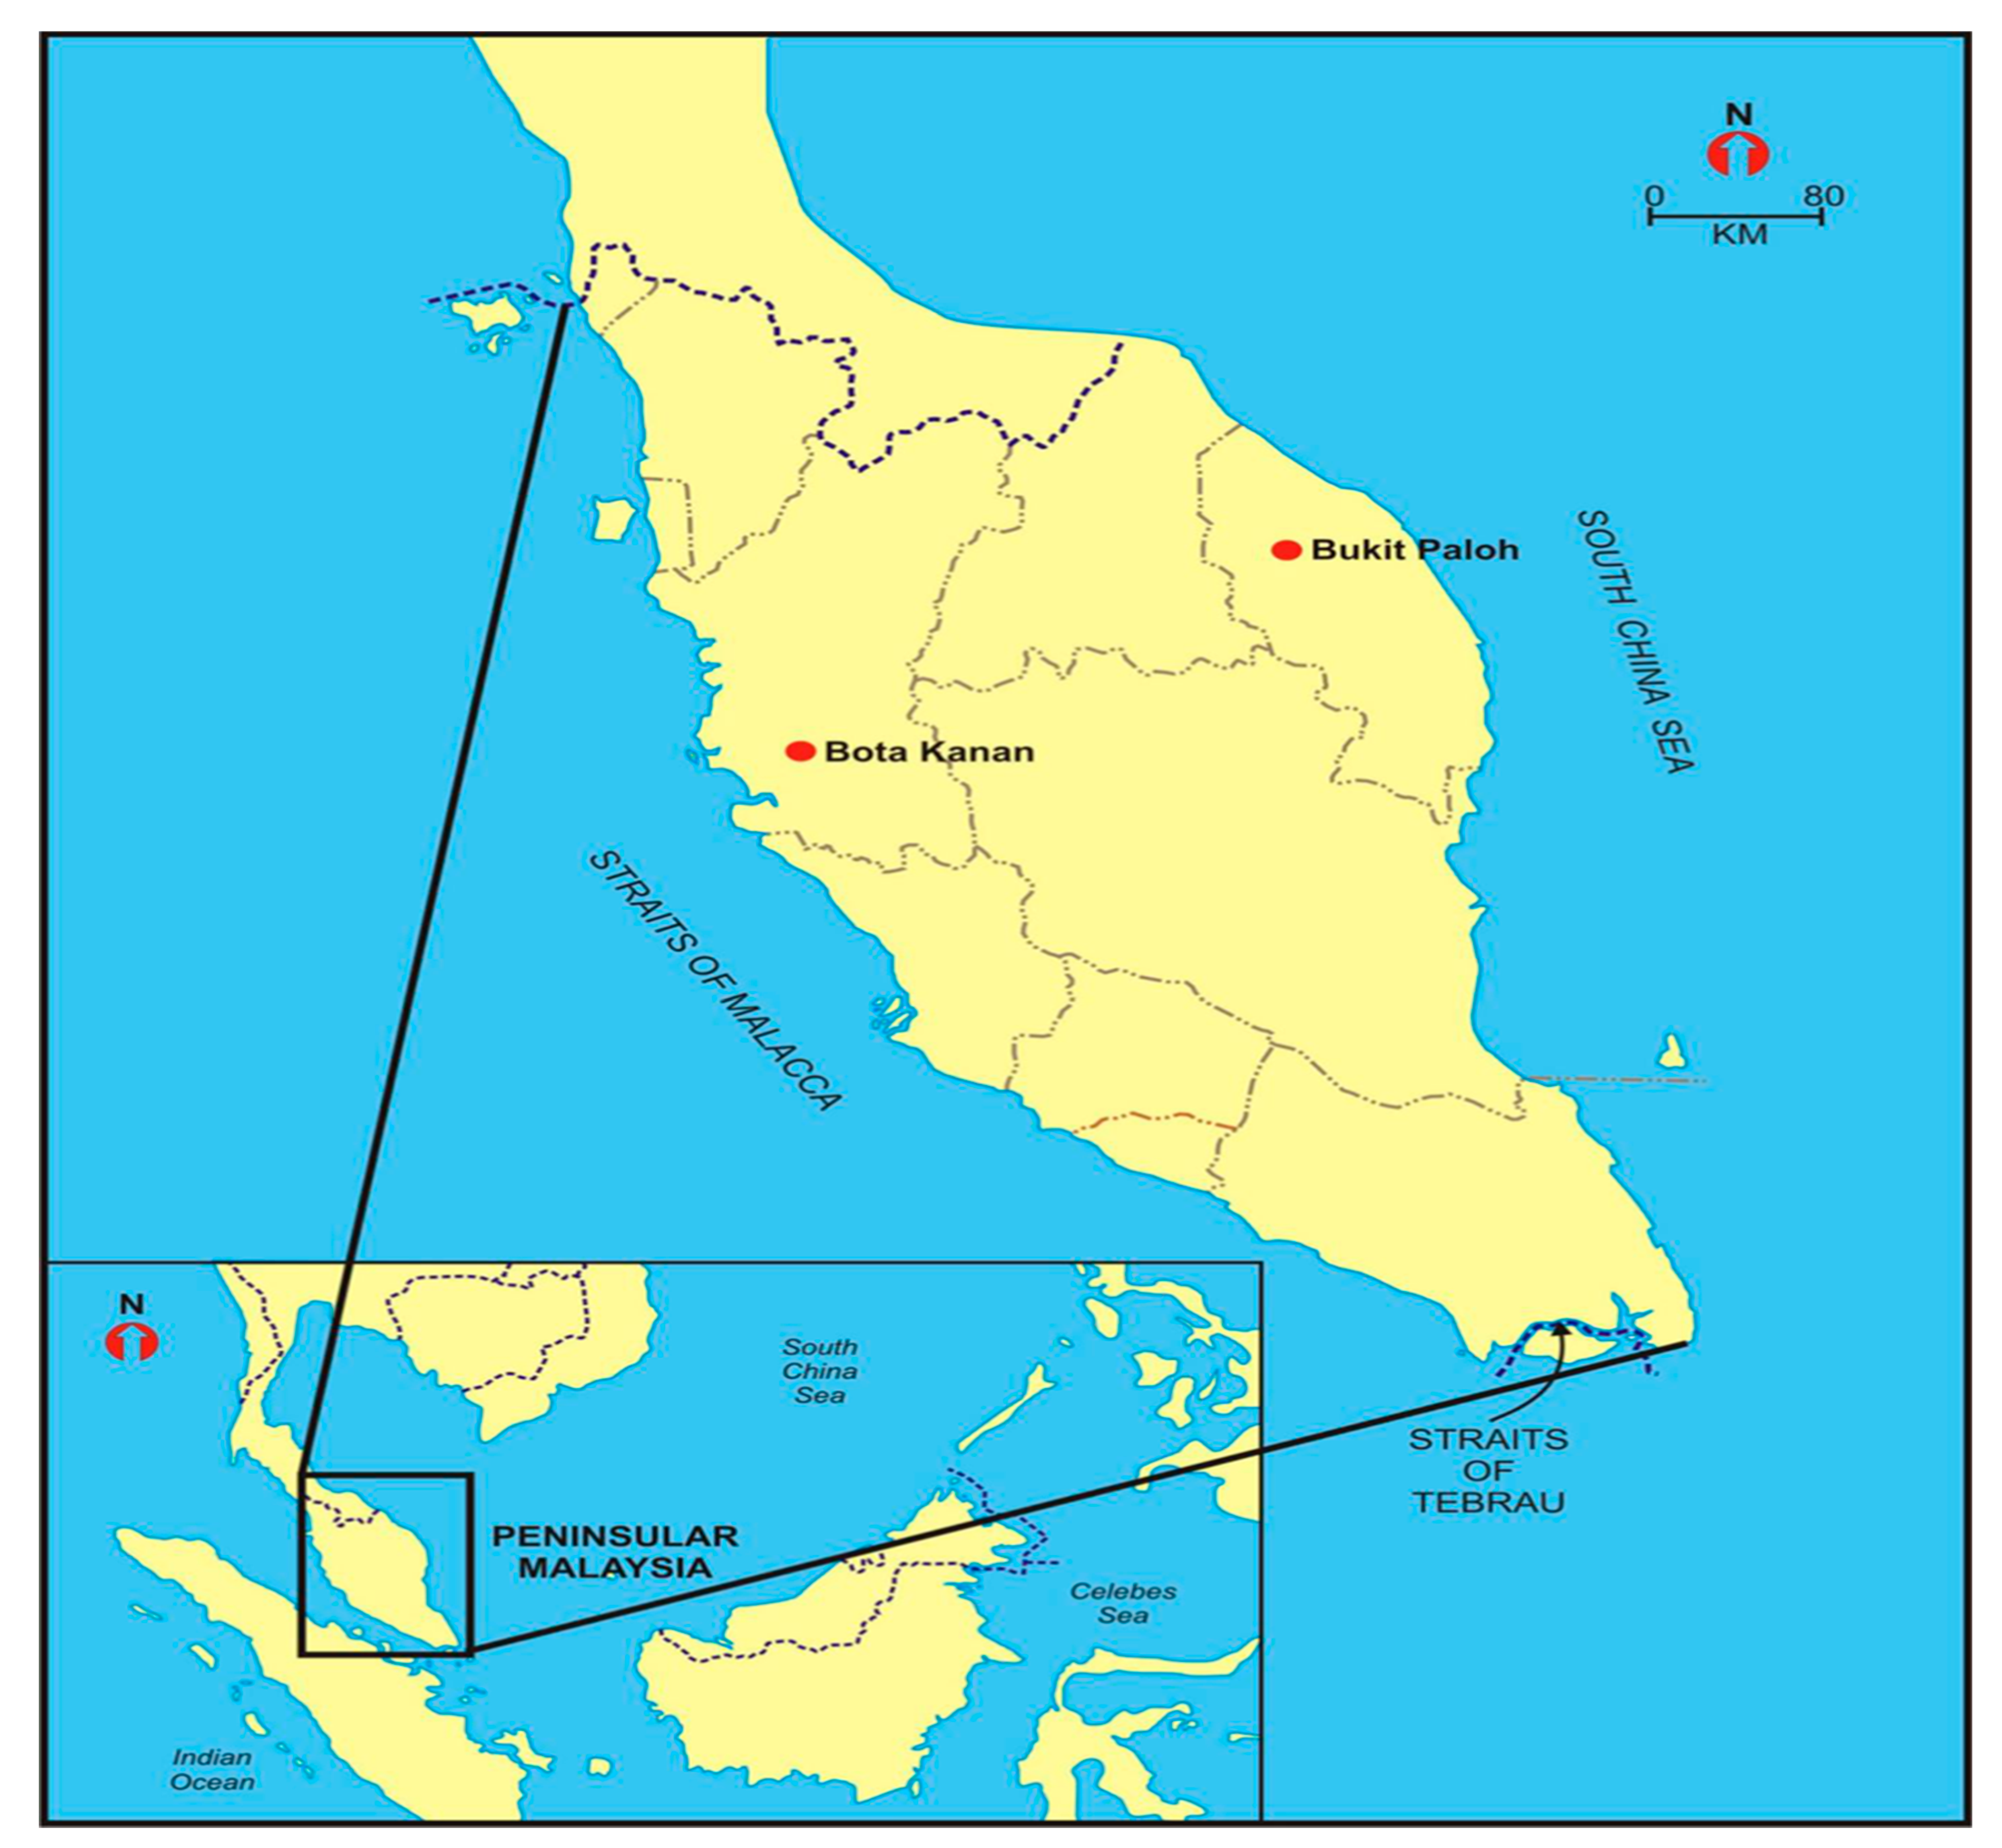
2.1. Study Sites
2.2. DNA Isolation, PCR, and Sequencing
2.3. DNA Barcode Sequence Quality Control Measures and Analysis
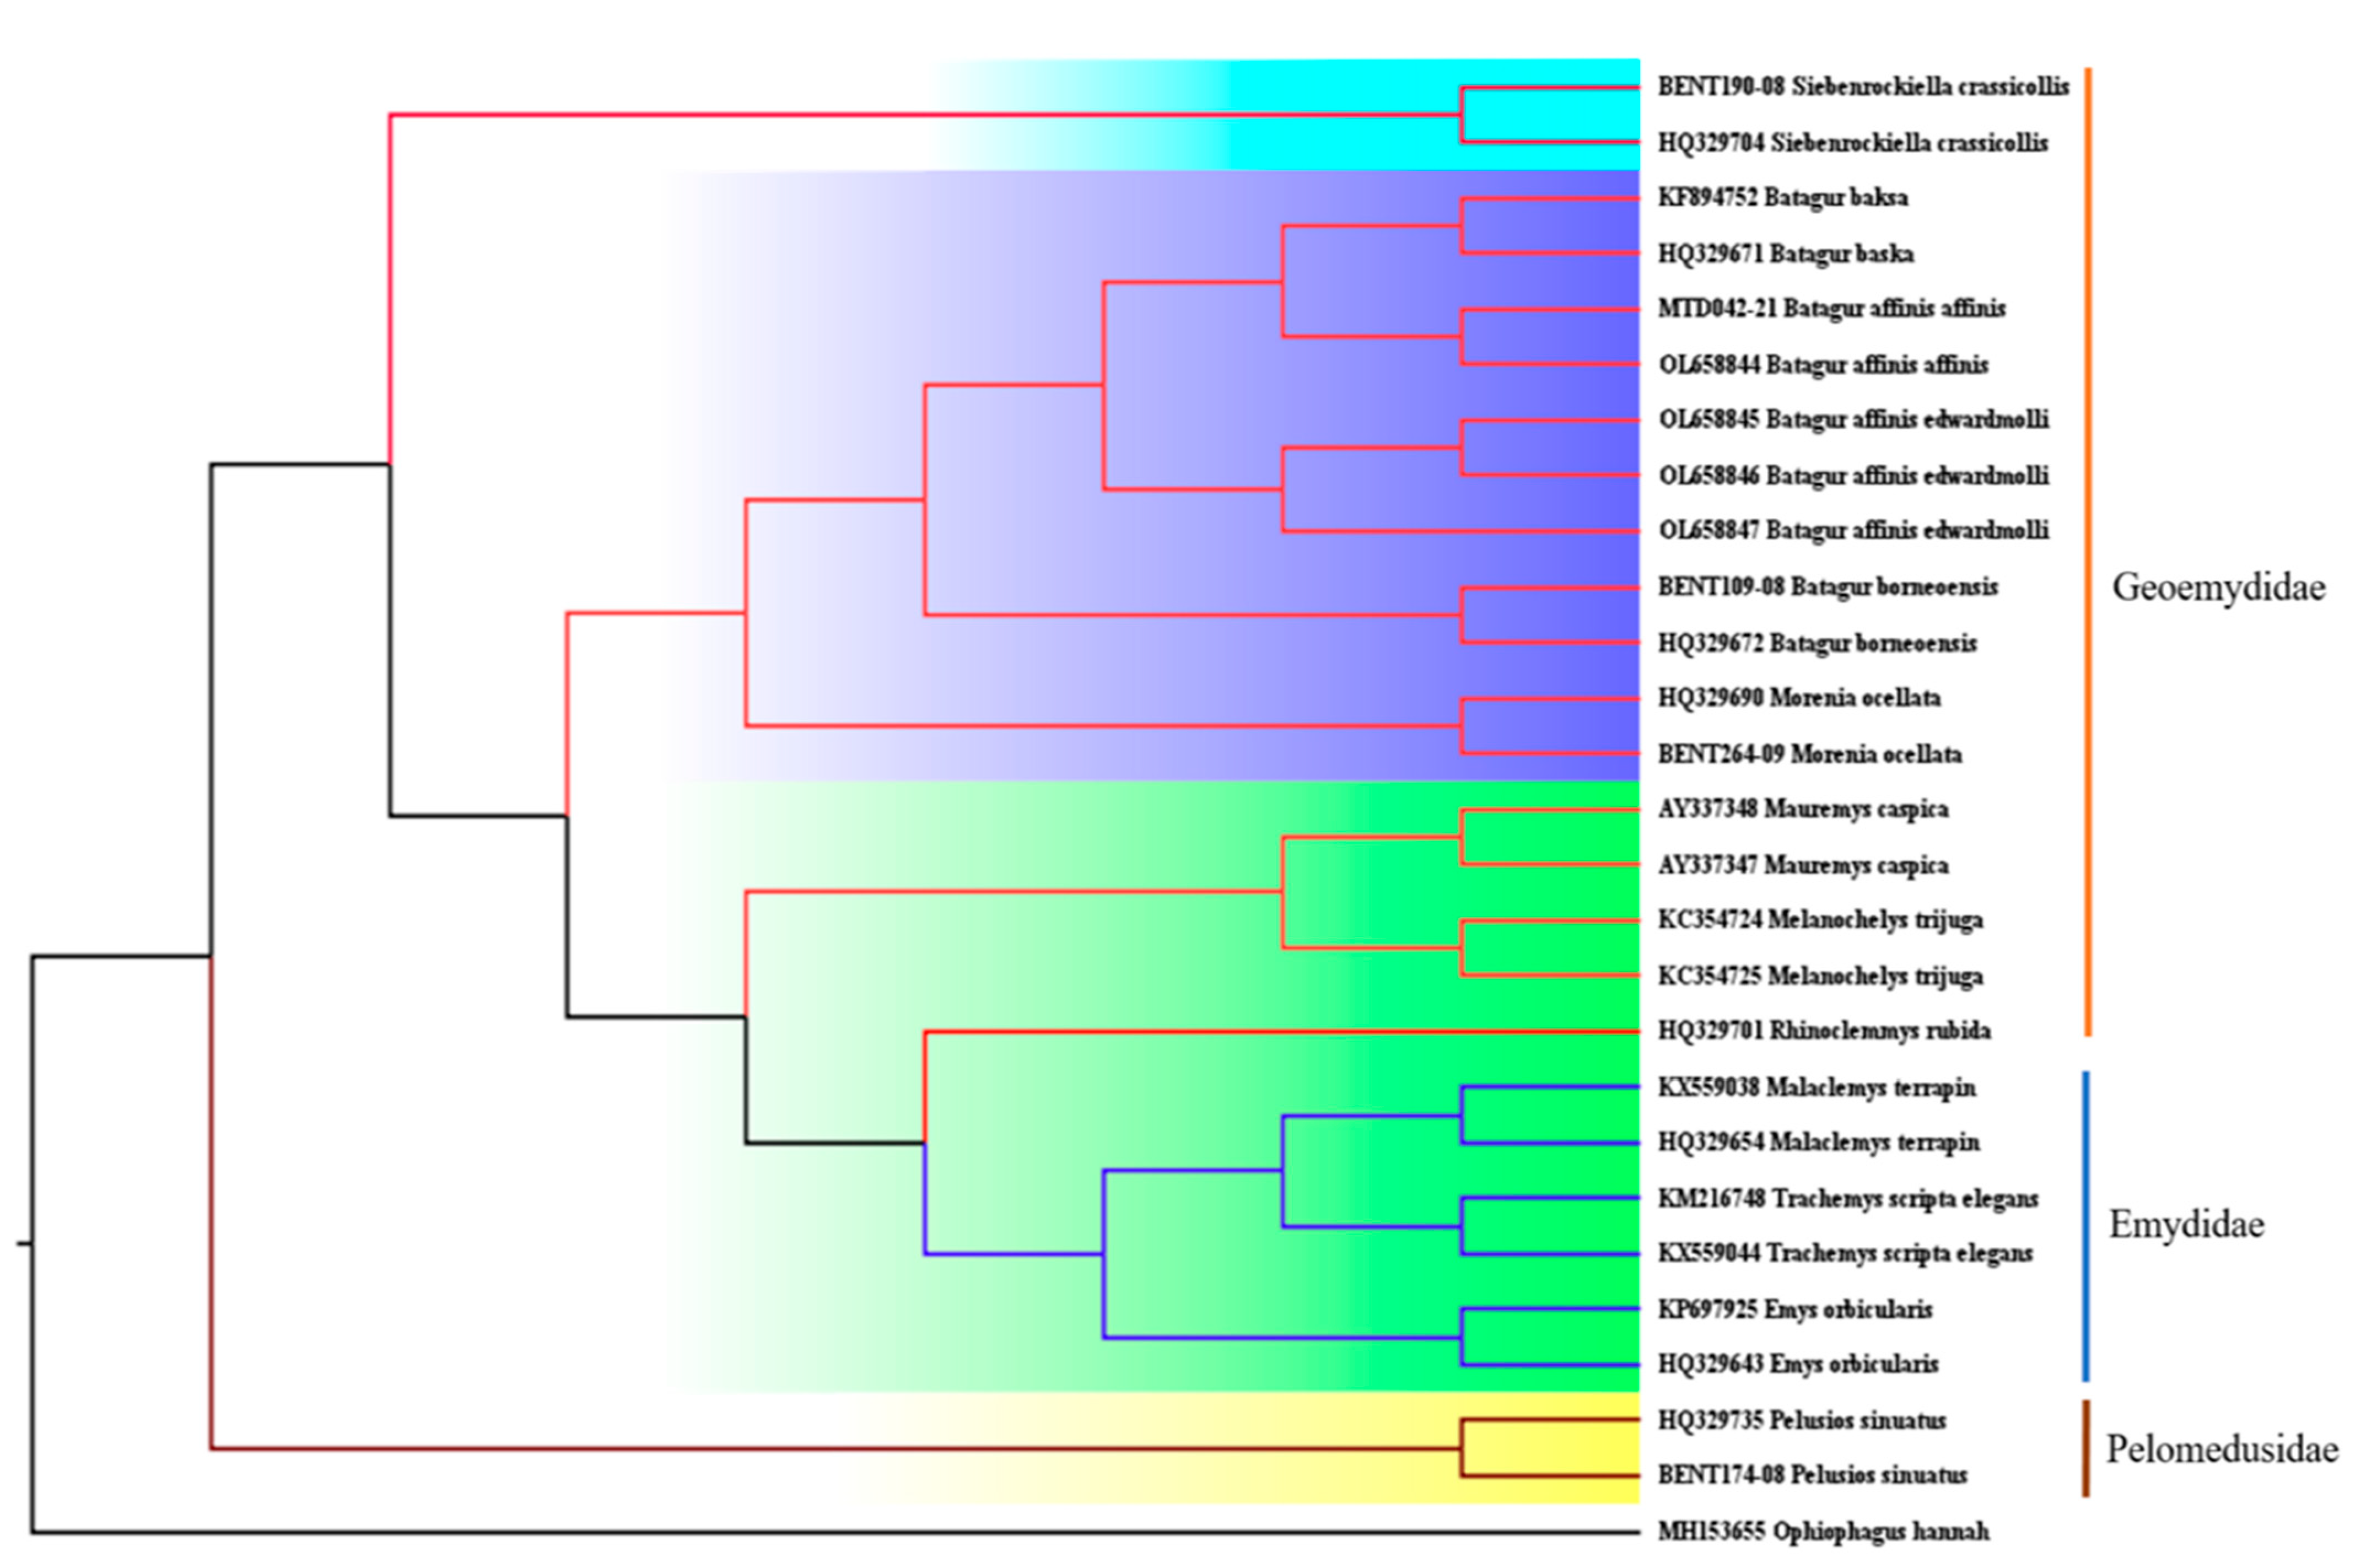
2.4. Analyses of Molecular Phylogenetics and Divergence Times
3. Results
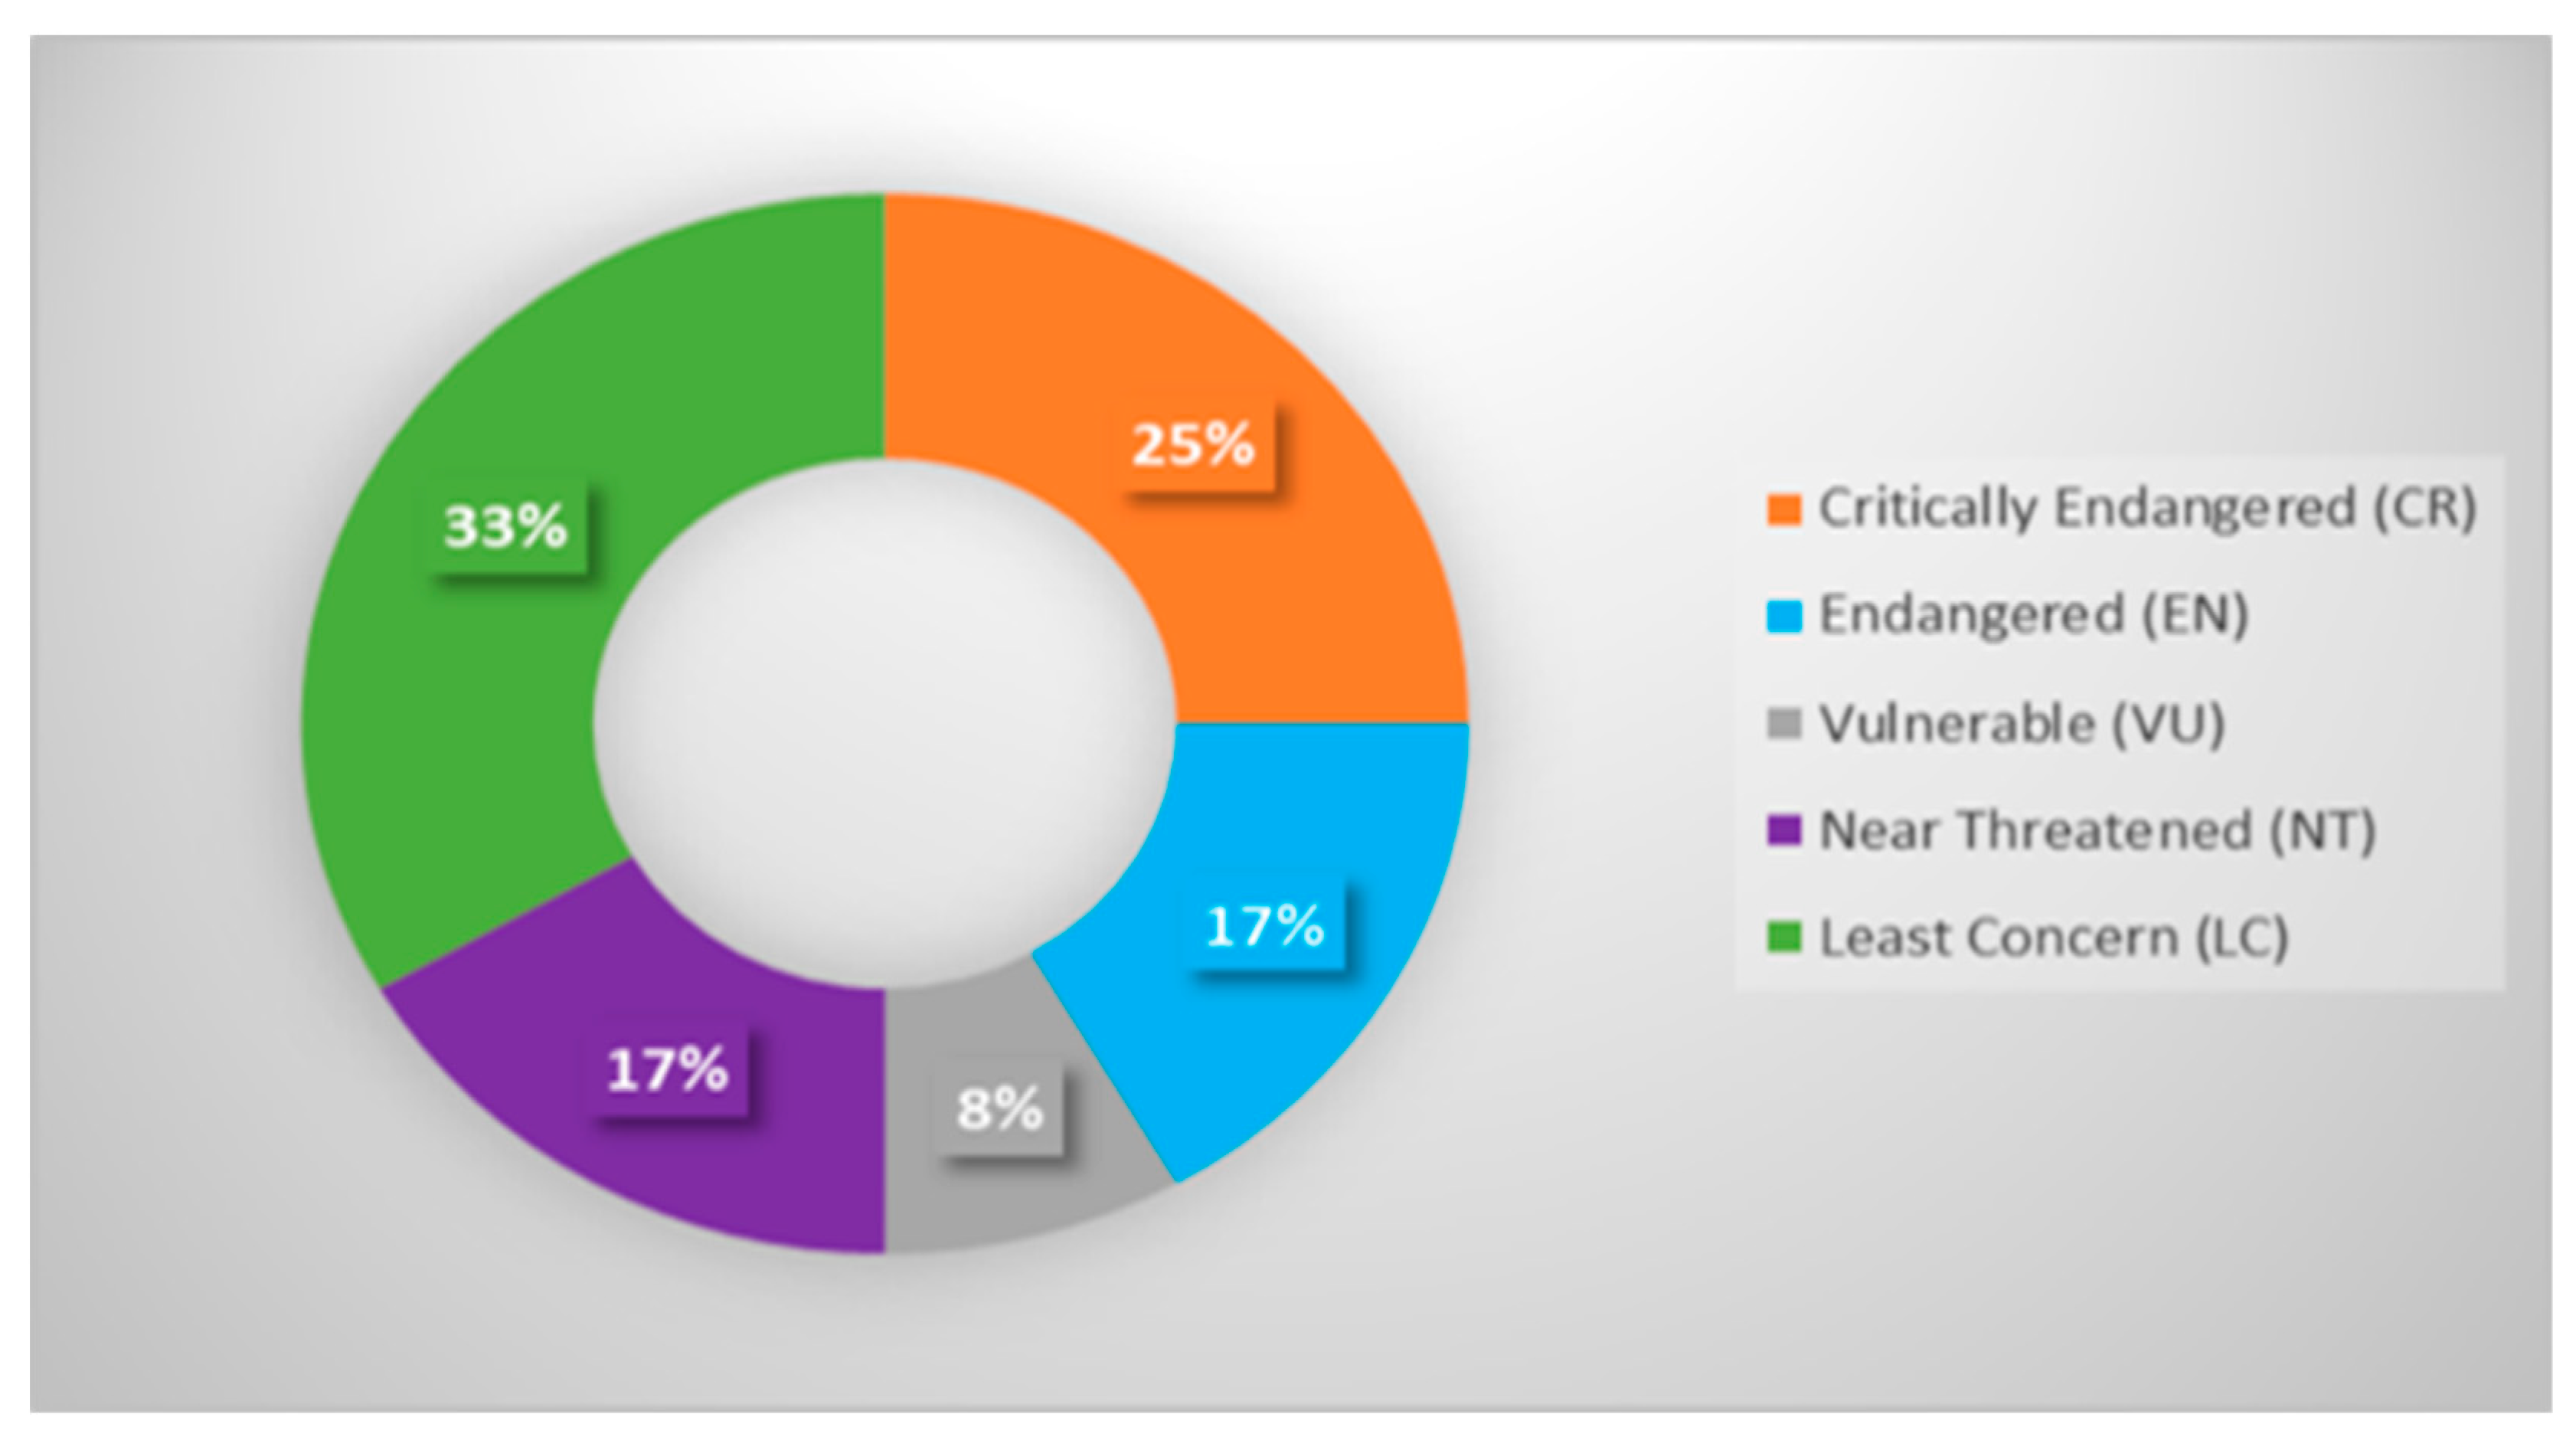
3.1. Taxonomic Range and Red List Coverage
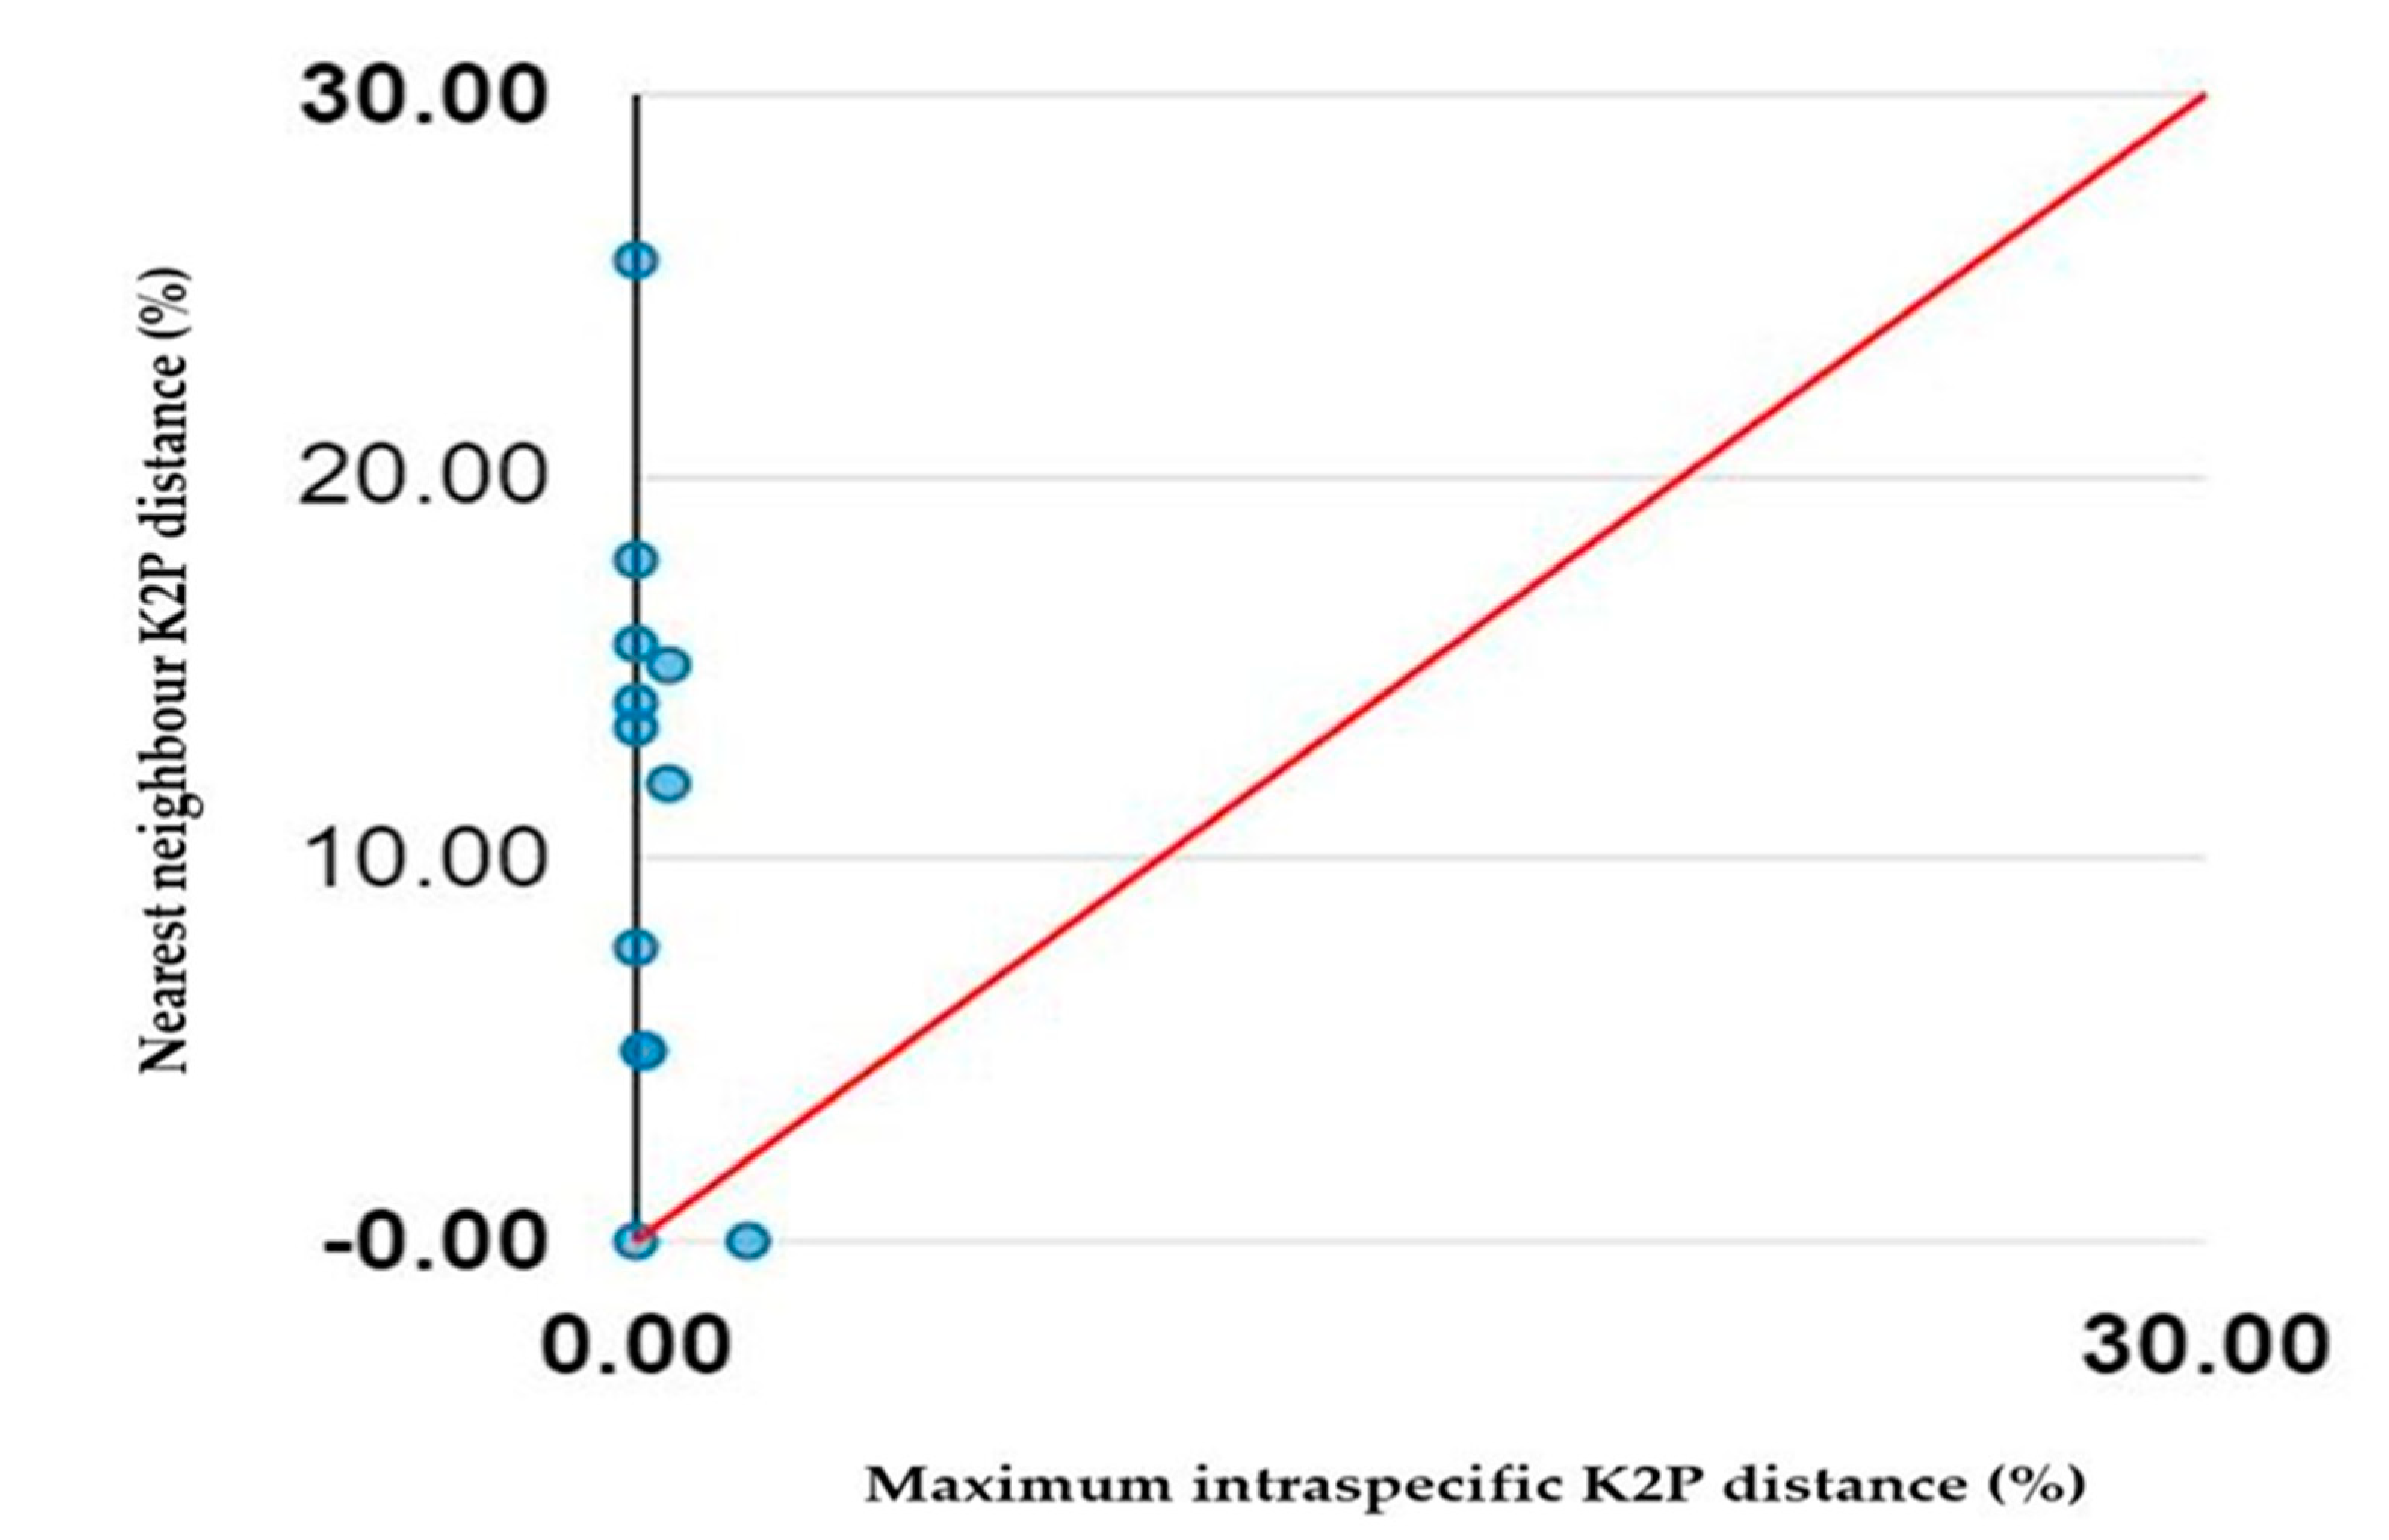
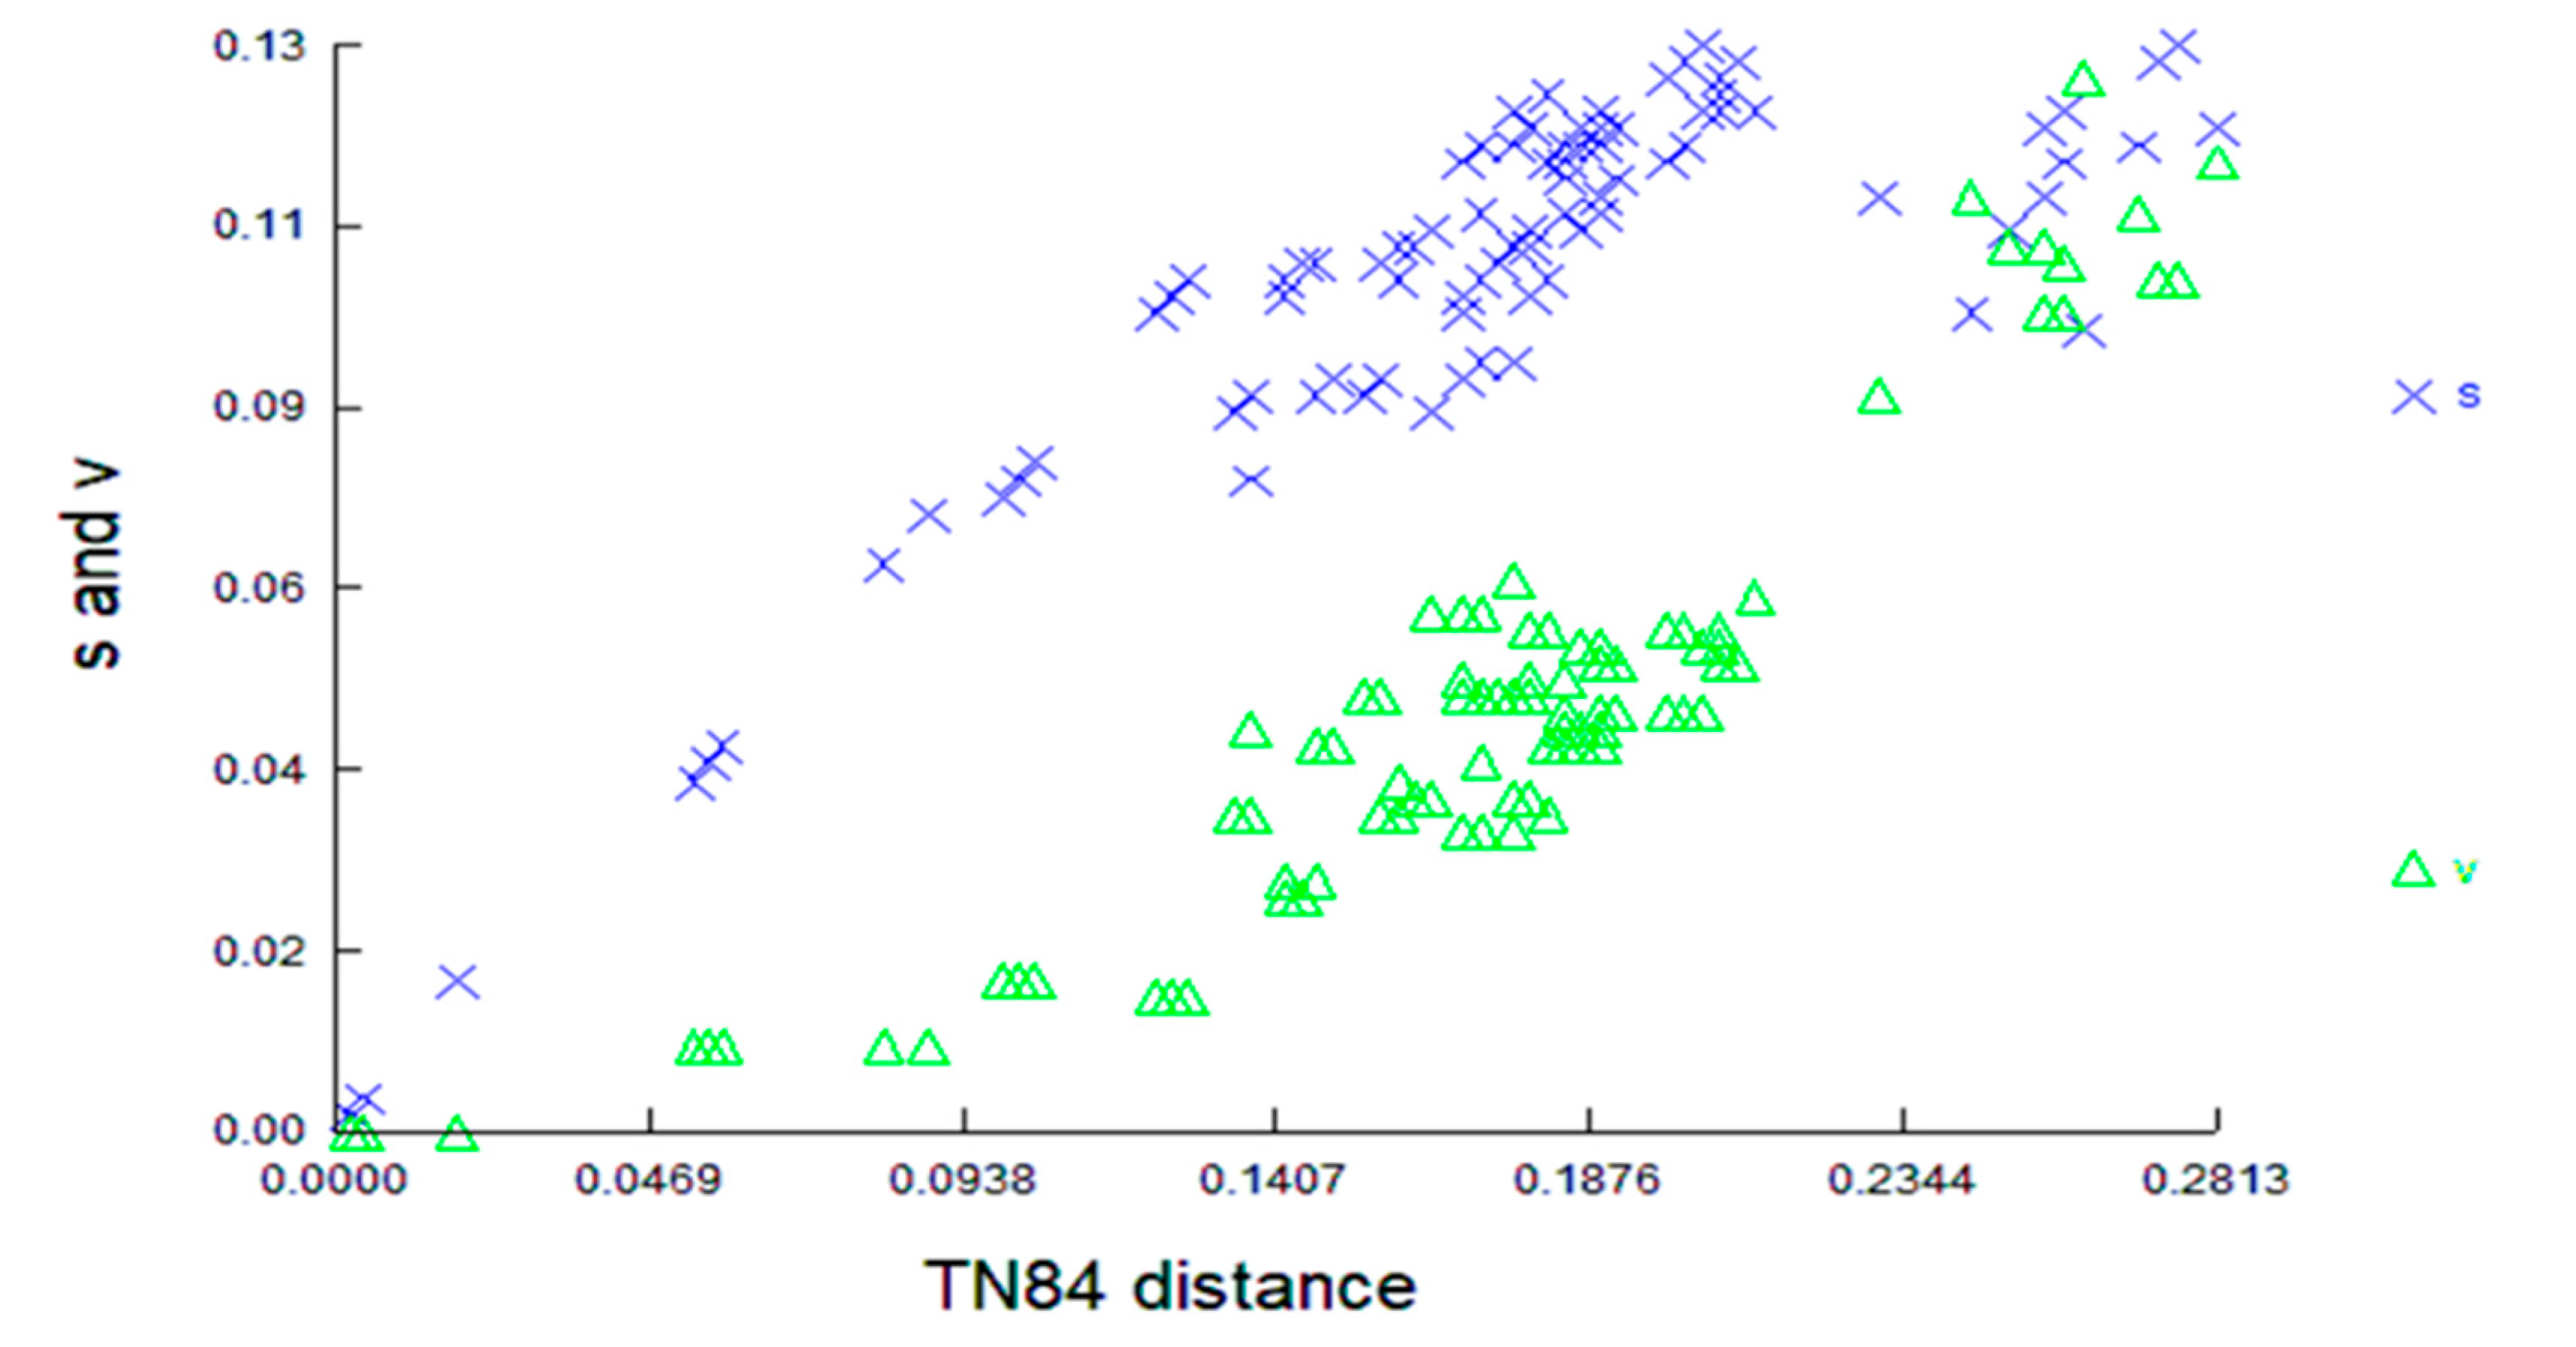
3.2. COI Divergence Assessment
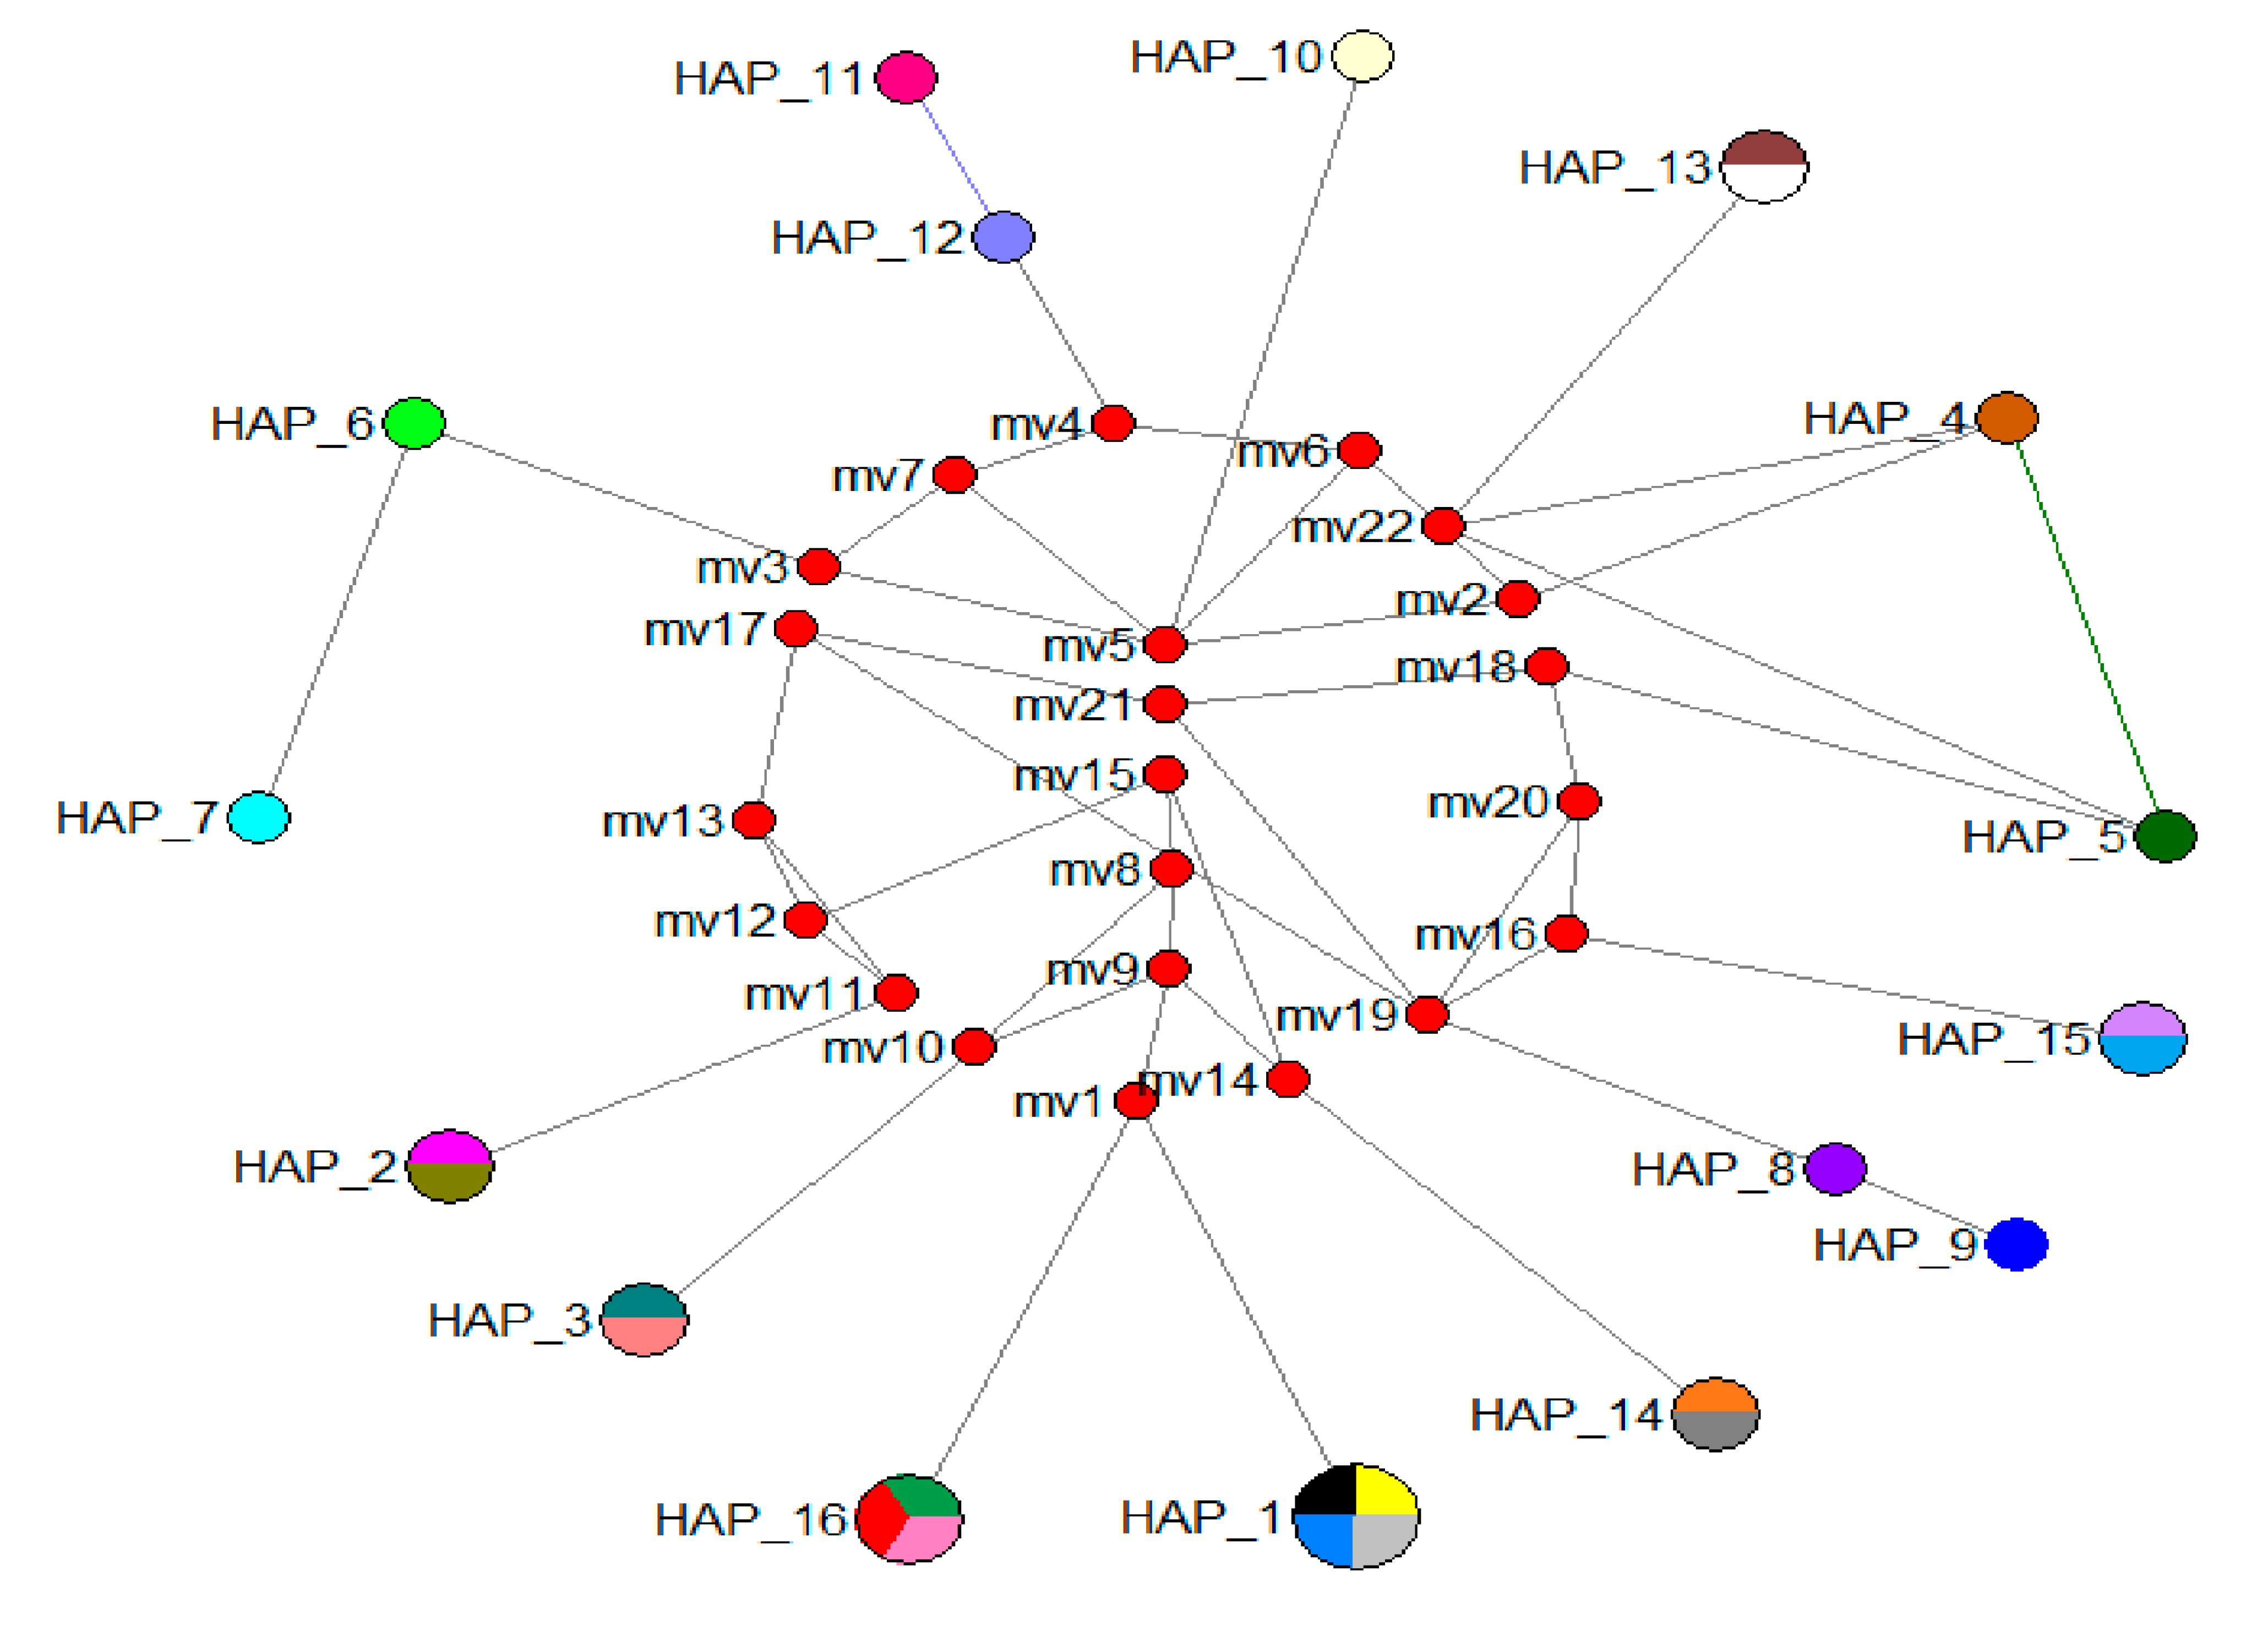
3.3. Population Relationships
4. Discussion
4.1. Population Relationships
4.2. Conservation Status
5. Conclusions
Supplementary Materials
Author Contributions
Funding
Institutional Review Board Statement
Informed Consent Statement
Data Availability Statement
Acknowledgments
Conflicts of Interest
References
- Jualaong, S.; Songnui, A.; Thongprajukaew, K.; Ninwat, S.; Khwanmaung, S.; Hahor, W.; Khunsaeng, P.; Kanghae, H. Optimal salinity for head-starting northern river terrapins (Batagur baska Gray, 1831). Animals 2019, 9, 855. [Google Scholar] [CrossRef]
- Sayers, I.; Kubiak, M. Chapter 20: Terrapins. In Handbook of Exotic Pet Medicine; Kubiak, M.B., Ed.; John Wiley & Sons Ltd.: Hoboken, NJ, USA, 2020; pp. 387–413. [Google Scholar] [CrossRef]
- Turtle Owner. What Are Terrapins? (General Info, Pictures and Care Guide). Available online: https://turtleowner.com/what-are-terrapins-general-info-pictures-and-care-guide/ (accessed on 1 January 2022).
- Vargas, S.M.; Araújo, F.C.; Santos, F.R. DNA barcoding of Brazilian sea turtles (Testudines). Genet. Mol. Biol. 2009, 32, 608–612. [Google Scholar] [CrossRef] [PubMed]
- Hebert, P.D.N.; Stoeckle, M.Y.; Zemlak, T.S.; Francis, C.M. Identification of Birds through DNA Barcodes. PLoS Biol. 2004, 2, e312. [Google Scholar] [CrossRef] [PubMed]
- Vilaça, S.T.; Lacerda, D.R.; Sari, H.E.R.; Santos, F.R. DNA based identification to Thamnophilidae (Passeriformes) species: The first barcodes of Neotropical birds. Rev. Bras. Ornitol. 2006, 14, 7–13. [Google Scholar]
- Clare, E.L.; Lim, B.K.; Engstrom, M.D.; Eger, J.L.; Hebert, P.D. DNA barcoding of Neotropical bats: Species identification and discovery within Guyana. Mol. Ecol. Notes 2007, 7, 184–190. [Google Scholar] [CrossRef]
- Chaves, A.V.; Clozato, C.L.; Lacerda, D.R.; Sari, E.H.R.; Santos, F.R. Molecular taxonomy of Brazilian tyrant-flycatchers (Passeriformes, Tyrannidae). Mol. Ecol. Resour. 2008, 8, 1169–1177. [Google Scholar] [CrossRef]
- Naro-Maciel, E.; Reid, B.; Fitzsimmons, N.N.; Le, M.; Desalle, R.O.B.; Amato, G. DNA barcodes for globally threatened marine turtles: A registry approach to documenting biodiversity. Mol. Ecol. Resour. 2010, 10, 252–263. [Google Scholar] [CrossRef]
- Alacs, E.A.; Jansen, F.J.; Scribner, K.T. Genetic issues in freshwater turtle and tortoise conservation. Chelonian Res. Monogr. 2007, 4, 107–123. [Google Scholar]
- Kundu, S.; Kumar, V.; Laskar, B.A.; Tyagi, K.; Chandra, K. Pet and turtle: DNA barcoding identified twelve Geoemydid species in northeast India. Mitochondrial DNA Part B 2018, 3, 513–518. [Google Scholar] [CrossRef]
- Hebert, P.D.N.; Cywinska, A.; Ball, S.L.; de Waard, J.R. Biological identifications through DNA barcodes. Proc. R. Soc. London Ser. B Biol. Sci. 2003, 270, 313–322. [Google Scholar] [CrossRef]
- Bertolazzi, P.; Felici, G.; Weitschek, E. Learning to classify species with barcodes. BMC Bioinform. 2009, 10 (Suppl. 14), S7. [Google Scholar] [CrossRef] [PubMed]
- Salleh, M.H.M.; Esa, Y. The mtDNA D-loop Marker Identifies the Genetic Variability of Indochina’s Batagur affinis. In 1st Postgraduate Seminar on Agriculture and Forestry 2021 (PSAF 2021); Universiti Putra Malaysia: Bintulu, Malaysia, 2021. [Google Scholar]
- Cantor, T. Catalogue of reptiles inhabiting the Malayan peninsula and islands. J. Asiat. Soc. Bengal 1847, 16, 607–656, 897–952, 1026–1078. [Google Scholar]
- Mohd Salleh, M.H.; Esa, Y.; Salleh, S.M.; Mohd Sah, S.A. Turtles in Malaysia: A Review of Conservation Status and a Call for Research. Animals 2022, 12, 2184. [Google Scholar] [CrossRef]
- Buhlmann, K.A.; Dijk, P.P.V.; Iverson, J.B.; Mittermeier, R.A.; Pritchard, P.C.H.; Rhodin, A.G.; Saumure, R.A. Conservation Biology of Freshwater Turtles and Tortoises: A Compilation Project of the IUCN/SSC Tortoise and Freshwater Turtle Specialist Group, IUCN: International Union for Conservation of Nature. Available online: https://iucn-tftsg.org/cbftt/ (accessed on 3 April 2022).
- Praschag, P.; Hundsdörfer, A.K.; Fritz, U. Phylogeny and taxonomy of endangered South and Southeast Asian freshwater turtles elucidated by mtDNA sequence variation (Testudines: Geoemydidae: Batagur, Callagur, Hardella, Kachuga, Pangshura). Zool. Scr. 2007, 36, 429–442. [Google Scholar] [CrossRef]
- Turtle Conservation Coalition. Turtles in Trouble: The World’s 25+ Most Endangered Tortoises and Freshwater Turtles—2011; Rhodin, A.G.J., Walde, A.D., Horne, B.D., van Dijk, P.P., Blanck, T., Hudson, R., Eds.; IUCN/SSC Tortoise and Freshwater Turtle Specialist Group, Turtle Conservation Fund, Turtle Survival Alliance, Turtle Conservancy, Chelonian Research Foundation, Conservation International, Wildlife Conservation Society, and San Diego Zoo Global: Lunenburg, MA, USA, 2011; p. 54. [Google Scholar]
- Moll, E.O. Natural history of the River Terrapin, Batagur baska (Gray) in Malaysia (Testudines: Emydidae). Malays. J. Sci. 1980, 6, 23–62. [Google Scholar]
- Platt, S.G.; Stuart, B.L.; Sovannara, H.; Kheng, L.; Kimchhay, H. Rediscovery of the critically endangered river terrapin, Batagur baska, in Cambodia, with notes on occurrence, reproduction, and conservation status. Chelonian Conserv. Biol. 2003, 4, 691–694. [Google Scholar]
- Kalyar, J.; Thorbjarnarson, K.; Thirakhupt. An overview of the current population and conservation status of the Critically Endangered River Terrapin, Batagur baska (Gray, 1831) in Myanmar, Thailand and Malaysia. Nat. Hist. J. Chulalongkorn Univ. 2007, 7, 51–65. [Google Scholar]
- Moll, E.O.; Platt, S.G.; Chan, E.H.; Horne, B.D.; Platt, K.; Praschag, P.; Chen, P.N.; Van Dijk, P.P. Batagur affinis (Cantor 1847) Southern river terrapin, tuntong. Chelonian Res. Monogr. 2015, 5, 090.1–090.17. [Google Scholar] [CrossRef]
- Chen, P.N. Conservation of the Southern River Terrapin Batagur affinis (Reptilia: Testudines: Geoemydidae) in Malaysia: A case study involving local community participation. J. Threat. Taxa 2017, 9, 10035–10046. [Google Scholar] [CrossRef]
- Mistar, S.A.J.; Singleton, I. Presence and Distribution of the Southern River Terrapin Batagur Affinis and Painted Terrapin Batagur Borneoensis in Eastern Coast of Sumatra; Unpublished Report to Auckland Zoo; Auckland Zoo: Auckland, New Zealand, 2012; p. 25. [Google Scholar]
- Salleh, M.H.M.; Esa, Y. Conservation Status of Globally Testudines Terrapins Based on COI Mitochondrial Markers. In Proceedings of the MOL2NET’22, Conference on Molecular, Biomedical & Computational Sciences and Engineering, Biscay, Spain, 25–30 December 2022; MDPI: Basel, Switzerland, 2022. [Google Scholar] [CrossRef]
- Çilingir, F.G.; Seah, A.; Horne, B.D.; Som, S.; Bickford, D.P.; Rheindt, F.E. Last exit before the brink: Conservation genomics of the Cambodian population of the critically endangered Southern river terrapin. Ecol. Evol. 2019, 9, 9500–9510. [Google Scholar] [CrossRef]
- Praschag, P.; Sommer, R.S.; Mccarthy, C.; Gemel, R. Naming one of the world’s rarest chelonians, the southern Batagur. Zootaxa 2008, 1758, 61–68. [Google Scholar] [CrossRef]
- Salleh, M.H.M.; Esa, Y. Minimally invasive blood collection techniques as a source of gDNA for genetic studies on turtles and tortoises. Int. J. Aquat. Biol. 2022, 10, 145–150. [Google Scholar]
- Guntoro, J.; Riyanto, A. The very low genetic variability on Aceh Tamiang’s (Indonesia) population of Painted Terrapin (Batagur borneoensis) inferred by cytochrome oxidase I (CO I) and D-loop (control region). Biodivers. J. Biol. Divers. 2020, 21, 6. [Google Scholar] [CrossRef]
- Kundu, S.; Das, K.C.; Ghosh, S.K. Taxonomic rank of Indian tortoise: Revisit with DNA barcoding perspective. DNA Barcodes 2013, 1, 39–45. [Google Scholar] [CrossRef]
- Reid, B.N.; LE, M.; McCord, W.P.; Iverson, J.B.; Georges, A.; Bergmann, T.; Amato, G.; Desalle, R.; NaroMaciel, E. Comparing and combining distance-based and character-based approaches for barcoding turtles. Mol. Ecol. Resour. 2011, 11, 956–967. [Google Scholar] [CrossRef]
- Ratnasingham, S.; Hebert, P.D. BOLD: The Barcode of Life Data System. Mol. Ecol. Notes 2007, 7, 355–364. [Google Scholar] [CrossRef]
- Spinks, P.Q.; Thomson, R.C.; McCartney-Melstad, E.; Shaffer, H.B. Phylogeny and temporal diversification of the New World pond turtles (Emydidae). Mol. Phylogenet. Evol. 2016, 103, 85–97. [Google Scholar] [CrossRef] [PubMed]
- Hawlitschek, O.; Morinière, J.; Dunz, A.; Franzen, M.; Rödder, D.; Glaw, F.; Haszprunar, G. Comprehensive DNA barcoding of the herpetofauna of Germany. Mol. Ecol. Resour. 2016, 16, 242–253. [Google Scholar] [CrossRef]
- Yu, D.; Fang, X.; Storey, K.B.; Zhang, Y.; Zhang, J. Complete mitochondrial genomes of the yellow-bellied slider turtle Trachemys scripta scripta and anoxia tolerant red-eared slider Trachemys scripta elegans. Mitochondrial DNA Part A 2016, 27, 2276–2277. [Google Scholar] [CrossRef]
- Feldman, C.R.; Parham, J.F. Molecular systematics of Old World stripe-necked turtles (Testudines: Mauremys). Asiat. Herpetol. Res. 2004, 10, 28–37. [Google Scholar]
- Morgulis, A.; Coulouris, G.; Raytselis, Y.; Madden, T.L.; Agarwala, R.; Schäffer, A.A. Database indexing for production MegaBLAST searches. Bioinformatics 2008, 24, 1757–1764. [Google Scholar] [CrossRef]
- Altschul, S.F.; Gish, W.; Miller, W.; Myers, E.W.; Lipman, D.J. Basic local alignment search tool. J. Mol. Biol. 1990, 215, 403–410. [Google Scholar] [CrossRef]
- Kimura, M. A simple method for estimating evolutionary rates of base substitutions through comparative studies of nucleotide sequences. J. Mol. Evol. 1980, 16, 111–120. [Google Scholar] [CrossRef]
- Kumar, S.; Stecher, G.; Li, M.; Knyaz, C.; Tamura, K. MEGA X: Molecular evolutionary genetics analysis across computing platforms. Mol. Biol. Evol. 2018, 35, 1547. [Google Scholar] [CrossRef] [PubMed]
- Darriba, D.; Taboada, G.L.; Doallo, R.; Posada, D. jModelTest 2: More models, new heuristics and parallel computing. Nat. Methods 2012, 9, 772. [Google Scholar] [CrossRef] [PubMed]
- Felsenstein, J. Evolutionary trees from DNA sequences: A maximum likelihood approach. J. Mol. Evol. 1981, 17, 368–376. [Google Scholar] [CrossRef]
- Waterhouse, A.M.; Procter, J.B.; Martin, D.M.A.; Clamp, M.; Barton, G.J. Jalview Version 2—A multiple sequence alignment editor and analysis workbench. Bioinformatics 2009, 25, 1189–1191. [Google Scholar] [CrossRef] [PubMed]
- Procter, J.B.; Carstairs, G.; Soares, B.; Mourão, K.; Ofoegbu, T.C.; Barton, D.; Lui, L.; Menard, A.; Sherstnev, N.; Roldan-Martinez, D.; et al. Alignment of Biological Sequences with Jalview. In Multiple Sequence Alignment—Methods in Molecular Biology; Katoh, K., Ed.; Springer: New York, NY, USA, 2021; Volume 2231, pp. 203–224. [Google Scholar] [CrossRef]
- Nguyen, L.T.; Schmidt, H.A.; von Haeseler, A.; Minh, B.Q. IQ-TREE: A fast and effffective stochastic algorithm for estimating maximum-likelihood phylogenies. Mol. Biol. Evol. 2015, 32, 268–274. [Google Scholar] [CrossRef] [PubMed]
- Towns, J.; Cockerill, T.; Dahan, M.; Foster, I.; Gaither, K.; Grimshaw, A.; Hazlewood, V.; Lathrop, S.; Lifka, D.; Peterson, G.D.; et al. XSEDE: Accelerating Scientific Discovery. Comput. Sci. Eng. 2014, 16, 62–74. [Google Scholar] [CrossRef]
- Miller, M.A.; Pfeiffer, W.; Schwartz, T. The CIPRES science gateway: A community resource for phylogenetic analyses. In Proceedings of the 2011 TeraGrid Conference: Extreme Digital Discovery, Salt Lake City, UT, USA, 18–21 July 2011. [Google Scholar] [CrossRef]
- Rambaut, A. FigTree v1.4.5, a Graphical Viewer of Phylogenetic Trees. Available online: http://tree.bio.ed.ac.uk/software/figtree/ (accessed on 13 August 2022).
- Drummond, A.J.; Ho, S.Y.W.; Phillips, M.J.; Rambaut, A. Relaxed phylogenetics and dating with confidence. PLoS Biol. 2006, 4, e88. [Google Scholar] [CrossRef]
- Drummond, A.J.; Rambaut, A. BEAST: Bayesian evolutionary analysis by sampling trees. BMC Evol. Biol. 2007, 7, 214. [Google Scholar] [CrossRef] [PubMed]
- Bilderbeek, R.J.; Etienne, R.S. babette: BEAUti 2, BEAST2 and Tracer for R. Methods Ecol. Evol. 2018, 9, 2034–2040. [Google Scholar] [CrossRef]
- Zhou, C.; Gan, S.; Zhang, J.; Fan, Y.; Li, B.; Wan, L.; Nie, J.; Wang, X.; Chen, J. Application of DNA Barcoding for the Identification of Snake Gallbladders as a Traditional Chinese Medicine. Rev. Bras. Farm. 2022, 32, 663–668. [Google Scholar] [CrossRef]
- Tajima, F. Statistical method for testing the neutral mutation hypothesis by DNA polymorphism. Genetics 1989, 123, 585–595. [Google Scholar] [CrossRef]
- Tajima, F. The amount of DNA polymorphism maintained in a finite population when the neutral mutation rate varies among sites. Genetics 1996, 143, 1457–1465. [Google Scholar] [CrossRef] [PubMed]
- Rozas, J.; Ferrer-Mata, A.; Sánchez-DelBarrio, J.C.; Guirao-Rico, S.; Librado, P.; Ramos-Onsins, S.E.; Sánchez-Gracia, A. DnaSP 6: DNA sequence polymorphism analysis of large data sets. Mol. Biol. Evol. 2017, 34, 3299–3302. [Google Scholar] [CrossRef]
- Bandelt, H.J.; Forster, P.; Rohl, A. Median-joining networks for inferring intraspecific phylogenies. Mol. Biol. Evol. 1999, 16, 37–48. [Google Scholar] [CrossRef]
- Hebert, P.D.; Ratnasingham, S.; De Waard, J.R. Barcoding animal life: Cytochrome c oxidase subunit 1 divergences among closely related species. Proc. R. Soc. London Ser. B Biol. Sci. 2003, 270, S96–S99. [Google Scholar] [CrossRef]
- Xia, X.; Xie, Z. DAMBE: Software package for data analysis in molecular biology and evolution. J. Hered. 2001, 92, 371–373. [Google Scholar] [CrossRef]
- Ernst, C.H.; Lovich, J.E. Turtles of the United States and Canada; Smithsonian Institution Press: Washington, DC, USA, 1994; 578p. [Google Scholar]
- Stuckas, H.; Gemel, R.; Fritz, U. One Extinct Turtle Species Less: Pelusios seychellensis Is Not Extinct, It Never Existed. PLoS ONE 2013, 8, e57116. [Google Scholar] [CrossRef]
- Avise, J.C.; Bowen, B.W.; Lamb, T.; Meylan, A.B.; Bermingham, E. Mitochondrial DNA evolution at a turtle¢s pace: Evidence for low genetic variability and reduced microevolutionary rate in the testudines. Mol. Biol. Evol. 1992, 9, 457–473. [Google Scholar]
- FitzSimmons, N.N.; Moritz, C.; Moore, S.S. Conservation and dynamics of microsatellite loci over 300 million years of marine turtle evolution. Mol. Biol. Evol. 1995, 12, 432–440. [Google Scholar]
- Puillandre, N.; Lambert, A.; Brouillet, S.; Achaz, G. ABGD, automatic barcode gap discovery for primary species delimitation. Mol. Ecol. 2012, 21, 1864–1877. [Google Scholar] [CrossRef] [PubMed]
- Trivedi, S.; Aloufifi, A.A.; Sankar, A.A.; Ghosh, S.K. Role of DNA barcoding in marine biodiversity. Saudi J. Biol. Sci. 2016, 23, 161–171. [Google Scholar] [CrossRef] [PubMed]
- Zhang, Z.P.; Wang, X.Y.; Zhang, Z.; Yao, H.; Zhang, X.M.; Zhang, Y.; Zhang, B.G. The impact of genetic diversity on the accuracy of DNA barcoding to identify species: A study on the genus Phellodendron. Ecol. Evol. 2019, 9, 10723–10733. [Google Scholar] [CrossRef] [PubMed]
- Meier, R.; Zhang, G.; Ali, F. The use of mean instead of smallest interspecifc distances exaggerates the size of the “barcoding gap” and leads to misidentifcation. Syst. Biol. 2008, 57, 809–813. [Google Scholar] [CrossRef]
- Abidin, D.H.Z.; Nor, S.A.M.; Lavoué, S.; Rahim, M.A.; Jamaludin, N.A.; Akib, N.A.M. DNA-based taxonomy of a mangrove-associated community of fishes in Southeast Asia. Sci. Rep. 2021, 11, 17800. [Google Scholar] [CrossRef] [PubMed]
- Hubert, N.; Meyer, C.P.; Bruggemann, H.J.; Guerin, F.; Komeno, R.J.; Espiau, B.; Causse, R.; Williams, J.T.; Planes, S. Cryptic diversity in Indo-Pacific coral-reef fishes revealed by DNA-barcoding provides new support to the centre-of-overlap hypothesis. PLoS ONE 2012, 7, e28987. [Google Scholar] [CrossRef]
- Ward, R.D.; Zemlak, T.S.; Innes, B.H.; Last, P.R.; Hebert, P.D. DNA barcoding Australia’s fish species. Philos. Trans. R. Soc. B Biol. Sci. 2005, 360, 1847–1857. [Google Scholar] [CrossRef]
- Xu, L.; Wang, X.; Van Damme, K.; Huang, D.; Li, Y.; Wang, L.; Ning, J.; Du, F. Assessment of fish diversity in the South China Sea using DNA taxonomy. Fish. Res. 2020, 233, 105771. [Google Scholar] [CrossRef]
- Lakra, W.S.; Verma, M.S.; Goswami, M.; Lal, K.K.; Mohindra, V.; Punia, P.; Gopalakrishnan, A.; Singh, K.V.; Ward, R.D.; Hebert, P. DNA barcoding Indian marine fishes. Mol. Ecol. Resour. 2011, 11, 60–71. [Google Scholar] [CrossRef] [PubMed]
- Landi, M.; Dimech, M.; Arculeo, M.; Biondo, G.; Martins, R.; Carneiro, M.; Carvalho, G.R.; Brutto, S.L.; Costa, F.O. DNA barcoding for species assignment: The case of Mediterranean marine fishes. PLoS ONE 2014, 9, e106135. [Google Scholar] [CrossRef]
- Mecklenburg, C.W.; Møller, P.R.; Steinke, D. Biodiversity of arctic marine fishes: Taxonomy and zoogeography. Mar. Biodivers. 2011, 41, 109–140. [Google Scholar] [CrossRef]
- Praschag, P.; Holloway, R.; Georges, A.; Paeckert, M.; Hundsdoerfer, A.K.; Fritz, U.A. New subspecies of Batagur affinis (Cantor, 1847), one of the world’s most critically endangered chelonians (Testudines: Geoemydidae). Zootaxa 2009, 2233, 57–68. [Google Scholar] [CrossRef]
- Komoroske, L.M.; Jensen, M.P.; Stewart, K.R.; Shamblin, B.M.; Dutton, P.H. Advances in the application of genetics in marine turtle biology and conservation. Front. Mar. Sci. 2017, 4, 156. [Google Scholar] [CrossRef]
- Jensen, M.P.; FitzSimmons, N.N.; Bourjea, J.; Hamabata, T.; Reece, J.; Dutton, P.H. The evolutionary history and global phylogeography of the green turtle (Chelonia mydas). J. Biogeogr. 2019, 46, 860–870. [Google Scholar] [CrossRef]
- Fišer, C.; Zagmajster, M. Cryptic species from cryptic space: The case of Niphargus fongi sp. n. (Amphipoda, Niphargidae). Crustaceana 2009, 82, 593–614. [Google Scholar] [CrossRef]
- Schlick-Steiner, B.C.; Steiner, F.M.; Seifert, B.; Stauffer, C.; Christian, E.; Crozier, R.H. Integrative Taxonomy: A Multisource Approach to Exploring Biodiversity. Annu. Rev. Entomol. 2010, 55, 421–438. [Google Scholar] [CrossRef]
- Jugovic, J.; Jalžić, B.; Prevorčnik, S.; Sket, B. Cave shrimps Troglocaris s. str. (Dormitzer, 1853), taxonomic revision and description of new taxa after phylogenetic and morphometric studies. Zootaxa 2012, 3421, 1–31. [Google Scholar] [CrossRef]
- Adams, M.; Raadik, T.A.; Burridge, C.P.; Georges, A. Global biodiversity assessment and hyper -cryptic species complexes: More than one species of elephant in the room? Syst. Biol. 2014, 63, 518–533. [Google Scholar] [CrossRef]
- Fišer, C.; Robinson, C.T.; Malard, F. Cryptic species as a window into the paradigm shift of the species concept. Mol. Ecol. 2018, 27, 613–635. [Google Scholar] [CrossRef] [PubMed]
- de León, G.P.P.; Poulin, R. Taxonomic distribution of cryptic diversity among metazoans: Not so homogeneous after all. Biol. Lett. 2016, 12, 20160371. [Google Scholar] [CrossRef] [PubMed]
- Pfenninger, M.; Schwenk, K. Cryptic animal species are homogeneously distributed among taxa and biogeographical regions. BMC Evol. Biol. 2007, 7, 121. [Google Scholar] [CrossRef]
- Knowlton, N. Molecular genetic analyses of species boundaries in the sea. Hydrobiologia 2000, 420, 73–90. [Google Scholar] [CrossRef]
- Dawson, M.N.; Jacobs, D.K. Molecular evidence for cryptic species of Aurelia aurita (Cnidaria, Scyphozoa). Biol. Bull. 2001, 200, 92–96. [Google Scholar] [CrossRef] [PubMed]
- IUCN. IUCN Red List Categories and Criteria: Versian 3.1; IUCN Species Survival Commission: Gland, Switzerland; IUCN: Cambridge, UK, 2001; p. 30. [Google Scholar]
- Vié, J.C.; Hilton-Taylor, C.; Pollock, C.; Ragle, J.; Smart, J.; Stuart, S.N.; Tong, R. The IUCN Red List: A Key Conservation Tool. In Wildlife in a Changing World—An Analysis of the 2008 IUCN Red List of Threatened, Species; Vié, J.C., Hilton-Taylor, C., Stuart, S.N., Eds.; IUCN: Gland, Switzerland, 2009; p. 13. [Google Scholar]
- Praschag, P.; Singh, S. Batagur Baska. In The IUCN Red List of Threatened Species; IUCN: Cambridge, UK, 2019. [Google Scholar] [CrossRef]
- Jenkins, M.D. Tortoises and Freshwater Turtles: The Trade in Southeast Asia; TRAFFIC International: Cambridge, UK, 1995; p. 48. [Google Scholar]


| Scientific Name | English Name | GenBank | BOLD ID | Haplotype | BLASTn Result | Locallity | IUCN Red List | References |
|---|---|---|---|---|---|---|---|---|
| Batagur baska | Northern River Terrapin | KF894752 | GBGCR2852-19 | Hap_1 | 100% with B. affinis (OL658844) | India | CR | [31] |
| Batagur baska | Northern River Terrapin | HQ329671 | GBGCR2716-19 | Hap_1 | 99% with B. affinis (OL658844) | India | CR | [32] |
| Batagur borneoensis | Painted Terrapin | HQ329672 | GBGCR2717-19 | Hap_2 | 95% with B. trivittata (HQ329675) | Indonesia | CR | [32] |
| Batagur borneoensis | Painted Terrapin | None | BENT109-08 | Hap_2 | 95% with B. trivittata (HQ329675) | Indonesia | CR | [33] |
| Morenia ocellata | Bengal Eyed Terrapin | HQ329690 | GBGCR2724-19 | Hap_3 | 90–91% with M. petersi (MH157788) | Myanmar | EN | [32] |
| Morenia ocellata | Bengal Eyed Terrapin | None | BENT264-09 | Hap_3 | 90–91% with M. petersi (KF894774) | Myanmar | EN | [33] |
| Malaclemys terrapin | Diamondback Terrapin | HQ329654 | GBGC11262-13 | Hap_4 | 95% with Graptemys barbouri (MG728234) | America | VU | [32] |
| Malaclemys terrapin | Diamondback Terrapin | KX559038 | GBGCR2938-19 | Hap_5 | 95% with Graptemys geographica (MG728245) | America | VU | [34] |
| Emys orbicularis | European Pond Terrapin | HQ329643 | GBGC11273-13 | Hap_6 | 98% with E. trinacris (KX559027) | Unknown | NT | [32] |
| Emys orbicularis | European Pond Terrapin | KP697925 | None | Hap_7 | 98% with E. trinacris (KX559027) | Germany | NT | [35] |
| Melanochelys trijuga | Indian Pond Terrapin | KC354725 | GBGC11418-13 | Hap_8 | 96% with M. tricarinata (KF894770) | India | LC | [31] |
| Melanochelys trijuga | Indian Pond Terrapin | KC354724 | GBGC11419-13 | Hap_9 | 95% with M. tricarinata (KF894770) | India | LC | [31] |
| Rhinoclemmys rubida | Mexican Spotted Terrapin | HQ329701 | GBGCR2766-19 | Hap_10 | 91% with R. annulata (MH274599) | Mexico | NT | [32] |
| Trachemys scripta elegans | Red-eared Terrapin | KX559044 | GBGCR1038-18 | Hap_11 | 96–100% with T. s. elegans (TSU49047) | America | LC | [34] |
| Trachemys scripta elegans | Red-eared Terrapin | KM216748 | GBGCR1008-15 | Hap_12 | 97–100% with T. s. elegans (TSU49047) | America | LC | [36] |
| Pelusios sinuatus | Serrated Hinged Terrapin | None | BENT174-08 | Hap_13 | 100% | Southern Africa | LC | [33] |
| Pelusios sinuatus | Serrated Hinged Terrapin | HQ329735 | GBGC11221-13 | Hap_13 | 100% | Southern Africa | LC | [32] |
| Siebenrockiella crassicollis | Smiling Terrapin | HQ329704 | GBGCR2769-19 | Hap_14 | 100% | Unknown | EN | [32] |
| Siebenrockiella crassicollis | Smiling Terrapin | None | BENT190-08 | Hap_14 | 100% | Unknown | EN | [33] |
| Mauremys caspica | Striped-neck Terrapin | AY337348 | GBGC0806-06 | Hap_15 | 95% with Chinemys nigricans (AF348264) | Iran | LC | [37] |
| Mauremys caspica | Striped-neck Terrapin | AY337347 | GBGC0805-06 | Hap_15 | 95% with Chinemys nigricans (AF348264) | Bahrain | LC | [37] |
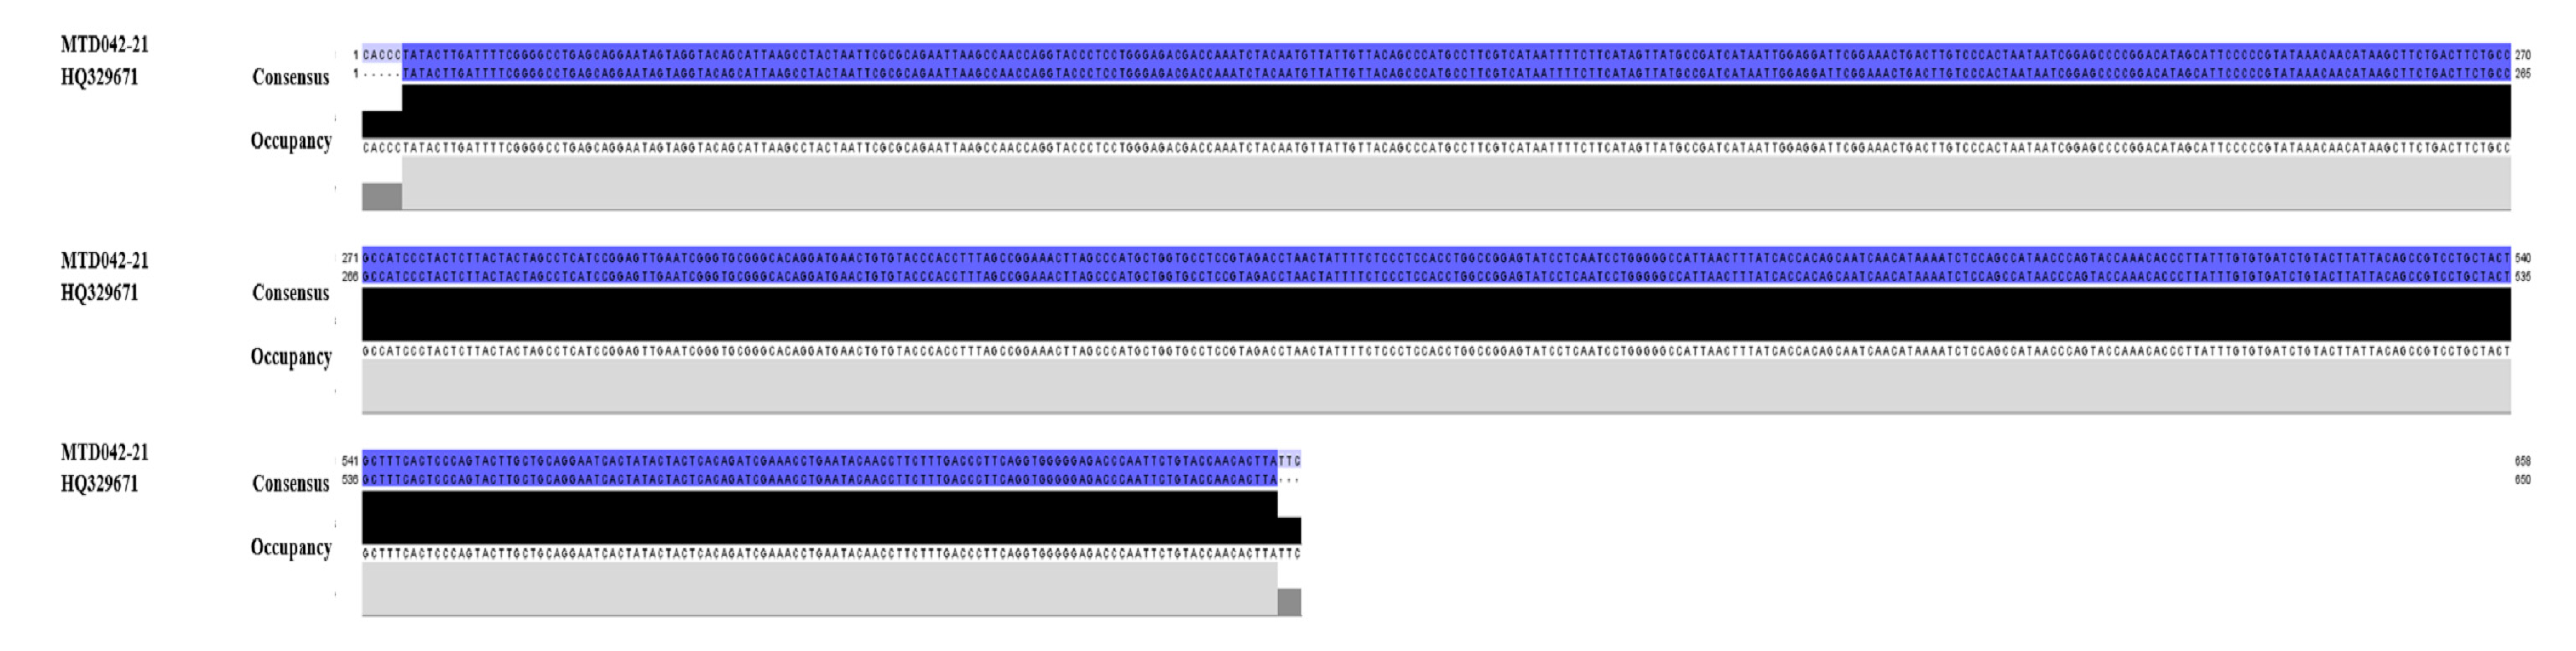
| Batagur affinis | Southern River Terrapin | None | MTD042-21 | Hap_1 | 100% with B. baska (HQ329671) | Malaysia | CR | [33] |
| Batagur affinis affinis | Southern River Terrapin | OL658844 | HYT001-21 | Hap_1 | 99–100% with B. baska (KF894752) | Malaysia | CR | This study |
| Batagur affinis edwardmolli | Southern River Terrapin | OL658845 | HYT002-21 | Hap_16 | 98% with B. baska (KF894752) | Malaysia | CR | This study |
| Batagur affinis edwardmolli | Southern River Terrapin | OL658846 | HYT003-21 | Hap_16 | 98% with B. baska (KF894752) | Malaysia | CR | This study |
| Batagur affinis edwardmolli | Southern River Terrapin | OL658847 | HYT004-21 | Hap_16 | 98% with B. baska (KF894752) | Malaysia | CR | This study |
| Category | n | Taxa | Comparisons | Min (%) | Mean (%) | Max (%) | SE (%) |
|---|---|---|---|---|---|---|---|
| Within Species | 25 | 11 | 20 | 0 | 0.68 | 2.14 | 0.04 |
| Within Genus | 9 | 1 | 24 | 0 | 5.49 | 9.14 | 0.15 |
| Within Family | 24 | 2 | 125 | 4.98 | 17.10 | 22.48 | 0.03 |
| Scientific Name | BIN | Nearest Species | Max. Intraspecifc Distance (%) | Nearest Neighbour Distance (%) |
|---|---|---|---|---|
| Emys orbicularis | BOLD:AAF8183 | Malaclemys terrapin | 0.62 | 11.97 |
| Malaclemys terrapin | BOLD:AAX3718 | Trachemys scripta | 0.16 | 4.98 |
| Trachemys scripta | BOLD:AAF5910 | Malaclemys terrapin | 0.14 | 4.98 |
| Batagur affinis | BOLD:AAW2850 & ADX0374 | Batagur baska | 2.14 | 0 |
| Batagur baska | BOLD:AAW2850 | Batagur affinis | 0 | 0 |
| Batagur borneoensis | BOLD:AAW2847 | Batagur affinis | 0 | 7.67 |
| Mauremys caspica | BOLD:AAJ1604 | Malaclemys terrapin | 0 | 14.09 |
| Melanochelys trijuga | BOLD:AAX4497 | Mauremys caspica | 0.62 | 15.07 |
| Morenia ocellata | BOLD:AAX4362 | Batagur borneoensis | 0 | 13.43 |
| Rhinoclemmys rubida | BOLD:AAY0332 | Malaclemys terrapin | 0 | 15.62 |
| Siebenrockiella crassicollis | BOLD:AAJ6683 | Batagur borneoensis | 0 | 17.82 |
| Pelusios sinuatus | BOLD:AAX1329 | Batagur affinis | 0 | 25.66 |
| Scientific Name | Common Name | Conservation Centre | Country |
|---|---|---|---|
| Batagur affinis | Southern River Terrapin | Sre Ambel River, Koh Kong Reptile Conservation Centre | Cambodia |
| Batagur affinis | Southern River Terrapin | Angkor Center for Conservation of Biodiversity | Cambodia |
| Batagur affinis | Southern River Terrapin | Kedah River, Kepala Batas, Kedah | Malaysia |
| Batagur affinis | Southern River Terrapin | Perak River, Bota Kanan, Perak | Malaysia |
| Batagur affinis | Southern River Terrapin | Terengganu River, Kuala Berang, Terengganu | Malaysia |
| Batagur affinis | Southern River Terrapin | Kemaman River, Kemaman, Terengganu | Malaysia |
| Batagur affinis | Southern River Terrapin | Setiu Wetlands State Park, Terengganu | Malaysia |
| Batagur baska | Northern River Terrapin | Vawal National Park | Bangladesh |
| Batagur baska | Northern River Terrapin | Sajnekhali Forest Station | India |
| Batagur borneoensis | Painted Terrapin | Langkat, North Sumatera | Indonesia |
| Batagur borneoensis | Painted Terrapin | Ujung Tamiang, Aceh | Indonesia |
| Batagur borneoensis | Painted Terrapin | Setiu Wetlands State Park, Terengganu | Malaysia |
| Batagur borneoensis | Painted Terrapin | Pengkalan Balak, Melaka | Malaysia |
Disclaimer/Publisher’s Note: The statements, opinions and data contained in all publications are solely those of the individual author(s) and contributor(s) and not of MDPI and/or the editor(s). MDPI and/or the editor(s) disclaim responsibility for any injury to people or property resulting from any ideas, methods, instructions or products referred to in the content. |
© 2023 by the authors. Licensee MDPI, Basel, Switzerland. This article is an open access article distributed under the terms and conditions of the Creative Commons Attribution (CC BY) license (https://creativecommons.org/licenses/by/4.0/).
Share and Cite
Mohd Salleh, M.H.; Esa, Y.; Mohamed, R. Global Terrapin Character-Based DNA Barcodes: Assessment of the Mitochondrial COI Gene and Conservation Status Revealed a Putative Cryptic Species. Animals 2023, 13, 1720. https://doi.org/10.3390/ani13111720
Mohd Salleh MH, Esa Y, Mohamed R. Global Terrapin Character-Based DNA Barcodes: Assessment of the Mitochondrial COI Gene and Conservation Status Revealed a Putative Cryptic Species. Animals. 2023; 13(11):1720. https://doi.org/10.3390/ani13111720
Chicago/Turabian StyleMohd Salleh, Mohd Hairul, Yuzine Esa, and Rozihan Mohamed. 2023. "Global Terrapin Character-Based DNA Barcodes: Assessment of the Mitochondrial COI Gene and Conservation Status Revealed a Putative Cryptic Species" Animals 13, no. 11: 1720. https://doi.org/10.3390/ani13111720