
Effect of Dietary Guanidinoacetic Acid Levels on the Mitigation of Greenhouse Gas Production and the Rumen Fermentation Profile of Alfalfa-Based Diets

 , ,
, ,  and
and 
Abstract
:Simple Summary
Abstract
1. Introduction
2. Materials and Methods
2.1. Experimental Treatments
2.2. Diets and Chemical Composition
2.3. In Vitro Fermentation
2.3.1. Collection of Inoculum and Preparation of the Nutrient Medium
2.3.2. Incubation Process
2.3.3. Measurement of Gas Production
2.3.4. pH and Dry Matter Degradation
2.3.5. Calculations
- y = volume (mL) of GP, CH4, CO and H2S at time t (h);
- b = asymptotic GP, CH4, CO and H2S production (mL g−1 DM);
- c = the rate GP, CH4, CO and H2S production (mL h−1);
- Lag = the initial delay time before the beginning of GP, CH4, CO and H2S production (h).
- GP = total gas production (mL 200 mg−1 DM) after 24 h of incubation;
- CP = crude protein (g kg−1 DM).
2.4. Statistical Analysis
3. Results
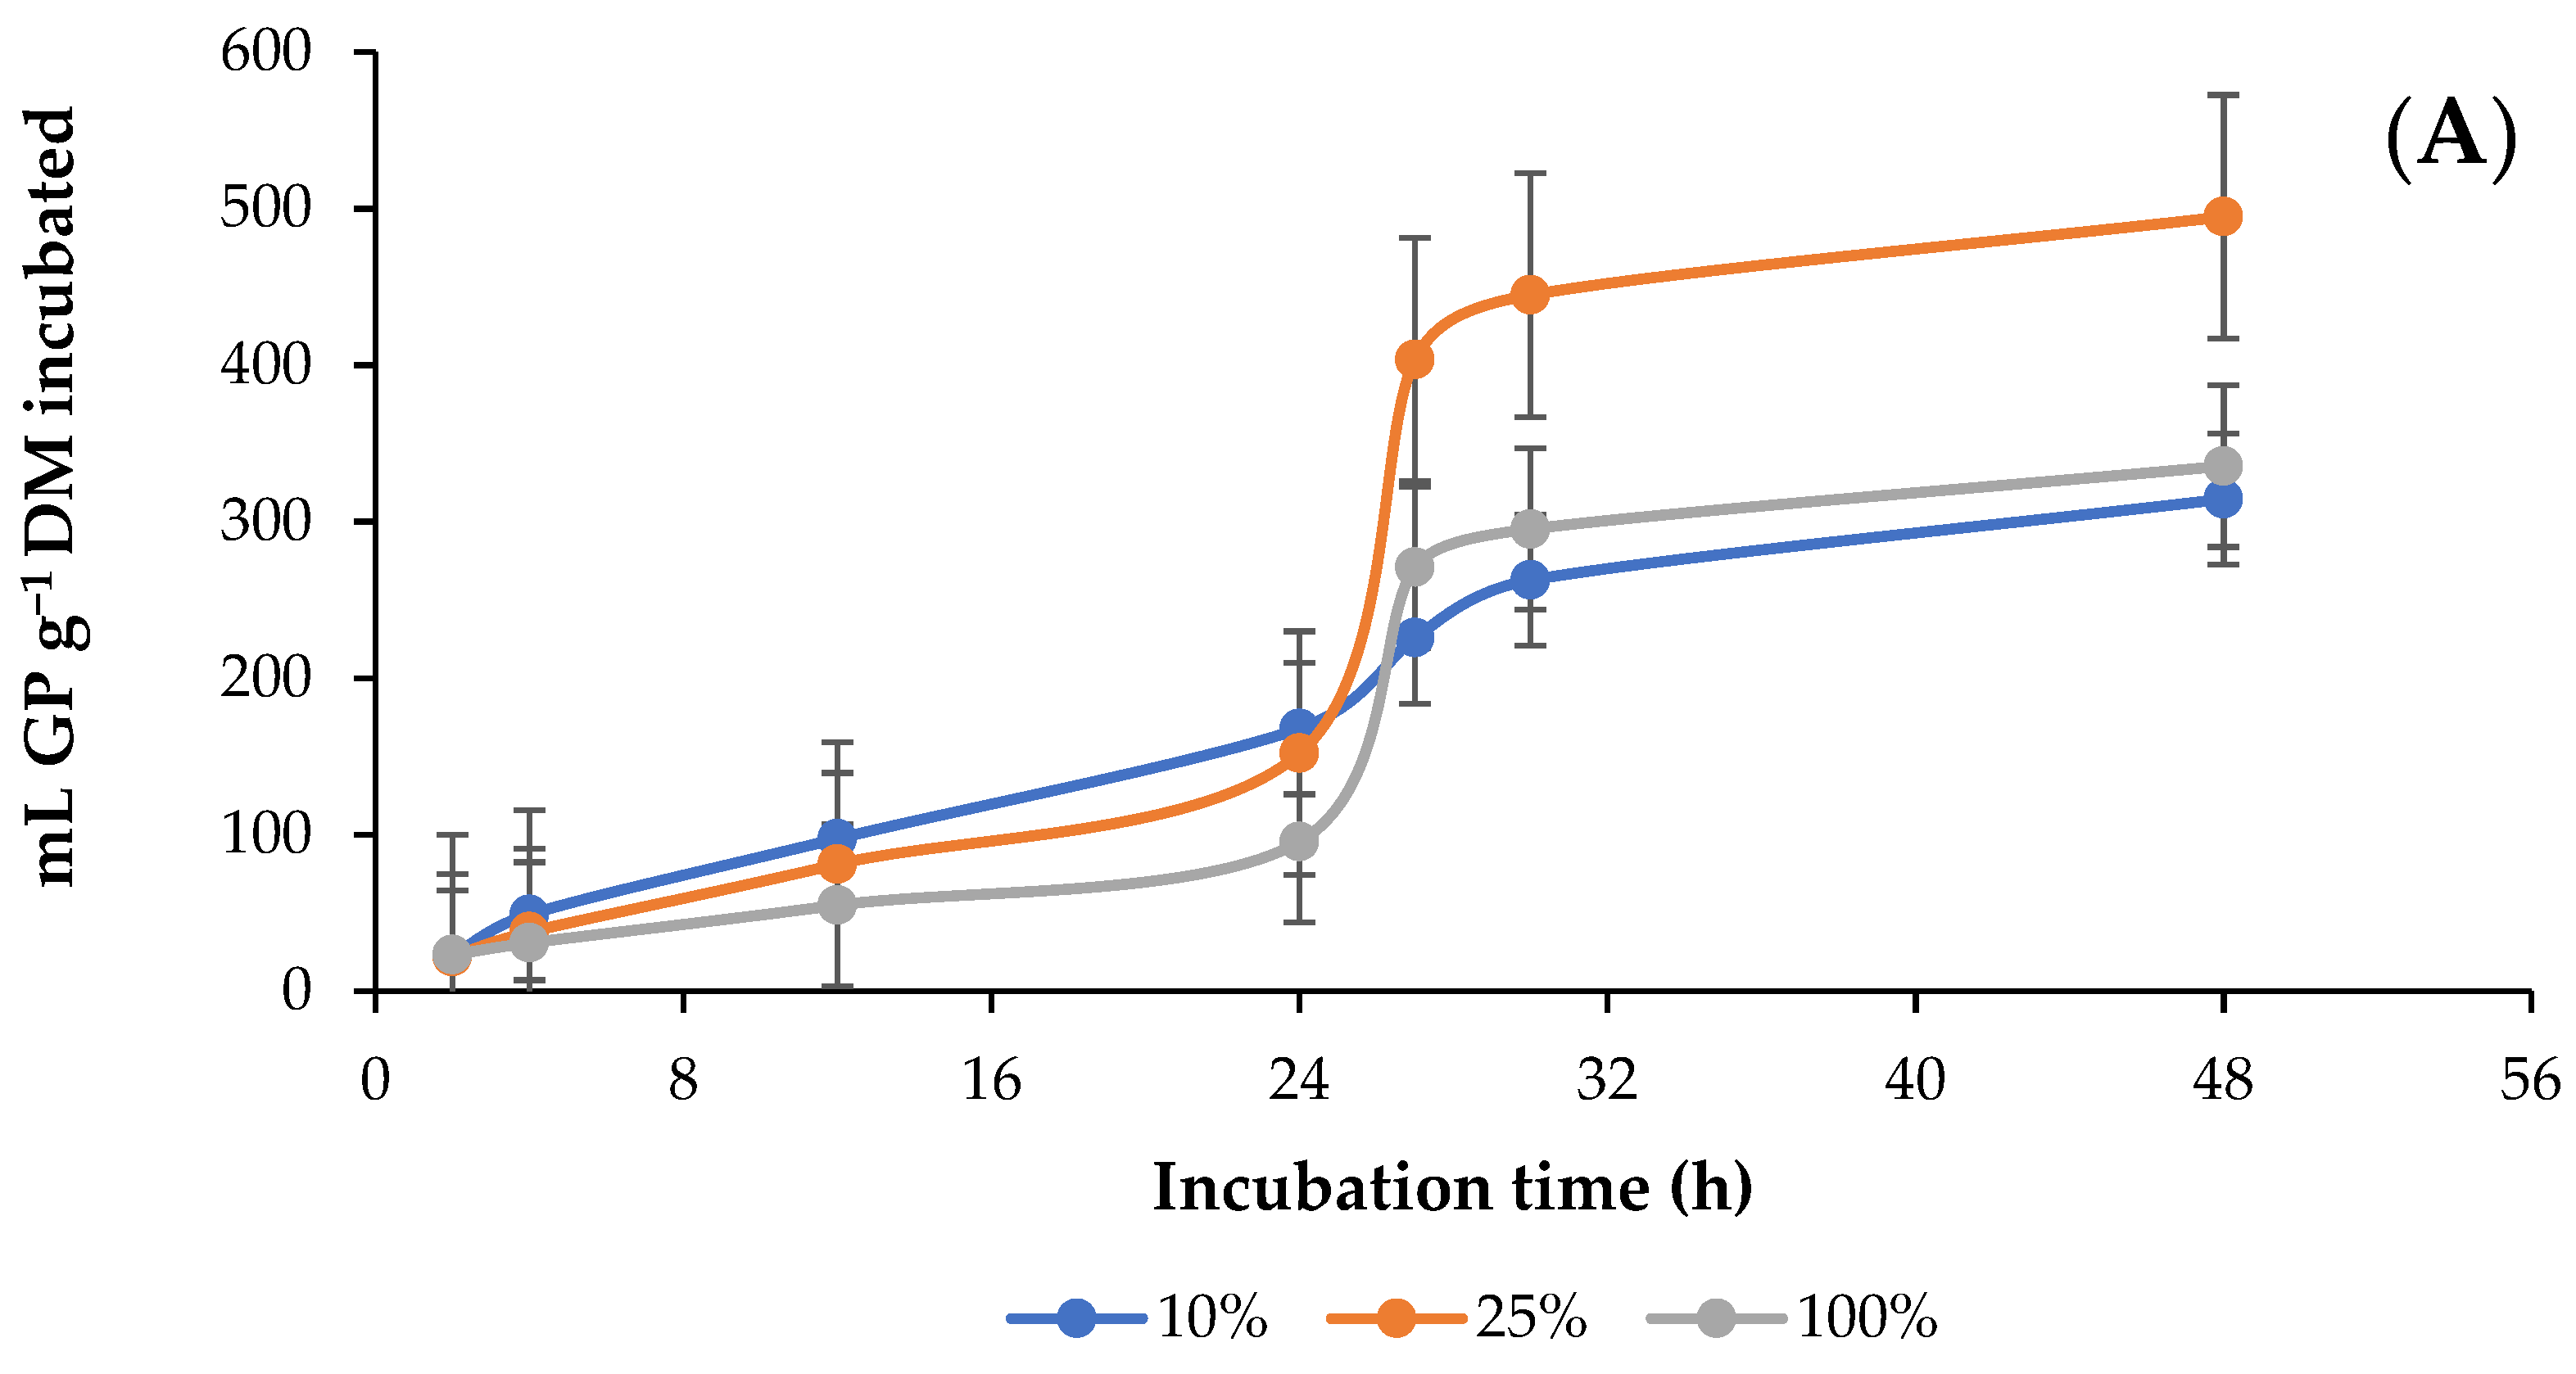
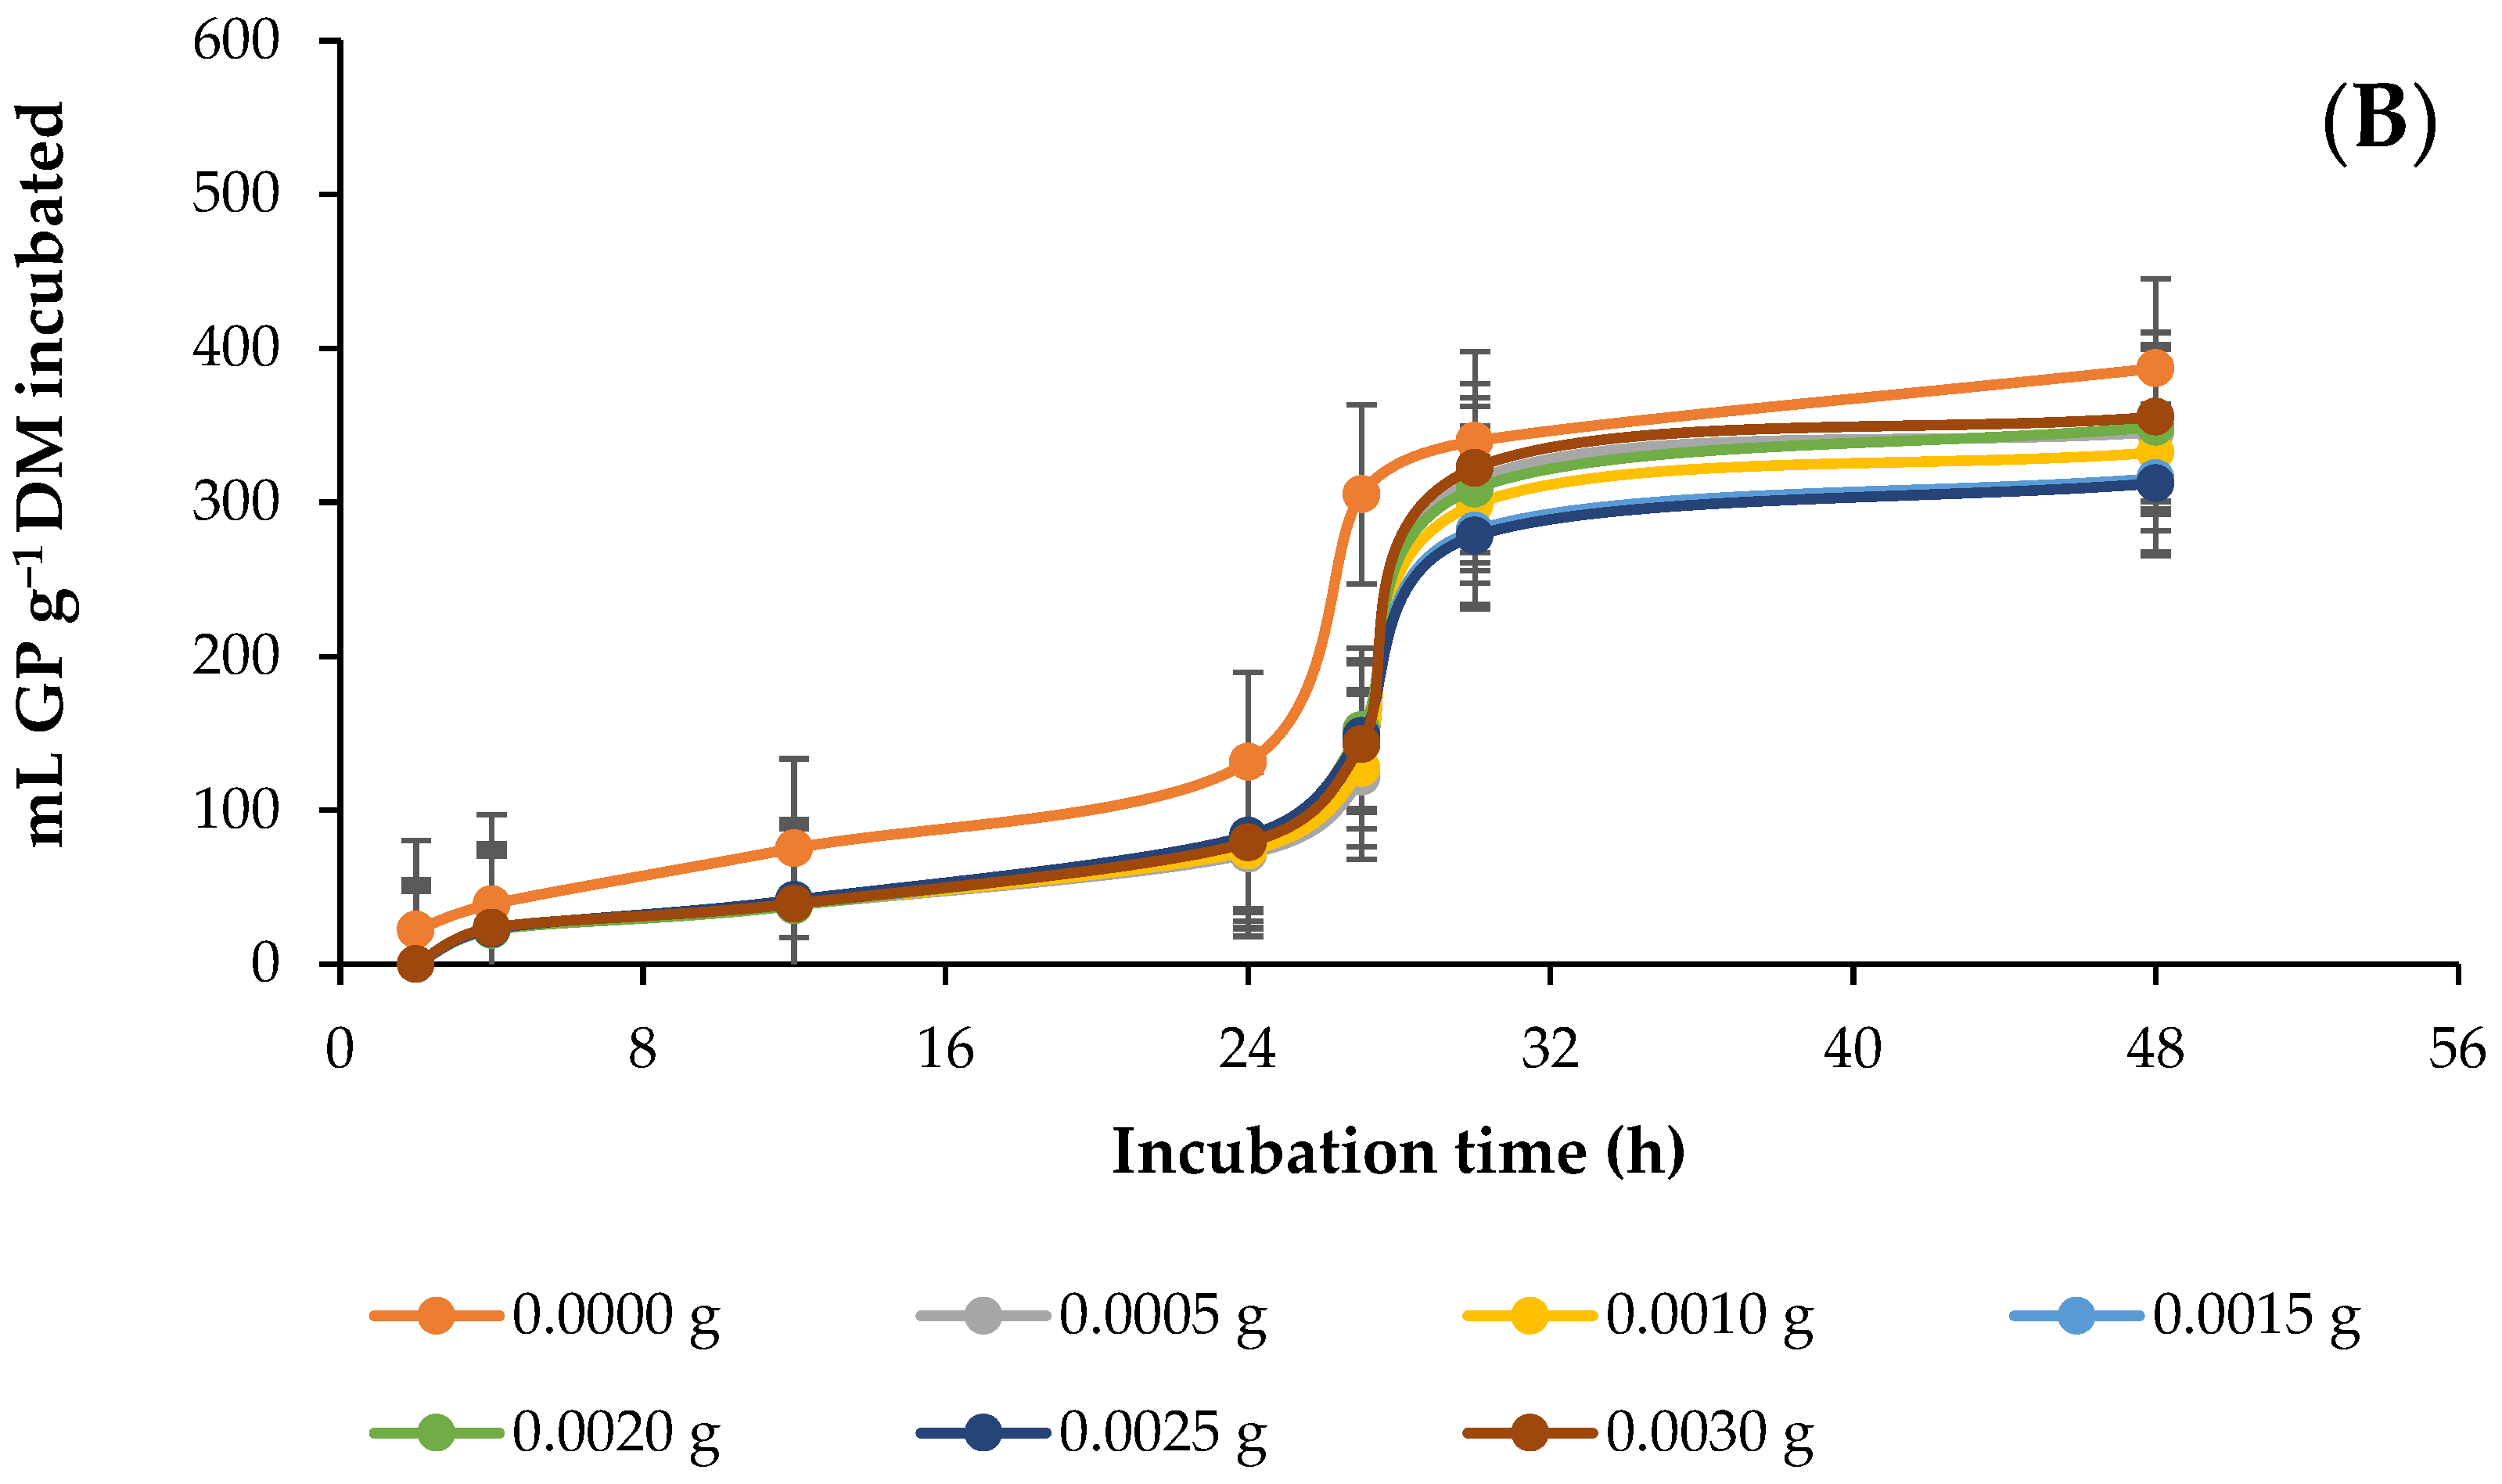
3.1. In Vitro Ruminal Total Gas (GP) Production
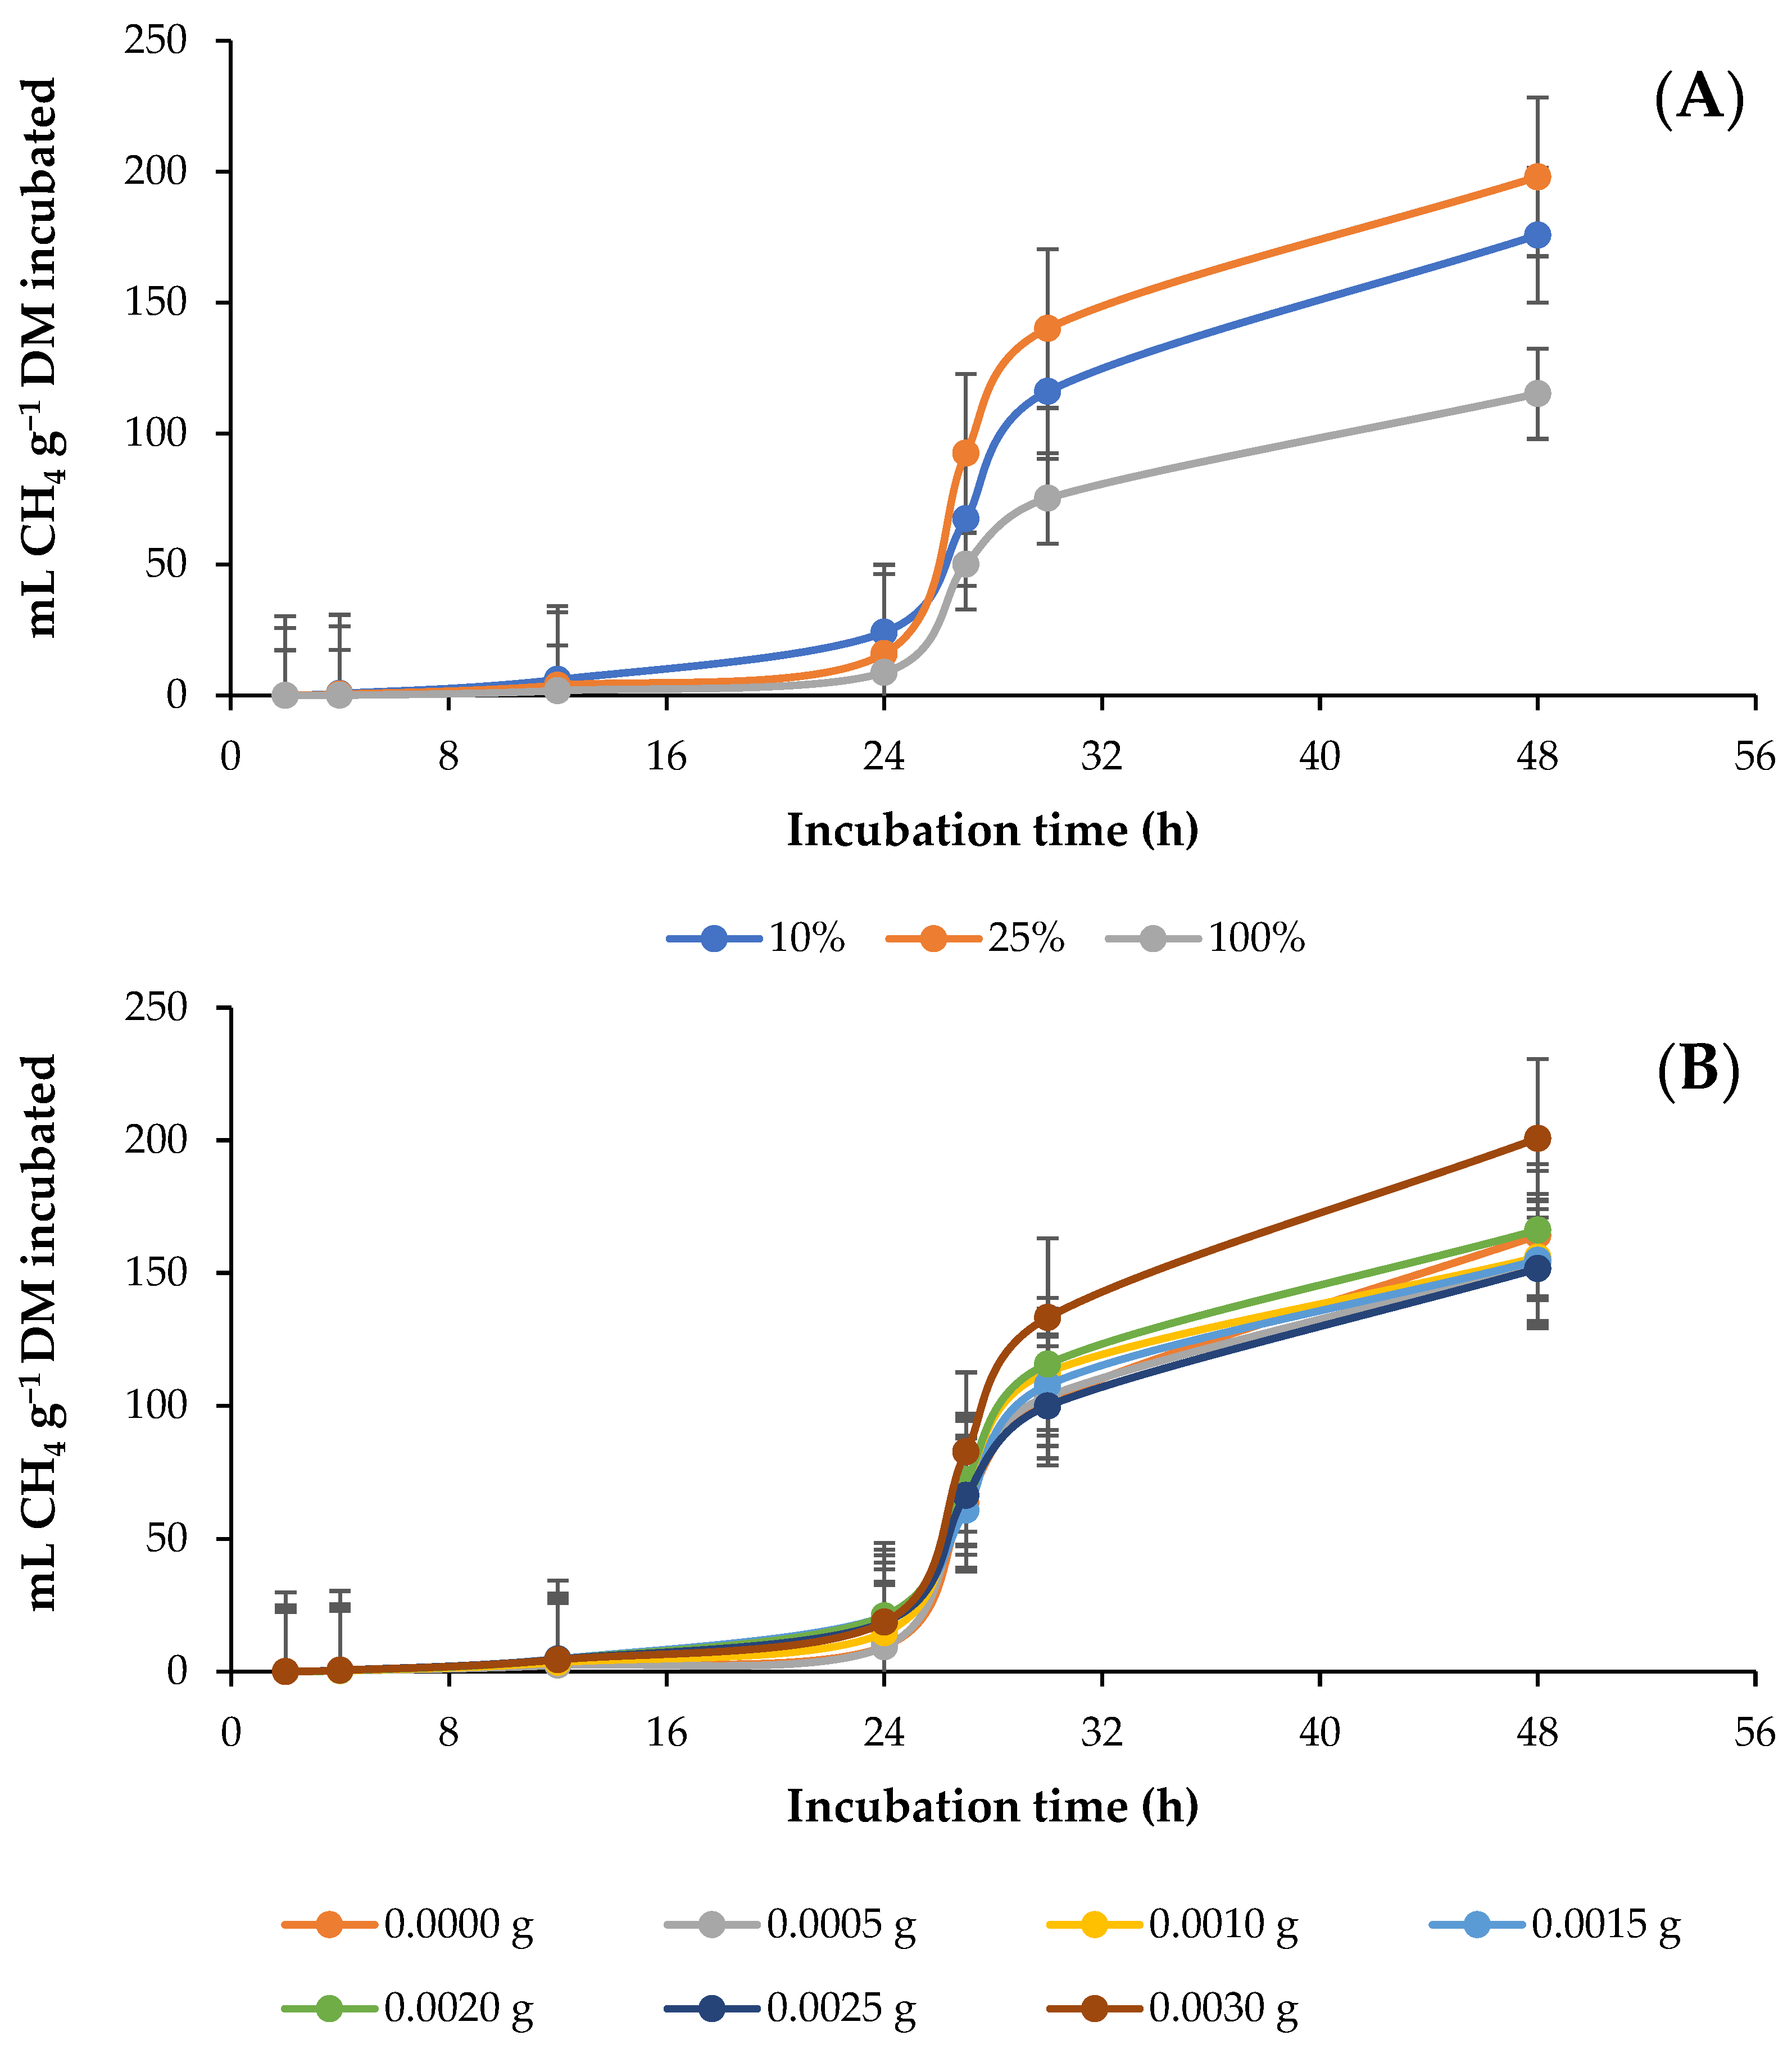
3.2. In Vitro Ruminal Methane (CH4) Production
3.3. In Vitro Ruminal Carbon Monoxide (CO) Production
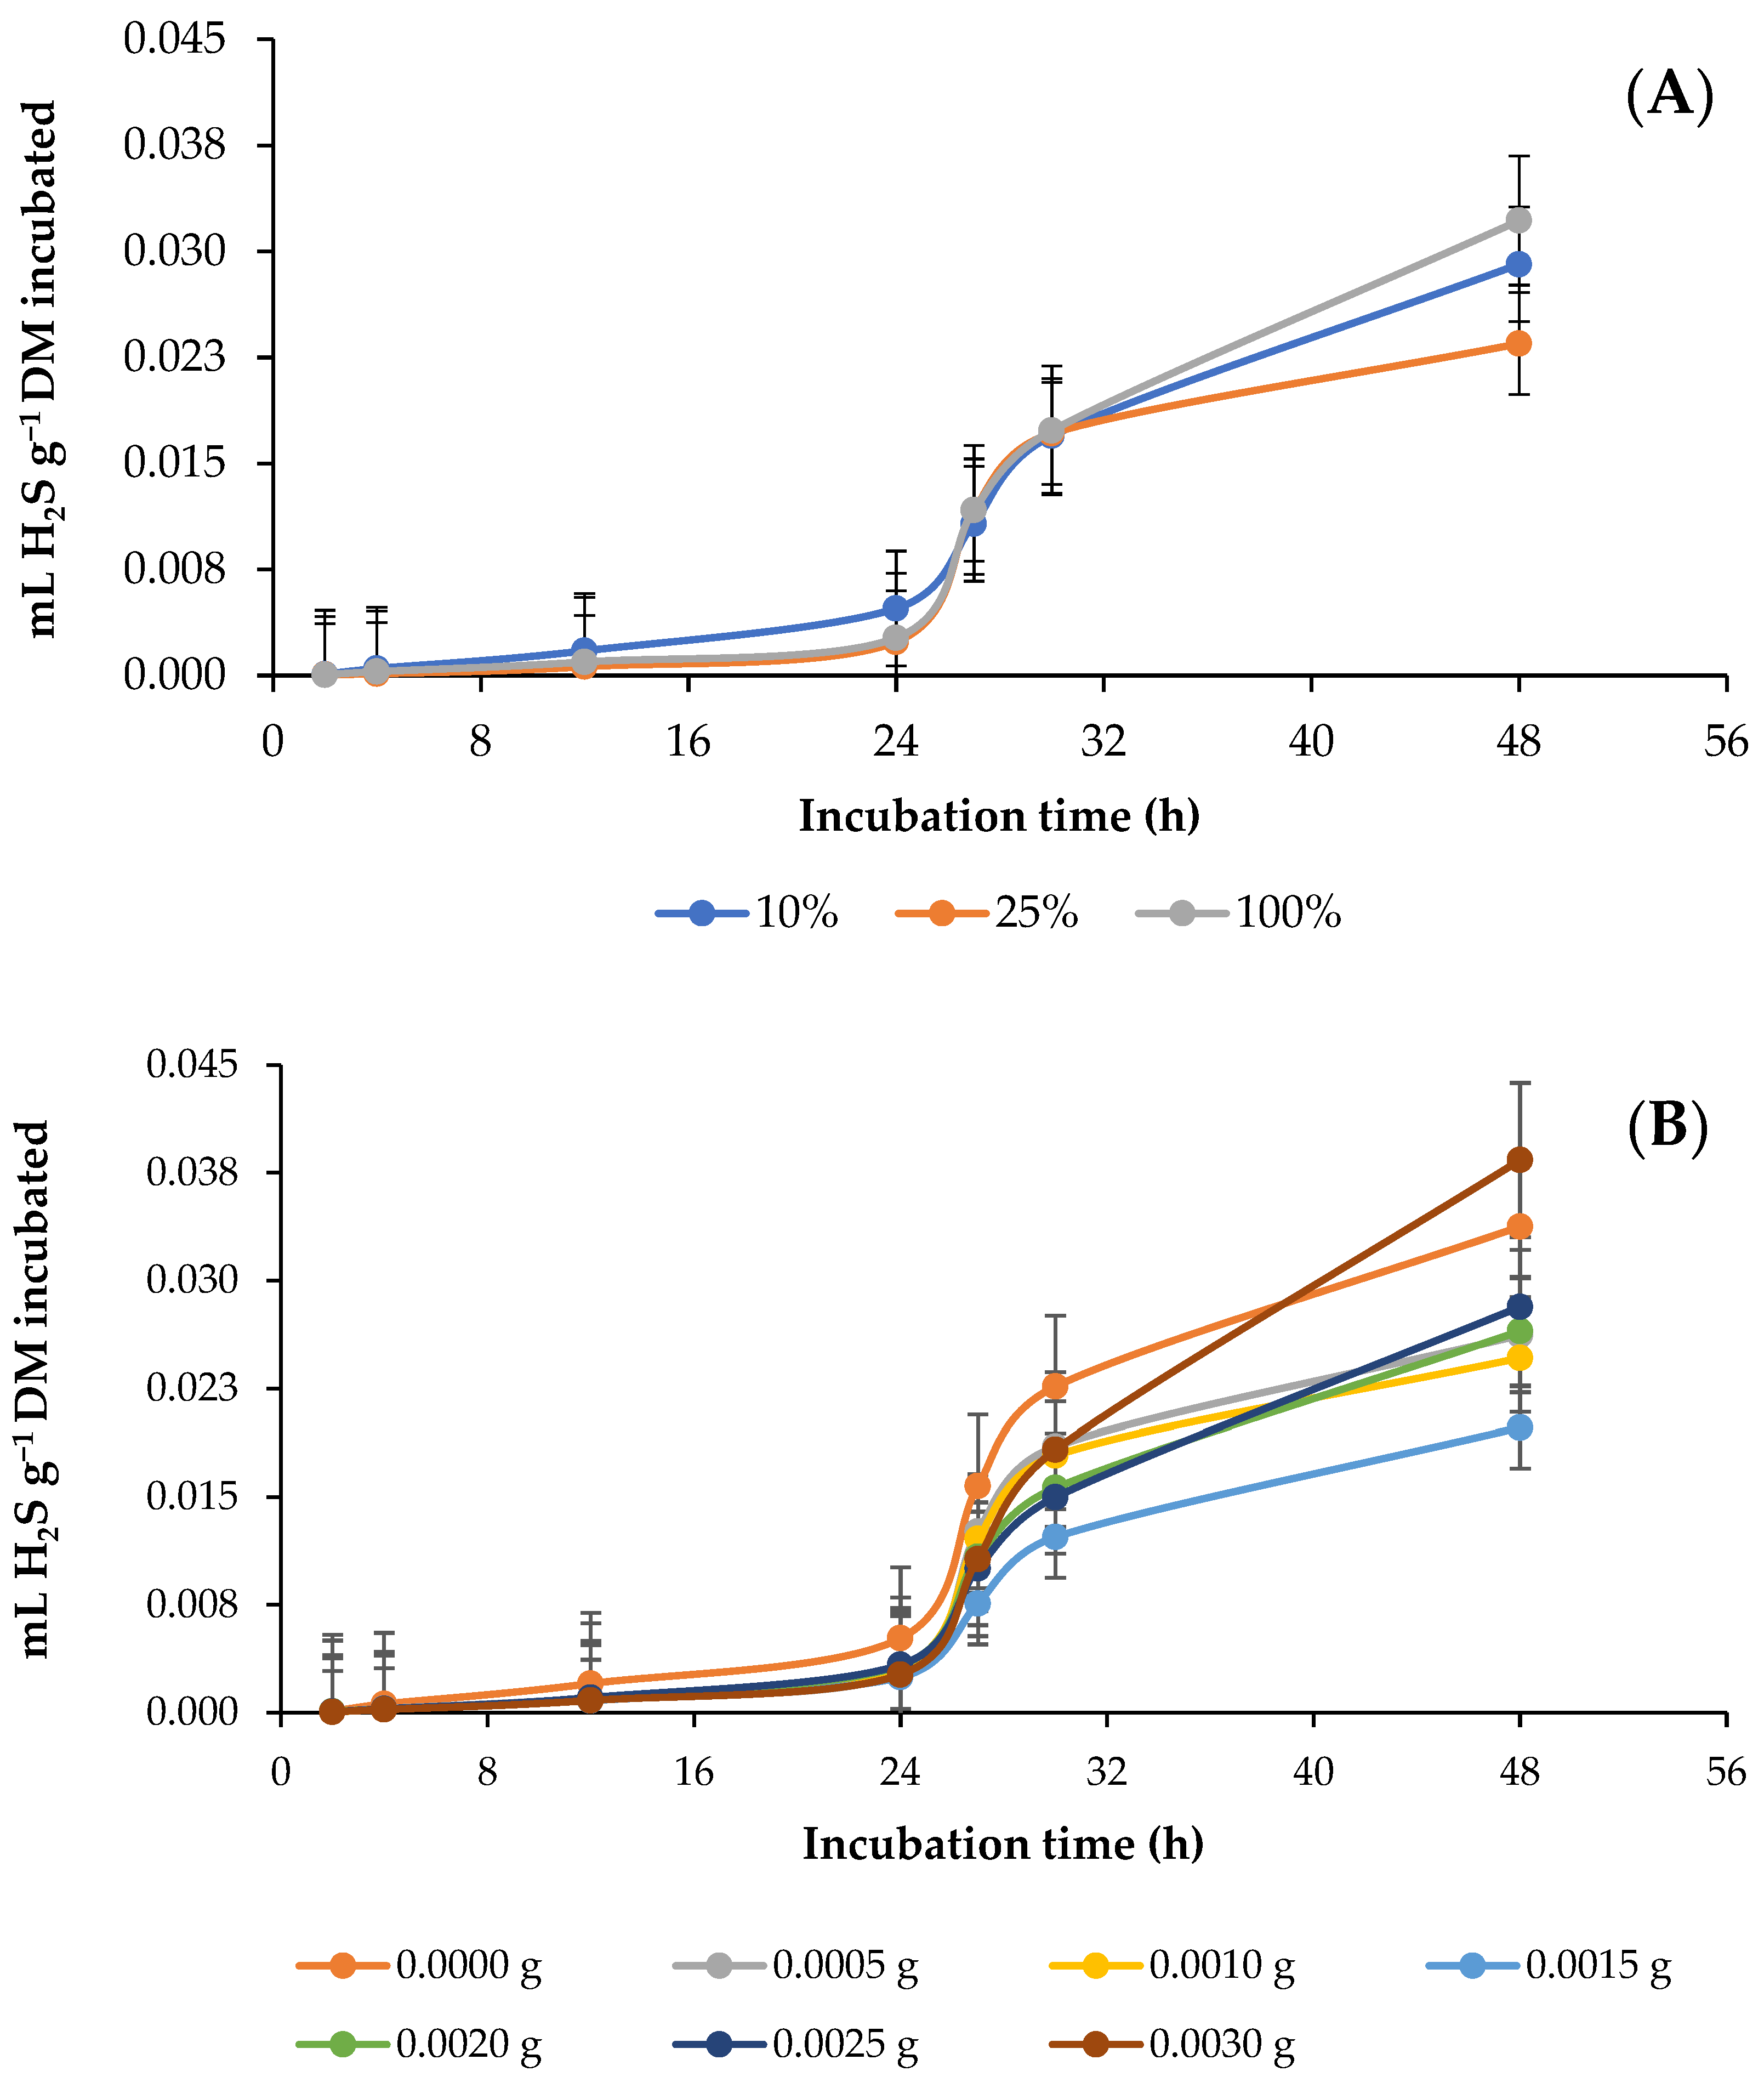
3.4. In Vitro Ruminal Hydrogen Sulfide (H2S) Production
3.5. In Vitro Rumen Fermentation Profile and CH4 Conversion Efficiency
4. Discussion
4.1. In Vitro Ruminal Total Gas Production
4.2. In Vitro Ruminal Methane (CH4) Production
4.3. In Vitro Ruminal Carbon Monoxide Production
4.4. In Vitro Ruminal Hydrogen Sulfide (H2S) Production
4.5. In Vitro Rumen Fermentation Profile and CH4 Conversion Efficiency
5. Conclusions
Author Contributions
Funding
Institutional Review Board Statement
Informed Consent Statement
Data Availability Statement
Conflicts of Interest
References
- Zhang, Q.; Wu, S.; Zou, X.; Ruan, S.; Kholif, A.E.; Hu, L.; Chen, H.; Zhou, W. Effects of Neolamarckia cadamba leaves extract on methanogenesis, microbial community in the rumen and digestibility of stylo silage. J. Clean. Prod. 2022, 369, 133338. [Google Scholar] [CrossRef]
- Ebeid, H.M.; Mengwei, L.; Kholif, A.E.; Hassan, F.U.; Lijuan, P.; Xin, L.; Chengjian, Y. Moringa oleifera oil modulates rumen microflora to mediate in vitro fermentation kinetics and methanogenesis in total mix rations. Curr. Microbiol. 2020, 77, 1271–1282. [Google Scholar] [CrossRef]
- Hristov, A.N.; Oh, J.; Firkins, J.L.; Dijkstra, J.; Kebreab, E.; Waghorn, G.; Makkar, H.P.S. SPECIAL TOPICS—Mitigation of methane and nitrous oxide emissions from animal operations: I. A review of enteric methane mitigation options 1. J. Anim. Sci. 2013, 91, 5045–5069. [Google Scholar] [CrossRef]
- Schulmeister, T.M.; Ruiz-Moreno, M.; Benitez, J.; Ponce, C.H.; Lamb, G.C.; DiLorenzo, N. Potential of cull banana fruit at two maturity stages as a feed supplement for cattle: Effects on in vitro ruminal fermentation, kinetics of gas production and digestibility. Waste Biomass Valorization 2020, 11, 6689–6695. [Google Scholar] [CrossRef]
- Qian, K.; Xu, J.; Zu, H.C.; Cong, Y.Y. Research progress of rumen hydrogen sulfide production in ruminants. Anim. Sci. J. 2020, 91, e13349. [Google Scholar] [CrossRef] [PubMed]
- Binversie, E.Y.; Ruiz-Moreno, M.; Carpenter, A.J.; Heins, B.J.; Crawford, G.I.; Di Costanzo, A.; Stern, M.D. Effects of dietary roughage and sulfur in diets containing corn dried distillers grains with solubles on hydrogen sulfide production and fermentation by rumen microbes in vitro. J. Anim. Sci. 2016, 94, 3883–3893. [Google Scholar] [CrossRef] [PubMed]
- Galyean, M.L.; Hales, K.E. Feeding Management Strategies to Mitigate Methane and Improve Production Efficiency in Feedlot Cattle. Animals 2023, 13, 758. [Google Scholar] [CrossRef]
- Li, S.Y.; Wang, C.; Wu, Z.Z.; Liu, Q.; Guo, G.; Huo, W.J.; Zhang, J.; Chen, L.; Zhang, Y.L.; Pei, C.X.; et al. Effects of guanidinoacetic acid supplementation on growth performance, nutrient digestion, rumen fermentation and blood metabolites in Angus bulls. Animal 2020, 12, 2535–2542. [Google Scholar] [CrossRef]
- Chen, T.; Wang, B.; Power, R.C.; Jiang, H. The first archaeobotanical evidence of Medicago sativa L. in China: Hay fodder for livestock. Archaeol. Anthropol. Sci. 2020, 12, 2. [Google Scholar] [CrossRef]
- Zhang, Q.; Yu, Z.; Wang, X.G.; Na, R.S. Effects of chlorpyrifos and chlorantraniliprole on fermentation quality of alfalfa (Medicago sativa L.) silage inoculated with or without Lactobacillus plantarum LP. Anim. Sci. J. 2017, 3, 456–462. [Google Scholar] [CrossRef]
- Al-Dobaib, S.N. Effect of different levels of Quebracho tannin on nitrogen utilization and growth performance of Najdi sheep fed alfalfa (Medicago sativa) hay as a sole diet. Anim. Sci. J. 2009, 80, 532–541. [Google Scholar] [CrossRef]
- Chiquiní-Medina, R.A.; Castillo-Águilar, C.C.; Hernández-Sánchez, D.; Torres-Hernández, G.; Delgado-Licon, E. Alfalfa (Medicago sativa L.) grown in Campeche, Mexico, and its local integration in the diet of confined lambs. Agroproductividad 2018, 11, 69–74. [Google Scholar]
- McDonald, I.; Baral, R.; Min, D. Effects of alfalfa and alfalfa-grass mixtures with nitrogen fertilization on dry matter yield and forage nutritive value. J. Anim. Sci. Technol. 2021, 63, 305. [Google Scholar] [CrossRef]
- Alhidary, I.A.; Abdelrahman, M.M.; Alyemni, A.H.; Khan, R.U.; Al-Saiady, M.Y.; Amran, R.A.; Alshamiry, F.A. Effect of alfalfa hay on growth performance, carcass characteristics, and meat quality of growing lambs with ad libitum access to total mixed rations. Rev. Bras. Zootec. 2016, 45, 302–308. [Google Scholar] [CrossRef]
- Canton-Castillo, J.G.; Moguel-Ordoñez, Y.; Alcaraz-Romero, A.; Piña-Cardenas, B.; Betancur-Ancona, D. Effect of inclusion of alfalfa hay in the diet and gender on carcass and meat characteristics of Katahdin × Pelibuey lambs. J. Appl. Poult. Res. 2022, 50, 702–707. [Google Scholar] [CrossRef]
- Ripoll, G.; Albertí, P.; Joy, M. Influence of alfalfa grazing-based feeding systems on carcass fat colour and meat quality of light lambs. Meat Sci. 2012, 90, 457–464. [Google Scholar] [CrossRef]
- Rafińska, K.; Pomastowski, P.; Wrona, O.; Górecki, R.; Buszewski, B. Medicago sativa as a source of secondary metabolites for agriculture and pharmaceutical industry. Phytochem. Lett. 2017, 20, 520–539. [Google Scholar] [CrossRef]
- Krakowska, A.; Rafińska, K.; Walczak, J.; Buszewski, B. Enzyme-assisted optimized supercritical fluid extraction to improve Medicago sativa polyphenolics isolation. Ind. Crops Prod. 2018, 124, 931–940. [Google Scholar] [CrossRef]
- Plaizier, J.C. Replacing chopped alfalfa hay with alfalfa silage in barley grain and alfalfa-based total mixed rations for lactating dairy cows. J. Dairy Sci. 2004, 87, 2495–2505. [Google Scholar] [CrossRef]
- Xue, Z.; Liu, N.; Wang, Y.; Yang, H.; Wei, Y.; Moriel, P.; Palmer, E.; Zhang, Y. Combining Orchard grass and Alfalfa: Effects of forage ratios on in vitro rumen degradation and fermentation characteristics of silage compared with hay. Animals 2019, 10, 59. [Google Scholar] [CrossRef]
- Lu, Y.F.; Zou, T.D.; Wang, Z.R.; Yang, J.; Li, L.H.; Guo, X.B. Dietary guanidinoacetic acid improves the growth performance and skeletal muscle development of finishing pigs through changing myogenic gene expression and myofibre characteristics. J. Anim. Physiol. Anim. Nutr. 2020, 104, 1875–1883. [Google Scholar] [CrossRef] [PubMed]
- Ren, G.; Hao, X.; Zhang, X.; Liu, S.; Zhang, J. Effects of guanidinoacetic acid and betaine on growth performance, energy and nitrogen metabolism, and rumen microbial protein synthesis in lambs. Anim. Feed Sci. Technol. 2022, 292, 115402. [Google Scholar] [CrossRef]
- EFSA Panel on Additives and Products or Substances used in Animal Feed (FEEDAP); Bampidis, V.; Azimonti, G.; Bastos, M.D.L.; Christensen, H.; Dusemund, B.; Fasmon-Durjava, M.; Kouba, M.; Lòpez-Alonso, M.; Puente, S.L.; et al. Safety and efficacy of a feed additive consisting of guanidinoacetic acid for all animal species (Alzchem Trostberg GmbH). EFSA J. 2022, 20, e07269. [Google Scholar] [CrossRef]
- Li, Z.; Liang, H.; Xin, J.; Xu, L.; Li, M.; Yu, H.; Zhang, W.; Ge, Y.; Li, Y.; Qu, M. Effects of dietary guanidinoacetic acid on the feed efficiency, blood measures, and meat quality of jinjiang bulls. Front. Vet. Sci. 2021, 8, 684295. [Google Scholar] [CrossRef] [PubMed]
- Chao, Y.; Liu, B.; Kou, Q.; Niu, W.; Jiang, H.; Yang, L.; Zhang, G. Effects of guanidine acetic acid on growth performance, slaughter performance, fat deposition and nutritional components in muscle of stabling Tan sheep. Chin. J. Clin. Nutr. 2019, 31, 388–394. [Google Scholar] [CrossRef]
- Li, W.-J.; Wu, Q.-C.; Cui, Z.-Y.; Jiang, Y.-W.; Aisikaer, A.; Zhang, F.; Chen, H.-W.; Wang, W.-K.; Wang, Y.-L.; Lv, L.-K.; et al. Guanidine acetic acid exhibited greater growth performance in younger (13–30 kg) than in older (30–50 kg) lambs under high-concentrate feedlotting pattern. Front. Vet. Sci. 2022, 1134, 954675. [Google Scholar] [CrossRef]
- Liu, C.; Wang, C.; Zhang, J.; Liu, Q.; Guo, G.; Huo, W.J.; Pei, C.X.; Chen, L.; Zhang, Y.L. Guanidinoacetic acid and betaine supplementation have positive effects on growth performance, nutrient digestion and rumen fermentation in Angus bulls. Anim. Feed Sci. Technol. 2021, 276, 114923. [Google Scholar] [CrossRef]
- AOAC—Association of Official Analytical Chemists. Official Methods of Analysis, 16th ed.; AOAC: Arlington, VA, USA, 1997. [Google Scholar]
- Van Soest, P.V.; Robertson, J.B.; Lewis, B.A. Methods for dietary fiber, neutral detergent fiber, and nonstarch polysaccharides in relation to animal nutrition. J. Dairy Sci. 1991, 74, 3583–3597. [Google Scholar] [CrossRef] [PubMed]
- Goering, H.K.; Van Soest, P.J. Forage Fiber Analyses (Apparatus, Reagents, Procedures, and Some Applications); US Agricultural Research Service: Washington, DC, USA, 1970; p. 379.
- Theodorou, M.K.; Williams, B.A.; Dhanoa, M.S.; McAllan, A.B.; France, J. A simple gas production method using a pressure transducer to determine the fermentation kinetics of ruminant feeds. Anim. Feed Sci. Technol. 1994, 48, 185–197. [Google Scholar] [CrossRef]
- Acosta, J.A.D.; Elghandour, M.M.; Mariezcurrena-Berasain, M.D.; Adegbeye, M.J.; Fajemisin, A.N.; Pliego, A.B.; Salem, A.Z. Effect of mid-term dietary administration of the Caesalpinia coriaria extract on the sustainable mitigation of equine fecal methane, carbon monoxide and hydrogen sulfide production. J. Equine Vet. Sci. 2022, 115, 104021. [Google Scholar] [CrossRef]
- Tagliapietra, F.; Cattani, M.; Bailoni, L.; Schiavon, S. In vitro rumen fermentation: Effect of headspace pressure on the gas production kinetics of corn meal and meadow hay. Anim. Feed Sci. Technol. 2010, 158, 197–201. [Google Scholar] [CrossRef]
- Alvarado-Ramírez, E.R.; Maggiolino, A.; Elghandour, M.M.M.Y.; Rivas-Jacobo, M.A.; Ballesteros-Rodea, G.; Palo, P.D.; Salem, A.Z.M. Impact of co-ensiling of maize with Moringa oleifera on the production of greenhouse gases and the characteristics of fermentation in ruminants. Animals 2023, 13, 764. [Google Scholar] [CrossRef]
- SAS (Statistical Analysis System). User’s Guide: Statistics; Ver 9.0; SAS Institute: Cary, NC, USA, 2002. [Google Scholar]
- France, J.; Dijkstra, J.; Dhanoa, M.S.; Lopez, S.; Bannink, A. Estimating the extent of degradation of ruminant feeds from a description of their gas production profiles observed in vitro: Derivation of models and other mathematical considerations. Br. J. Nutr. 2000, 2, 143–150. [Google Scholar] [CrossRef]
- Menke, K.H.; Raab, L.; Salewski, A.; Steingass, H.; Fritz, D.; Schneider, W. The estimation of the digestibility and metabolizable energy content of ruminant feeding stuffs from the gas production when they are incubated with rumen liquor in vitro. J. Agric. Sci. 1979, 93, 217–222. [Google Scholar] [CrossRef]
- Getachew, G.; Makkar, H.P.S.; Becker, K. Tropical browses: Contents of phenolic compounds, in vitro gas production and stoichiometric relationship between short chain fatty acid and in vitro gas production. J. Agric. Sci. 2002, 139, 341–352. [Google Scholar] [CrossRef]
- Soltan, Y.; Morsy, A.; Hashem, N.; Elazab, M.; Sultan, M.; Marey, H.; Lail, G.A.E.; El-Desoky, N.; Hosny, N.; Mahdy, A.; et al. Modified nano-montmorillonite and monensin modulate in vitro ruminal fermentation, nutrient degradability, and methanogenesis differently. Animals 2021, 11, 3005. [Google Scholar] [CrossRef] [PubMed]
- Owens, F.N.; Basalan, M. Ruminal Fermentation. In Rumenology; Millen, D., De Beni Arrigoni, M., Lauritano Pacheco, R., Eds.; Springer: Cham, Switzerland, 2016; pp. 63–102. [Google Scholar] [CrossRef]
- Faniyi, T.O.; Adewumi, M.K.; Jack, A.A.; Adegbeye, M.J.; Elghandour, M.M.Y.; Barbabosa-Pliego, A.; Salem, A.Z.M. Extracts of herbs and spices as feed additives mitigate ruminal methane production and improve fermentation characteristics in West African Dwarf sheep. Trop. Anim. Health Prod. 2021, 53, 312. [Google Scholar] [CrossRef]
- Kholif, A.E.; Gouda, G.A.; Morsy, T.A.; Matloup, O.H.; Fahmy, M.; Gomaa, A.S.; Patra, A.K. Dietary date palm leaves ensiled with fibrolytic enzymes decreased methane production, and improved feed degradability and fermentation kinetics in a ruminal in vitro system. Waste Biomass Valorization 2022, 13, 3475–3488. [Google Scholar] [CrossRef]
- Morsy, T.A.; Gouda, G.A.; Kholif, A.E. In vitro fermentation and production of methane and carbon dioxide from rations containing Moringa oleifera leave silage as a replacement of soybean meal: In vitro assessment. Environ. Sci. Pollut. Res. 2022, 29, 69743–69752. [Google Scholar] [CrossRef] [PubMed]
- Alvarado-Ramírez, E.R.; Andrade-Yucailla, V.; Elghandour, M.M.M.Y.; Acosta-Lozano, N.; Rivas-Jacobo, M.A.; López-Aguirre, D.; Garay-Martínez, J.R.; Vázquez-Mendoza, P.; Barros-Rodríguez, M.; Salem, A.Z.M. Effects of Guanidinoacetic Acid on Ruminal Fermentation and Greenhouse Gas Production Using Fresh Forage and Silage from Different Maize (Zea mays L.) Genotypes. Fermentation 2023, 9, 437. [Google Scholar] [CrossRef]
- Ren, G.D.; Hao, X.Y.; Zhang, X.Z.; Liu, S.; Zhang, H.X.; Tian, G.Y.; Zhang, J.X. Effects of Guanidinoacetic Acid and Betaine Supplementation on Growth Performance, Rumen Fermentation and Blood Metabolites in Lambs. Sci. Agric. Sin. 2023, 56, 766–778. [Google Scholar]
- Sucu, E. Effects of microalgae species on in vitro rumen fermentation pattern and methane production. Ann. Anim. Sci. 2020, 20, 207–218. [Google Scholar] [CrossRef]
- Li, W.; Cui, Z.; Jiang, Y.; Aisikaer, A.; Wu, Q.; Zhang, F.; Wang, W.; Bo, Y.; Yang, H. Dietary Guanidine Acetic Acid Improves Ruminal Antioxidant Capacity and Alters Rumen Fermentation and Microflora in Rapid-Growing Lambs. Antioxidants 2023, 12, 772. [Google Scholar] [CrossRef] [PubMed]
- Liu, Y.; Zhang, J.; Wang, C.; Guo, G.; Huo, W.; Xia, C.; Chen, L.; Zhang, Y.; Pei, C.; Liu, Q. Effects of guanidinoacetic acid supplementation on lactation performance, nutrient digestion and rumen fermentation in Holstein dairy cows. J. Sci. Food Agric. 2022, 103, 1522–1529. [Google Scholar] [CrossRef]
- Wang, K.; Xiong, B.; Zhao, X. Could propionate formation be used to reduce enteric methane emission in ruminants? Sci. Total Environ. 2022, 855, 158867. [Google Scholar] [CrossRef]
- Patra, A.; Park, T.; Kim, M.; Yu, Z. Rumen methanogens and mitigation of methane emission by anti-methanogenic compounds and substances. J. Anim. Sci. Biotechnol. 2017, 8, 1–18. [Google Scholar] [CrossRef]
- Li, T.T.; Wang, J.L.; Zhang, N.Z.; Li, W.H.; Yan, H.B.; Li, L.; Jia, W.Z.; Fu, B.Q. Rapid and visual detection of Trichinella spp. Using a lateral flow strip-based recombinase polymerase amplification (LF-RPA) assay. Front. Cell. Infect. Microbiol. 2019, 9, 1. [Google Scholar] [CrossRef]
- Choudhury, P.K.; Jena, R.; Tomar, S.K.; Puniya, A.K. Reducing Enteric Methanogenesis through Alternate Hydrogen Sinks in the Rumen. Methane 2022, 1, 320–341. [Google Scholar] [CrossRef]
- Mills, J.A.N.; Dijkstra, J.; Bannink, A.; Cammell, S.B.; Kebreab, E.; France, J.A. Mechanistic model of whole-tract digestion and methanogenesis in the lactating dairy cow: Model development, evaluation, and application. J. Anim. Sci. 2001, 79, 1584–1597. [Google Scholar] [CrossRef]
- Kholif, A.E.; Olafadehan, O.A. Essential oils and phytogenic feed additives in ruminant diet: Chemistry, ruminal microbiota and fermentation, feed utilization and productive performance. Phytochem. Rev. 2021, 20, 1087–1108. [Google Scholar] [CrossRef]
- Wu, H.; Li, Y.; Meng, Q.; Zhou, Z. Effect of high sulfur diet on rumen fermentation, microflora, and epithelial barrier function in steers. Animals 2021, 11, 2545. [Google Scholar] [CrossRef]
- Zhao, Y.; Xie, B.; Gao, J.; Zhao, G. Dietary supplementation with sodium sulfate improves rumen fermentation, fiber digestibility, and the plasma metabolome through modulation of rumen bacterial communities in steers. Appl. Environ. Microbiol. 2020, 86, e01412-20. [Google Scholar] [CrossRef]
- Haarstad, K.; Bergersen, O.; Sørheim, R. Occurrence of carbon monoxide during organic waste degradation. J. Air Waste Manag. Assoc. 2006, 56, 575–580. [Google Scholar] [CrossRef]
- Ragsdale, S.W. Enzymology of the Wood-Ljungdahl pathway of acetogenesis. Ann. N. Y. Acad. Sci. 2008, 1125, 129–136. [Google Scholar] [CrossRef] [PubMed]
- Biester, A.; Marcano-Delgado, A.N.; Drennan, C.L. Structural Insights into Microbial One-Carbon Metabolic Enzymes Ni–Fe–S-Dependent Carbon Monoxide Dehydrogenases and Acetyl-CoA Synthases. Biochemistry 2022, 61, 2797–2805. [Google Scholar] [CrossRef]
- Speer, H.F.; Pearl, K.A.; Titgemeyer, E.C. Relative bioavailability of guanidinoacetic acid delivered tilizati or abomasally to cattle. J. Anim. Sci. 2020, 98, skaa282. [Google Scholar] [CrossRef] [PubMed]
- Ragsdale, S.W. Life with carbon monoxide. Crit. Rev. Biochem. Mol. Biol. 2004, 39, 165–195. [Google Scholar] [CrossRef] [PubMed]
- Techtmann, S.M.; Colman, A.S.; Robb, F.T. ‘That which does not kill us only makes us stronger’: The role of carbon monoxide in thermophilic microbial consortia. Environ. Microbiol. 2009, 11, 1027–1037. [Google Scholar] [CrossRef]
- Coleman, G.S. A sulfate-reducing bacterium from the sheep rumen. J. Gen. Microbiol. 1960, 22, 423–436. [Google Scholar] [CrossRef] [PubMed]
- Castro, D.J.; Cerón-Cucchi, M.E.; Ortiz-Chura, A.; Depetris, G.J.; Irazoqui, J.M.; Amadio, A.F.; Cantón, G.J. Ruminal effects of excessive dietary sulphur in feedlot cattle. J. Anim. Physiol. Anim. Nutr. 2021, 106, 978–987. [Google Scholar] [CrossRef] [PubMed]
- Smith, D.R.; DiLorenzo, N.; Leibovich, J.; May, M.L.; Quinn, M.J.; Homm, J.W.; Galyean, M.L. Effects of sulfur and monensin concentrations on in vitro dry matter disappearance, hydrogen sulfide production, and volatile fatty acid concentrations in batch culture ruminal fermentations. J. Anim. Sci. 2010, 88, 1503–1512. [Google Scholar] [CrossRef]
- Felix, T.L.; Murphy, T.A.; Loerch, S.C. Effects of dietary inclusion and NaOH treatment of dried distillers grains with solubles on ruminal metabolism of feedlot cattle. J. Anim. Sci. 2012, 90, 4951–4961. [Google Scholar] [CrossRef]
- Wu, H.; Meng, Q.; Yu, Z. Effect of pH buffering capacity and sources of dietary sulfur on rumen fermentation, sulfide production, methane production, sulfate reducing bacteria, and total Archaea in vitro rumen cultures. Bioresour. Technol. 2015, 186, 25–33. [Google Scholar] [CrossRef]
- Fang, H.H.; Liu, H. Effect of pH on hydrogen production from glucose by a mixed culture. Bioresour. Technol. 2002, 82, 87–93. [Google Scholar] [CrossRef] [PubMed]
- Penner, G.B. Influence of microbial ecology in the rumen and lower gut on production efficiency of dairy cows. In Proceedings of the Tri-State Dairy Nutrition Conference, Fort Wayne, IN, USA, 18–20 April 2016; pp. 75–81. [Google Scholar]
- Azar, M.S.; Doust-Nober, R.S.; Sis, N.M.; Shahryar, H.A.; Asadi, Y. Effects of Zataria multiflora extract as rumen modifier using in vitro gas production technique. Curr. Res. J. Biol. Sci. 2012, 4, 350–354. [Google Scholar]
- Shen, Z.; Seyfert, H.M.; Lohrke, B.; Schneider, F.; Zitnan, R.; Chudy, A. An energy rich diet causes rumen papillae proliferation associated with more IGF type1 receptors and increased plasma IGF-1 concentrations in young goats. J. Nutr. 2004, 134, 11–17. [Google Scholar] [CrossRef]
- Krause, K.M.; Oetzel, G.R. Understanding and preventing sub-acute ruminal acidosis in dairy herds: A review. Anim. Feed Sci. Technol. 2006, 126, 215–236. [Google Scholar] [CrossRef]
- Nemati, M.; Amanlou, H.; Khorvash, M.; Mirzaei, M.; Moshiri, B.; Ghaffari, M.H. Effect of different alfalfa hay levels on growth performance, rumen fermentation, and structural growth of Holstein dairy calves. J. Anim. Sci. 2016, 94, 1141–1148. [Google Scholar] [CrossRef] [PubMed]
- Huo, W.; Wang, X.; Wei, Z.; Zhang, H.; Liu, Q.; Zhang, S.; Wang, C.; Chen, L.; Xu, Q.; Guo, G. Effect of lactic acid bacteria on the ensiling characteristics and in vitro ruminal fermentation parameters of alfalfa silage. Ital. J. Anim. Sci. 2021, 20, 623–631. [Google Scholar] [CrossRef]
- Matthews, C.; Crispie, F.; Lewis, E.; Reid, M.; O’Toole, P.W.; Cotter, P.D. The rumen microbiome: A crucial consideration when tilizatio milk and meat production and nitrogen tilization efficiency. Gut. Microbes 2019, 10, 115–132. [Google Scholar] [CrossRef]
- Cui, Y.; Liu, H.; Gao, Z.; Xu, J.; Liu, B.; Guo, M.; Shi, Y. Whole-plant corn silage improves rumen fermentation and growth performance of beef cattle by altering rumen microbiota. Appl. Microbiol. Biotechnol. 2022, 106, 4187–4198. [Google Scholar] [CrossRef] [PubMed]
- Luo, Y.; Pfister, P.; Leisinger, T.; Wasserfallen, A. The genome of archaeal prophage ψM100 encodes the lytic enzyme responsible for autolysis of Methanothermobacter wolfeii. J. Bacteriol. 2001, 183, 5788–5792. [Google Scholar] [CrossRef] [PubMed]


| Item | Alfalfa Hay (%) | ||
|---|---|---|---|
| 10 | 25 | 100 | |
| Ingredients | |||
| Alfalfa hay | 10.0 | 25.0 | 100.0 |
| Wheat meal | 18.0 | 18.0 | |
| Maize | 21.5 | 6.5 | |
| Wheat bran | 12.0 | 12.0 | |
| Gluten feed | 16.3 | 16.3 | |
| Soybean meal | 7.0 | 10.0 | |
| Soybean husk | 8.1 | 5.1 | |
| Molasses | 7.0 | 7.0 | |
| Vit/Min | 0.1 | 0.1 | |
| Chemical composition | |||
| Organic matter (g kg−1 DM) | 946.3 | 942.9 | 969.0 |
| Crude protein (g kg−1 DM) | 130.9 | 130.7 | 155.0 |
| Neutral detergent fiber (g kg−1 DM) | 320.7 | 371.1 | 535.5 |
| Acid detergent fiber (g kg−1 DM) | 149.6 | 194.3 | 378.6 |
| Ether extract (g kg−1 DM) | 200.5 | 191.0 | 18.0 |
| Alfalfa Hay (%) | Dose of GAA (g g−1 Diet) | Gas Production (GP) | ||||||||
|---|---|---|---|---|---|---|---|---|---|---|
| Parameters 1 | mL GP g−1 DM Incubated | mL GP g−1 DM Degraded | ||||||||
| b | c | Lag | 4 h | 24 h | 48 h | 4 h | 24 h | 48 h | ||
| 10 | 0.0000 | 302.73 | 0.0240 | 1.73 | 50.58 | 144.61 | 248.84 | 101.16 | 289.22 | 497.68 |
| 0.0005 | 306.07 | 0.0214 | 3.08 | 50.30 | 121.33 | 241.49 | 100.59 | 242.66 | 482.97 | |
| 0.0010 | 328.60 | 0.0244 | 3.88 | 46.76 | 138.26 | 266.60 | 93.52 | 276.53 | 533.19 | |
| 0.0015 | 319.92 | 0.0306 | 2.98 | 47.86 | 184.90 | 297.99 | 95.71 | 369.82 | 595.99 | |
| 0.0020 | 388.68 | 0.0322 | 5.01 | 47.86 | 201.41 | 359.60 | 95.71 | 402.81 | 719.20 | |
| 0.0025 | 339.43 | 0.0308 | 3.26 | 50.26 | 191.57 | 316.38 | 100.52 | 383.14 | 632.76 | |
| 0.0030 | 356.75 | 0.1772 | 4.70 | 49.23 | 192.15 | 469.53 | 98.46 | 384.29 | 939.06 | |
| SEM 2 | 32.192 | 0.05572 | 0.796 | 2.000 | 9.852 | 45.802 | 4.000 | 19.704 | 91.605 | |
| Dose of GAA | 0.5292 | 0.4410 | 0.1387 | 0.7553 | 0.0002 | 0.0405 | 0.7554 | 0.0002 | 0.0405 | |
| Linear | 0.7115 | 0.9341 | 0.2855 | 0.3526 | 0.0118 | 0.4606 | 0.3520 | 0.0118 | 0.4605 | |
| Quadratic | 0.6680 | 0.9673 | 0.1408 | 0.3329 | 0.0455 | 0.9049 | 0.3333 | 0.0455 | 0.9049 | |
| 25 | 0.0000 | 415.83 | 0.2988 | 2.88 | 35.75 | 151.94 | 494.32 | 71.50 | 303.87 | 988.63 |
| 0.0005 | 505.82 | 0.3512 | 3.11 | 34.55 | 146.88 | 523.29 | 69.10 | 293.75 | 1046.58 | |
| 0.0010 | 522.18 | 0.2612 | 2.53 | 39.14 | 151.61 | 521.63 | 78.28 | 303.21 | 1043.27 | |
| 0.0015 | 478.85 | 0.2408 | 5.01 | 40.02 | 155.97 | 477.39 | 80.04 | 311.93 | 954.78 | |
| 0.0020 | 427.05 | 0.1790 | 4.65 | 37.34 | 154.91 | 422.23 | 74.68 | 309.81 | 844.46 | |
| 0.0025 | 508.32 | 0.2092 | 2.70 | 42.49 | 158.41 | 510.65 | 84.98 | 316.82 | 1021.30 | |
| 0.0030 | 492.48 | 0.2865 | 2.94 | 34.97 | 144.03 | 513.29 | 69.94 | 288.05 | 1026.59 | |
| SEM 2 | 41.481 | 0.07482 | 1.123 | 2.471 | 4.789 | 47.545 | 4.942 | 9.581 | 95.090 | |
| Dose of GAA | 0.4634 | 0.7287 | 0.5955 | 0.2780 | 0.3957 | 0.7498 | 0.2777 | 0.3959 | 0.7498 | |
| Linear | 0.3009 | 0.5922 | 0.2020 | 0.2422 | 0.5613 | 0.8049 | 0.2420 | 0.5616 | 0.8049 | |
| Quadratic | 0.1628 | 0.9266 | 0.3217 | 0.6850 | 0.6954 | 0.5488 | 0.6852 | 0.6955 | 0.5488 | |
| 100 | 0.0000 | 399.65 | 0.3490 | 3.32 | 30.46 | 97.38 | 418.27 | 60.91 | 194.76 | 836.54 |
| 0.0005 | 363.45 | 0.3536 | 3.32 | 28.37 | 91.70 | 381.39 | 56.74 | 183.41 | 762.77 | |
| 0.0010 | 333.15 | 0.3217 | 3.15 | 30.60 | 92.37 | 349.09 | 61.19 | 184.75 | 698.19 | |
| 0.0015 | 320.30 | 0.1150 | 7.20 | 31.44 | 100.32 | 306.87 | 62.89 | 200.65 | 613.74 | |
| 0.0020 | 390.33 | 0.3589 | 3.30 | 28.97 | 99.63 | 407.14 | 57.94 | 199.26 | 814.27 | |
| 0.0025 | 286.58 | 0.0334 | 8.08 | 32.15 | 94.44 | 256.72 | 64.30 | 188.88 | 513.43 | |
| 0.0030 | 255.53 | 0.0312 | 6.06 | 33.48 | 92.40 | 228.47 | 66.95 | 184.79 | 456.94 | |
| SEM 2 | 26.128 | 0.03710 | 0.986 | 1.162 | 3.008 | 27.847 | 2.324 | 6.015 | 55.693 | |
| Dose of GAA | 0.0135 | <0.0001 | 0.0081 | 0.0913 | 0.2643 | 0.0013 | 0.0913 | 0.2641 | 0.0013 | |
| Linear | 0.0498 | 0.0005 | 0.0145 | 0.5590 | 0.5008 | 0.0134 | 0.5571 | 0.5005 | 0.0134 | |
| Quadratic | 0.4160 | 0.0684 | 0.1028 | 0.8083 | 0.1004 | 0.6987 | 0.8053 | 0.1004 | 0.6987 | |
| Pooled SEM 2 | 33.861 | 0.05796 | 0.977 | 1.954 | 6.559 | 41.367 | 3.908 | 13.118 | 82.735 | |
| p-value | ||||||||||
| Alfalfa hay | <0.0001 | <0.0001 | 0.0094 | <0.0001 | <0.0001 | <0.0001 | <0.0001 | <0.0001 | <0.0001 | |
| Linear | <0.0001 | <0.0001 | 0.8244 | <0.0001 | <0.0001 | <0.0001 | <0.0001 | <0.0001 | <0.0001 | |
| Quadratic | <0.0001 | 0.0145 | 0.0024 | <0.0001 | <0.0001 | 0.0008 | <0.0001 | <0.0001 | 0.0008 | |
| Dose of GAA | 0.8443 | 0.0343 | 0.0255 | 0.2804 | <0.0001 | 0.8297 | 0.2800 | <0.0001 | 0.8297 | |
| Linear | 0.9919 | 0.0509 | 0.0041 | 0.5999 | 0.0053 | 0.4390 | 0.5994 | 0.0053 | 0.4390 | |
| Quadratic | 0.3685 | 0.5279 | 0.3407 | 0.7094 | 0.0149 | 0.8608 | 0.7086 | 0.0149 | 0.8608 | |
| Alfalfa hay × dose of GAA | 0.0330 | 0.0019 | 0.0299 | 0.3258 | <0.0001 | 0.0010 | 0.3258 | <0.0001 | 0.0010 | |
| Alfalfa Hay (%) | Dose of GAA (g g−1 Diet) | CH4 Production | ||||||||
|---|---|---|---|---|---|---|---|---|---|---|
| Parameters 1 | mL CH4 g−1 DM Incubated | mL CH4 100 mL−1 GP | ||||||||
| b | c | Lag | 4 h | 24 h | 48 h | 4 h | 24 h | 48 h | ||
| 10 | 0.0000 | 87.13 | 0.1367 | 13.68 | 0.59 | 7.02 | 87.44 | 1.17 | 4.88 | 34.96 |
| 0.0005 | 90.83 | 0.1683 | 13.75 | 0.30 | 7.64 | 91.47 | 0.58 | 6.25 | 36.50 | |
| 0.0010 | 137.87 | 0.1779 | 13.94 | 0.57 | 18.83 | 87.67 | 1.25 | 12.63 | 32.87 | |
| 0.0015 | 207.47 | 0.1423 | 13.08 | 0.80 | 42.98 | 123.30 | 1.67 | 23.25 | 41.75 | |
| 0.0020 | 225.53 | 0.1521 | 13.26 | 0.76 | 41.28 | 142.30 | 1.58 | 20.63 | 39.96 | |
| 0.0025 | 200.07 | 0.1526 | 13.94 | 1.00 | 25.32 | 116.66 | 2.00 | 13.38 | 37.31 | |
| 0.0030 | 277.02 | 0.1803 | 14.18 | 1.03 | 25.89 | 148.10 | 2.08 | 13.38 | 33.17 | |
| SEM 2 | 34.070 | 0.015 | 0.398 | 0.111 | 9.753 | 14.925 | 0.223 | 5.084 | 4.457 | |
| Dose of GAA | 0.0103 | 0.3381 | 0.4760 | 0.0044 | 0.1072 | 0.0439 | 0.0041 | 0.1787 | 0.7559 | |
| Linear | 0.0256 | 0.7984 | 0.3020 | 0.2169 | 0.0207 | 0.1114 | 0.1347 | 0.0228 | 0.2998 | |
| Quadratic | 0.8244 | 0.0594 | 0.2686 | 0.3742 | 0.6137 | 0.3494 | 0.5510 | 0.8211 | 0.3325 | |
| 25 | 0.0000 | 233.50 | 0.1810 | 14.22 | 0.42 | 13.45 | 234.83 | 1.17 | 8.88 | 47.88 |
| 0.0005 | 193.18 | 0.2056 | 13.66 | 0.49 | 12.45 | 199.23 | 1.42 | 8.63 | 37.38 | |
| 0.0010 | 189.73 | 0.2325 | 13.79 | 0.44 | 15.27 | 196.60 | 1.17 | 10.00 | 37.42 | |
| 0.0015 | 174.10 | 0.1948 | 13.69 | 0.47 | 14.82 | 176.88 | 1.17 | 9.50 | 36.00 | |
| 0.0020 | 141.78 | 0.1813 | 13.78 | 0.30 | 16.28 | 142.66 | 0.83 | 10.63 | 33.63 | |
| 0.0025 | 171.00 | 0.1886 | 13.48 | 0.56 | 17.52 | 175.32 | 1.33 | 11.13 | 34.29 | |
| 0.0030 | 258.23 | 0.1619 | 13.67 | 0.46 | 22.03 | 260.50 | 1.25 | 15.25 | 50.75 | |
| SEM 2 | 26.195 | 0.023 | 0.196 | 0.077 | 2.199 | 27.708 | 0.197 | 1.495 | 2.920 | |
| Dose of GAA | 0.0965 | 0.5113 | 0.2920 | 0.4419 | 0.1244 | 0.1311 | 0.5338 | 0.0978 | 0.0042 | |
| Linear | 0.1311 | 0.6808 | 0.0734 | 0.6552 | 0.6663 | 0.1613 | 1.0000 | 0.7713 | 0.0122 | |
| Quadratic | 0.6677 | 0.1406 | 0.5118 | 0.9862 | 0.6807 | 0.7892 | 1.0000 | 0.6637 | 0.2269 | |
| 100 | 0.0000 | 168.55 | 0.1719 | 14.12 | 0.10 | 8.04 | 170.28 | 0.33 | 8.25 | 40.42 |
| 0.0005 | 149.45 | 0.1632 | 13.42 | 0.00 | 12.68 | 151.87 | 0.00 | 13.75 | 39.59 | |
| 0.0010 | 132.25 | 0.1670 | 13.90 | 0.00 | 9.78 | 133.43 | 0.00 | 10.38 | 37.79 | |
| 0.0015 | 80.45 | 0.1921 | 14.46 | 0.08 | 4.54 | 80.64 | 0.25 | 4.50 | 26.00 | |
| 0.0020 | 128.27 | 0.1965 | 14.01 | 0.09 | 5.48 | 130.24 | 0.33 | 5.50 | 31.84 | |
| 0.0025 | 79.03 | 0.1317 | 12.98 | 0.06 | 13.04 | 79.65 | 0.17 | 13.75 | 30.25 | |
| 0.0030 | 60.26 | 0.1833 | 13.93 | 0.00 | 7.89 | 60.32 | 0.00 | 8.63 | 26.21 | |
| SEM 2 | 19.639 | 0.013 | 0.279 | 0.045 | 3.084 | 20.029 | 0.144 | 3.158 | 4.129 | |
| Dose of GAA | 0.0113 | 0.0465 | 0.0406 | 0.4309 | 0.3938 | 0.0113 | 0.3809 | 0.3066 | 0.1050 | |
| Linear | 0.0068 | 0.2833 | 0.4030 | 0.7221 | 0.4353 | 0.0069 | 0.6893 | 0.4152 | 0.0270 | |
| Quadratic | 0.7521 | 0.3547 | 0.2765 | 0.1219 | 0.3705 | 0.7500 | 0.1212 | 0.3188 | 0.3803 | |
| Pooled SEM 2 | 27.280 | 0.018 | 0.303 | 0.083 | 6.041 | 21.538 | 0.191 | 3.562 | 3.892 | |
| p-value | ||||||||||
| Alfalfa hay | <0.0001 | 0.0038 | 0.6843 | <0.0001 | 0.0001 | <0.0001 | <0.0001 | 0.0872 | 0.0128 | |
| Linear | 0.1911 | 0.0009 | 0.6823 | <0.0001 | 0.0153 | <0.0001 | 0.0076 | 0.1338 | 0.1601 | |
| Quadratic | <0.0001 | 0.6998 | 0.4446 | <0.0001 | 0.0002 | 0.0002 | <0.0001 | 0.0995 | 0.0085 | |
| Dose of GAA | 0.2799 | 0.3149 | 0.3284 | 0.0027 | 0.1238 | 0.2359 | 0.0349 | 0.4695 | 0.3473 | |
| Linear | 0.6864 | 0.3658 | 0.2865 | 0.2617 | 0.0274 | 0.0401 | 0.3775 | 0.0877 | 0.0471 | |
| Quadratic | 0.7868 | 0.0772 | 0.9835 | 0.2192 | 0.9049 | 0.6801 | 0.2637 | 0.6572 | 0.5152 | |
| Alfalfa hay × dose of GAA | <0.0001 | 0.1989 | 0.0748 | 0.0012 | 0.0274 | 0.0011 | 0.0021 | 0.0438 | 0.0121 | |
| Alfalfa Hay (%) | Dose of GAA (g g−1 Diet) | CO Production | |||||
|---|---|---|---|---|---|---|---|
| Parameters 1 | mL CO g−1 DM Incubated | ||||||
| b | c | Lag | 4 h | 24 h | 48 h | ||
| 10 | 0.0000 | 3.0867 | 0.0614 | 5.14 | 0.0294 | 0.6530 | 3.2352 |
| 0.0005 | 2.3867 | 0.0053 | 6.40 | 0.0132 | 0.4976 | 3.5657 | |
| 0.0010 | 4.4267 | 0.0419 | 5.78 | 0.0212 | 0.7865 | 4.2513 | |
| 0.0015 | 5.2767 | 0.0740 | 4.42 | 0.0333 | 0.9961 | 4.5540 | |
| 0.0020 | 5.4600 | 0.1362 | 2.63 | 0.0349 | 1.0831 | 5.4524 | |
| 0.0025 | 4.5767 | 0.1192 | 2.71 | 0.0415 | 0.9328 | 4.5694 | |
| 0.0030 | 4.5400 | 0.1531 | 3.27 | 0.0437 | 1.1410 | 7.9702 | |
| SEM 2 | 0.68045 | 0.02497 | 1.316 | 0.00557 | 0.16812 | 0.96506 | |
| Dose of GAA | 0.0574 | 0.0086 | 0.3129 | 0.0186 | 0.1414 | 0.0617 | |
| Linear | 0.0391 | 0.7259 | 0.7035 | 0.6255 | 0.1709 | 0.3503 | |
| Quadratic | 0.7731 | 0.4133 | 0.5444 | 0.1585 | 0.8559 | 0.7673 | |
| 25 | 0.0000 | 7.7433 | 0.1620 | 3.40 | 0.0190 | 0.8815 | 7.8135 |
| 0.0005 | 8.6800 | 0.1744 | 3.44 | 0.0223 | 0.9532 | 8.8230 | |
| 0.0010 | 8.2267 | 0.1695 | 3.28 | 0.0218 | 0.9709 | 8.3586 | |
| 0.0015 | 7.1367 | 0.1606 | 3.54 | 0.0224 | 0.8366 | 7.1847 | |
| 0.0020 | 6.1867 | 0.1432 | 2.92 | 0.0240 | 1.0288 | 6.2225 | |
| 0.0025 | 8.2133 | 0.1648 | 3.39 | 0.0221 | 1.0196 | 8.2938 | |
| 0.0030 | 7.5400 | 0.1196 | 5.16 | 0.0213 | 0.5214 | 7.2556 | |
| SEM 2 | 1.01042 | 0.02428 | 0.534 | 0.00301 | 0.10047 | 1.09523 | |
| Dose of GAA | 0.6725 | 0.7221 | 0.1691 | 0.9517 | 0.0397 | 0.6872 | |
| Linear | 0.6776 | 0.9681 | 0.8557 | 0.4421 | 0.7567 | 0.6909 | |
| Quadratic | 0.5352 | 0.7884 | 0.7835 | 0.7596 | 0.3790 | 0.5320 | |
| 100 | 0.0000 | 5.8233 | 0.1175 | 4.96 | 0.0061 | 0.3159 | 5.6202 |
| 0.0005 | 5.8967 | 0.1698 | 3.52 | 0.0049 | 0.5169 | 5.9736 | |
| 0.0010 | 6.4300 | 0.1098 | 4.75 | 0.0049 | 0.4480 | 5.0598 | |
| 0.0015 | 4.4233 | 0.1016 | 4.49 | 0.0091 | 0.4945 | 3.9633 | |
| 0.0020 | 6.3633 | 0.1697 | 3.65 | 0.0079 | 0.6257 | 6.4153 | |
| 0.0025 | 4.5633 | 0.0854 | 4.48 | 0.0073 | 0.5894 | 3.7541 | |
| 0.0030 | 5.5267 | 0.0517 | 5.46 | 0.0049 | 0.3702 | 3.1422 | |
| SEM 2 | 0.79748 | 0.04234 | 1.275 | 0.00123 | 0.09110 | 0.65469 | |
| Dose of GAA | 0.4550 | 0.4457 | 0.9291 | 0.1537 | 0.2480 | 0.0227 | |
| Linear | 0.2349 | 0.7936 | 0.7982 | 0.1094 | 0.1874 | 0.0952 | |
| Quadratic | 0.2023 | 0.9962 | 0.9891 | 0.0959 | 0.7073 | 0.7431 | |
| Pooled SEM 2 | 0.84062 | 0.03165 | 1.102 | 0.00372 | 0.12471 | 0.92367 | |
| p-value | |||||||
| Alfalfa hay | <0.0001 | 0.0005 | 0.2818 | <0.0001 | <0.0001 | <0.0001 | |
| Linear | <0.0001 | 0.0001 | 0.2109 | <0.0001 | 0.7950 | <0.0001 | |
| Quadratic | 0.3249 | 0.7190 | 0.3237 | <0.0001 | <0.0001 | 0.0020 | |
| Doses of GAA | 0.9153 | 0.6899 | 0.4968 | 0.0084 | 0.0617 | 0.8625 | |
| Linear | 0.9295 | 0.9516 | 0.6984 | 0.2668 | 0.1260 | 0.6713 | |
| Quadratic | 0.1969 | 0.7968 | 0.7212 | 0.1461 | 0.6620 | 0.4530 | |
| Alfalfa hay × dose of GAA | 0.1093 | 0.0287 | 0.5601 | 0.0077 | 0.0413 | 0.0109 | |
| Alfalfa Hay (%) | Dose of GAA (g g−1 Diet) | H2S Production | |||||
|---|---|---|---|---|---|---|---|
| Parameters 1 | mL H2S g−1 DM Incubated | ||||||
| b | c | Lag | 4 h | 24 h | 48 h | ||
| 10 | 0.0000 | 0.1443 | 0.0001 | 7.97 | 0.0016 | 0.0117 | 0.0490 |
| 0.0005 | 0.0186 | 0.0008 | 5.73 | 0.0006 | 0.0045 | 0.0278 | |
| 0.0010 | 0.0287 | 0.0021 | 6.12 | 0.0004 | 0.0049 | 0.0266 | |
| 0.0015 | 0.1154 | 0.0347 | 6.19 | 0.0002 | 0.0028 | 0.0196 | |
| 0.0020 | 0.1349 | 0.0053 | 6.68 | 0.0002 | 0.0029 | 0.0260 | |
| 0.0025 | 0.0859 | 0.0032 | 5.61 | 0.0002 | 0.0031 | 0.0200 | |
| 0.0030 | 0.3613 | 0.0006 | 8.60 | 0.0003 | 0.0033 | 0.0347 | |
| SEM 2 | 0.10255 | 0.01278 | 1.121 | 0.00009 | 0.00102 | 0.00591 | |
| Dose of GAA | 0.3428 | 0.4881 | 0.4326 | <0.0001 | 0.0002 | 0.0441 | |
| Linear | 0.8449 | 0.0761 | 0.2805 | <0.0001 | <0.0001 | 0.0034 | |
| Quadratic | 0.4341 | 0.3445 | 0.4960 | 0.0004 | 0.0744 | 0.3035 | |
| 25 | 0.0000 | 0.0143 | 0.0005 | 6.05 | 0.0001 | 0.0022 | 0.0267 |
| 0.0005 | 0.0378 | 0.0002 | 6.97 | 0.0001 | 0.0022 | 0.0253 | |
| 0.0010 | 0.0218 | 0.0002 | 3.97 | 0.0002 | 0.0027 | 0.0260 | |
| 0.0015 | 0.0259 | 0.0003 | 6.83 | 0.0001 | 0.0022 | 0.0206 | |
| 0.0020 | 0.0820 | 0.0003 | 6.01 | 0.0002 | 0.0028 | 0.0178 | |
| 0.0025 | 0.0191 | 0.0004 | 5.06 | 0.0001 | 0.0028 | 0.0243 | |
| 0.0030 | 0.0393 | 0.0012 | 4.51 | 0.0001 | 0.0018 | 0.0236 | |
| SEM 2 | 0.02106 | 0.00030 | 1.428 | 0.00003 | 0.00038 | 0.00278 | |
| Dose of GAA | 0.3653 | 0.2516 | 0.6931 | 0.7583 | 0.4321 | 0.3162 | |
| Linear | 0.7027 | 0.6440 | 0.7063 | 0.4577 | 1.0000 | 0.1431 | |
| Quadratic | 0.9494 | 0.5941 | 0.1788 | 0.2071 | 0.2721 | 0.5134 | |
| 100 | 0.0000 | 0.0155 | 0.0001 | 5.98 | 0.0002 | 0.0016 | 0.0255 |
| 0.0005 | 0.0133 | 0.0006 | 6.58 | 0.0001 | 0.0017 | 0.0263 | |
| 0.0010 | 0.0023 | 0.0003 | 7.35 | 0.0001 | 0.0018 | 0.0213 | |
| 0.0015 | 0.4484 | 0.0007 | 7.51 | 0.0004 | 0.0024 | 0.0193 | |
| 0.0020 | 0.0228 | 0.0001 | 7.57 | 0.0005 | 0.0041 | 0.0357 | |
| 0.0025 | 0.1446 | 0.0022 | 6.65 | 0.0004 | 0.0041 | 0.0403 | |
| 0.0030 | 0.0403 | 0.0001 | 8.99 | 0.0003 | 0.0029 | 0.0568 | |
| SEM 2 | 0.17054 | 0.00061 | 1.313 | 0.00009 | 0.00066 | 0.00654 | |
| Dose of GAA | 0.5217 | 0.2355 | 0.7660 | 0.0536 | 0.0714 | 0.0141 | |
| Linear | 0.0943 | 0.5433 | 0.4238 | 0.1383 | 0.4089 | 0.5116 | |
| Quadratic | 0.2902 | 0.8599 | 0.7139 | 0.2463 | 0.7785 | 0.8976 | |
| Pooled SEM 2 | 0.11553 | 0.00739 | 1.294 | 0.00008 | 0.00073 | 0.00534 | |
| p-value | |||||||
| Alfalfa hay | 0.3172 | 0.2086 | 0.0724 | <0.0001 | <0.0001 | 0.0136 | |
| Linear | 0.1408 | 0.1218 | 0.1291 | <0.0001 | <0.0001 | 0.0560 | |
| Quadratic | 0.7450 | 0.3878 | 0.0811 | 0.3792 | 0.0110 | 0.0217 | |
| Doses of GAA | 0.4699 | 0.4671 | 0.7369 | <0.0001 | 0.0012 | 0.0034 | |
| Linear | 0.1495 | 0.0602 | 0.8688 | <0.0001 | <0.0001 | 0.0026 | |
| Quadratic | 0.1865 | 0.3239 | 0.3077 | 0.0007 | 0.1852 | 0.5690 | |
| Alfalfa hay × dose of GAA | 0.4531 | 0.5014 | 0.6710 | <0.0001 | <0.0001 | 0.0032 | |
| Alfalfa Hay (%) | Dose of GAA (g g−1 Diet) | In Vitro Rumen Fermentation Profile 1 | CH4 Conversion Efficiency 2 | |||||
|---|---|---|---|---|---|---|---|---|
| pH | DMD | SCFA | ME | CH4:SCFA | CH4:ME | CH4:OM | ||
| 10 | 0.0000 | 6.98 | 75.58 | 6.40 | 7.20 | 63.83 | 9.04 | 15.16 |
| 0.0005 | 6.89 | 78.12 | 5.36 | 6.67 | 81.88 | 10.61 | 16.51 | |
| 0.0010 | 6.87 | 79.77 | 6.12 | 7.06 | 165.30 | 23.73 | 14.02 | |
| 0.0015 | 6.83 | 82.21 | 8.19 | 8.13 | 304.18 | 49.21 | 13.53 | |
| 0.0020 | 6.87 | 84.27 | 8.92 | 8.50 | 269.79 | 45.29 | 13.87 | |
| 0.0025 | 6.83 | 84.22 | 8.48 | 8.28 | 174.98 | 28.63 | 24.71 | |
| 0.0030 | 7.03 | 85.35 | 8.51 | 8.29 | 174.97 | 28.92 | 55.95 | |
| SEM 3 | 0.055 | 1.455 | 0.437 | 0.225 | 66.508 | 10.924 | 4.750 | |
| Dose of GAA | 0.1541 | 0.0023 | 0.0002 | 0.0002 | 0.1790 | 0.1343 | 0.0002 | |
| Linear | 0.0747 | 0.0062 | 0.0117 | 0.0116 | 0.0229 | 0.0210 | 0.8118 | |
| Quadratic | 0.5789 | 0.6317 | 0.0454 | 0.0454 | 0.8217 | 0.6931 | 0.9562 | |
| 25 | 0.0000 | 7.52 | 68.43 | 4.30 | 6.53 | 108.19 | 11.45 | 17.38 |
| 0.0005 | 7.50 | 68.25 | 4.05 | 6.40 | 180.37 | 18.39 | 27.40 | |
| 0.0010 | 7.53 | 60.23 | 4.08 | 6.41 | 136.08 | 14.08 | 21.14 | |
| 0.0015 | 7.46 | 70.51 | 4.43 | 6.59 | 59.00 | 6.38 | 9.80 | |
| 0.0020 | 7.45 | 71.25 | 4.40 | 6.58 | 72.12 | 7.75 | 11.84 | |
| 0.0025 | 7.55 | 69.39 | 4.17 | 6.46 | 180.34 | 18.74 | 28.18 | |
| 0.0030 | 7.64 | 65.48 | 4.08 | 6.42 | 113.14 | 11.47 | 17.04 | |
| SEM 3 | 0.014 | 1.582 | 0.214 | 0.109 | 19.580 | 2.799 | 4.750 | |
| Dose of GAA | 0.0621 | 0.2894 | 0.4031 | 0.4082 | 0.0978 | 0.1108 | 0.1239 | |
| Linear | 0.3398 | 0.6346 | 0.5681 | 0.5699 | 0.7723 | 0.7147 | 0.6655 | |
| Quadratic | 0.7094 | 0.5987 | 0.6943 | 0.7055 | 0.664 | 0.6708 | 0.6796 | |
| 100 | 0.0000 | 7.21 | 81.52 | 6.73 | 7.37 | 116.18 | 16.99 | 29.07 |
| 0.0005 | 7.22 | 80.57 | 6.50 | 7.26 | 112.92 | 16.07 | 26.91 | |
| 0.0010 | 7.22 | 79.93 | 6.71 | 7.37 | 130.91 | 19.21 | 33.00 | |
| 0.0015 | 7.23 | 80.43 | 6.90 | 7.46 | 124.35 | 18.46 | 32.03 | |
| 0.0020 | 7.22 | 85.23 | 6.86 | 7.44 | 139.08 | 20.45 | 35.19 | |
| 0.0025 | 7.26 | 80.03 | 7.01 | 7.52 | 145.62 | 21.72 | 37.85 | |
| 0.0030 | 7.27 | 80.56 | 6.37 | 7.19 | 199.67 | 28.42 | 47.62 | |
| SEM 3 | 0.031 | 3.214 | 0.133 | 0.068 | 41.413 | 4.387 | 6.663 | |
| Dose of GAA | 0.0142 | 0.2924 | 0.2615 | 0.2633 | 0.3059 | 0.3629 | 0.3933 | |
| Linear | 0.1960 | 0.6547 | 0.5010 | 0.5235 | 0.4151 | 0.4278 | 0.4350 | |
| Quadratic | 0.3136 | 0.0340 | 0.0987 | 0.0986 | 0.3183 | 0.3523 | 0.3703 | |
| Pooled SEM 3 | 0.037 | 7.232 | 0.291 | 0.149 | 46.625 | 6.986 | 5.462 | |
| p-value | ||||||||
| Alfalfa hay | <0.0001 | <0.0001 | <0.0001 | <0.0001 | 0.0892 | 0.0009 | <0.0001 | |
| Linear | <0.0001 | 0.8821 | <0.0001 | <0.0001 | 0.1345 | 0.0447 | <0.0001 | |
| Quadratic | <0.0001 | <0.0001 | <0.0001 | <0.0001 | 0.1020 | 0.0010 | 0.0007 | |
| Dose of GAA | 0.0011 | 0.0151 | <0.0001 | <0.0001 | 0.4709 | 0.2184 | 0.0002 | |
| Linear | 0.0447 | 0.1709 | 0.0053 | 0.0054 | 0.0882 | 0.0384 | 0.6436 | |
| Quadratic | 0.9170 | 0.0533 | 0.0149 | 0.0151 | 0.6557 | 0.9323 | 0.4082 | |
| Alfalfa hay × dose of GAA | 0.2397 | 0.1320 | <0.0001 | <0.0001 | 0.0438 | 0.0359 | 0.0086 | |
Disclaimer/Publisher’s Note: The statements, opinions and data contained in all publications are solely those of the individual author(s) and contributor(s) and not of MDPI and/or the editor(s). MDPI and/or the editor(s) disclaim responsibility for any injury to people or property resulting from any ideas, methods, instructions or products referred to in the content. |
© 2023 by the authors. Licensee MDPI, Basel, Switzerland. This article is an open access article distributed under the terms and conditions of the Creative Commons Attribution (CC BY) license (https://creativecommons.org/licenses/by/4.0/).
Share and Cite
Vazquez-Mendoza, O.V.; Andrade-Yucailla, V.; Elghandour, M.M.M.Y.; Masaquiza-Moposita, D.A.; Cayetano-De-Jesús, J.A.; Alvarado-Ramírez, E.R.; Adegbeye, M.J.; Barros-Rodríguez, M.; Salem, A.Z.M. Effect of Dietary Guanidinoacetic Acid Levels on the Mitigation of Greenhouse Gas Production and the Rumen Fermentation Profile of Alfalfa-Based Diets. Animals 2023, 13, 1719. https://doi.org/10.3390/ani13111719
Vazquez-Mendoza OV, Andrade-Yucailla V, Elghandour MMMY, Masaquiza-Moposita DA, Cayetano-De-Jesús JA, Alvarado-Ramírez ER, Adegbeye MJ, Barros-Rodríguez M, Salem AZM. Effect of Dietary Guanidinoacetic Acid Levels on the Mitigation of Greenhouse Gas Production and the Rumen Fermentation Profile of Alfalfa-Based Diets. Animals. 2023; 13(11):1719. https://doi.org/10.3390/ani13111719
Chicago/Turabian StyleVazquez-Mendoza, Oscar Vicente, Veronica Andrade-Yucailla, Mona Mohamed Mohamed Yasseen Elghandour, Diego Armando Masaquiza-Moposita, Jorge Adalberto Cayetano-De-Jesús, Edwin Rafael Alvarado-Ramírez, Moyosore Joseph Adegbeye, Marcos Barros-Rodríguez, and Abdelfattah Zeidan Mohamed Salem. 2023. "Effect of Dietary Guanidinoacetic Acid Levels on the Mitigation of Greenhouse Gas Production and the Rumen Fermentation Profile of Alfalfa-Based Diets" Animals 13, no. 11: 1719. https://doi.org/10.3390/ani13111719