Article

Spatial and Temporal Movements of Free-Roaming Cats and Wildlife in Two Local Government Areas in Greater Sydney, Australia

by
Isabella J. L. Davey
1,
Mark E. Westman
2,
Dominique Van der Saag
2,
Gemma C. Ma
2,3 and
Brooke P. A. Kennedy
4,*
1
School of Life and Environmental Sciences, Faculty of Science, The University of Sydney, Camperdown, NSW 2006, Australia
2
School of Veterinary Science, Faculty of Science, The University of Sydney, Camperdown, NSW 2006, Australia
3
Royal Society for the Prevention of Cruelty to Animals (RSPCA) NSW, Yagoona, NSW 2199, Australia
4
School of Environmental and Rural Science, University of New England, Armidale, NSW 2351, Australia
*
Author to whom correspondence should be addressed.
Animals 2023, 13(10), 1711; https://doi.org/10.3390/ani13101711
Submission received: 30 March 2023 / Revised: 18 May 2023 / Accepted: 19 May 2023 / Published: 22 May 2023
(This article belongs to the Section Companion Animals)

Abstract

:

Simple Summary

Free-roaming cats (domestic and feral) are known to negatively impact wildlife numbers in Australia and can also affect human health via zoonotic diseases. To help learn more about their outdoor movement, free-roaming cats in two local government areas (LGA) in New South Wales (NSW), Australia, Campbelltown (CT) and the Blue Mountains (BM), were monitored in this study using two different data gathering methods. The BM LGA contains high levels of National Park land compared to CT LGA, however, Campbelltown’s human population is more than double and its population density is approximately ten times higher than the BM region. Motion-capture cameras were installed on 100 properties (50 per LGA) to capture all animal movements over a two-month period and transect drives along pre-determined routes through both areas (four per LGA) were completed to directly observe free-roaming cats in residential areas. The results showed higher numbers of free-roaming cats in CT LGA, and higher levels of wildlife in the BM LGA. Free-roaming cats were seen roaming throughout the day. This data provide a baseline for the Royal Society for the Prevention of Cruelty to Animals (RSPCA) NSW Keeping Cats Safe at Home program which is designed to reduce free-roaming cat numbers.

Abstract

Free-roaming cats pose a risk to their own health and welfare, as well as to the health and welfare of wildlife and humans. This study aimed to monitor and quantify area-specific free-roaming cat movement. Two local government areas (LGAs) in Greater Sydney were included, Campbelltown (CT) and the Blue Mountains (BM). Motion-capture cameras were installed on 100 volunteer properties (50 per LGA) to indirectly capture animal movements over two months. Transect drives were completed eight times (four per LGA) to directly observe roaming cats in residential areas. The cameras and transects both identified higher free-roaming cat numbers in CT (density of 0.31 cats per ha, resulting in an estimated abundance of 361 cats in the 1604 ha of residential area) than the BM (density of 0.21 cats per ha, resulting in an estimated abundance of 3365 cats in the 10,000 ha of residential area). More wildlife events were captured in the BM (total = 5580) than CT (total = 2697). However, there was no significant difference between CT and the BM for cat events (p = 0.11) or wildlife events (p = 0.32) observed via the cameras. Temporally, cats were observed via the cameras throughout the entire day with peaks at 9:30 am and 8:00 pm in the BM, and 7:00 am and 12:00 pm in CT. Overlaps in activity times were recorded for free-roaming cats with bandicoots (BM), possums (BM), and small mammals (BM and CT). This study demonstrates that camera monitoring on private property and transect drives are useful methods to quantify free-roaming cat abundance to inform cat management interventions.

1. Introduction

The domestic cat (Felis catus) is the largest species of companion animals globally, with more than half a billion cats estimated worldwide [1]. Whilst labelled a domestic species, Felis catus has also proven to be capable of surviving in the wild and is considered an introduced species in many countries including Australia [2]. According to the Royal Society for the Prevention of Cruelty to Animals (RSPCA) in Australia, cats that are ‘unowned, unsocialised, have no relationship with or dependence on humans and reproduce in the wild’ should be defined as ‘feral’ cats [3]. Globally, Felis catus are non-randomly distributed across time and space, and their presence varies from 0.1 to >1000 cats per square kilometre [4]. Higher density cat populations are typically seen in and around urban environments [4]. In Australia, there are approximately 4.09 million owned cats in 30% of households, and approximately 2.8 million feral cats, covering more than 99.8% of Australia’s surface area [5,6,7,8].
Domestic cats (owned, semi-owned, and stray), and feral cats, may be known as ‘free-roaming’ (not confined to a person’s yard or house), whilst some owned cats are considered ‘non-roaming’ as they are contained and/or strictly indoors-only [9,10]. In a review of six Australian studies of owned cats, it was estimated that 71.1% were able to roam outside and could be classified as free-roaming, with the remaining considered as non-roaming [11]. Cats are enticed to roam outdoors by interesting scents, discovery, climbing, and hunting [12]. A cat’s roaming range is the area it most routinely travels and this varies immensely; it is affected by the environment (urban or rural) and the cat’s ownership status (owned or unowned) [13]. Each cat’s range contains different sections, with the outermost area used for food patrol, and the inner areas for defending territory and as personal space to play, eat, and sleep [12]. Traditionally in Australia, cat ownership has permitted free-roaming, with owned cats allowed to roam at night having larger ranges and roaming further than those only permitted to roam during the day [2,14].
Outdoor roaming can present risks to cats including injury from vehicles and other animals, poisoning, and cruelty from humans [4,12]. Cats that live outdoors can also experience starvation and high kitten mortality [15]. Not only can pathogens, such as feline immunodeficiency virus (FIV) and feline leukemia virus (FeLV), be passed intraspecies [15,16], but diseases can also be spread interspecies including with mammals (both wild and domestic), birds, and humans [13,17,18,19]. Cats also compete with native predators, alter prey behaviour, and burden wildlife rehabilitation and native species’ reintroduction [17,20].
All felids are obligate carnivores and most are generalist ambush predators [6]. Although domestic cats are known to eat all vertebrate classes and arthropods [17], they primarily hunt small mammals [21]. Domestic cats are also facultative specialists, meaning that they switch between prey when more profitable prey becomes available, particularly with seasonality [21]. Like their ancestors, domestic cats are crepuscular, hunting at dawn and dusk, and during the night [13]. Whilst owned cats rely on their owners for food, all free-roaming cats (including owned cats) can display normal predatory and hunting behaviours. Consequently, contained cats need enrichment for play behaviours to help stimulate and satisfy this innate predatory behaviour [6,12]. Free-roaming cats are the main threat to almost 8% of critically endangered mammals, birds, and reptiles globally, and are considered to have contributed to at least 14% of global extinctions [9,22]. In Australia, mammals make up most of their prey, followed by reptiles and birds in areas with fewer mammals [23]. Although there is no consensus on the exact numbers, some researchers have estimated that owned and unowned (feral and stray) free-roaming domestic cats kill 61 million birds and 53 million reptiles in Australia annually [23,24]. Despite the possibility that cat numbers and therefore predation may be over-estimated [25], the threat of cat predation on wildlife has led to them being listed amongst 100 of the world’s worst invasive species [9]. The extent and significance of free-roaming cats and their impact on wildlife destruction are an ongoing debate [4]. With the rise of conservation biology as a discipline, the role and impact of free-roaming cats on endangered and threatened species has garnered more attention [26]. Of particular concern are islands and areas with naive and susceptible prey species that have evolved in the absence of mammalian predators [9,17].
Research to date reporting the impact of free-roaming cats, both in Australia and overseas, is limited and has mainly focused on the feral population [27,28,29]. Legge et al. (2020) was the first to summarise the effects of pet cat predation in Australia but did not focus on roaming behaviours and movements [11]. Owned cats roaming near natural areas have demonstrated higher predation levels than those in more urban areas [30]. More area-specific studies of free-roaming cat behaviour are needed in areas that encroach or are close to natural wildlife habitats and conservation areas, such as National Parks where the consequences of predation on wildlife are presumably more severe.
The aim of this study was to quantify cat roaming behaviour and assess potential for wildlife predation as indicated by spatial and temporal overlaps between wildlife and cats in two Sydney local government areas (LGAs), Campbelltown City Council (CTCC) and the Blue Mountains City Council (BMCC), to fill existing knowledge gaps and provide area-specific data. BMCC contains high levels of National Park land compared to CTCC, which has more than double the population of BMCC [31,32,33,34]. Based on current known demographics of the two LGAs, it was hypothesised that the density of free-roaming cats would be higher in CTCC than BMCC. Conversely, the observed wildlife numbers were hypothesised to be higher in the BMCC than CTCC.

2. Materials and Methods

2.1. Study Sites

The New South Wales (NSW) RSPCA initiated a new project ‘Keeping Cats Safe at Home (KCSAH)’ in 2021 which will run until 2025 [35]. Eleven councils in NSW, Australia are working with the project including CTCC and the BMCC [35]. Through a multidisciplinary approach, the project aims to encourage and support cat owners in the participating council areas to prevent their cats from roaming to reduce wildlife impacts and keep cats safe [35,36]. The data from this study will be utilised as a baseline prior to the implementation of interventions as a part of the RSPCA NSW KCSAH project.
The Blue Mountains (BM) and Campbelltown (CT) are two diverse LGAs within Greater Sydney, NSW Australia. The BM contains approximately 78,121 people in 35,139 private dwellings with a density of around 55 people per square kilometre (78,121/1430 km2), and CT has approximately 176,519 residents in 63,062 dwellings with a much higher density (~10 times higher) of around 566 people per square kilometre (176,519/312 km2) [31,32,33,34]. Recent comprehensive data on cat numbers and ownership is lacking in Australia, however, one study in 2009 found that there were high proportions of cat ownership in CT (≥30%) and another from 2018 recorded that 54% of survey participants in the BM had owned cats [37,38].
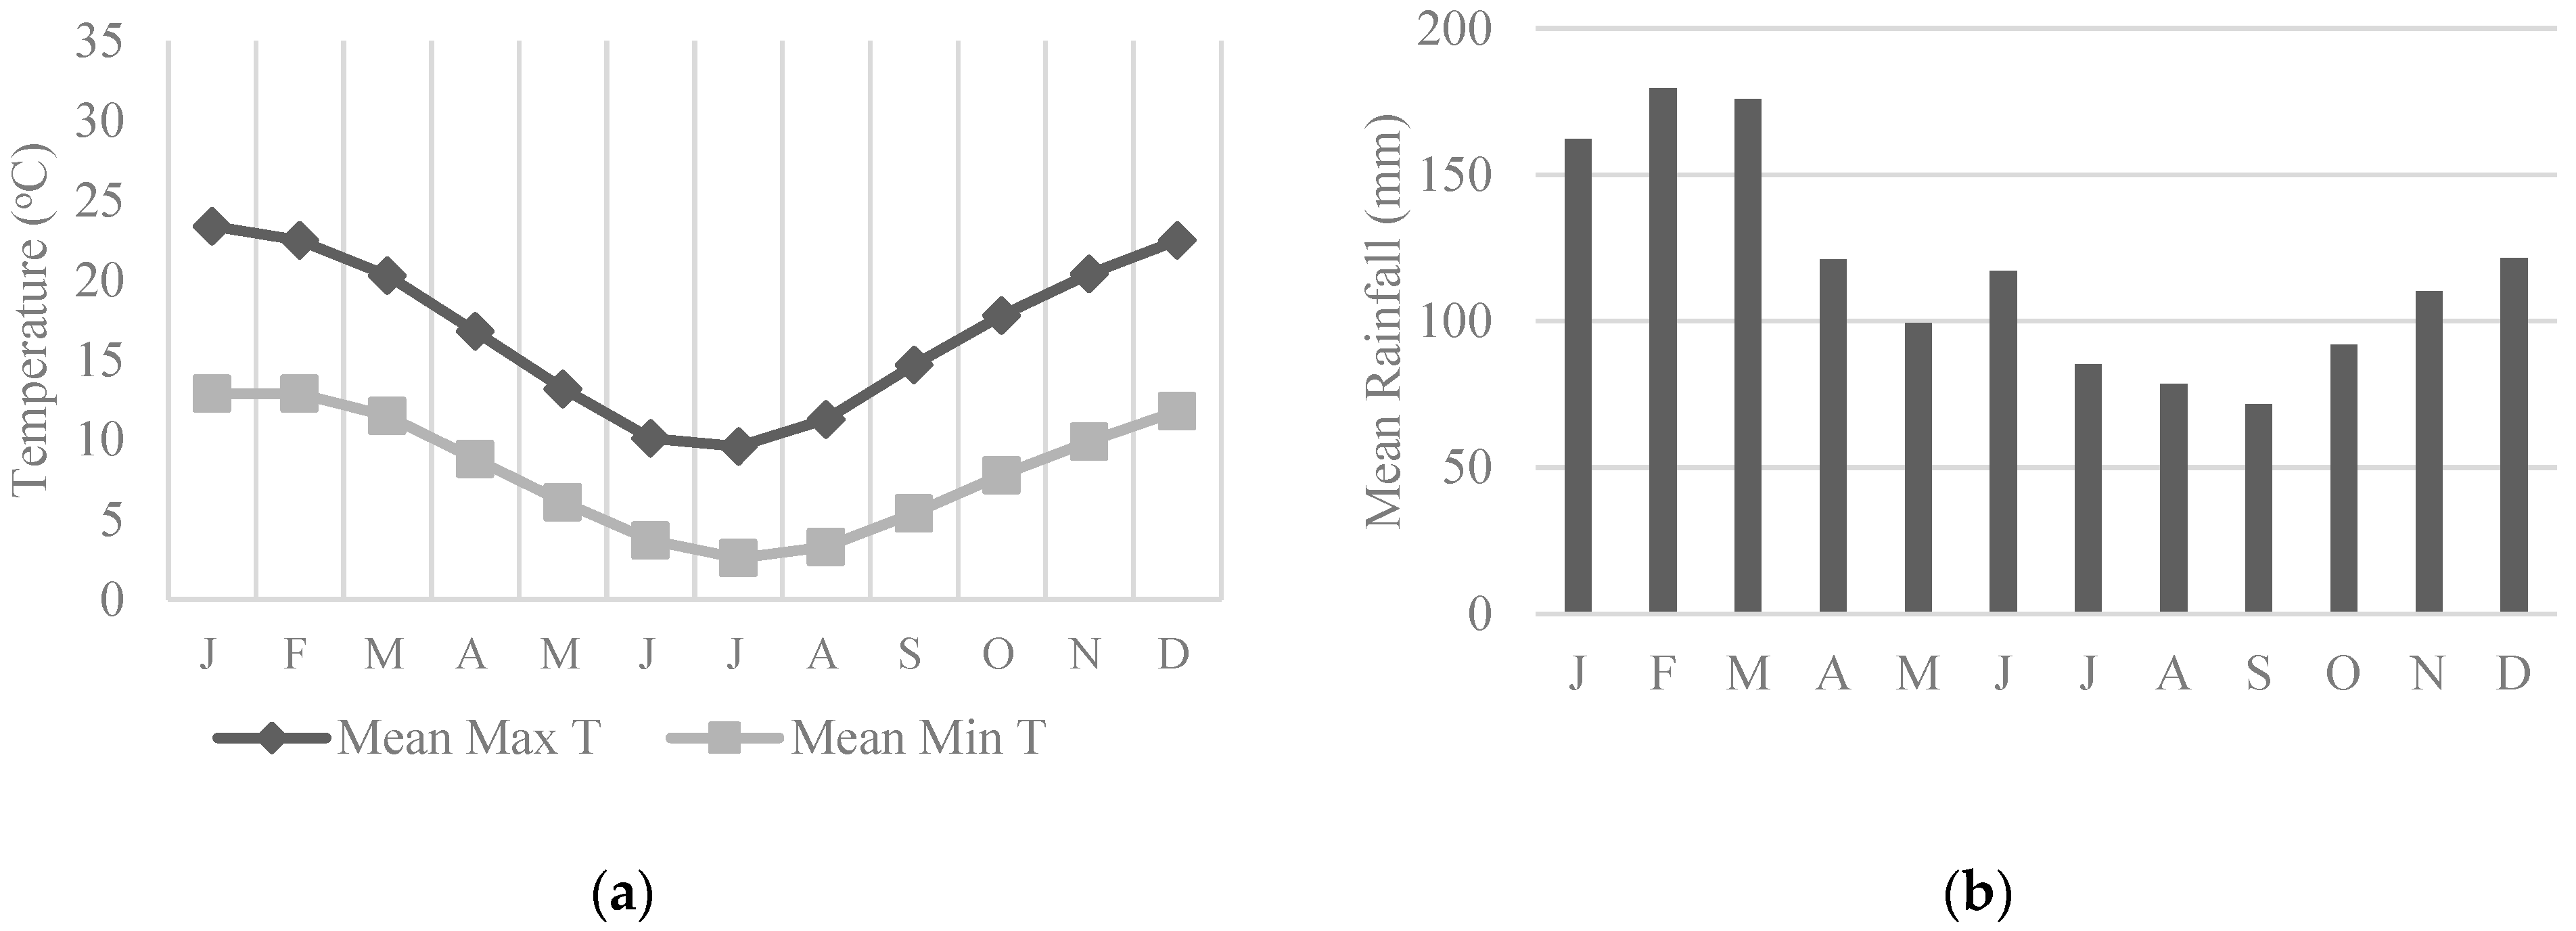
National Park covers 74% of the BM (1058.2/1430 km2), and whilst a more built-up suburban area, CT also contains the Dharawal National Park which covers 20.9% of the LGA (65.08/312 km2) [31,32]. General weather conditions in the BM are more temperate than CT (up to 7 °C lower) with rainfall ranging between 70 and 180 mm per month (Figure 1a,b) [39,40,
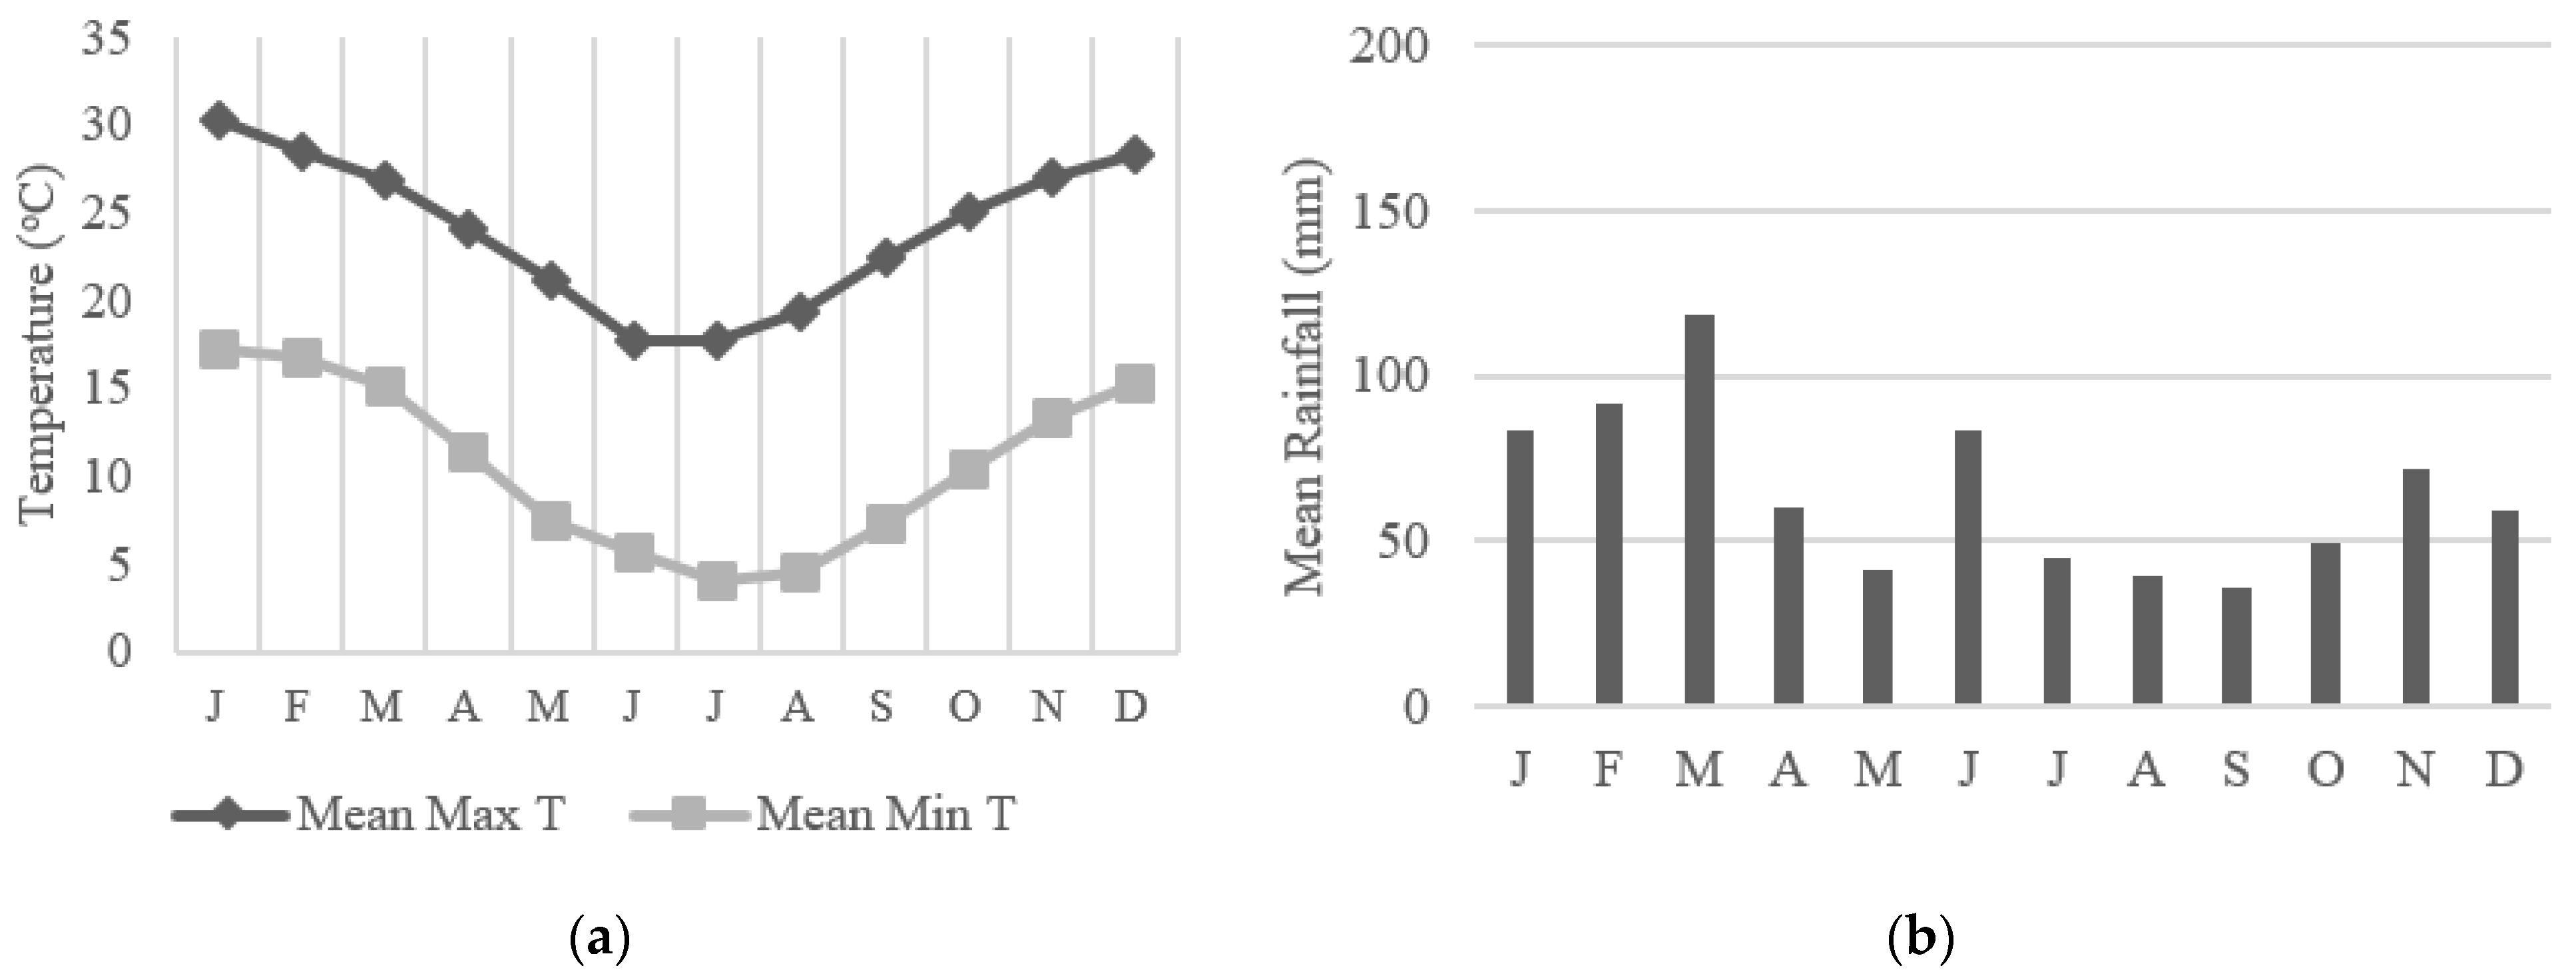
41]. CT is comparatively warmer and drier on average than the BM throughout the year (Figure 2a,b) [42,43,44].

2.2. RSPCA NSW Survey

The RSPCA NSW conducted an online survey in 2021 titled ‘What do you think about cats?’ available to anyone residing in NSW, Australia as part of their KCSAH project [45] (in press). It was advertised on their website, on their social media channels (Facebook and Instagram), and shared by veterinary practices, other rehoming organisations, and local councils. A total of 8708 people completed the survey, of which 683 were in the BM and 515 in CT. Within the survey, household participants were asked if they would like to volunteer to host a wildlife camera on their property. Once the BM and CT were selected as LGAs for monitoring, those households that responded ‘yes’ were contacted via email to provide consent and physical addresses. One hundred volunteer locations (50 BM and 50 CT) were randomly selected using Microsoft 365 Bing 3D maps in Microsoft Excel (Microsoft, Redmond, WA, USA).

2.3. Roaming Behaviours

2.3.1. Motion-Capture Cameras (Indirect Observations)

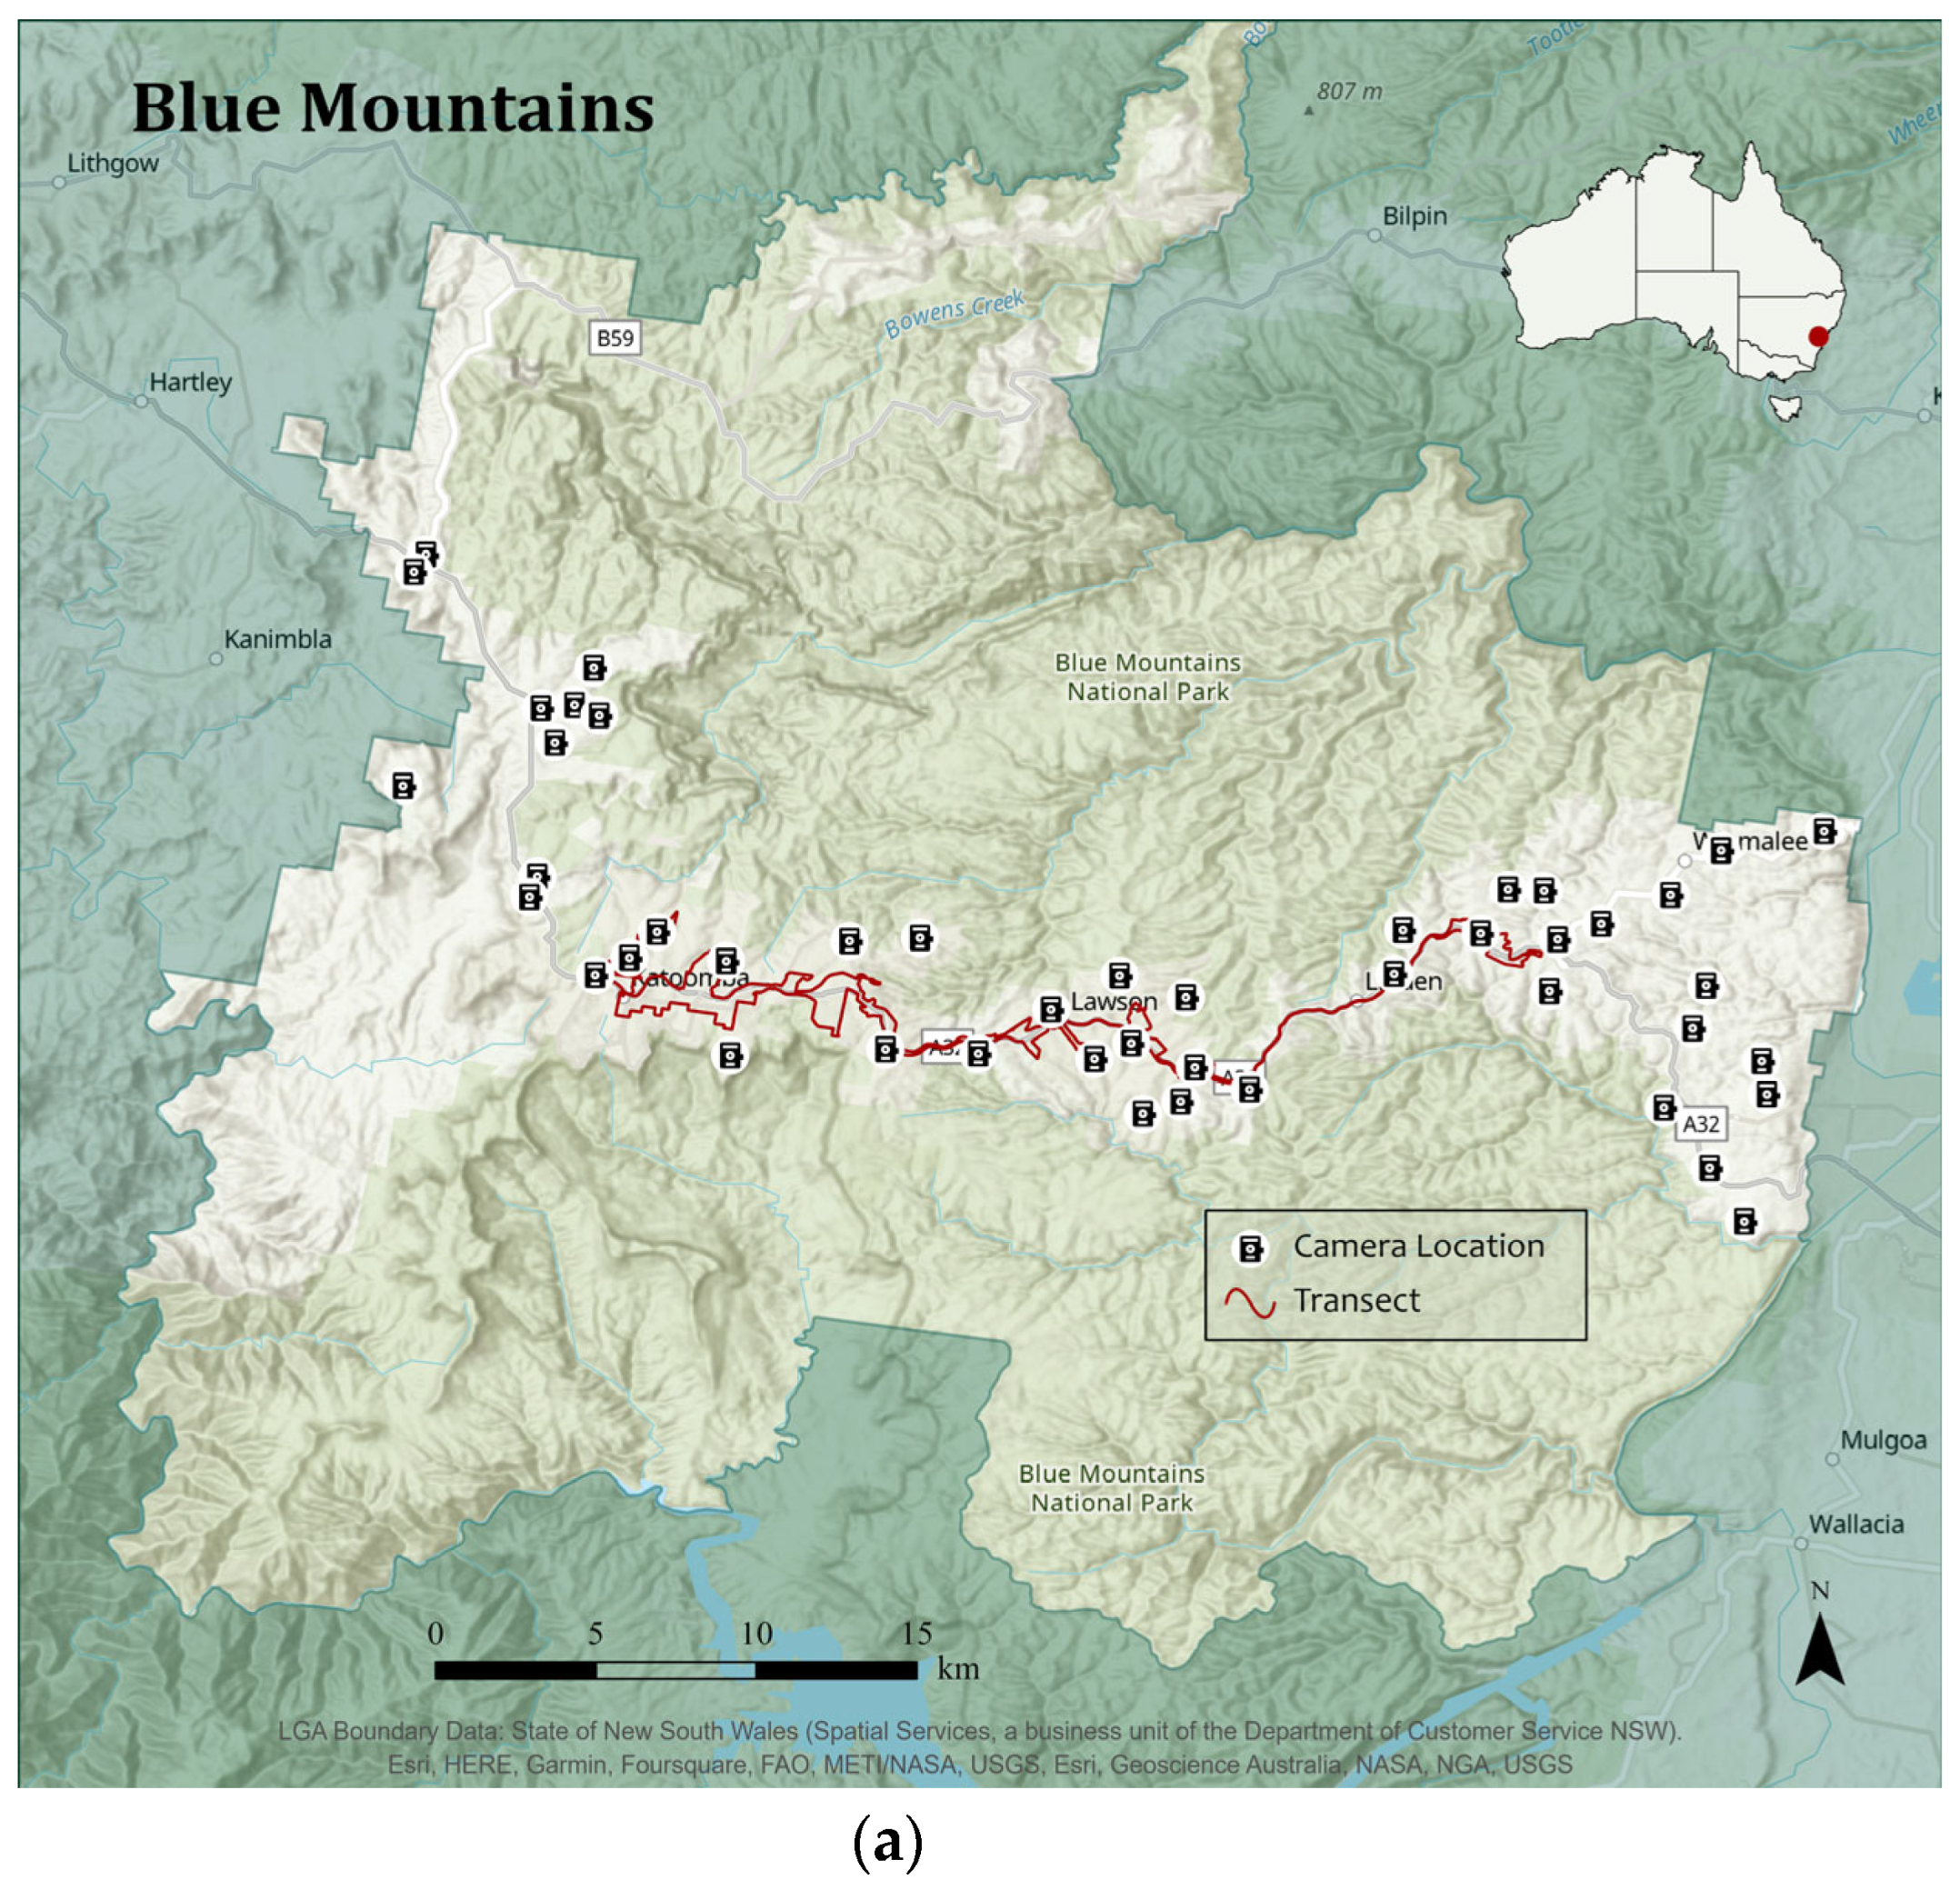
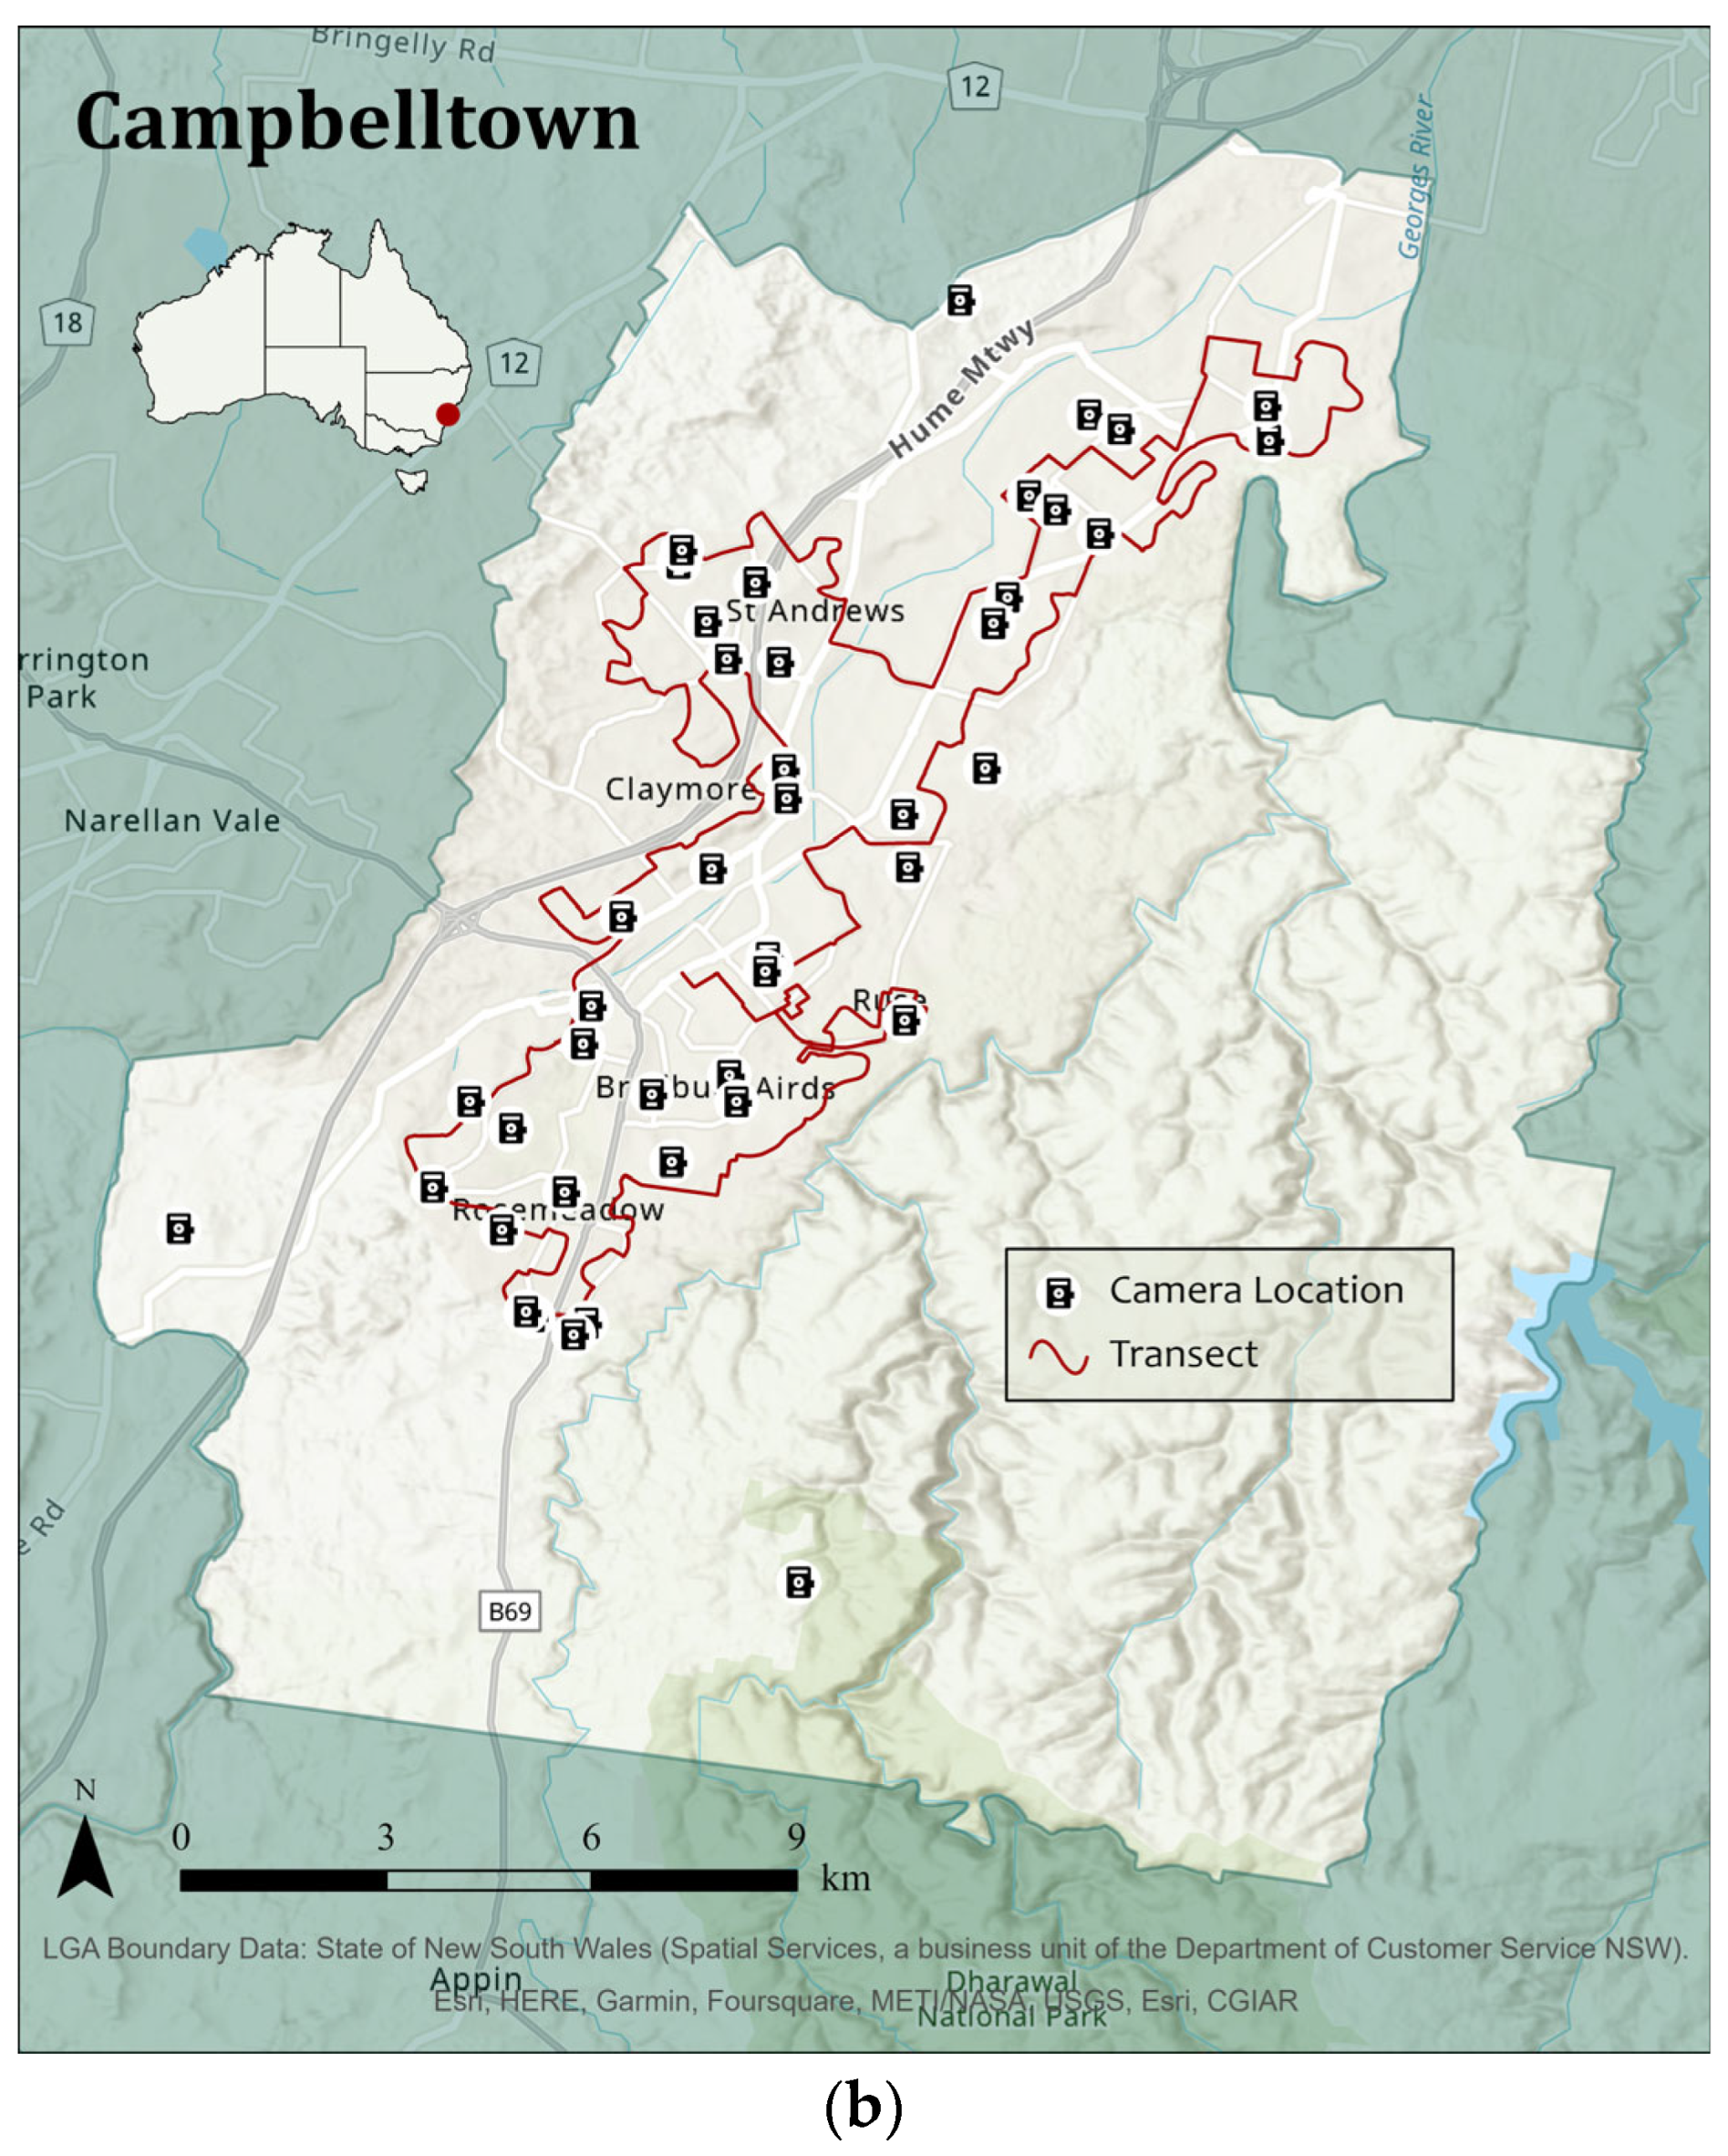
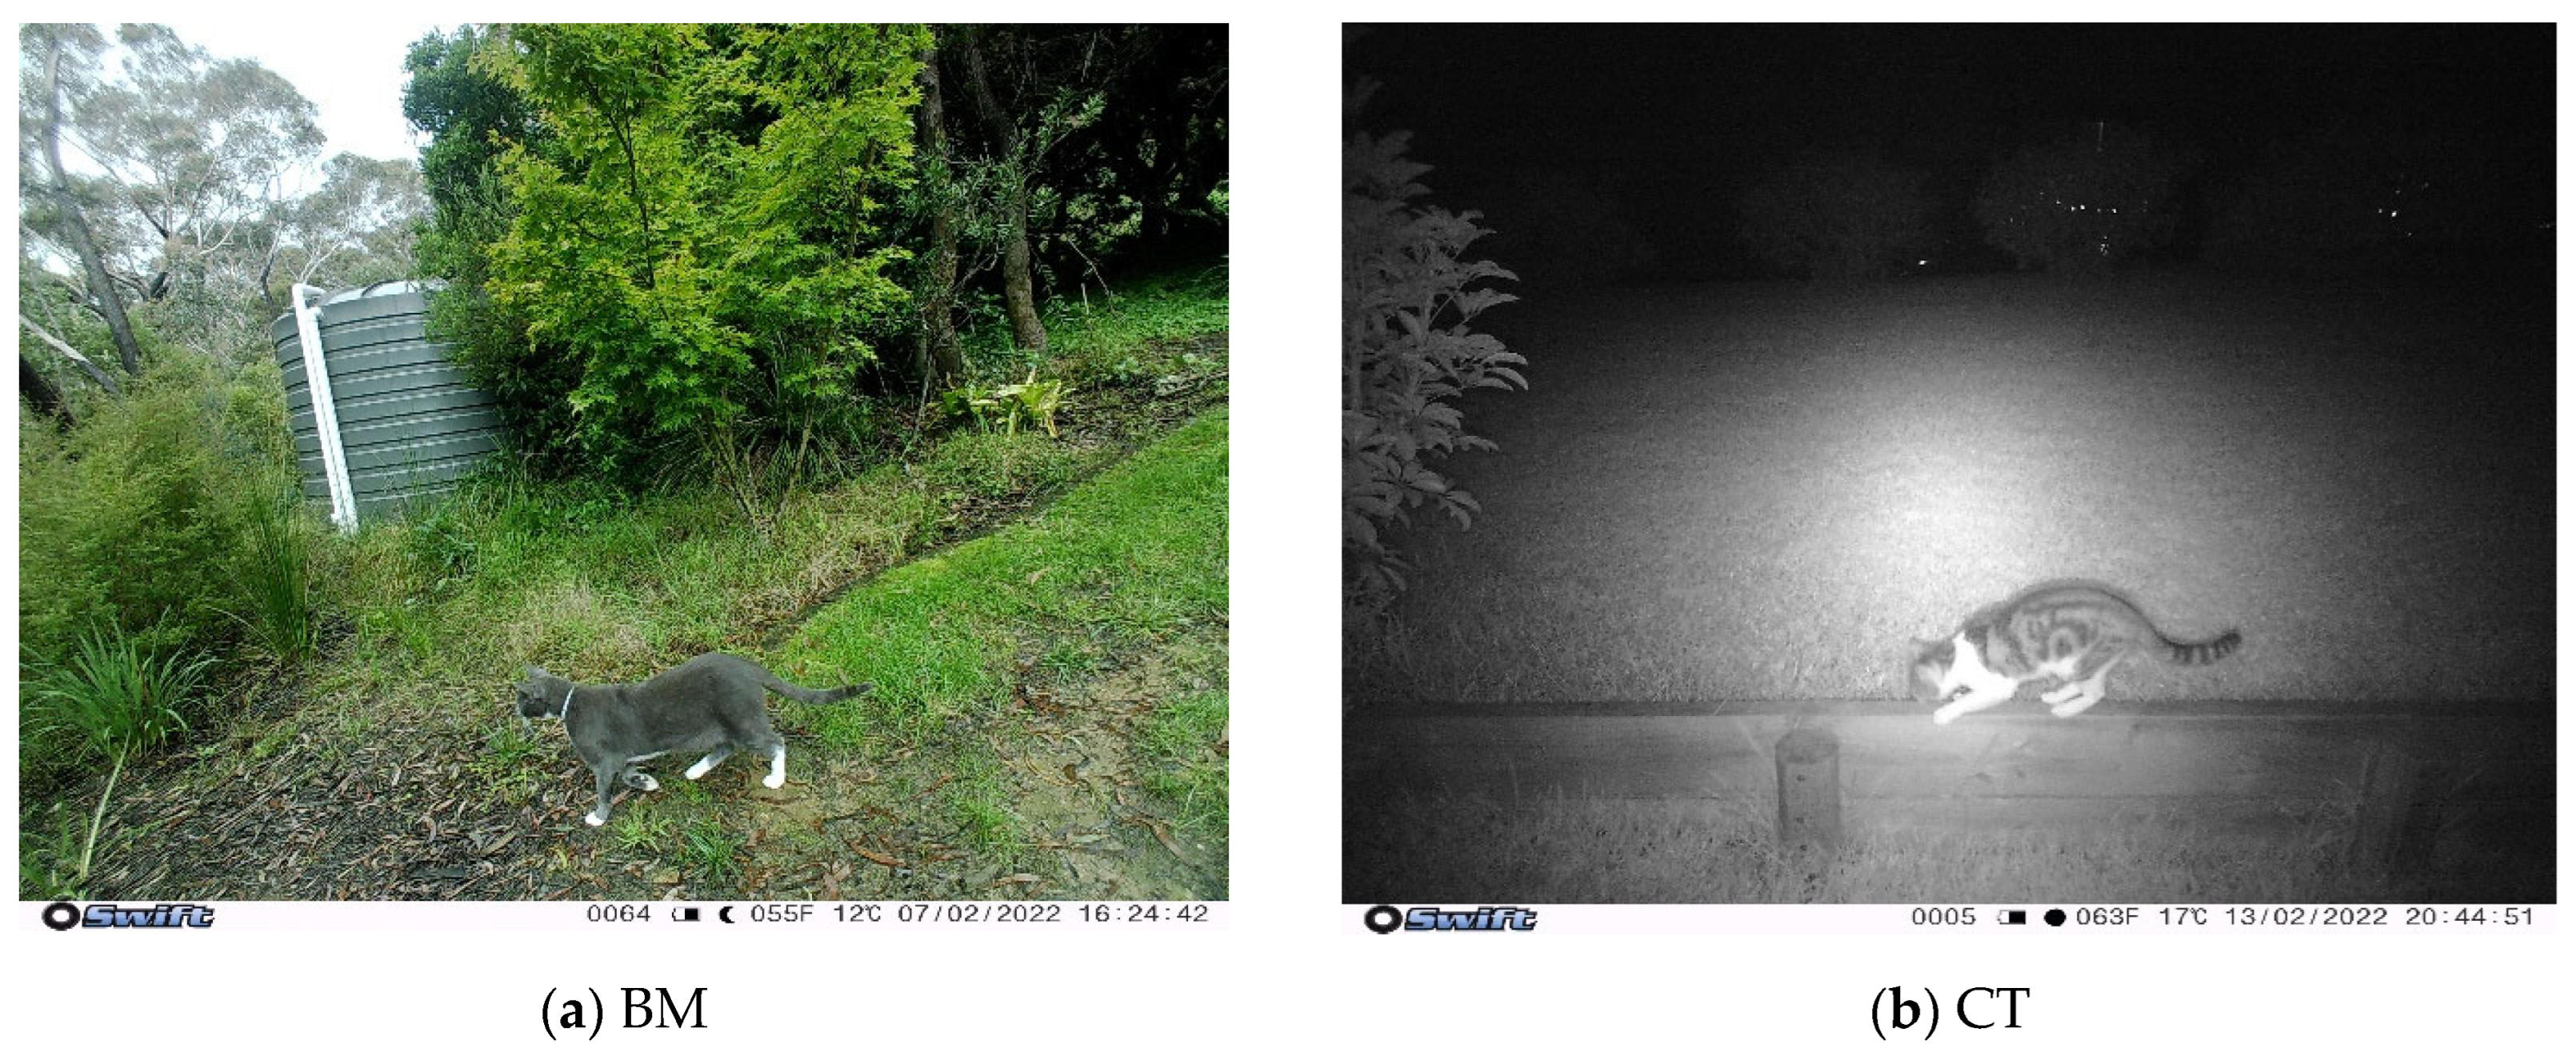
A total of 100 heat-in-motion capture cameras (Swift 3C wide-angle, Outdoor Cameras Australia, Toowoomba, QLD, Australia) were used; 50 in the BM LGA and 50 in the CT LGA (Figure 3). Cameras were placed on private property of volunteers and remained there for approximately two consecutive months (February–April 2022).
As seen in Table 1, the weather during the study period in the BM was relatively wet, especially during March with a total of 685.8 mm recorded, as was CT which also had the highest rainfall of the study period during March and a total of 452 mm recorded [40,44]. Compared to the monthly means in Figure 1a and Figure 2a, maximum temperatures were slightly lower than average for these months in both LGAs, and the minimums were relatively similar [39,41,42,43].
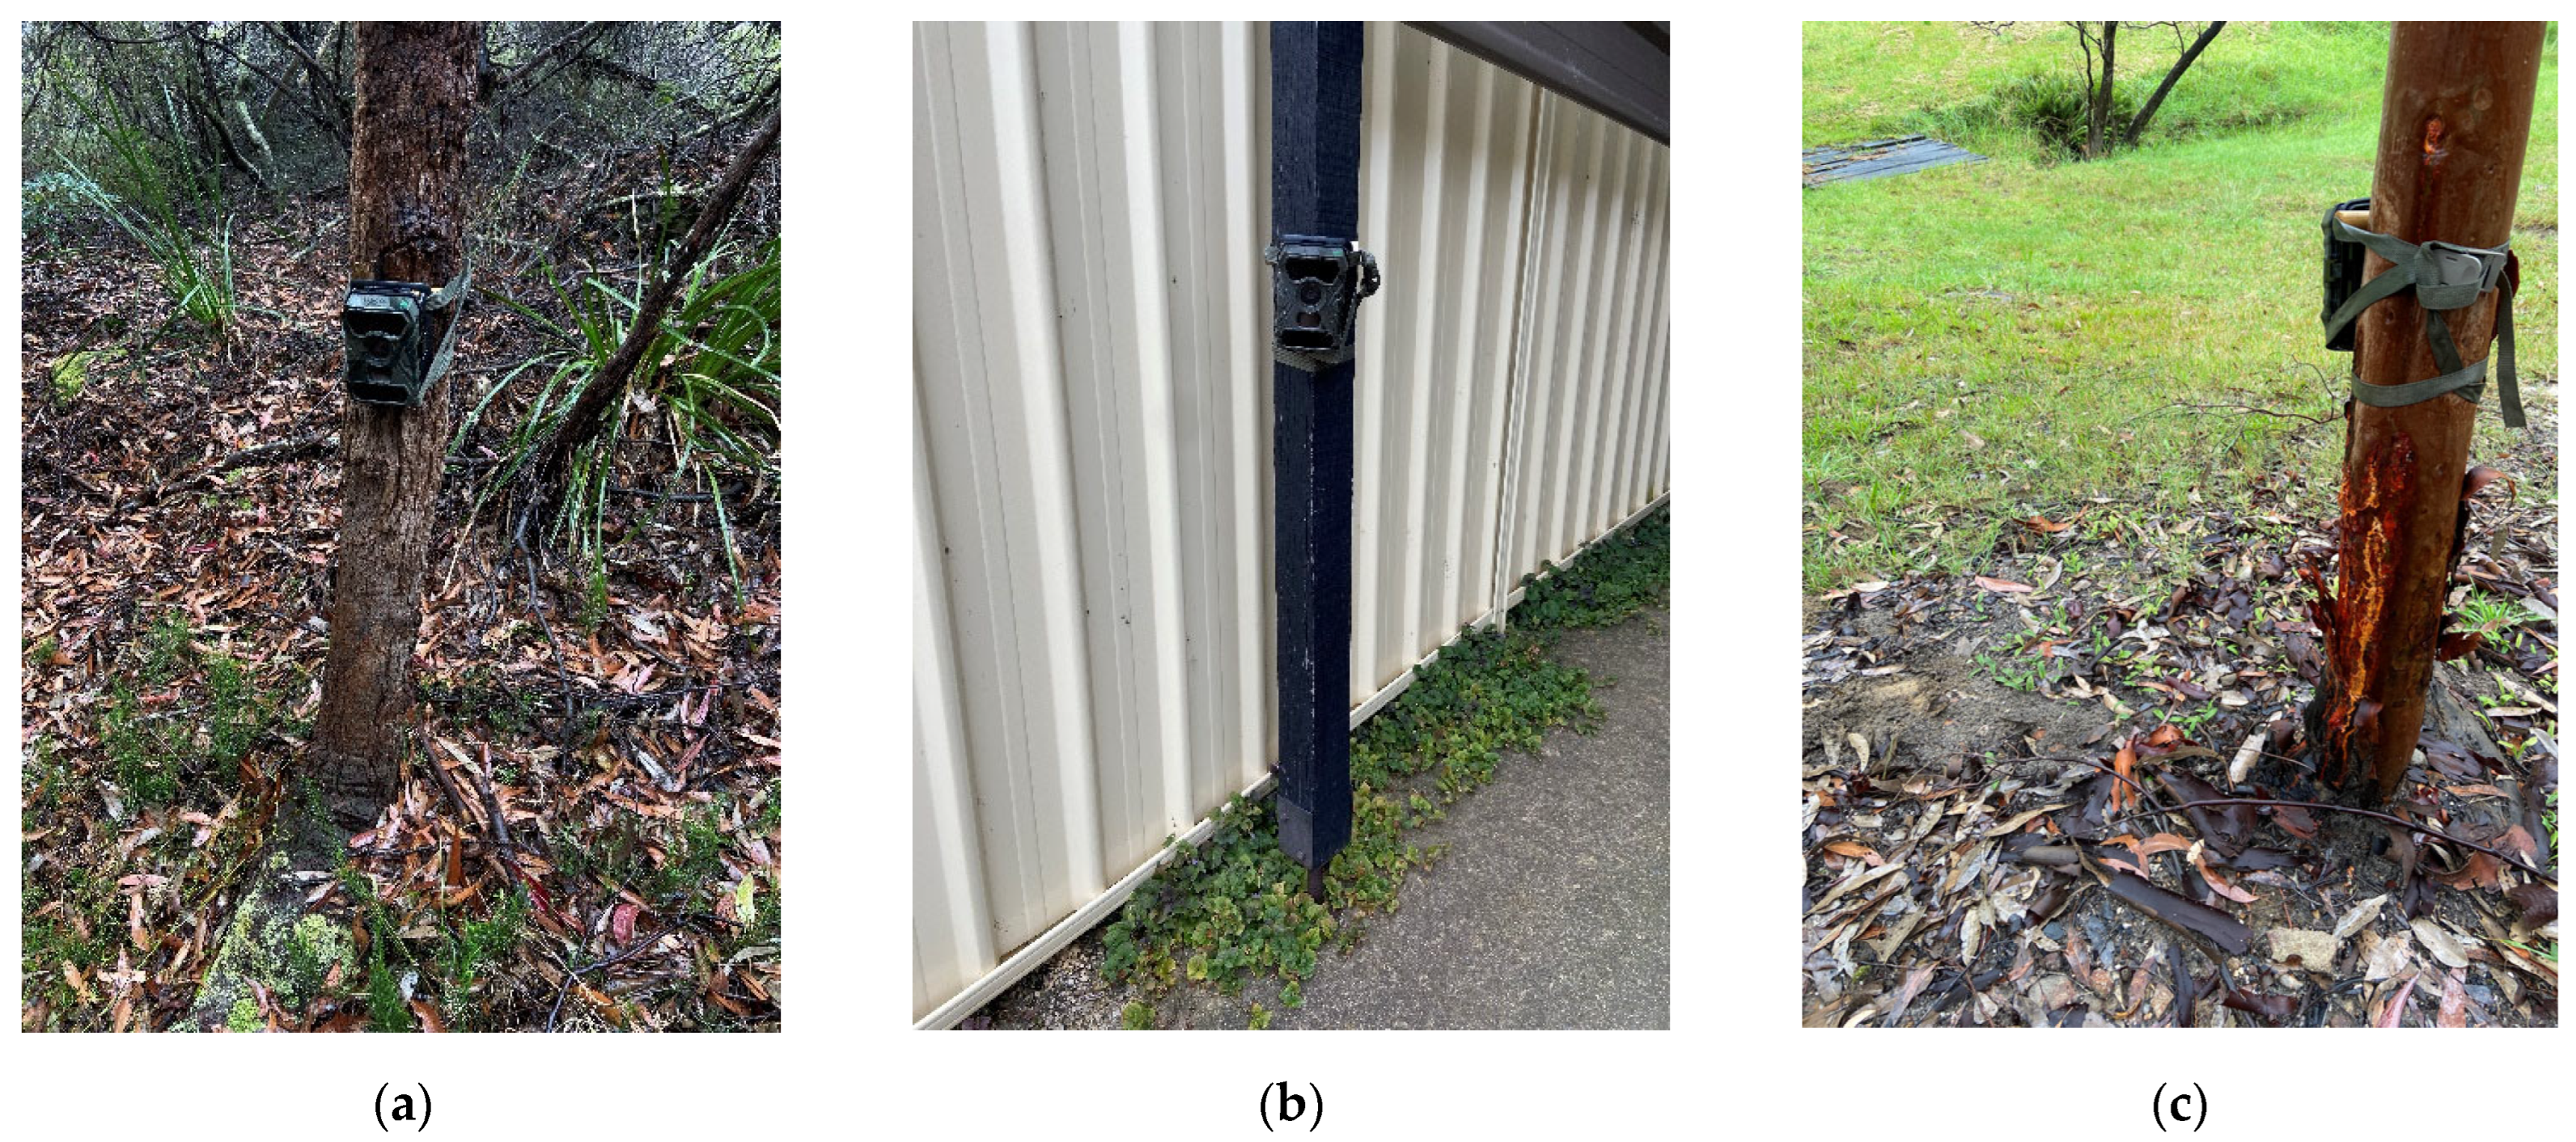
Cameras were attached vertically to an object already available on the property (for example a tree or fence post; Figure 4). The cameras were attached at approximately 90 cm above ground level and angled downwards. When outside, cats most often follow pre-formed tracks and fence lines when roaming. Therefore, locations on the volunteer properties that contained pre-formed tracks were ideally chosen to increase the likelihood of capturing free-roaming cats [46]. Cameras placed on a track were set up with an angle of incidence of approximately 22° to the track, whilst those pointed at a direct source (e.g., water source, and hole in the fence) were aimed directly at the source. The camera settings were set to: Passive Infrared (PIR) sensitivity—High; photo captures per trigger—3; interval between triggers—0 s; and image size—8 megapixels.

2.3.2. Transect Drives (Direct Observations)

Transect drives are a quick and low-cost method that involves following a recorded path and documenting target objects to measure the distribution across a certain area [7,47]. After the collection of the 100 cameras, transects were completed in both the BM and CT LGAs. The transect drive for each LGA was determined on route during the first day and recorded using the MotionX—GPS app (Santa Cruz, CA, USA) on a mobile phone. Transects were approximately 80 km in length (excluding any highway travel wherein a 30 km/h speed limit was not safe and where there were no residential households). Following this route, the same transects were completed once a day at approximately the same time on four separate days over a seven-day period in each LGA with weather conditions generally clear, except for rainfall on 20 and 22 April in the BM (Table 2).
Transects were conducted from 2:30 pm to 5:30 pm AEST four times in each LGA (8 transects in total). Three to four people conducted the transect drives, with one driver and either two or three spotters to make observations. A physical tally sheet was used to manually record the data collected by the spotters including date, start and finish times, and the presence of free-roaming cats. Cats that were unable to roam (e.g., those observed inside a building through a window/door, those outside on a leash/lead, those outside but confined in an enclosure) were not recorded. Approximate distance from the vehicle of each identified cat was also recorded in metres. The vehicle’s headlights were switched on to assist with visibility, particularly after 5 pm when the levels of natural light decreased.

2.4. Data and Statistical Analysis

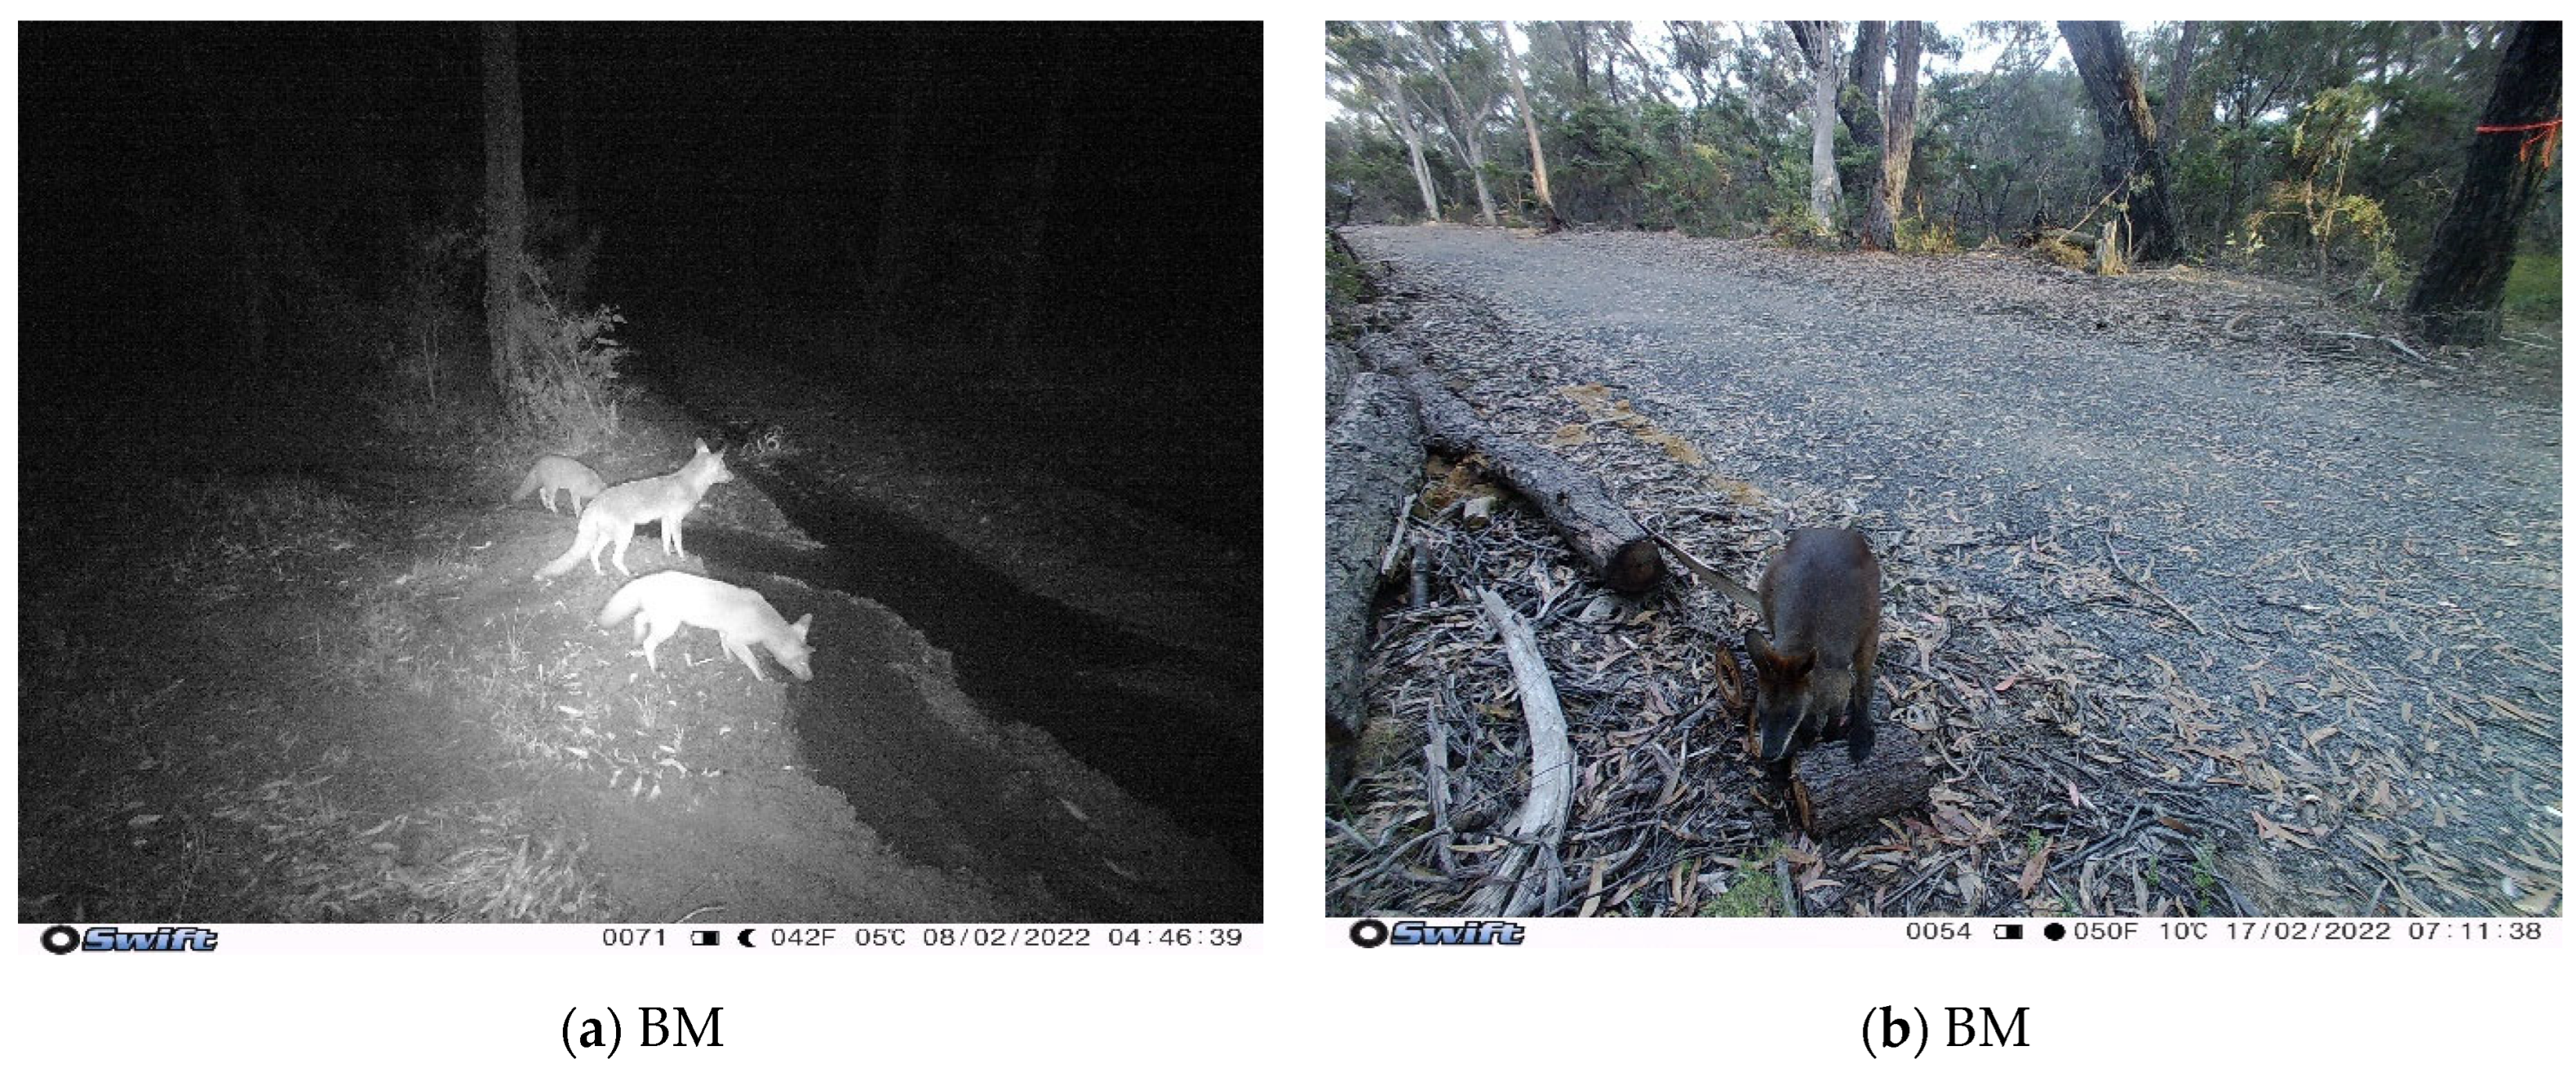
All images taken by the cameras were downloaded and individually viewed and tagged using the ExifPro 2.1 image-tagging program (Bad Kreuznach, Rheinland-Pfalz, Germany). The following tags were used if objects were identifiable: ‘BAN’ (bandicoot), ‘BIRD’, ‘CAT’, ‘DDOG’ (domestic dog C. familiaris), ‘DOG’ (other non-domestic dog, i.e., wild dog or dingo), ‘FOX’ (Vulpes vulpes), ‘GOANNA’, ‘GUPIG’ (guinea pig), ‘HOR’ (horse), ‘HUMN’ (human), ‘LIZ’ (lizard), ‘MAC’ (macropods including kangaroos and wallabies), ‘POS’ (possum), ‘RAB’ (rabbit/hare), ‘SMLMAM’ (any other mammal smaller than a bandicoot, including invasive rats and mice, bush rats and dunnarts) and ‘VEH’ (vehicles including cars, postmen, and trucks). If unidentifiable, images were tagged using the following: ‘NIL’ (nothing in the image), ‘UNK’ (too dark to determine if a target object was present), or ‘BADCAM’ (problem with the camera deeming the image compromised). The tagged images were then loaded into the R Studio program (Boston, MA, USA) in their groups of 3 images per trigger. An event was defined in R Studio as every group that was captured 60 s or greater apart from the last; this would count as one observation. These events were counted, and the unidentifiable images were removed along with any missing data. The clean dataset was compiled into a csv file by location, camera number, and tag.
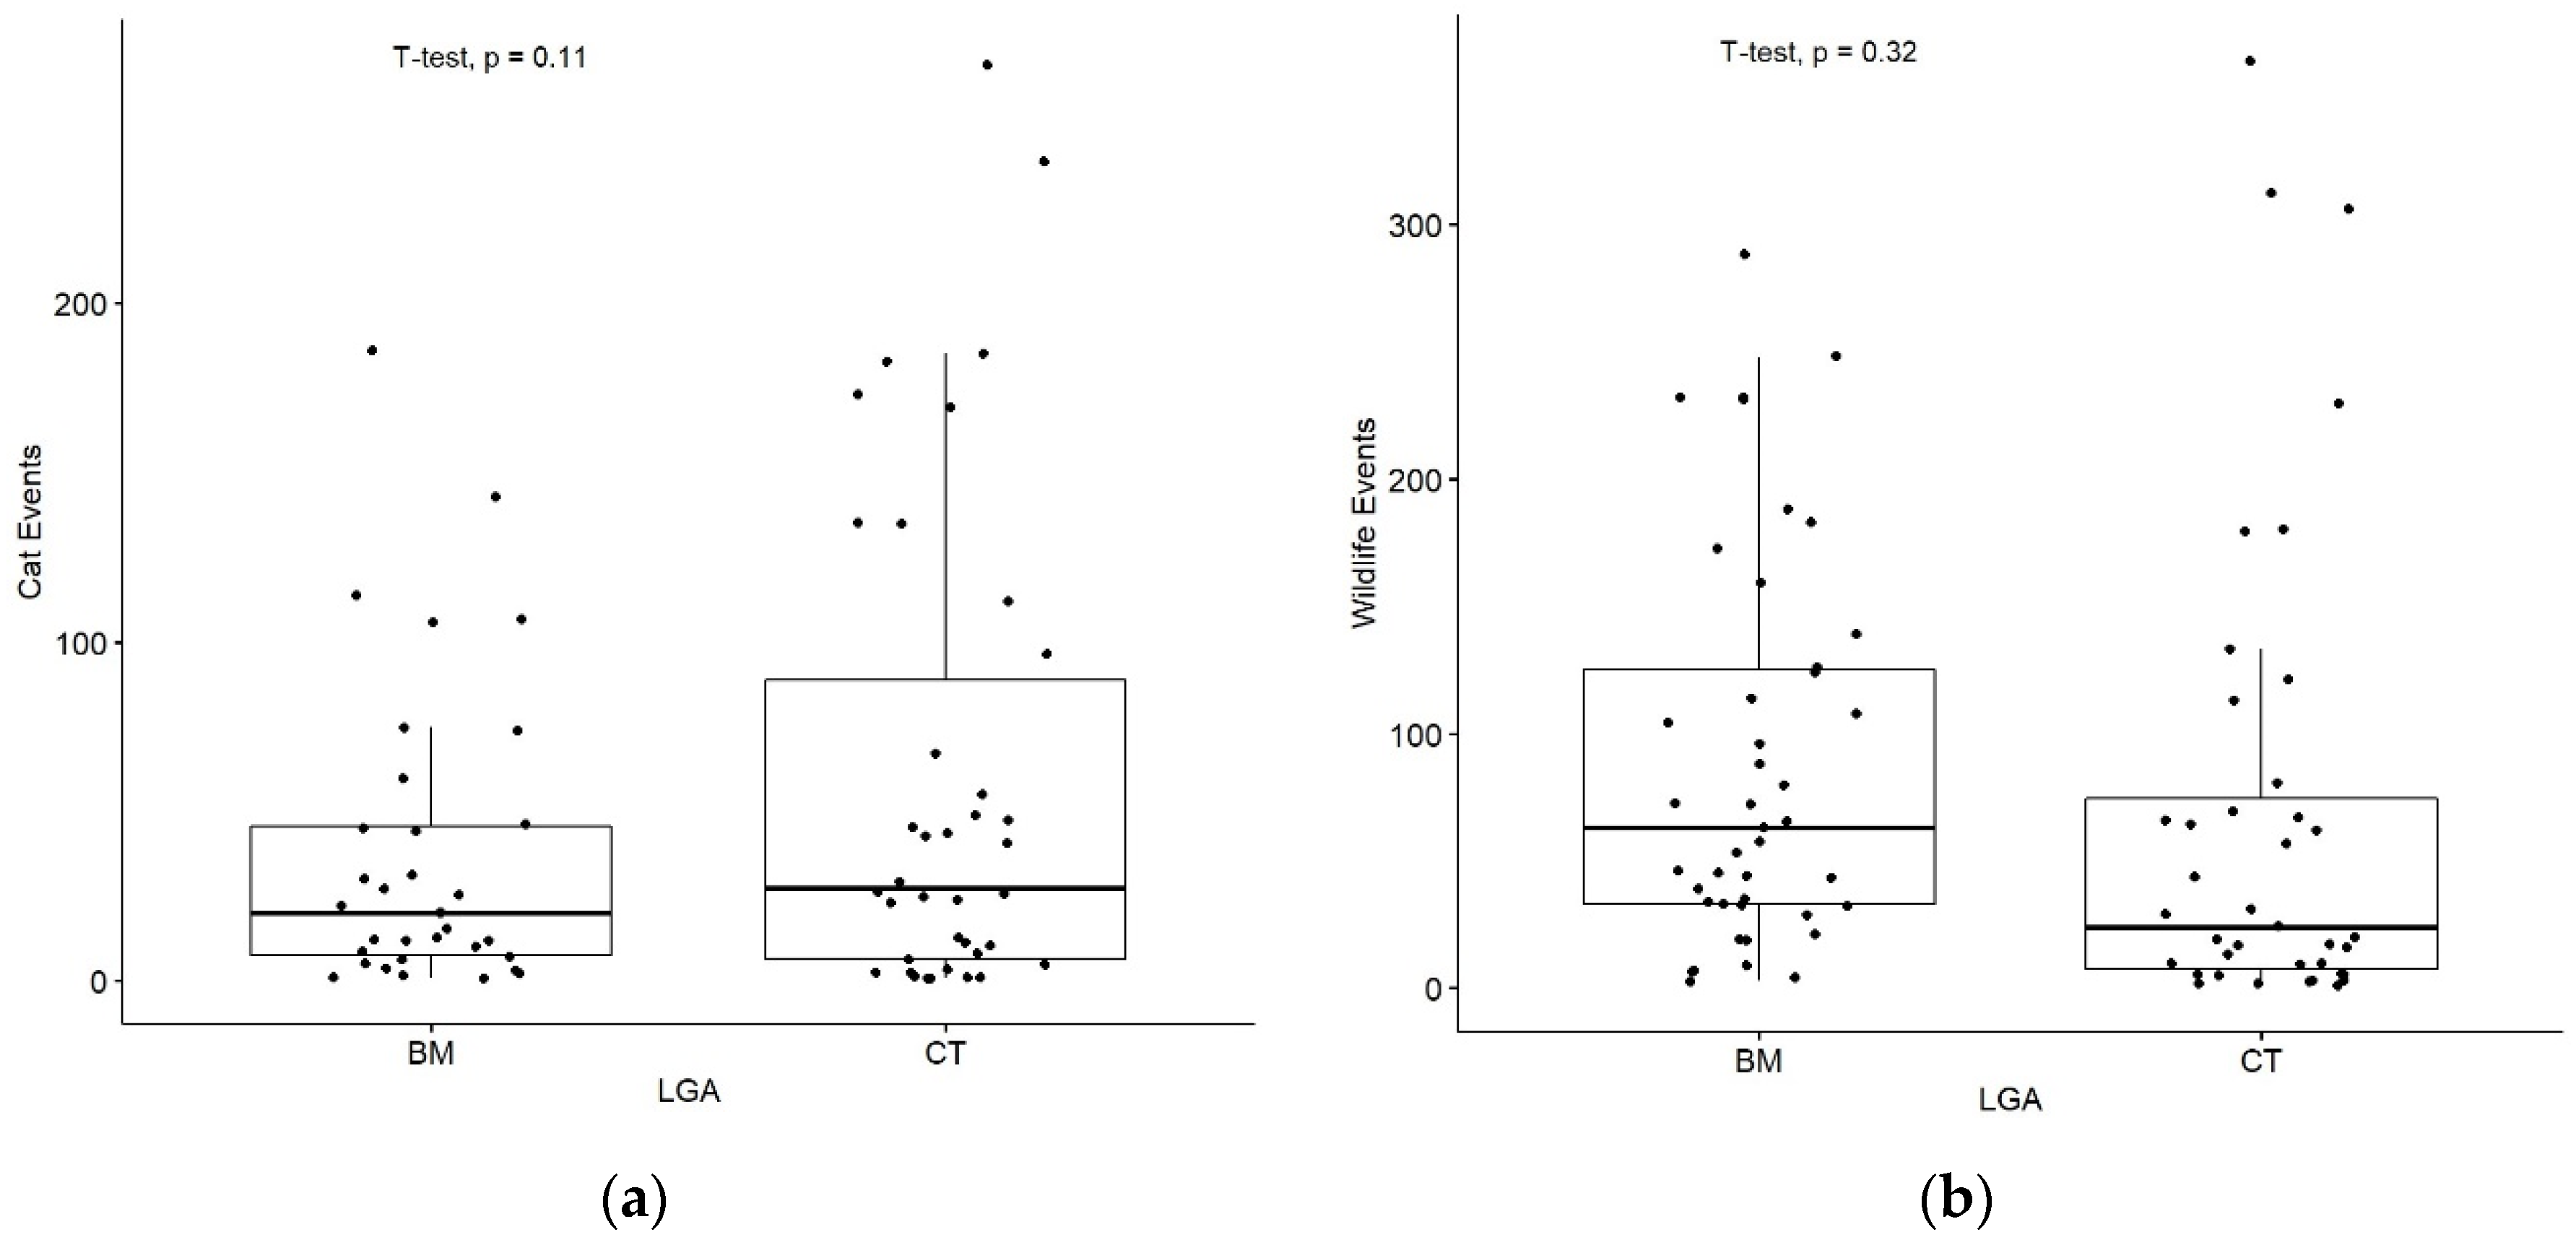
A Shapiro–Wilk test was conducted to compare the cat events observed and test for normality. Even if data was proven not to be normally distributed, a Welch Two Sample t-test was run for a small sample size. The Shapiro–Wilk test and the Welch Two Sample t-test were also run to compare wildlife events (including the tags: ‘BAN’, ‘BIRD’, ‘DOG’, ‘FOX’, ‘GOANNA’, ‘LIZ’, ‘MAC’, ‘POS’, and ‘SMLMAM’).
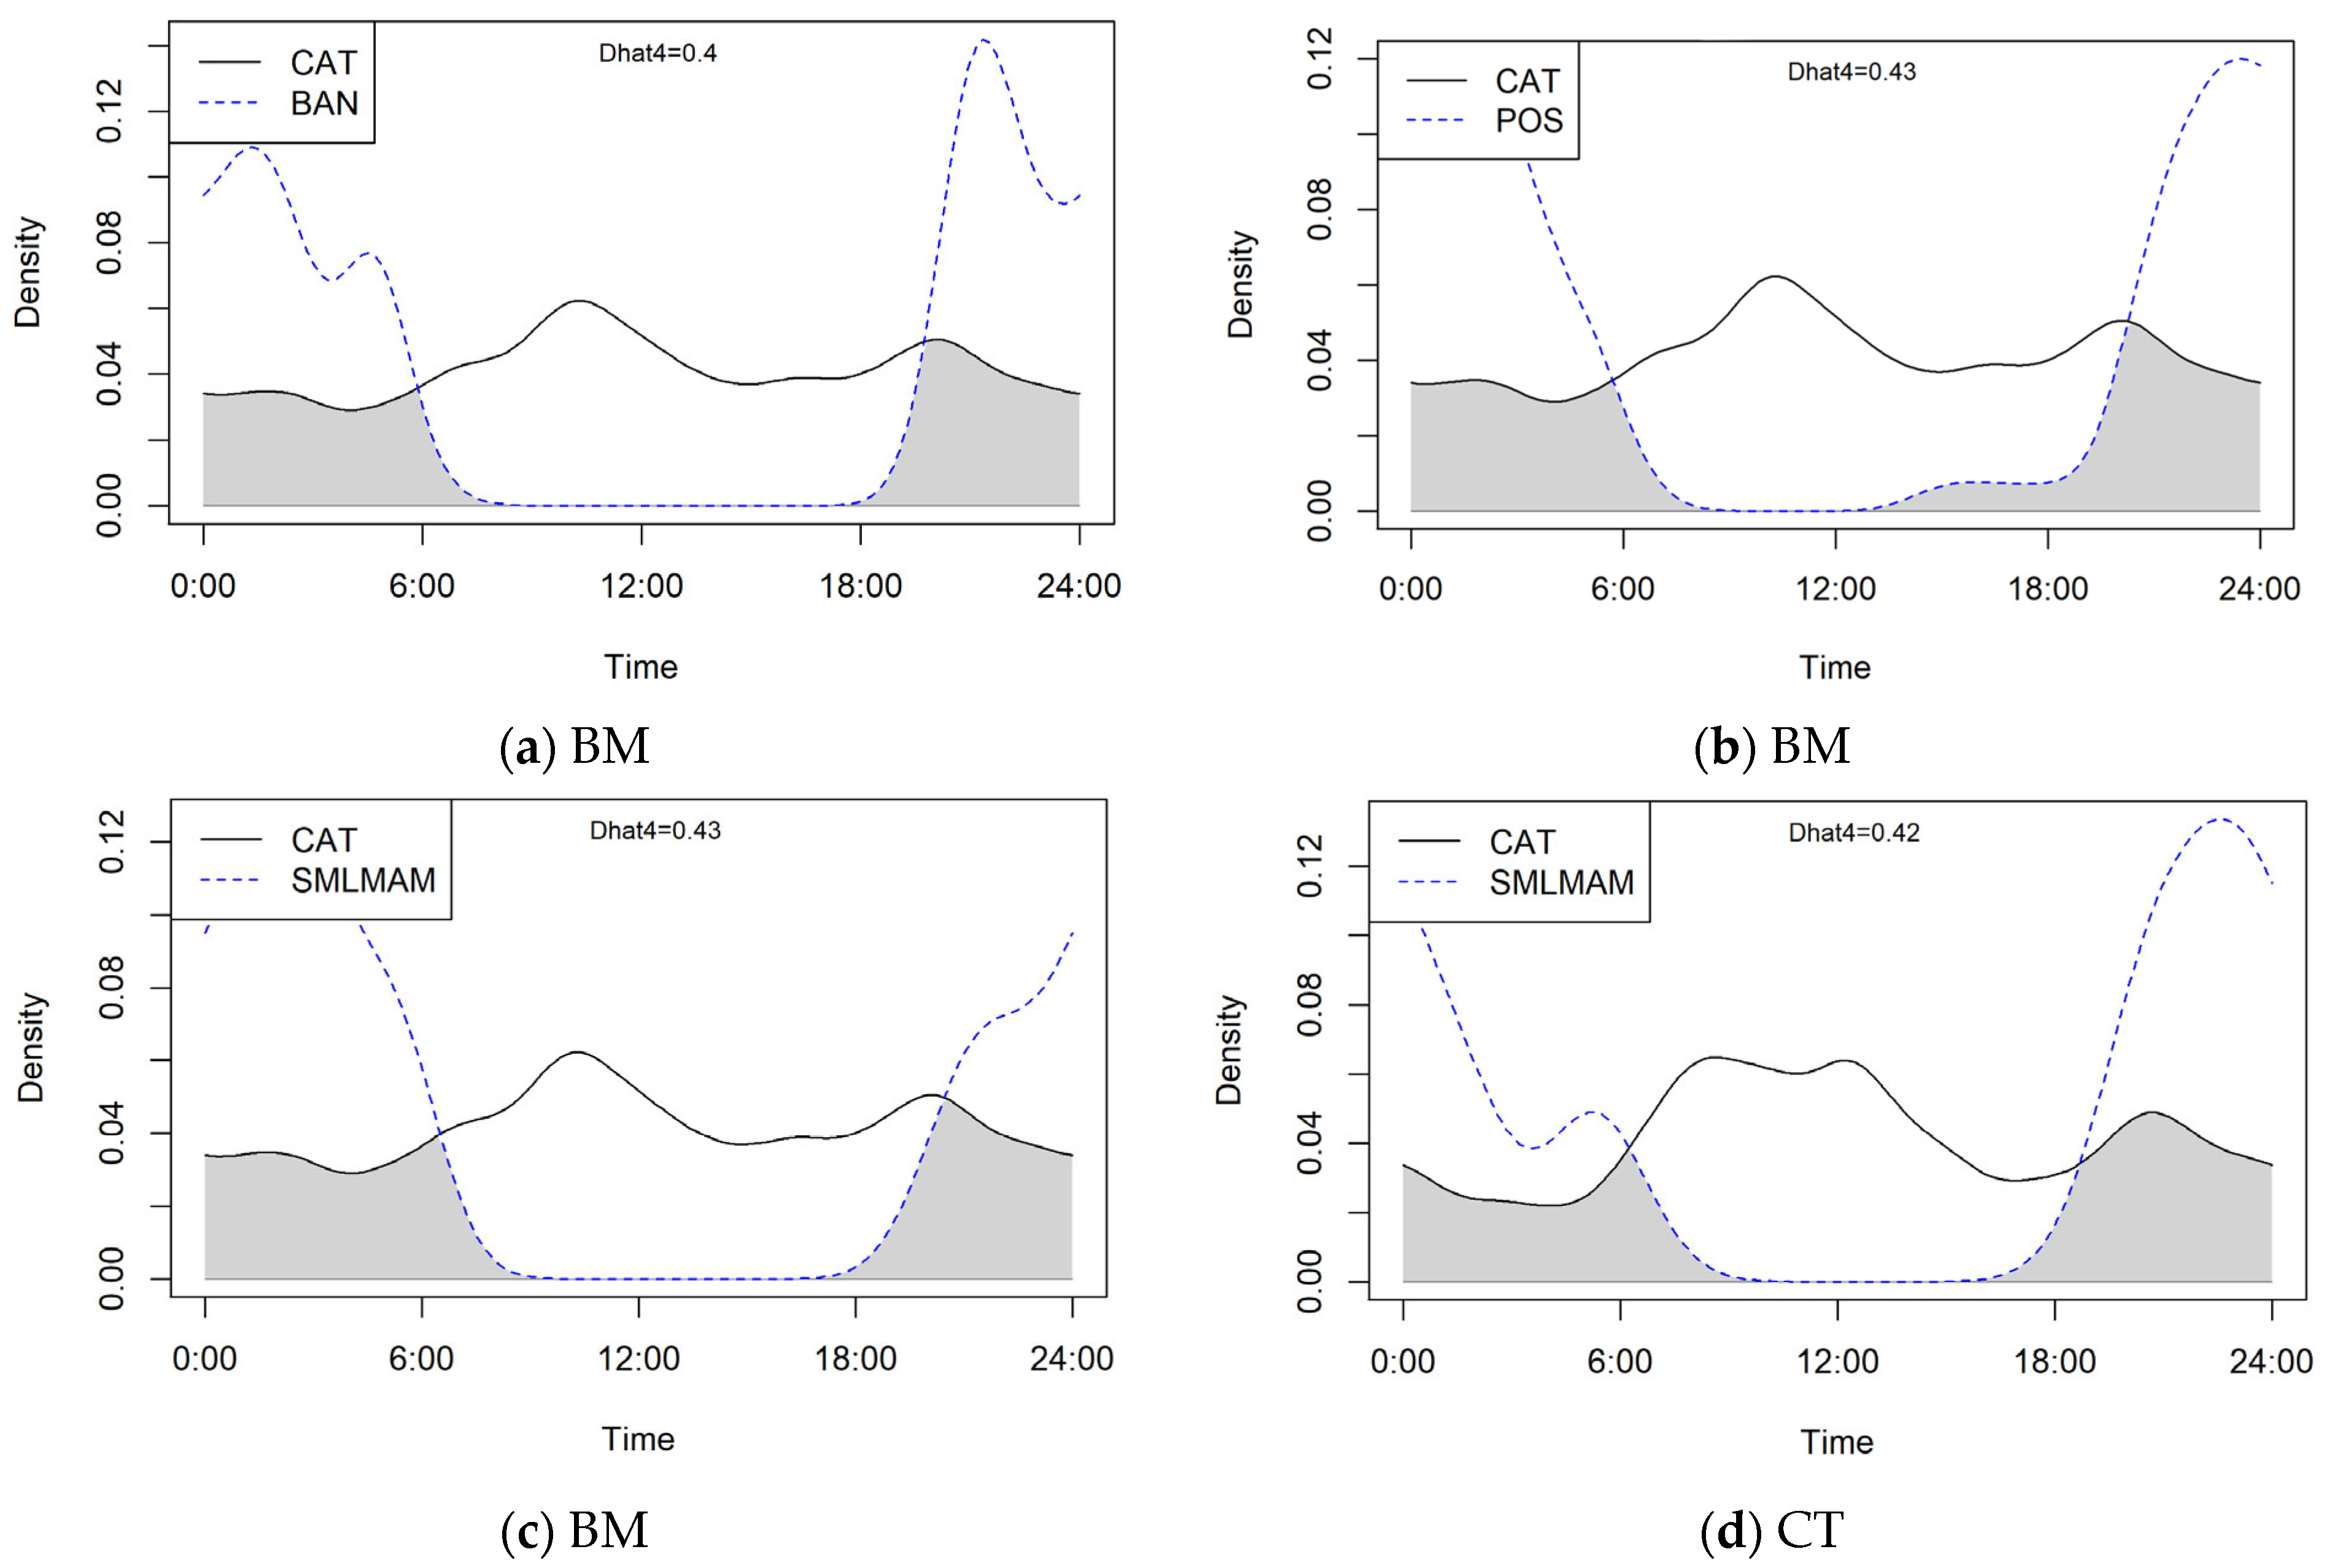
The overlap package in R Studio was used to determine the coefficient of overlapping of ‘CAT’ and ‘POS’, ‘BAN’ and ‘SMLMAM’. Dhat4 estimator was used due to the high sample sizes.
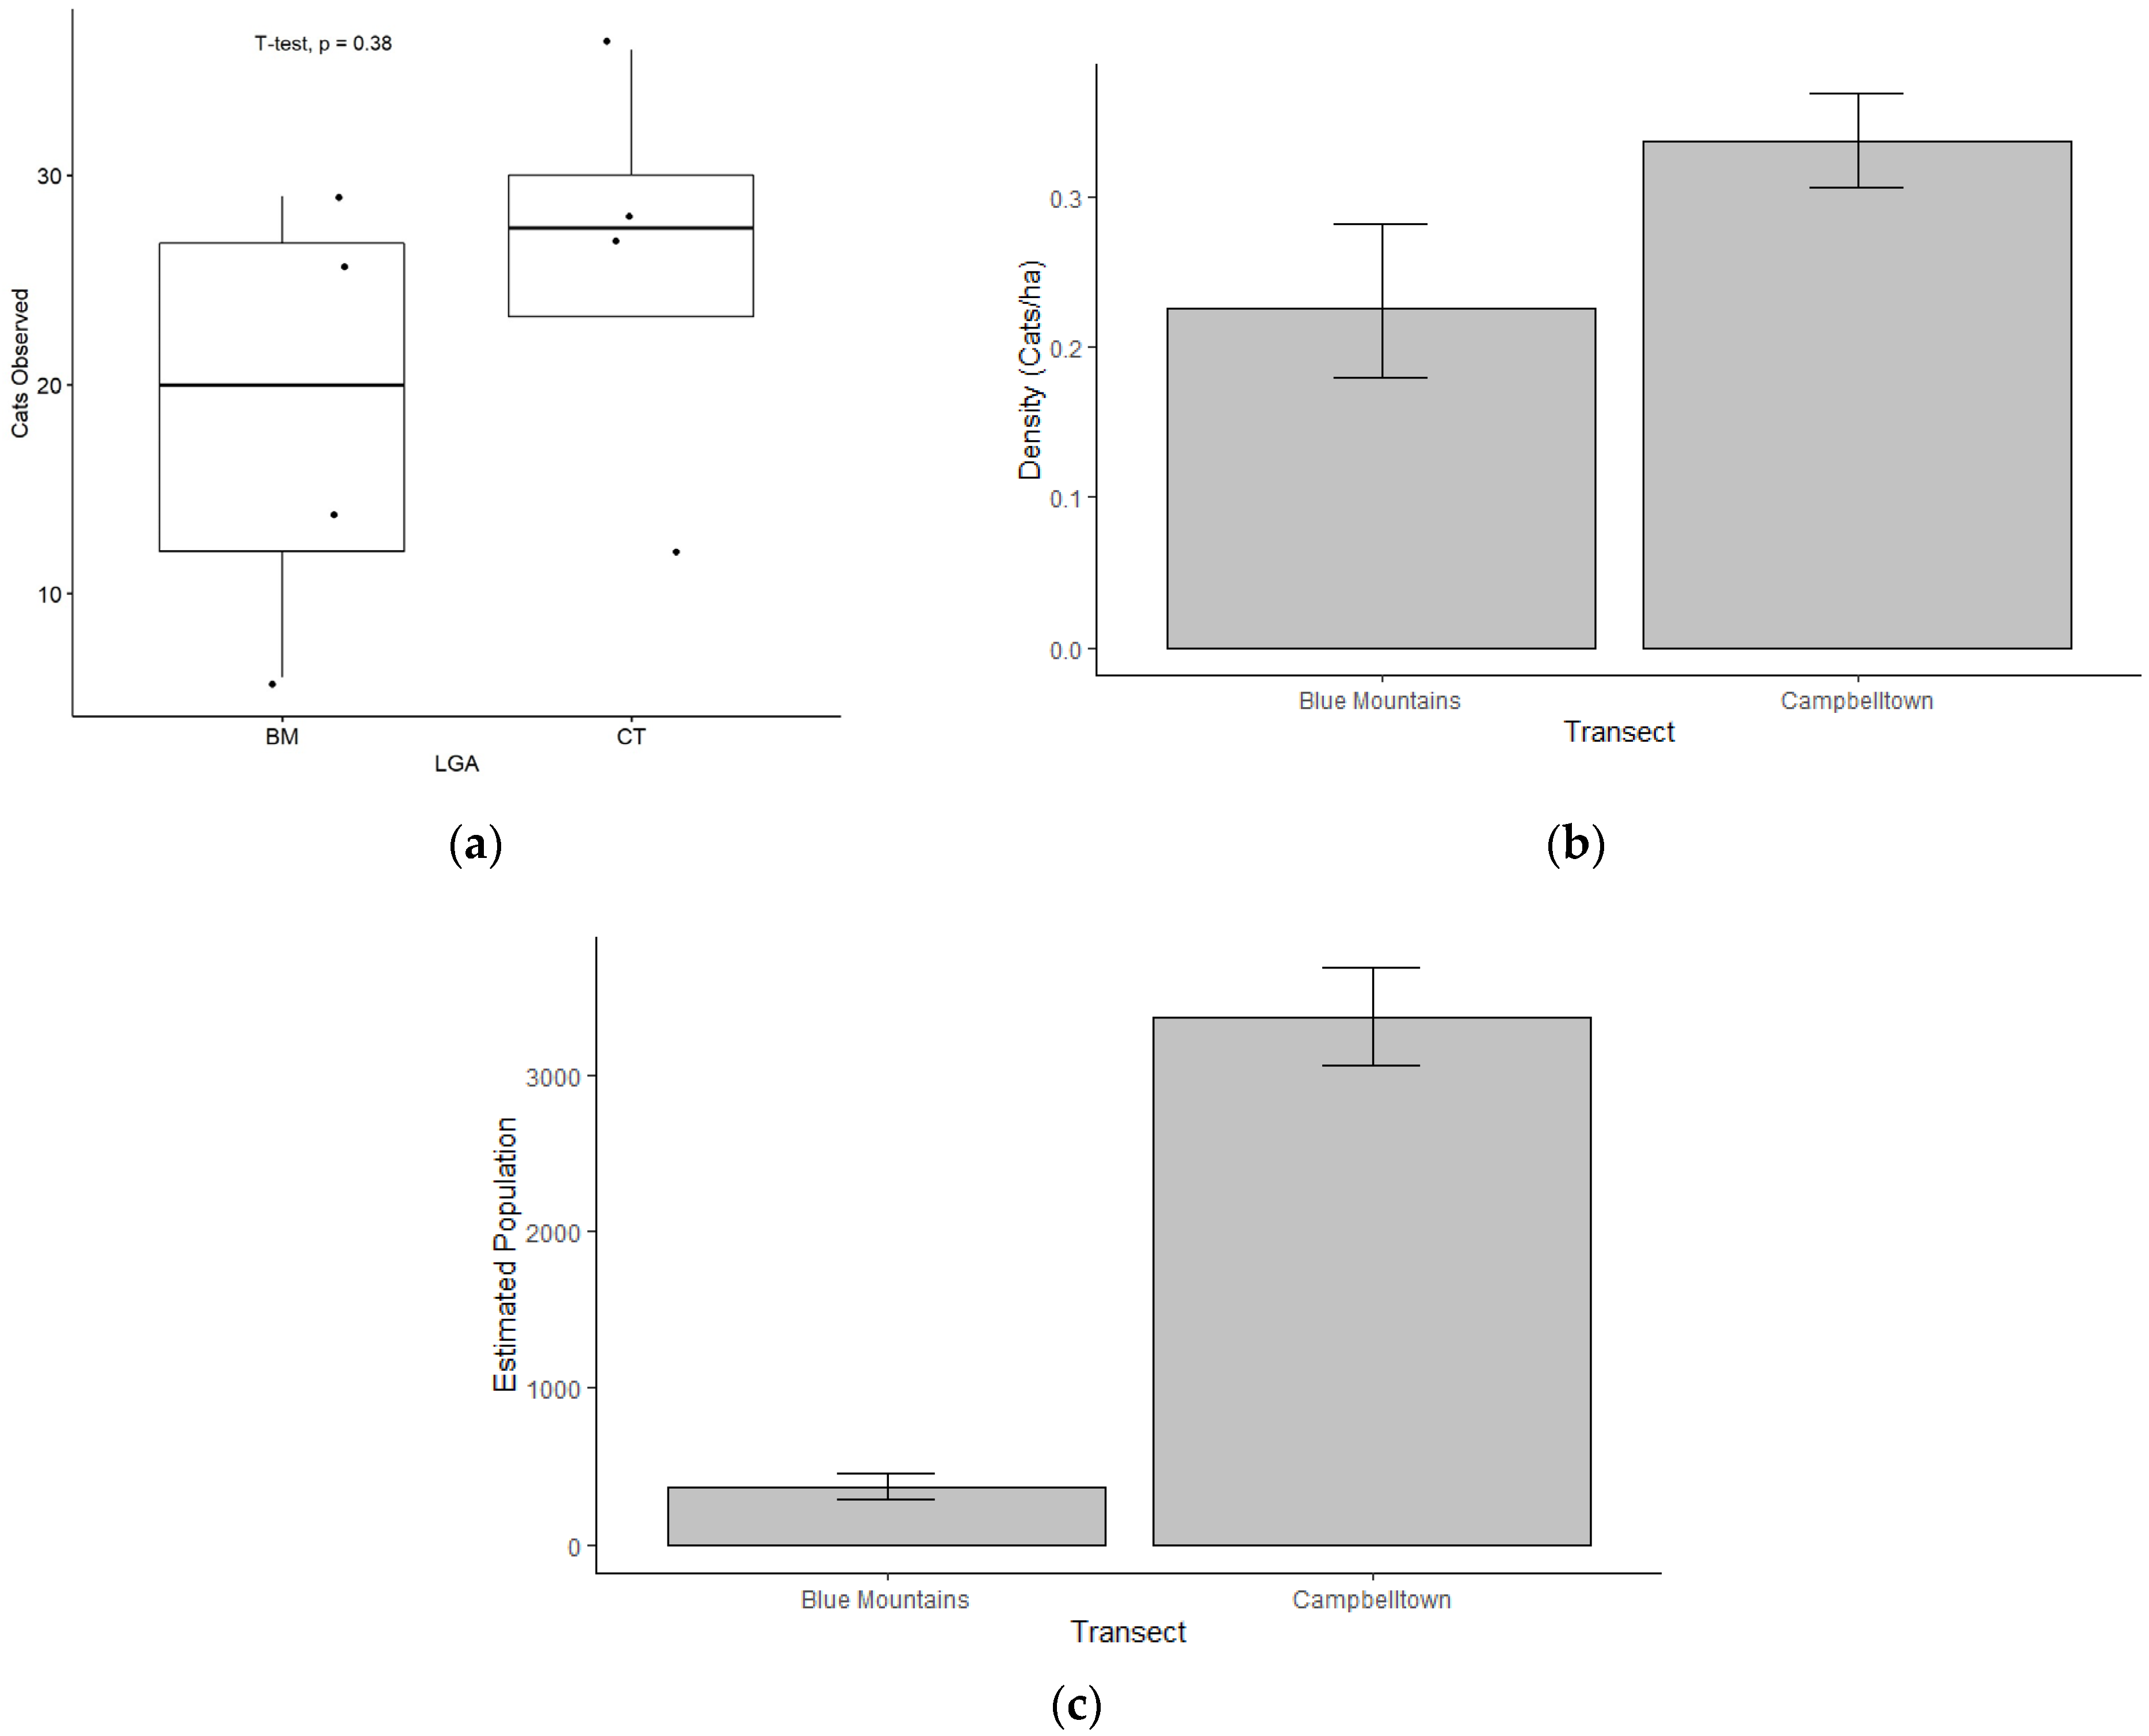
The transect drive data was entered manually into a Microsoft Excel file and loaded into R Studio for analysis. Three separate models were tested: (i) half-normal with cosine adjustments, (ii) uniform with cosine adjustments, and (iii) hazard-rate with simple polynomial adjustments. Akaike information criterion (AIC) was used to determine which would be the most suitable mode, with the lowest AIC number indicated the best-fitting model. The distance package in R Studio was used to estimate cat encounter rates (ER = number of cats/km), density (density of cats/ha) and abundance (estimated cat population), with associated levels of precision included in the form of standard error (SE). As the transects were conducted through residential areas only, cat abundance was extrapolated based only on the residential areas of the LGAs (1604 ha in the BM and 10,000 ha in CT) that were provided by the councils. Coefficient of variation (CV) and 95% confidence intervals (LCL and UCL) were also included. An unpaired t-test was conducted to compare the cats observed for each day between LGAs.
For all analyses, a p value < 0.05 was considered significant.

3. Results

3.1. Motion-Capture Cameras (Indirect Observations)

Of the 100 cameras, 87 (44 BM and 43 CT) successfully captured 30,029 events (14,277 BM and 15,752 CT) (Table A1 in Appendix A). Thirteen cameras (six BM and seven CT) were not included for various reasons including equipment error, human error, or public disturbance/removal. Of the 30,029 events, 57.9% (n = 17,380) were animals tagged under 14 categories (Table 3). The remaining 42.1% (n = 12,649) contained other moving objects (‘HUMN’ and ‘VEH’).
Cats were captured in 1289 events in the BM and 4118 in CT on 83.9% of the cameras (BM = 34/44 cameras and CT 39/43). A total of 195 individual cats were recorded (BM = 79 and CT = 116 cats). Using the occupancy modelling in R Studio, these results lead to predict that cats would appear at 76% of sites in the BM, and they would be detected on camera around 25% of the time when present (Table 4). In CT, cats were predicted to appear at 83% of sites and be detected 33% of the time when present (Table 4).
Cat roaming events captured per camera (for example in Figure 5) were higher in CT (mean events per camera = 60.76, median events per camera = 27.50, and total events = 4118) than the BM (mean = 37.91, median = 20.00, and total events = 1289), but this difference was not statistically significant between the two LGAs (p = 0.11, Welch Two Sample t-test; Figure 6a). Conversely, wildlife events captured per camera were higher in the BM (mean = 88.33, median = 63.00, and total events = 5580) compared to CT (mean = 69.15, median = 24.00, and total events = 2697); however, this difference was also not significant (p = 0.32, Welch Two Sample t-test; Figure 6b).
Cats were indirectly observed (i.e., captured on camera) throughout all hours of the day, however, cats were most often observed at around 9:30 am and 8:00 pm in the BM, and 7:00 am and 12:00 pm in CT (Figure 7). The temporal movements of cats were also plotted against wildlife observations to calculate overlap (Figure 7). For BM, 1252 cat observations were plotted against (a) 228 bandicoot, (b) 416 possum, and (c) 161 small mammal observations. For CT, 4099 cat and (d) 6 small mammal records were graphed (note: no bandicoots or possums were observed in CT). All four graphs show a general trend of overlapping activity between 6:00 pm and 7:00 am. Possums in the BM displayed more activity with overlap from around 1:00 pm. Small mammals in both the BM and CT also seemed to show more activity in the morning until around 9:00 am. The coefficient of overlapping was similar for all four graphs measuring between 0.4 and 0.43, suggesting an estimated overlap of 40% (a), 43% (b), 43% (c), and 42% (d) for cat and wildlife activity. Additionally, cats can be seen to be active throughout the entire day at both sites. Larger mammals (for example in Figure 8) were also observed.

3.2. Transect Drives (Direct Observations)

During the direct observations made on eight separate transect drives (four in each LGA), a total of 178 free-roaming cats were observed. Of these, 75 were in the BM and 103 in CT (Table A2 in Appendix A). In the BM, each observation during the transect drives recorded one cat at a time. Two cats were recorded together on one occasion in CT. Overall, the number of cats observed was higher in CT than the BM but was not statistically significant (p = 0.38; two sample t-test; Figure 9a). The ER (encounter rate of cats per km) was higher in CT (1.40) compared to the BM (0.94) (Table A3 in Appendix A). Overall, the standard error (SE) of the mean was low (BM 0.00, and CT 0.03), indicating little to no random error between sampling events, suggesting high precision in the monitoring model (Table A4 in Appendix A). The density of cats was estimated to be 0.31 cats/ha in CT compared to 0.21 cats/ha in the BM (Figure 9b), producing an overall estimated abundance of 361 free-roaming cats in the residential areas (1604 ha) of the BM and 3365 free-roaming cats in the residential areas (10,000 ha) of CT (Figure 9c).
Moreover, the SE for density was close to 0 (0.02 for both the BM and CT), implying no random error and a high precision model. The narrow limits between the upper and lower 95% confidence intervals (BM 0.15–0.29, and CT 0.24–0.39) further indicate the precision of the density data (Table A4 in Appendix A). However, SE for abundance was expectedly high (24.65 for the BM and 157.21 for CT; Table A5).

4. Discussion

The data from this observational study is the first to quantify free-roaming cats in the two LGAs of Greater Sydney, the Blue Mountains and Campbelltown. Both direct (transect drives) and indirect (motion-capture cameras) observations will provide the basis for the RSPCA NSW ‘Keeping Cats Safe at Home’ program in these LGAs and help to guide future management tools for free-roaming cats. This data may also enhance further research in the field of cat monitoring.
The use of motion-capture cameras is valuable for monitoring cat roaming as well as cat-wildlife interactions [7,54,55]. Only 83% of cameras successfully captured images (44 BM and 43 CT), compromising the reliability of results, but still enabling many events to be captured (30,029) including free-roaming cats (5407). The high number of cat observations collected in Campbelltown (4118) and the Blue Mountains (1289) enabled us to make a good foundational quantification to estimate cat numbers in each LGA, as well as to make other comparisons. Although accuracy might be questioned due to the definition of an ‘event’ meaning if captured after 60 s, the same cat would be identified as a separate event, the minimum number of individual cats was also recorded (BM = 79 and CT = 116 cats). The cat events (cameras) and density (transects) were higher in Campbelltown than the Blue Mountains as hypothesised, yet were not significant, despite the large difference in human population density (approximately 10 times higher in CT). Elizondo and Loss (2016) found no relationship between cat abundance and human population density nor between cat abundance and urban development intensity [54]. However, Finkler, Hatna and Terkel (2011) found that adult and kitten densities somewhat depended on socio-demographics, whilst Flockhart, Norris and Coe (2016) reported highest cat abundance in high-density low-income residential neighbourhoods [47,55]. Ownership status could not be determined for most cats in the current study, unless they were wearing a collar, meaning like other observation studies they could not be categorised further than domestic cat (F. catus) [56].
It is important to note that the current study was predominately carried out during the period of intensified cat oestrus in temperate regions of the southern hemisphere (approximately September to March) [57]. This means that our overall results may have been skewed to indicate higher levels of cat free-roaming due to migration associated with mating and increased libido in cats during this period. Therefore, results may differ from other times of the year when migrations may be lower, and further research would be required to evaluate the effect of seasonality.
The number of wildlife events captured was higher in the Blue Mountains (5580) than Campbelltown (2697) but was not statistically significant despite BM containing more natural habitat. Future research is needed to explain this trend, and although speculative at this stage, reduced numbers of wildlife in CT due to wildlife predation by cats is possible. Wildlife predation has been identified as a serious threat posed by free-roaming cats [4]. Further studies could focus on these relationships in greater detail to continue to assess cat behaviour and determine if levels of their wildlife predation are truly detrimental to the environments in which they roam, and whether ecosystem balances and biodiversity are directly impacted, particularly in these areas of Greater Sydney now that baseline data has been collected. Wildlife events in CT may also have included more generalist and urban adaptor species, flying bird species, ‘SMLMAM’ small mammals included under wildlife, and other tags less affected by the presence of cats, such as ‘DOG’ and ‘FOX’. There were also outlier cameras that may have contributed to this lack of statistical significance with high numbers recorded of one or more certain species; for example, camera 21 (CT) captured 234 guinea pig events, and camera 74 (BM) captured 1025 rabbit events.
The findings of this study have potentially important implications for cat management interventions with a One Health focus. One Health is an all-encompassing term that considers animal, human, and environmental health. The health of each aspect affects the others, particularly in terms of economic impacts and disease burden [58]. In addition to predating wildlife and affecting wildlife behaviour, free-roaming cats can carry pathogens affecting both other cats and non-feline animals including livestock [59]. For example, cats are the only definitive host of Toxoplasma gondii—the causative parasite of toxoplasmosis—and high cat densities are correlated with declining wildlife populations because of this disease [13,18]. T. gondii is prevalent in Australian wildlife, causing disease in many native mammal and bird species, and contributing to high mortality [17,19]. Cats can affect humans by spreading zoonotic diseases (e.g., cat scratch fever caused by the bacterium Bartonella henselae), injuring them, and displaying nuisance behaviour including spraying and fighting [30,60,61,62,63]. Another zoonotic disease that may be spread by free-roaming cats is visceral larva migrans, caused by a gastrointestinal ascarid (Toxocara cati), usually in young children following ingestion of contaminated soil [64]. The ability to accurately quantify cat populations is essential when monitoring and evaluating interventions to reduce the impacts of free-roaming cats on One Health. A further issue is the effect of cat control on mesopredators. For example, invasive rats have been known to increase with the removal of larger predators, such as cats [65,66,67]. However, smaller mammals, and in particularly fast-moving mammals, are difficult to identify on camera images, particularly when they are positioned to capture a different target (i.e., larger mammals, such as cats) [7].
The motion-capture cameras required little physical labour apart from setting up and had the benefit of continuous observation. However, the high number of cameras (100) made them relatively expensive (approximately $24,000 AUD total) including batteries, Secure Digital (SD) cards, chargers, shipping, and storage. It is general knowledge that cats are often crepuscular and nocturnal hunters, however, our results were not consistent with this as cats were observed throughout all hours of the day with peaks at around 9:30 am and 8:00 pm in the BM, and 7:00 am and 12:00 pm in CT [13]. This could be due to a high population of owned cats in these areas demonstrating free-roaming behaviours that might vary from feral and unowned cats. This has also been reported in other urban areas, where approximately 96.5% of individual cats were captured on cameras during both day and night [54]. The night range (10 m) was less than during the day so potential night roaming cat events might have been missed, again affecting the accuracy of the results. Further, although manual tagging of the images ensured high accuracy of identifying the events and the objects causing them, this aspect was labour intensive. Future studies using image tagging should seek to solve this issue by exploring other avenues, such as deep learning and artificial intelligence (AI). Other researchers have demonstrated that with the same 96.6% accuracy as humans, deep learning can automatically identify 99.3% of large image datasets [68].
The transect drives were a relatively quick (3 h per transect) method to directly observe free-roaming cat numbers with little to no cost equipment-wise, particularly in comparison to the cameras. They covered a large distance of residential area (80 km) in each LGA. The transects produced sample data for cat density which was estimated to have high precision amongst sampling events. They were, however, high-cost in labour with one driver and two to three people observing manually per drive. Furthermore, the timing of the transects (2:30 pm–5:30 pm) were selected to fit within the working hours of the council staff and volunteers. This timing does not align with when cats are more likely to be roaming [13]. Therefore, estimates of abundance may be underestimated. However, as this data is baseline, further transects conducted at the same times will be able to determine any changes in roaming behaviours.

5. Conclusions

This study provides a baseline for the RSPCA NSW Keeping Cats Safe at Home project for two LGAs in Greater Sydney, Campbelltown and the Blue Mountains, to be used for further studies. Observations found no statistical difference between cat events and wildlife events in the two LGAs. However, both cat numbers and density were higher in Campbelltown, and wildlife numbers were higher in the Blue Mountains. Cats were observed throughout both day and night, however, they were mostly observed roaming during early afternoon. Remote sensing cameras seem to be the most cost-effective tool to monitor free-roaming domestic cats, particularly in the context of wildlife conservation, and One Health interventions.

Author Contributions

Conceptualization, B.P.A.K. and G.C.M.; methodology, B.P.A.K.; formal analysis, I.J.L.D. and B.P.A.K.; investigation, I.J.L.D. and B.P.A.K.; resources, B.P.A.K., G.C.M. and M.E.W.; data curation, I.J.L.D. and B.P.A.K.; writing—original draft preparation, I.J.L.D.; writing—review and editing, I.J.L.D., B.P.A.K., G.C.M., M.E.W. and D.V.d.S.; visualization, I.J.L.D.; supervision, M.E.W., D.V.d.S. and B.P.A.K.; project administration, B.P.A.K., G.C.M. and M.E.W.; funding acquisition, G.C.M. and B.P.A.K. All authors have read and agreed to the published version of the manuscript.

Funding

This research is funded by the RSPCA NSW under a grant from the NSW Government through their Environmental Trust, Grant number: 2020/PROS/0001.

Institutional Review Board Statement

The animal study protocol was approved by the Ethics Committee of the University of New England (ARA21-051, Approved: 1 October 2021).

Informed Consent Statement

Informed consent was obtained from all subjects involved in the study.

Data Availability Statement

No new data other than those presented were created or analyzed in this study. Data sharing is not applicable to this article.

Acknowledgments

The authors sincerely acknowledge the RSPCA NSW. We acknowledge the Blue Mountain and Campbelltown Councils and their staff who assisted, and the local homeowners who volunteered their households to host cameras. We also acknowledge the volunteers who assisted in tagging images. The authors also acknowledge Tani Cooper (University of New England) for creating the maps in Figure 3.

Conflicts of Interest

The authors declare no conflict of interest. The funders had no role in the design of the study; in the collection, analyses, or interpretation of data; in the writing of the manuscript; or in the decision to publish the results.

Appendix A

Table A1. Collation of all successful cameras and events tagged. Cameras are separated by local government area (Campbelltown and the Blue Mountains) and events for each camera (numbered) are identified by tag: ‘BAN’ (bandicoot), ‘BIRD’, ‘CAT’, ‘DDOG’ (domestic dog), ‘DOG’ (other dog, e.g., wild dog/dingo), ‘FOX’, ‘GOANNA’, ‘GUPIG’ (guinea pig), ‘HOR’ (horse), ‘HUMN’ (human) ‘LIZ’ (lizard), ‘MAC’ (macropods), ‘POS’ (possum), ‘RAB’ (rabbit/hare), ‘SMLMAM’ (any mammal smaller than a bandicoot), and ‘VEH’ (vehicles).
Campbelltown (CT)
CamerasBANBIRDCATDDOGDOGFOXGOANNAGUPIGHORHUMNLIZMACPOSRABSMLMAMVEHTotal
1 69112 249 430
2 34495 433 575
3 65 11 2 32 1 111
4 64471 61 173
5 191835 175 382
6 3641 1 217 583
7 56263 1 386 472
10 62135 25 105
11 55 35 90
12 23062 267 505
13 29 9 38
14 343125 156 327
15 9 54 48 111
17 3151 53 90
18 229 35 66
19 3 40 43
20 58126 236 375
21 16173 234 163 586
22 2 33 35
23 17169 53 239
24 1791 151 1 332
25 651853 1 42 296
26 3092421 3 47 602
27 1809 9 1818
28 11324371 706 1214
29 3232 145 66239
30 17491 309 376
31 1014 51 66
32 1045 171 226
33 311 3033 320
34 123 97 103
35 441 101 146
36 79135 1 58 273
38 201351 48 204
39 121414 191 357
40 1 18 19
41 596 123 224
43 227095 3 845 1215
44 30626 540 872
46 13310 78 221
48 2467158 4723 6 982
49 13251 40 79
50 63239 67 1 421116 232
CT
Total
025664118111107802354750334311866615,752
Blue Mountains (BM)
54 7 1 8 11 27
55 2512 6 57 3716 4 157
57 122102 69 2 2 207
58 4125 204 2 227
59 12 35 21 41
61 159 373 532
62 231548 166 13 17 282
64 12451 5 31 426 142
65 101131 106 59 28 308
66 3512104 168 1 37 357
67 12430 204 358
68 65271 26 150 25 6 282
69 2446 1 157 14 4 246
70417407412 6 798 2 30 2666
71 8 7 70 15 2 102
72 9325121 2 55 13 309
73 11106110122 328 578
74 16860 77 5 10253 1338
75 58 683 747 1488
76 22920189 78 3 519
77 29442 164 239
78 7222 42 136
79 1657 168 2 16 358
80 4 1 2 7
815111623 147 20 294
82 231 5 59 295
83 32 1 7 40
84 62 3 11
85 1 1 43 45
86 831 8 25 45
87116 9 512 1 44
88111031 6213 127
89 14511 21 22 1 47
90 41 9 22 72
92 219186 65 12 1 483
93 19 93 2 105
94 151757 105 22 360
95936143 71 67 2 328
96 46114 162 322
971784120 115 67 2 423
981151 151 1 34
99217107 94 220
100931 1 3 5 1112 21 51
BM Total2304285128913037216300508012454171025176014,277
Total23068515407241472943235412,583428841810431826630,029
Table A2. Direct observational free-roaming cat data collected during the transect drives collated by distance and site (Blue Mountains or Campbelltown). LGA = local government area.
LGADistance (m) *Free-Roaming Cats
Blue Mountains03
21
31
512
72
1025
1511
208
256
303
351
501
601
Blue Mountains Total 75
Campbelltown21
31
41
56
74
86
1030
122
1528
183
2014
253
304
Campbelltown Total 103
Grand Total 178
* Distance in metres (m) observed from the vehicle.
Table A3. Summary data of cat transects completed in April 2022 in the Blue Mountains and Campbelltown local government areas (LGAs) adapted from R Studio output where: ‘Area’ sample area (ha) covered during the transect, ‘Length’ length of transect (km), ‘n’ number of cats identified, ‘ER’ encounter rate, ‘Mean’ n per observation, and ‘SE’ standard error.
LGAArea (ha)Length (km)nERMeanSE
Blue Mountains96080750.941.000.00
Campbelltown960801121.401.090.03
Total19201601871.171.050.02
Table A4. Estimate of cat density as calculated from cat transects completed during April 2022 within the two local government areas (LGAs) of the Blue Mountains (BM) and Campbelltown (CT). Adapted from R Studio output where: ‘Density’ density estimate (cats/ha), ‘SE’ standard error, ‘CV’ coefficient of variation, ‘LCL’ lower 95% confidence interval, ‘UCL’ upper 95% confidence interval, ‘DF’ degrees of freedom.
LGADensitySECVLCLUCLDF
Blue Mountains0.210.020.090.150.292.30
Campbelltown0.310.020.080.240.393.14
Table A5. Estimate of cat abundance as calculated from cat transects completed during April 2022 within the two local government areas (LGAs) of the Blue Mountains (BM) and Campbelltown (CT). Adapted from R Studio output where: ‘Abundance’ total population estimate (extrapolated), ‘SE’ standard error, ‘CV’ coefficient of variation, ‘LCL’ lower 95% confidence interval, ‘UCL’ upper 95% confidence interval, ‘DF’ degrees of freedom.
LGAAbundanceSECVLCLUCLDF
Blue Mountains361.4124.650.07288.67452.492.82
Campbelltown3364.77157.210.053062.993696.2745.55

References

  1. Natoli, E.; Ziegler, N.; Dufau, A.; Pinto Teixeira, M. Unowned free-roaming domestic cats: Reflection of animal welfare and ethical aspects in animal laws in six European countries. JAAE 2019, 2, 38–56. [Google Scholar] [CrossRef]
  2. Loss, S.R.; Marra, P.P. Population impacts of free-ranging domestic cats on mainland vertebrates. Front. Ecol. Environ. 2017, 15, 502–509. [Google Scholar] [CrossRef]
  3. RSPCA Australia. Summary of Findings and Recommendations: Identifying Best Practice Domestic Cat Management in Australia; RSPCA Australia: Deakin West, Australia, 2018. [Google Scholar]
  4. Hadidian, J. Cats and Wildlife: An Animal Welfare Perspective; WellBeing International Studies Repository: Potomac, MD, USA, 2021. [Google Scholar]
  5. Animal Medicines Australia. Pets and the Pandemic: A Social Research Snapshot of Pets and People in the COVID-19 Era. 2021. Available online: https://animalmedicinesaustralia.org.au/report/pets-and-the-pandemic-a-social-research-snapshot-of-pets-and-people-in-the-covid-19-era-2/ (accessed on 21 October 2022).
  6. Foreman-Worsley, R.; Finka, L.R.; Ward, S.J.; Farnworth, M.J. Indoors or outdoors? An international exploration of owner demographics and decision making associated with lifestyle of pet cats. Animals 2021, 11, 253. [Google Scholar] [CrossRef] [PubMed]
  7. Kennedy, B.; Brown, W.Y.; Vernes, K.; Kortner, G.; Butler, J.R.A. Dog and cat interactions in a remote Aboriginal community. Animals 2018, 8, 65. [Google Scholar] [CrossRef] [PubMed]
  8. Legge, S.; Murphy, B.P.; McGregor, H.; Woinarski, J.C.Z.; Augusteyn, J.; Ballard, G.; Baseler, M.; Buckmaster, T.; Dickman, C.R.; Doherty, T.; et al. Enumerating a continental-scale threat: How many feral cats are in Australia? Biol. Conserv. 2017, 206, 293–303. [Google Scholar] [CrossRef]
  9. Gunther, I.; Hawlena, H.; Azriel, L.; Gibor, D.; Berke, O.; Klement, E. Reduction of free-roaming cat population requires high-intensity neutering in spatial contiguity to mitigate compensatory effects. Proc. Natl. Acad. Sci. USA 2022, 119, e2119000119. [Google Scholar] [CrossRef]
  10. Scott, K.C.; Levy, J.K.; Crawford, P.C. Characteristics of free-roaming cats evaluated in a trap-neuter-return program. J. Am. Vet. Med. 2002, 221, 1136–1138. [Google Scholar] [CrossRef]
  11. Legge, S.; Woinarski, J.C.Z.; Dickman, C.R.; Murphy, B.P.; Woolley, L.-A.; Calver, M.C. We need to worry about Bella and Charlie: The impacts of pet cats on Australian wildlife. Wildl. Res. 2020, 47, 523–539. [Google Scholar] [CrossRef]
  12. Johnson-Bennett, P. Cat vs. Cat: Keeping Peace When You Have More than One Cat; Penguin Books: New York, NY, USA, 2020. [Google Scholar]
  13. Brown, S. The Cat: A Natural History; Princeton University Press: Princeton, NJ, USA, 2020. [Google Scholar]
  14. Roetman, P.; Tindle, H.; Litchfield, C.; Chiera, B.; Quinton, G.; Kikillus, H.; Bruce, D.; Kays, R. Cat Tracker South Australia: Understanding Pet Cats through Citizen Science; Discovery Circle, University of South Australia: Adelaide, Australia, 2017. [Google Scholar]
  15. Westman, M.E.; Coggins, S.J.; van Dorsselaer, M.; Norris, J.M.; Squires, R.A.; Thompson, M.; Malik, R. Feline immunodeficiency virus (FIV) infection in domestic pet cats in Australia and New Zealand: Guidelines for diagnosis, prevention and management. Aust. Vet. J. 2022, 100, 345–359. [Google Scholar] [CrossRef]
  16. Westman, M.; Norris, J.; Malik, R.; Hofmann-Lehmann, R.; Harvey, A.; McLuckie, A.; Perkins, M.; Schofield, D.; Marcus, A.; McDonald, M.; et al. The diagnosis of feline leukaemia virus (FeLV) infection in owned and group-housed rescue cats in Australia. Viruses 2019, 11, 503. [Google Scholar] [CrossRef]
  17. Woinarski, J.C.Z.; Legge, S.; Dickman, C.R. Cats in Australia: Companion and Killer; CSIRO Publishing: Clayton South, Australia, 2019. [Google Scholar] [CrossRef]
  18. Fancourt, B.A.; Nicol, S.C.; Hawkins, C.E.; Jones, M.E.; Johnson, C.N. Beyond the disease: Is Toxoplasma gondii infection causing population declines in the eastern quoll (Dasyurus viverrinus)? IJP-PAW 2014, 3, 102–112. [Google Scholar] [CrossRef] [PubMed]
  19. Hillman, A.E.; Lymbery, A.J.; Thompson, R.C. Is Toxoplasma gondii a threat to the conservation of free-ranging Australian marsupial populations? IJP-PAW 2016, 5, 17–27. [Google Scholar] [CrossRef] [PubMed]
  20. Bonnington, C.; Gaston, K.J.; Evans, K.L.; Whittingham, M. Fearing the feline: Domestic cats reduce avian fecundity through trait-mediated indirect effects that increase nest predation by other species. J. Appl. Ecol. 2013, 50, 15–24. [Google Scholar] [CrossRef]
  21. Fleming, P.A.; Stobo-Wilson, A.M.; Crawford, H.M.; Dawson, S.J.; Dickman, C.R.; Doherty, T.S.; Fleming, P.J.S.; Newsome, T.M.; Palmer, R.; Thompson, J.A.; et al. Distinctive diets of eutherian predators in Australia. R. Soc. Open Sci. 2022, 9, 220792. [Google Scholar] [CrossRef]
  22. Medina, F.M.; Bonnaud, E.; Vidal, E.; Tershy, B.R.; Zavaleta, E.S.; Josh Donlan, C.; Keitt, B.S.; Corre, M.; Horwath, S.V.; Nogales, M. A global review of the impacts of invasive cats on island endangered vertebrates. Glob. Chang. Biol. 2011, 17, 3503–3510. [Google Scholar] [CrossRef]
  23. Woinarski, J.C.Z.; Murphy, B.P.; Palmer, R.; Legge, S.M.; Dickman, C.R.; Doherty, T.S.; Edwards, G.; Nankivell, A.; Read, J.L.; Stokeld, D. How many reptiles are killed by cats in Australia? Wildl. Res. 2018, 45, 247–266. [Google Scholar] [CrossRef]
  24. Woinarski, J.C.Z.; Murphy, B.P.; Legge, S.M.; Garnett, S.T.; Lawes, M.J.; Comer, S.; Dickman, C.R.; Doherty, T.S.; Edwards, G.; Nankivell, A.; et al. How many birds are killed by cats in Australia? Biol. Conserv. 2017, 214, 76–87. [Google Scholar] [CrossRef]
  25. Rowan, A.N.; Kartal, T.; Hadidian, J. Cat Demographics & Impact on Wildlife in the USA, the UK, Australia and New Zealand: Facts and Values. JAAE 2019, 2, 7–37. [Google Scholar] [CrossRef]
  26. Loss, S.R.; Will, T.; Marra, P.P. The impact of free-ranging domestic cats on wildlife of the United States. Nat. Commun. 2013, 4, 1396. [Google Scholar] [CrossRef]
  27. Bengsen, A.; Butler, J.; Masters, P. Estimating and indexing feral cat population abundances using camera traps. Wildl. Res. 2011, 38, 732–739. [Google Scholar] [CrossRef]
  28. Hartley, S.; Wittmer, H. Evaluation of remote cameras for monitoring multiple invasive mammals in New Zealand. N. Z. J. Ecol. 2018, 42, 74–79. [Google Scholar] [CrossRef]
  29. Thompson, G.G.; Thompson, S.A.; Bengsen, A. The value of camera traps in monitoring a feral-cat and fox reduction program. Wildl. Res. 2019, 46, 599–609. [Google Scholar] [CrossRef]
  30. Pirie, T.J.; Thomas, R.L.; Fellowes, M.D.E. Pet cats (Felis catus) from urban boundaries use different habitats, have larger home ranges and kill more prey than cats from the suburbs. Landsc. Urban. Plan. 2022, 220, 104338. [Google Scholar] [CrossRef]
  31. Blue Mountains City Council. About us City of Blue Mountains. Available online: https://www.bmcc.nsw.gov.au/about-us/city-of-blue-mountains (accessed on 1 October 2022).
  32. NSW National Parks & Wildlife Service. Dharawal National Park, Dharawal Nature Reserve and Dharawal State Conservation Area Plan of Management; Environment and Heritage Group, Department of Planning, Industry and Environment: Parramatta, Australia, 2022. [Google Scholar]
  33. Australian Bureau of Statistics. Blue Mountains 2021 Census All Persons QuickStats. Available online: https://www.abs.gov.au/census/find-census-data/quickstats/2021/LGA10900 (accessed on 26 October 2022).
  34. Australian Bureau of Statistics. Campbelltown (NSW) 2021 Census All Persons QuickStats. Available online: https://www.abs.gov.au/census/find-census-data/quickstats/2021/LGA11500 (accessed on 26 October 2022).
  35. RSPCA NSW. Keeping Cats Safe at Home. Available online: https://www.rspcansw.org.au/keeping-cats-safe/#1500602646477-e31c26ac-8102 (accessed on 20 October 2022).
  36. Blue Mountains City Council. RSPCA NSW Keeping Cats Safe at Home. Available online: https://yoursay.bmcc.nsw.gov.au/keeping-cats-safe-at-home (accessed on 20 October 2022).
  37. McCarthy, M.; Bigelow, J.; Taylor, M. Emergency preparedness and planning for animals: A case study in the Blue Mountains, NSW. AJEM 2018, 33, 50–56. [Google Scholar]
  38. Toribio, J.A.; Norris, J.M.; White, J.D.; Dhand, N.K.; Hamilton, S.A.; Malik, R. Demographics and husbandry of pet cats living in Sydney, Australia: Results of cross-sectional survey of pet ownership. J. Feline. Med. Surg. 2009, 11, 449–461. [Google Scholar] [CrossRef] [PubMed]
  39. Bureau of Meteorology. Mean Maximum Temperature—Katoomba (Farnells Rd). Available online: http://www.bom.gov.au/jsp/ncc/cdio/weatherData/av?p_nccObsCode=36&p_display_type=dataFile&p_startYear=&p_c=&p_stn_num=063039 (accessed on 14 October 2022).
  40. Bureau of Meteorology. Monthly Rainfall—Katoomba (Farnells Rd). Available online: http://www.bom.gov.au/jsp/ncc/cdio/weatherData/av?p_nccObsCode=139&p_display_type=dataFile&p_startYear=&p_c=&p_stn_num=063039 (accessed on 14 October 2022).
  41. Bureau of Meteorology. Mean Minimum Temperature—Katoomba (Farnells Rd). Available online: http://www.bom.gov.au/jsp/ncc/cdio/weatherData/av?p_nccObsCode=38&p_display_type=dataFile&p_startYear=&p_c=&p_stn_num=063039 (accessed on 14 October 2022).
  42. Bureau of Meteorology. Mean Minimum Temperature—Campbelltown (Mount Annan). Available online: http://www.bom.gov.au/jsp/ncc/cdio/weatherData/av?p_nccObsCode=38&p_display_type=dataFile&p_startYear=&p_c=&p_stn_num=068257 (accessed on 14 October 2022).
  43. Bureau of Meteorology. Mean Maximum Temperature—Campbelltown (Mount Annan). Available online: http://www.bom.gov.au/jsp/ncc/cdio/weatherData/av?p_nccObsCode=36&p_display_type=dataFile&p_startYear=&p_c=&p_stn_num=068257 (accessed on 14 October 2022).
  44. Bureau of Meteorology. Mean Rainfall—Campbelltown (Mount Annan). Available online: http://www.bom.gov.au/jsp/ncc/cdio/weatherData/av?p_nccObsCode=139&p_display_type=dataFile&p_startYear=&p_c=&p_stn_num=068257 (accessed on 14 October 2022).
  45. Ma, G.; McLeod, L. Understanding what influences whether cat owners contain their cats: Identifying opportunities for behaviour change. Animals 2023, 13, 1630. [Google Scholar] [CrossRef]
  46. Lilith, M.; Calver, M.C.; Garkaklis, M.J. Roaming habits of pet cats on the suburban fringe in Perth, Western Australia: What size buffer zone is needed to protect wildlife in reserves? Aust. J. Zool. 2008, 34, 65–72. [Google Scholar] [CrossRef]
  47. Flockhart, D.T.T.; Norris, D.R.; Coe, J.B. Predicting free-roaming cat population densities in urban areas. Anim. Conserv. 2016, 19, 472–483. [Google Scholar] [CrossRef]
  48. Bureau of Meteorology. Daily Minimum Temperature—Katoomba (Farnells Rd). Available online: http://www.bom.gov.au/jsp/ncc/cdio/weatherData/av?p_nccObsCode=136&p_display_type=dailyDataFile&p_startYear=1982&p_c=-387573816&p_stn_num=044021 (accessed on 15 October 2022).
  49. Bureau of Meteorology. Daily Maximum Temperature—Katoomba (Farnells Rd). Available online: http://www.bom.gov.au/jsp/ncc/cdio/weatherData/av?p_nccObsCode=122&p_display_type=dailyDataFile&p_startYear=&p_c=&p_stn_num=063039 (accessed on 15 October 2022).
  50. Bureau of Meteorology. Daily Rainfall—Katoomba (Farnells Rd). Available online: http://www.bom.gov.au/jsp/ncc/cdio/weatherData/av?p_nccObsCode=136&p_display_type=dailyDataFile&p_startYear=&p_c=&p_stn_num=063039 (accessed on 15 October 2022).
  51. Bureau of Meteorology. Daily Rainfall—Campbelltown (Mount Annan). Available online: http://www.bom.gov.au/jsp/ncc/cdio/weatherData/av?p_nccObsCode=136&p_display_type=dailyDataFile&p_startYear=&p_c=&p_stn_num=068257 (accessed on 15 October 2022).
  52. Bureau of Meteorology. Daily Minimum Temperature—Campbelltown (Mount Annan). Available online: http://www.bom.gov.au/jsp/ncc/cdio/weatherData/av?p_nccObsCode=123&p_display_type=dailyDataFile&p_startYear=&p_c=&p_stn_num=068257 (accessed on 15 October 2022).
  53. Bureau of Meteorology. Daily Maximum Temperature—Campbelltown (Mount Annan). Available online: http://www.bom.gov.au/jsp/ncc/cdio/weatherData/av?p_nccObsCode=122&p_display_type=dailyDataFile&p_startYear=&p_c=&p_stn_num=068257 (accessed on 15 October 2022).
  54. Elizondo, E.C.; Loss, S.R. Using trail cameras to estimate free-ranging domestic cat abundance in urban areas. Wildl. Biol. 2016, 22, 246–252. [Google Scholar] [CrossRef]
  55. Finkler, H.; Hatna, E.; Terkel, J. The influence of neighbourhood socio-demographic factors on densities of free-roaming cat populations in an urban ecosystem in Israel. Wildl. Res. 2011, 38, 235–243. [Google Scholar] [CrossRef]
  56. Kuhne, F.; Hoock, K.; Kramer, M. Cat Owners: How they Keep and Care for Their Own Cats and Their Attitudes to Stray and Feral Cats in Germany. AVS 2019, 7, 24. [Google Scholar] [CrossRef]
  57. Faya, M.; Carranza, A.; Priotto, M.; Abeya, M.; Diaz, J.D.; Gobello, C. Domestic queens under natural temperate photoperiod do not manifest seasonal anestrus. Anim. Reprod. Sci. 2011, 129, 78–81. [Google Scholar] [CrossRef] [PubMed]
  58. Shaheen, M.N.F. The concept of one health applied to the problem of zoonotic diseases. Rev Med Virol. 2022, 32, 2326. [Google Scholar] [CrossRef]
  59. Gibbs, E.P.J. The evolution of One Health: A decade of progress and challenges for the future. Vet Rec. 2014, 174, 85–91. [Google Scholar] [CrossRef] [PubMed]
  60. Crowley, S.L.; Cecchetti, M.; McDonald, R.A. Our wild companions: Domestic cats in the Anthropocene. Trends. Ecol. Evol. 2020, 35, 477–483. [Google Scholar] [CrossRef] [PubMed]
  61. Bula-Rudas, F.J.; Olcott, J.L. Human and Animal Bites. J. Pediatr. Rev. 2018, 39, 490–500. [Google Scholar] [CrossRef]
  62. Kravetz, J.D.; Federman, D.G. Cat-associated zoonoses. Arch. Intern. Med. 2002, 162, 1945–1952. [Google Scholar] [CrossRef]
  63. Branley, J.; Wolfson, C.; Waters, P.; Gottlieb, T.; Bradbury, R. Prevalence of Bartonella henselae bacteremia, the causative agent of cat scratch disease, in an Australian cat population. Pathology 1996, 28, 262–265. [Google Scholar] [CrossRef]
  64. Lee, A.C.Y.; Schantz, P.M.; Kazacos, K.R.; Montgomery, S.P.; Bowman, D.D. Epidemiologic and zoonotic aspects of ascarid infections in dogs and cats. Trends Parasitol. 2010, 26, 155–161. [Google Scholar] [CrossRef]
  65. Hanna, E.; Cardillo, M. Island mammal extinctions are determined by interactive effects of life history, island biogeography and mesopredator suppression. Glob. Ecol. Biogeogr. 2014, 23, 395–404. [Google Scholar] [CrossRef]
  66. Ringler, D.; Russell, J.C.; Le Corre, M. Trophic roles of black rats and seabird impacts on tropical islands: Mesopredator release or hyperpredation? Biol. Conserv. 2015, 185, 75–84. [Google Scholar] [CrossRef]
  67. Rayner, M.J.; Hauber, M.E.; Imber, M.J.; Stamp, R.K.; Clout, M.N. Spatial heterogeneity of mesopredator release within an oceanic island system. Proc. Natl. Acad. Sci. USA 2007, 104, 20862–20865. [Google Scholar] [CrossRef] [PubMed]
  68. Norouzzadeh, M.S.; Nguyen, A.; Kosmala, M.; Swanson, A.; Palmer, M.S.; Packer, C.; Clune, J. Automatically identifying, counting, and describing wild animals in camera-trap images with deep learning. Proc. Natl. Acad. Sci. USA 2018, 115, E5716–E5725. [Google Scholar] [CrossRef] [PubMed]
Figure 1. The Blue Mountains weather trends adapted from the Bureau of Meteorology (BOM). Data collected at Farnells Rd, Katoomba weather station: (a) Mean monthly temperatures (minimum and maximum), data collected 1907–2022 [39,41]; (b) Mean monthly rainfall, data collected 1885–2022 [40].
Animals 13 01711 g001
Figure 2. Campbelltown weather trends adapted from the BOM. Data collected at Mount Annan, Campbelltown weather station: (a) Mean monthly temperatures (minimum and maximum), data collected 2006–2022 [42,43]; (b) Mean monthly rainfall, data collected 2006–2022 [44].
Animals 13 01711 g002
Figure 3. Camera locations and transect drive routes in: (a) The Blue Mountains (BM); (b) Campbelltown (CT). Maps were created using ESRI 2022. ArcGIS Pro: Release 2.9. Redlands, CA: Environmental Systems Research Institute.
Animals 13 01711 g003aAnimals 13 01711 g003b
Figure 4. Cameras set up in the field on volunteer properties at approximately 90 cm above ground level: (a) Camera on a tree in the BM LGA on private property encroaching on wildlife habitat; (b) Camera on a car port in the CT LGA; (c) Camera on a tree looking out at potential cat trails in the BM. BM = Blue Mountains, CT = Campbelltown, LGA = local government area.
Animals 13 01711 g004
Figure 5. Roaming cats (F. catus) on the motion-capture cameras: (a) Cat with a collar during the day on a BM camera; (b) Cat at night on a CT camera. BM = Blue Mountains, CT = Campbelltown.
Animals 13 01711 g005
Figure 6. Indirect (camera) events: (a) Cat (F. catus) events with 1 true outlier removed in CT for better visualisation—median cat events observed 20.0 (BM) and 27.5 (CT). There was no significant difference between these local government areas (p = 0.11); (b) Wildlife events with 1 true outlier removed in the BM—median events observed 63.0 (BM) and 24.0 (CT). No significant difference between the local government areas was found (p = 0.32). BM = Blue Mountains, CT = Campbelltown.
Animals 13 01711 g006
Figure 7. Activity overlaps graphed from motion-capture camera data: (a) Cats and bandicoots (BAN) in the BM; (b) Cats and possums (POS) in the BM; (c) Cats and small mammals (SMLMAM) in the BM; (d) Cats and small mammals (SMLMAM) in CT. BM = Blue Mountains, CT = Campbelltown.
Animals 13 01711 g007
Figure 8. Wildlife captured on the motion-capture cameras in the Blue Mountains (BM): (a) Foxes (Vulpes vulpes) at night; (b) Swamp wallaby (Wallabia bicolor) in daylight.
Animals 13 01711 g008
Figure 9. Direct (transect drive) cat observations for the two LGAs, the Blue Mountains (BM) and Campbelltown (CT): (a) Number of cats observed across four study days in each LGA; mean cats observed in the BM (18.8) and CT (25.8) was not significantly different (p = 0.38); (b) Densities of cats per hectare (cats/ha); (c) Overall estimated abundance of free-roaming cats (total number of cats).
Animals 13 01711 g009
Table 1. Weather conditions during the camera study period (February–April 2022) comparing the two local government areas (LGAs), Blue Mountains and Campbelltown. Taken from the Bureau of Meteorology [39,40,41,42,43,44].
LGAWeather ConditionFebruaryMarchApril
Blue MountainsTotal Rainfall (mm) 1246.9685.8215.6
Mean Max T (°C) 220.618.917.3
Mean Min T (°C)12.612.39.6
CampbelltownTotal Rainfall (mm)161.2452158
Mean Max T (°C)27.225.623.6
Mean Min T (°C)16.316.212.8
1 Rainfall is in millimetres (mm). 2 T = temperature in degrees Celsius (°C).
Table 2. Weather conditions for the transect study days by local government area (LGA) site collated from the Bureau of Meteorology Katoomba (the Blue Mountains) and Mount Annan (Campbelltown) weather stations [48,49,50,51,52,53].
LGADateRainfall (mm) 1Max T (°C) 2Min T (°C) 2
Blue Mountains19 April 20220.021.813.4
20 April 202212.418.27.8
21 April 20220.017.46.0
22 April 20222.011.88.1
Blue Mountains Average3.617.38.8
Campbelltown21 April 2022023.78.3
22 April 2022020.112.0
26 April 2022020.213.2
27 April 2022018.713.0
Campbelltown Average020.711.6
1 Rainfall is in millimetres (mm). 2 T = temperature in degrees Celsius (°C).
Table 3. Summary of identifiable animal camera tags for two local government areas (LGAs), Blue Mountains (BM) and Campbelltown (CT).
LGABANBIRDCATDDOGDOGFOXGOANNAGUPIGHORLIZMACPOSRABSMLMAMTotal
BM2304285128913037216300124541710251769197
CT02566411811110780235434311868183
Total2306851540724147294023544288418104318217,380
‘BAN’ (bandicoot), ‘BIRD’, ‘CAT’, ‘DDOG’ (domestic dog), ‘DOG’ (other dog, e.g., wild dog/dingo), ‘FOX’, ‘GOANNA’, ‘GUPIG’ (guinea pig), ‘HOR’ (horse), ‘LIZ’ (lizard), ‘MAC’ (macropods), ‘POS’ (possum), ‘RAB’ (rabbit/hare), and ‘SMLMAM’ (any mammal smaller than a bandicoot).
Table 4. Occupancy (predicted chance of cats occurring in the area) and detection (predicted chance of observing a cat in the area) of free-roaming cats in the Blue Mountains and Campbelltown LGAs. LGA = local government area, SE = standard error, Q1 = lower quartile, Q3 = upper quartile.
Blue Mountains
PredictedSEQ1Q3
Occupancy0.7565806 0.063973330.61139890.859947
Detection0.2544477 0.0091944750.23685060.2728848
Campbelltown
PredictedSEQ1Q3
Occupancy0.82608670.055885640.68906050.9105652
Detection0.33036440.0094638410.31208630.3491696
Disclaimer/Publisher’s Note: The statements, opinions and data contained in all publications are solely those of the individual author(s) and contributor(s) and not of MDPI and/or the editor(s). MDPI and/or the editor(s) disclaim responsibility for any injury to people or property resulting from any ideas, methods, instructions or products referred to in the content.

