Article

Performance and Metabolic, Inflammatory, and Oxidative Stress-Related Parameters in Early Lactating Dairy Cows with High and Low Hepatic FGF21 Expression

1
Institute of Animal Nutrition and Nutrition Physiology, Justus Liebig University Giessen, Heinrich-Buff-Ring 26-32, 35392 Giessen, Germany
2
Educational and Research Centre for Animal Husbandry, Hofgut Neumühle, 67728 Münchweiler an der Alsenz, Germany
*
Author to whom correspondence should be addressed.
Animals 2023, 13(1), 131; https://doi.org/10.3390/ani13010131
Submission received: 8 November 2022 / Revised: 26 December 2022 / Accepted: 26 December 2022 / Published: 29 December 2022
(This article belongs to the Special Issue Metabolic and Endocrine Regulation in Ruminants)

Abstract

:

Simple Summary

Studies with rodent models have shown that fibroblast growth factor 21 (FGF21) is a metabolic regulator induced in the liver in response to different stress conditions, such as energy and nutrient deprivation, inflammation, and metabolic disorders. Recently, it has been found that hepatic FGF21 expression is strongly upregulated in dairy cows during early lactation. However, the function of FGF21 in cows has not yet been established. Therefore, the aim of the present study was to gain knowledge about the physiological role played by FGF21 in cows during this period. To this end, out of 30 cows, 8 cows with the highest hepatic FGF21 expression were compared to 8 cows with the lowest hepatic FGF21 expression. Cows with high and low hepatic FGF21 expression did not differ in milk yield, feed intake, nor energy balance. Transcriptomics screening, targeted plasma metabolomics, and analyses of antioxidant parameters indicated that high hepatic FGF21 expression was related to endoplasmic reticulum stress and induction of the antioxidative system in the livers of dairy cows. Therefore, the data of this study suggest that FGF21 plays an important role in the adaptation to cellular stress conditions in early lactation when cows are typically confronted with several stress stimuli.

Abstract

Induction of FGF21 expression in the liver and a significant increase in plasma FGF21 concentration have been demonstrated in cows during early lactation, but knowledge about the function of FGF21 in dairy cows remains limited. In order to improve the understanding of the physiological role of FGF21 in dairy cows, the present study aimed to investigate differences in metabolic pathways between dairy cows with high and low hepatic expression of FGF21 at week 1 of lactation (n = 8/group) by liver transcriptomics, targeted plasma metabolomics, and analysis of inflammatory and oxidative stress-related parameters. Dry matter intake, energy balance, milk yield, and energy-corrected milk yield at days 8–14 postpartum did not differ between cows with high and low hepatic FGF21 expression. However, cows with high FGF21 expression showed an upregulation of genes involved in endoplasmic reticulum stress, inflammation, and nuclear factor E2-related factor 2 (Nrf2)-dependent cytoprotection compared to cows with low FGF21 expression at week 1 postpartum (p < 0.05). Concentrations of important antioxidants (tocopherols, β-carotene, and glutathione) in the liver and plasma, trolox equivalent antioxidant capacity in plasma, concentrations of oxidative stress-related compounds (thiobarbituric acid-reactive substances and protein carbonyls), and levels of most acute phase proteins at week 1 postpartum did not differ between cows with high or low FGF21 expression. Moreover, among a total of >200 metabolites assayed in the plasma, concentrations of only 7 metabolites were different between cows with high or low FGF21 expression (p < 0.05). Overall, the results showed that cows with high and low FGF21 hepatic expression had only moderate differences in metabolism, but FGF21 might be important in the adaptation of dairy cows to stress conditions during early lactation.

1. Introduction

Fibroblast growth factor 21 (FGF21) is a metabolic regulator produced mainly in the liver [1], which is induced in response to multiple stressors, including energy deprivation, amino acid deprivation, exercise, inflammation, and metabolic disorders, such as obesity. As a consequence of these stress conditions, FGF21 has been demonstrated to preferentially stimulate metabolic pathways that play a central role in energy mobilization in human cells and rodent models, such as lipolysis, gluconeogenesis, and ketogenesis [2,3]. This indicates that the physiological function of FGF21 is to act as a stress hormone that aims to increase the availability of energy substrates in order to cope with the energy-consuming stress response [4].
High-yield dairy cows commonly exhibit a pronounced negative energy balance (NEB) and are frequently exposed to different metabolic (e.g., non-esterified fatty acids (NEFA)) and inflammatory stimuli (e.g., bacterial compounds, inflammatory mediators) during the periparturient phase and early lactation [5,6,7,8]. In line with the role of FGF21 as a stress hormone, a dramatic induction of FGF21 expression in the liver and marked increase in FGF21 concentration in plasma have been reported in cows at the day of parturition and during early lactation [9,10,11,12,13,14]. This suggests that FGF21 plays a particular physiological role during this phase and is involved in the metabolic adaptation to NEB and stress conditions in dairy cows. Induction of the expression of FGF21 in the liver of dairy cows at the day of parturition and in the early lactation period is likely caused by increased hepatic uptake of NEFA released from white adipose tissue (WAT) into circulation, because NEFA are potent ligands of peroxisome proliferator-activated receptor α (PPARα), which acts as a transcriptional regulator of FGF21 [2,15]. Likewise, overfeeding during the dry period, which stimulates lipolysis in WAT and thus increases NEFA levels in plasma during the postpartum phase, causes an increase in FGF21 plasma concentrations in dairy cows [12,16,17]. In addition, evidence indicates that different cellular stress conditions, such as endoplasmic reticulum (ER) stress or inflammation, which frequently occur in the livers of cows during early lactation, cause the induction of hepatic FGF21 expression [18,19]. In agreement with this, supplementation of polyphenols reduces not only hepatic ER stress but also the expression of FGF21 in the liver of dairy cows during the first week of lactation [20,21,22].
Several studies with obese and diabetic mouse models have consistently demonstrated that administration of murine or human recombinant FGF21 reduces the fat mass of the body and hepatic fat content by increasing energy expenditure in WAT and brown adipose tissue [23,24,25], increasing the rate of β-oxidation of fatty acids, and reducing the rate of de novo-fatty acid synthesis [26]. In addition, exogenous application of FGF21 to mice administered a high-fat diet improved oral glucose tolerance and insulin sensitivity [27] due to increased secretion of adiponectin from WAT [28]. Moreover, application of FGF21 improved the profile of plasma lipids (decline of low-density lipoprotein cholesterol and triacylglycerols, elevation of high-density lipoprotein cholesterol). While the function of FGF21 in pathologic rodent models has been extensively studied, knowledge about the function of FGF21 in dairy cows is limited, despite existing reports about the factors underlying induction of FGF21 expression in dairy cows [29].
Thus, in order to improve the understanding of the physiological function of FGF21 in dairy cows, the present study aimed to explore metabolic differences between high-yield dairy cows differing in their hepatic expression level of FGF21 (high vs. low hepatic FGF21 expression) in the early postpartum phase using liver transcriptomics, targeted plasma metabolomics, and supplemental analysis of parameters related to inflammation, the antioxidant system, and the occurrence of oxidative stress.

2. Materials and Methods

2.1. Animal Experiment

An experiment with 30 Holstein cows with an average parity of 3.06 (±1.27, SD), average body weight of 772 (±75, SD) kg at week 3 antepartum, and milk yield of 10,470 kg in the previous 305-day lactation period was carried out. All procedures described in this study were performed according to the German Animal Welfare Act. The experimental protocol was approved by the official authorities (Provincial Government of Coblenz, Germany, approval number 23 177–07/G15–20–040). The cows were fed a total mixed ration (TMR), as recently described [30]. The TMR offered during the dry period was composed to meet the requirement of crude protein (CP) and net energy of a cow with a body weight of 650 kg and daily dry matter intake of 12 kg. The TMR offered to the cows after parturition was composed to meet the requirement for CP and net energy for a daily milk yield of 34 kg milk, assuming a daily dry matter intake of 22 kg. Feed components were analyzed according to official protocols for feed analysis [31]. Neutral detergent fiber (NDF) and acid detergent fiber (ADF) were analyzed according to the Van Soest method [32]. The net energy lactation (NEL) of the TMR was calculated according to Gesellschaft für Ernährungsphysiologie (GfE) [33].
The TMR fed during the dry period contained (per kg DM): 6.5 MJ NEL, 140 g CP, and 383 g NDF; the TMR fed during lactation contained (per kg DM): 6.8 MJ NEL, 166 g CP, and 356 g NDF. The feed intake of the individual cows was recorded using an electronic feeding system (Roughage Intake Control, Insentec B.V., Marknesse, the Netherlands) from day 5 after parturition.
Within the whole group of 30 cows, 5 cows had to be medically treated due to the occurrence of either mastitis (3 cases), ketosis (1 case), or hypocalcemia (1 case). Among the remaining 25 cows that were not medically treated, 8 cows with the lowest hepatic expression of FGF21 and 8 cows with the highest FGF21 expression at week 1 postpartum were selected for further analysis. Thus, FGF21 expression in the cows was not considered to be influenced by either disease or medical treatment. According to gene expression analysis using GeneChip microarray profiling, the hepatic FGF21 mRNA level was 4.23-fold higher in the group with high hepatic FGF21 expression than in the group with low hepatic FGF21 expression. Based on the results of qPCR analysis, the hepatic FGF21 expression was 16-fold higher in the group with high hepatic FGF21 expression than in the group with low hepatic FGF21 expression.

2.2. Blood and Liver Biopsy Sampling

Blood and liver biopsy samples were taken 2 weeks (12–16 days) before the expected calving date, and at week 1 (days 6–12), week 4 (days 25–32), and week 7 (days 46–52) postpartum. Blood sampling was performed from V. caudalis mediana into EDTA-containing vacutainers (S-Monovette 9 mL, Sarstedt, Nümbrecht, Germany) and kept on ice following centrifugation to obtain plasma samples, which were then stored at −80 °C pending analysis. Liver biopsy samples were taken under local anesthesia, as previously described in detail [21]. After removal, the liver biopsy samples were immediately snap-frozen in liquid nitrogen and thereafter stored at −80 °C pending analysis.

2.3. Analysis of Plasma and Liver Samples

Concentrations of albumin, β-hydroxybutyrate (BHBA), NEFA, total cholesterol, and triacylglycerols (TAG) in plasma were determined using enzymatic reagent kits (Fluitest® ALB, Analyticon, Lichtenfels, Germany; BHBA Assay, Code No. 417–73501, Wako Chemicals GmbH, Neuss, Germany; NEFA Assay, Code No. 436–91995, Wako Chemicals; Fluitest® Chol, Analyticon; Fluitest® TG, Analyticon, Lichtenfels, Germany). Plasma concentrations of haptoglobin (HP), retinol binding protein 4 (RBP4), and serum amyloid A (SAA) were assayed using commercial ELISA kits (EB0011, EB0929b, and EB0015, respectively, Hölzel, Cologne, Germany).
For determination of lipid concentrations in the liver biopsy samples, the lipids were extracted with a mixture of hexane and isopropanol (3:2, v/v) [34]. Aliquots of the lipid extracts were evaporated. The dried lipids were dissolved in detergent (Triton X-100) [35] and the concentrations of cholesterol and TAG were analyzed using enzymatic reagent kits (Fluitest® CHOL, Fluitest® TG, Analyticon, Lichtenfels, Germany).

2.4. Parameters of Antioxidant Status

The trolox equivalent antioxidative capacity (TEAC) was determined according to the method described by Re et al. [36]. Concentrations of α-tocopherol and β-carotene in the plasma were analyzed by high performance-liquid chromatography according to the method of Balz et al. [37] with slight modifications, as recently described [21]. The plasma concentration of thiobarbituric acid-reactive substances (TBARS) was measured using the method described by Sidwell et al. [38]. The concentration of protein carbonyls in the plasma was measured using the method of Levine et al. [39]. This assay was based on the derivatization of carbonyls with 2,4-dinitrophenylhydrazine (DNPH) to dinitrophenylhydrazone adducts, the extinction of which was proportional to carbonyl content in the sample. The plasma concentration of total glutathione (GSH) was determined by spectrophotometry according to the methods of Tietze [40] and Griffith et al. [41] with slight modifications, as described recently [42].

2.5. Hepatic GeneChip Microarray Profiling

For this investigation, total RNA was obtained from liver samples taken at week 1 postpartum from 30 cows. Total RNA was extracted as recently described [30]. Processing of total RNA samples was carried out at an Affymetrix service provider, as previously described [22]. The RNA integrity number (RIN) value for all samples was 6.02 ± 0.54 (mean ± SD). In order to identify differentially regulated genes and pathways among animals with the highest and lowest hepatic FGF21 gene expression, 8 animals with the highest hepatic FGF21 expression were assigned to the “FGF21 high” group and 8 animals with the lowest hepatic FGF21 expression were assigned to the “FGF21 low” group. Differentially expressed transcripts between the high and low FGF21 groups were selected based on two filter criteria (fold change (FC) > 1.2 or > −1.2; p-value of unpaired Student’s t-test < 0.05). Biological meaning from the differentially expressed transcripts was extracted by gene set enrichment analysis (GSEA), as previously described [22], using the DAVID 6.8 bioinformatic resource [43]. The microarray data were deposited in the NCBI Gene Expression Omnibus (GEO accession no: GSE218916).

2.6. RNA Extraction and Real-Time Quantitative Polymerase Chain Reaction (qPCR)

The microarray data were validated by qPCR for 25 differentially expressed mRNAs (Supplementary Table S1). Total RNA was subjected to cDNA synthesis and qPCR analysis, as recently described in detail [30]. Primer features are shown in Supplementary Table S2. Calculation of Ct values and normalization of relative gene expression were performed as recently described [22]. The individual GeNorm normalization factor was calculated based on the expression of the three most stable reference genes tested (eukaryotic translation elongation factor 1 alpha 1, H3.3 histone A, and ribosomal protein L12), according to Vandesompele et al. [44]. The presence of a single PCR product was verified by melting curve analysis performed from 50 to 95 °C. The size of the amplified PCR products was checked by agarose gel electrophoresis, as recently described [30].

2.7. Targeted Metabolite Screening

The concentrations of selected metabolites from different compound classes [21 amino acids, 21 amino acid metabolites, 40 carnitine species, 17 eicosanoids and other oxidation products of polyunsaturated fatty acids (PUFA), 14 lysophosphatidylcholines, 17 oxysterols, 76 phosphatidylcholines, 15 sphingomyelins, and the sum of hexoses] in the plasma of blood samples taken at week 1 postpartum were analyzed using three commercial kits (Absolute/DQ p180 kit, Eicosanoid Assay, and Oxysterol Assay, Biocrates Life Science, Innsbruck, Austria).

2.8. Statistical Analysis

The data were statistically analyzed using the IBM SPSS Statistics v27 software (IBM, Armonk, NY, USA). Normal distribution and homoscedasticity of data were tested by the Shapiro–Wilk test and Levene’s test. Differences between the high and low FGF21 groups were detected using Student’s t-test for normally distributed and homoscedastic data and Welch’s t-test for normally distributed and heteroscedastic data. The Kruskal–Wallis test was used for not normally distributed data. Means were considered significantly different for p < 0.05.

3. Results

3.1. Hepatic FGF21 Expression

Figure 1 shows the relative hepatic gene expression levels of FGF21 in the cows of the group with low FGF21 expression and those with high FGF21 expression at week 2 antepartum and weeks 1, 4, and 7 postpartum, as analyzed by qPCR. In the group with low FGF21 expression, there was only a moderate increase in FGF21 expression from week 2 antepartum to week 1 postpartum. In this group, hepatic FGF21 expression did not decline from week 1 postpartum to weeks 4 and 7 postpartum. In the group with high FGF21 expression, there was a dramatic increase in FGF21 expression from week 2 antepartum to week 1 postpartum. Thereafter, FGF21 expression strongly declined to levels that remained higher than the level at week 2 antepartum. At week 2 antepartum and weeks 4 and 7 postpartum, expression levels of FGF21 in the liver did not differ between the two groups, but they differed markedly at week 1 postpartum.

3.2. Parity and Body Weights of the Cows

The 8 cows with low hepatic FGF21 expression had an average parity of 2.25 (±0.47, SD), while the 8 cows with high hepatic FGF21 expression had an average parity of 2.88 (±1.25, SD). The body weights of the two groups did not differ at week 2 antepartum [724 ± 30 (SD) kg for the cows with low hepatic FGF21 expression, 759 ± 78 (SD) kg for the cows with high hepatic FGF21 expression], week 1 postpartum [614 ± 35 (SD) kg for the cows with low hepatic FGF21 expression, 648 ± 54 (SD) kg for the cows with high hepatic FGF21 expression], week 4 postpartum [589 ± 48 (SD) kg for the cows with low hepatic FGF21 expression, 642 ± 102 (SD) kg for the cows with high FGF21 hepatic expression], and week 7 postpartum [612 ± 45 (SD) kg for the cows with low hepatic FGF21 expression, 665 ± 78 (SD) kg for the cows with high hepatic FGF21 expression]. Body weight changes within the period from week 2 antepartum to week 7 postpartum also did not differ between the two groups.

3.3. Feed Intake, Energy Balance and Milk Production

Body weights, dry matter and net energy intake, energy balance, milk yield, and ECM at days 8–14 of lactation did not differ between cows with high and low hepatic FGF21 expression (Table 1).

3.4. Metabolic Parameters in Plasma and Liver

Concentrations of NEFA, BHBA, TAG, and cholesterol in plasma at week 1 postpartum did not differ between cows with high and low hepatic FGF21 expression (Table 2). Hepatic concentrations of TAG and cholesterol also did not differ between the two groups (Table 2).

3.5. Identification of Differentially Expressed Hepatic Genes

According to the two filter criteria, a total of 410 transcripts were identified as differentially expressed between cows with high and low hepatic FGF21 expression (Figure 2). Among these genes, 190 were upregulated and 220 were downregulated. Amongst the upregulated genes, only six transcripts were regulated > 2.0-fold. The top 10 upregulated transcripts in the cows with high vs. low hepatic FGF21 expression were (FC in brackets): FGF21 (4.23), MT1E (3.58), GPX3 (2.90), MT1A (2.64), MT1E (2.11), MIR708 (2.00), STEAP4 (1.94), MT2A (1.89), SLC22A7 (1.85), and STK39 (1.81). None of the downregulated transcripts were regulated < −2.0-fold. The top 10 downregulated transcripts in the cows with high vs. low FGF21 hepatic expression were (FC in brackets): PDK4 (−1.93), HAL (−1.91), MFSD2A (−1.89), LPIN1 (−1.77), GSTM2 (−1.75), GSTM1 (−1.68), ASCL1 (−1.64), ERRFI1 (−1.60), GLS2 (−1.59), and VWA3B (−1.58). Supplementary Table S3 shows the FC and p-values of all transcripts that were differentially expressed between cows with high and low FGF21 expression.

3.6. Technical Validation of Microarray Data for Selected Differentially Expressed Hepatic Genes

The microarray data of 25 transcripts that were expressed differentially were validated by qPCR. Supplementary Table S1 demonstrates that the effect direction (positive or negative FC) could be confirmed by qPCR for all of these transcripts. The effect size (value of FC) differed to some extent for the transcripts validated by microarray and qPCR. Statistical analysis of the qPCR data revealed that 17 of the validated transcripts were significantly regulated (p < 0.05). The remaining transcripts were not significantly regulated (p ≥ 0.05).

3.7. Identification of Biological Processes and Pathways Affected by the Differentially Expressed Hepatic Genes

GSEA of the differentially upregulated transcripts between cows with high and low FGF21 expression revealed that the most enriched biological process terms included intrinsic apoptotic signaling pathway in response to ER stress, endoplasmic reticulum calcium ion homeostasis, positive regulation of I-kappaB kinase/NF-kappaB signaling, and positive regulation of proteasomal ubiquitin-dependent protein catabolic process, among others (p < 0.05, Figure 3a).
The most enriched biological process terms assigned to the downregulated transcripts between cows with high and low hepatic FGF21 expression included arginine metabolic process, regulation of acetyl-CoA biosynthetic process from pyruvate, fatty acid catabolic process, and histidine catabolic process to glutamate and formamide, among others (p < 0.05, Figure 3b). The enriched KEGG pathways associated with the upregulated transcripts between cows with high and low hepatic FGF21 expression included mineral absorption and protein processing in the ER, among others (p < 0.05, Figure 3c). The most enriched KEGG pathways associated with the downregulated transcripts included olfactory transduction, metabolism of xenobiotics by cytochrome P450, and arginine biosynthesis (Figure 3d).

3.8. Hepatic Expression of Genes Involved in Energy Metabolism

To evaluate differences in energy metabolism between cows with high and low hepatic FGF21 expression, the microarray data were selected for 18 genes involved in mitochondrial and peroxisomal β-oxidation and mitochondrial fatty acid import (CPT1A, CPT1B, SLC25A20/CACT, ACOX1, ACADS, ACADM, ACADL, ACADVL, ECH1, ECHS1, HADHA, EHHADH, HADH, HADHB, ACAA1, ACAA2, HSD17B4, ACADSB); 18 genes associated with gluconeogenesis (PCK1, PCK2, ENO1 to 4, PGAM1, PGAM2, BPGM, PGK1, PGK2, GAPDH, TPI1, ALDOC, ALDOA, ALDOB, FBP1, FBP2); 8 genes associated with ketogenesis (ACAT1, ACAT2, HMGCS1, HMGCS2, HMGCL, HMGCLL1, BDH1, BDH2); and 12 genes associated with the tricarboxylic acid cycle (ACO1, ACO2, CS, DLD, DLST, FH, IDH1, IDH2, IDH3A, IDH3B, IDH3G, MDH1, MDH2, OGDH, OGDHL, SDHA, SDHB, SDHC, SDHD; SUCLG1, SUCLG2) (Table 3). While the vast majority of these genes were not significantly regulated, 4 (EHHADH, HADH, ACAA2, HSD17B4) out of 18 genes involved in β-oxidation and mitochondrial fatty acid import, 4 (ENO2, ENO4, ALDOB, FBP1) out of 18 genes involved in gluconeogenesis, 1 (HMGCS1) out of 8 genes involved in ketogenesis, and 5 (CS, IDH3B, OGDHL, SUCLG2, MDH2) out of 21 genes involved in tricarboxylic acid were significantly regulated (p < 0.05).

3.9. Hepatic Expression of Genes Involved in Inflammation and Stress Response

To assess differences in inflammation and stress response between cows with high and low hepatic FGF21 expression, the microarray data were selected for 15 genes involved in inflammation (CCL2, CP, CRP, CXCL8, FYN, HP, IFNG, IL1B, IL6, LITAF, PTGS2, SAA2, SAA3, SAA4, TNF); 19 genes associated with ER stress (ATF4, ATF6, BAK1, BAX, CASP3, CASP8, CASP9, CHAC1, DDIT3, DNAJC3, EDEM1, FGF21, HERPUD1, HSP90B1, HSPA5, PDIA4, PPP1R15A, TRIB3, XBP1); and 20 genes associated with Nrf2-dependent cytoprotection (CAT, GCLC, GCLM, GPX1, GPX3, GSTA2, HMOX1, MT1A, MT2A, MT1E, MT3, MT4, NFE2L2, NQO1, SOD1, SRXN1, TXN, TXNRD1, UGT1A1, UGT1A6) (Table 4). Amongst these genes, 3 genes (FYN, LITAF, SAA4) involved in inflammation and 7 genes (ATF4, CHAC1, DDIT3, FGF21, HERPUD1, HSPA5, TRIB3) involved in ER stress were upregulated in cows with high hepatic FGF21 expression compared to cows with low hepatic FGF21 expression (p < 0.05). Amongst the Nrf2-dependent genes, 4 genes (GPX3, MT1A, MT1E, MT2A) were upregulated and 3 genes (CAT, MT4, GSTA2) were downregulated in cows with high hepatic FGF21 expression compared to cows with low hepatic FGF21 expression (p < 0.05).

3.10. Identification of Differentially Regulated Plasma Metabolites

Targeted metabolomics analysis was carried out to detect plasma metabolites differing between cows with high and low hepatic FGF21 expression at week 1 postpartum. The quantification of >200 metabolites of various classes of compounds revealed only seven plasma metabolites with differing concentrations between the two groups (Figure 4, p < 0.05). These metabolites were members of the classes acylcarnitines (C5:1-DC, C14:1, C14:2-OH), glycerophospholipids (lyso-PC a C18:1, PC aa C24:0), sphingolipids (SM_C26:1), and sterols (C4_7a). The concentrations of five metabolites (C5:1-DC, C14:1, lysoPC a C18:1, PC aa C24:0, SM_C26:1) were higher in the cows with high FGF21 expression and those of the remaining two metabolites (C14:2-OH, C4_7a) were lower in the cows with high FGF21 expression than in the cows with low FGF21 expression (p < 0.05).

3.11. Parameters of Antioxidant Status in Plasma and Liver

The concentrations of important antioxidants (tocopherols, β-carotene, GSH) in the liver and/or plasma did not differ between cows with high and low hepatic FGF21 expression (Table 5). In line with this, plasma concentrations of TEAC and some oxidative stress-related parameters (TBARS, protein carbonyles) did not differ between cows with high and low hepatic FGF21 expression (Table 5).

3.12. Concentrations of Acute Phase Proteins and Oxylipids in Plasma

The plasma concentrations of two positive (HP, SAA) and two negative acute phase proteins (albumin, RBP4) were determined. While the concentration of SAA was higher in cows with high hepatic FGF21 expression than in cows with low hepatic FGF21 expression (p < 0.05), the concentrations of the other acute phase proteins did not differ between the two groups of cows (Table 6). Plasma concentrations of oxylipids derived from enzymatic and non-enzymatic oxidation of linoleic acid (9-HODE, 13-HODE) and arachidonic acid (12-HETE, 15-HETE, LTB4, PGF2α) also did not differ between cows with high and low hepatic FGF21 expression (Table 6).

4. Discussion

In order to gain a deeper understanding of the role played by FGF21 in dairy cows during early lactation, this study compared performance and metabolic, inflammatory, and oxidative stress-related parameters in two groups of high-yield dairy cows that markedly differed in their hepatic expression levels of 
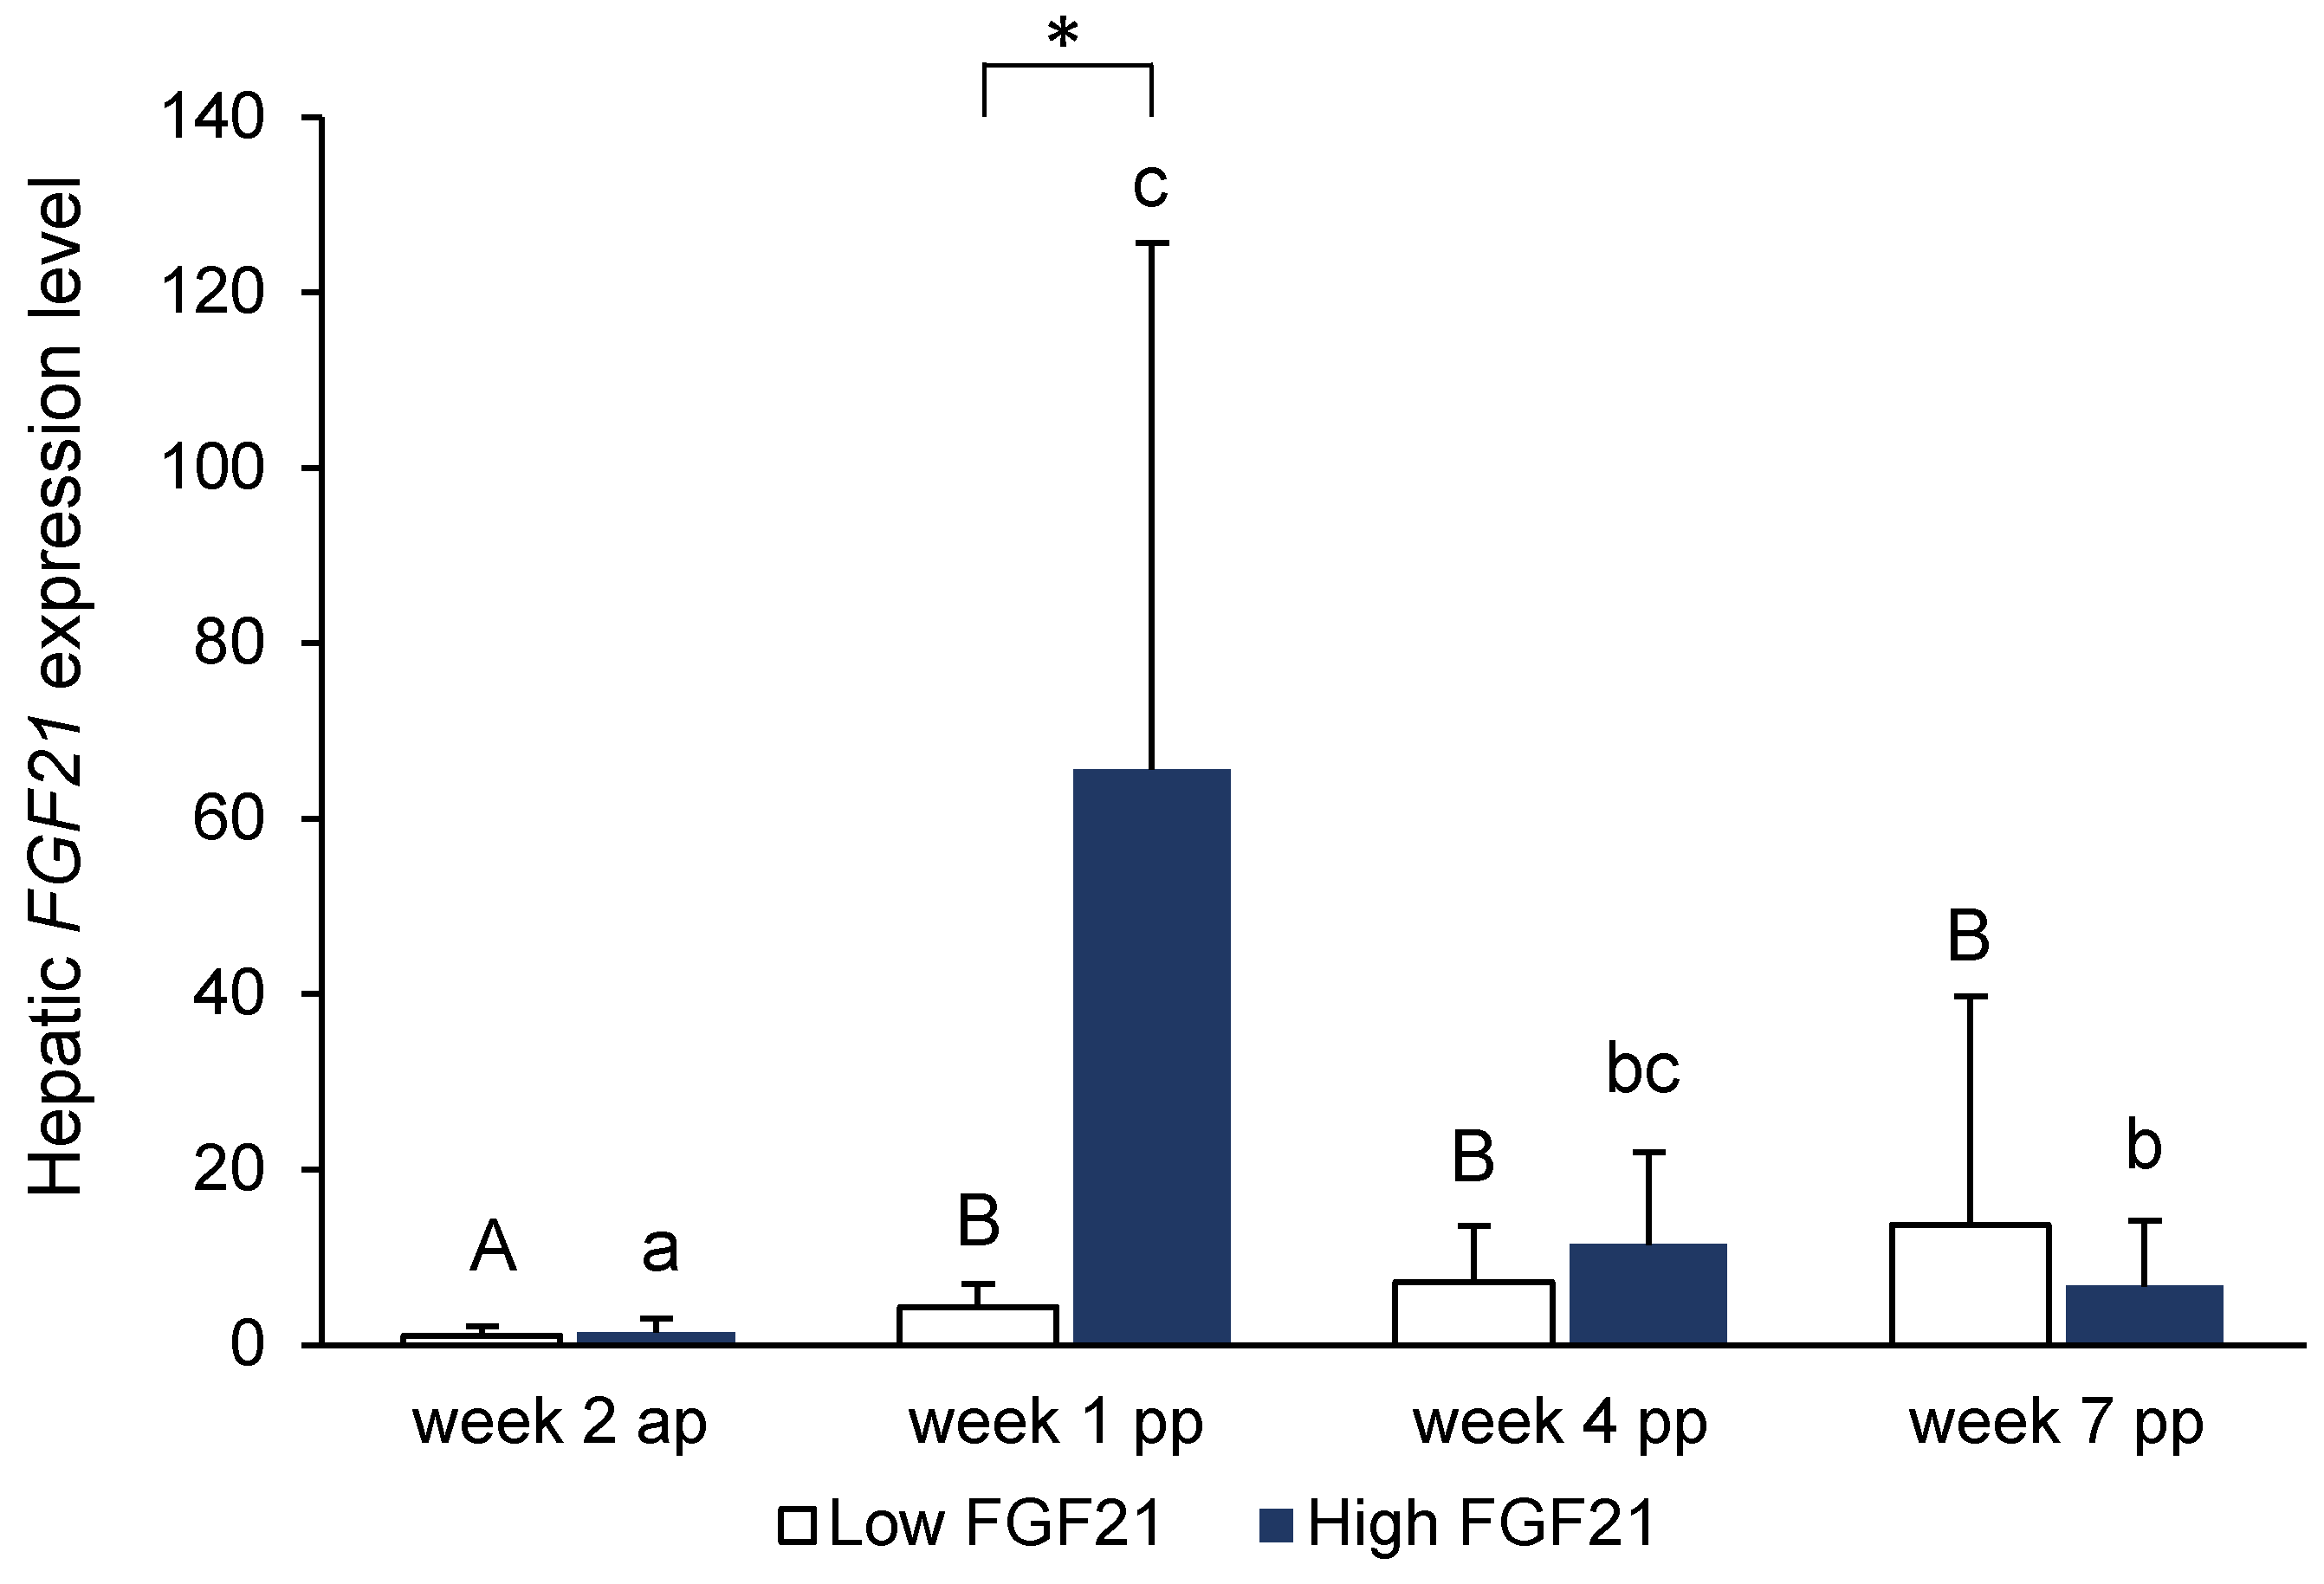
FGF21 at week 1 postpartum. This time-point was chosen for two main reasons. First, the finding that the expression of FGF21 is dramatically upregulated and plasma FGF21 concentrations are strongly increased during the first few days after parturition and strongly decline thereafter suggests that FGF21 exerts its main biological functions in dairy cows during the first week postpartum [9,10,11,12,13,45]. Second, based on the suggestion that FGF21 acts as a stress hormone released from the liver to cope with stress conditions [4], we expected that the biological effects of FGF21 would be most prominent during the phase in which cellular stress is most pronounced. Previous studies have shown that stress conditions, such as ER stress or inflammation, are most enhanced during the first week after parturition and strongly decline thereafter [46,47]. At week 5 postpartum, stress conditions such as ER stress and inflammation are already nearly absent [46,47,48].
Analysis of FGF21 expression in the liver in a cohort of 30 cows in our study demonstrated that the increase in FGF21 expression at week 1 postpartum showed great individual variation. While some cows showed a dramatic increase compared to the antepartum level, hepatic FGF21 expression in others remained nearly unchanged. Our study, however, confirmed the findings of other studies in which cows with strongly increased expression levels of FGF21 in early lactation showed strongly declining expression levels towards later lactation [10,11]. In order to identify factors that could be involved in the expression of FGF21 and to figure out a possible role of FGF21 in metabolic regulation, we selected the 8 cows with the highest hepatic FGF21 expression and the 8 cows with the lowest expression at week 1 postpartum out of a cohort of 30 cows, and assigned them to two groups. Performance parameters, such as dry matter intake, net energy intake, milk yield, and ECM, body weights, and energy balance did not differ between these two groups at days 8–14 postpartum; thus, it can be excluded that the performance level or energy balance of the cows caused the differential expression of hepatic FGF21 in these two groups. Although the strong induction of FGF21 expression in the liver of dairy cows in early lactation is considered to be caused by the pronounced hepatic uptake of NEFA released from WAT during this phase [10,11,13], the stronger induction of FGF21 expression in the cows with high hepatic FGF21 expression was probably not due to greater intrahepatic availability of NEFA because plasma concentrations of NEFA did not differ between the groups. Moreover, other metabolic parameters characterizing energy balance and hepatic lipid metabolism, such as plasma concentrations of BHBA, cholesterol, and TAG, and hepatic concentrations of cholesterol and TAG, did not differ between the two groups. This clearly indicated that the marked difference in hepatic FGF21 expression between the two groups of cows was not caused by differences in energy mobilization and hepatic lipid metabolism. The finding that body weight loss during the early lactation period also did not differ between the two groups of cows supported the indication that the difference in hepatic FGF21 expression was not due to a different rate of body fat mobilization.
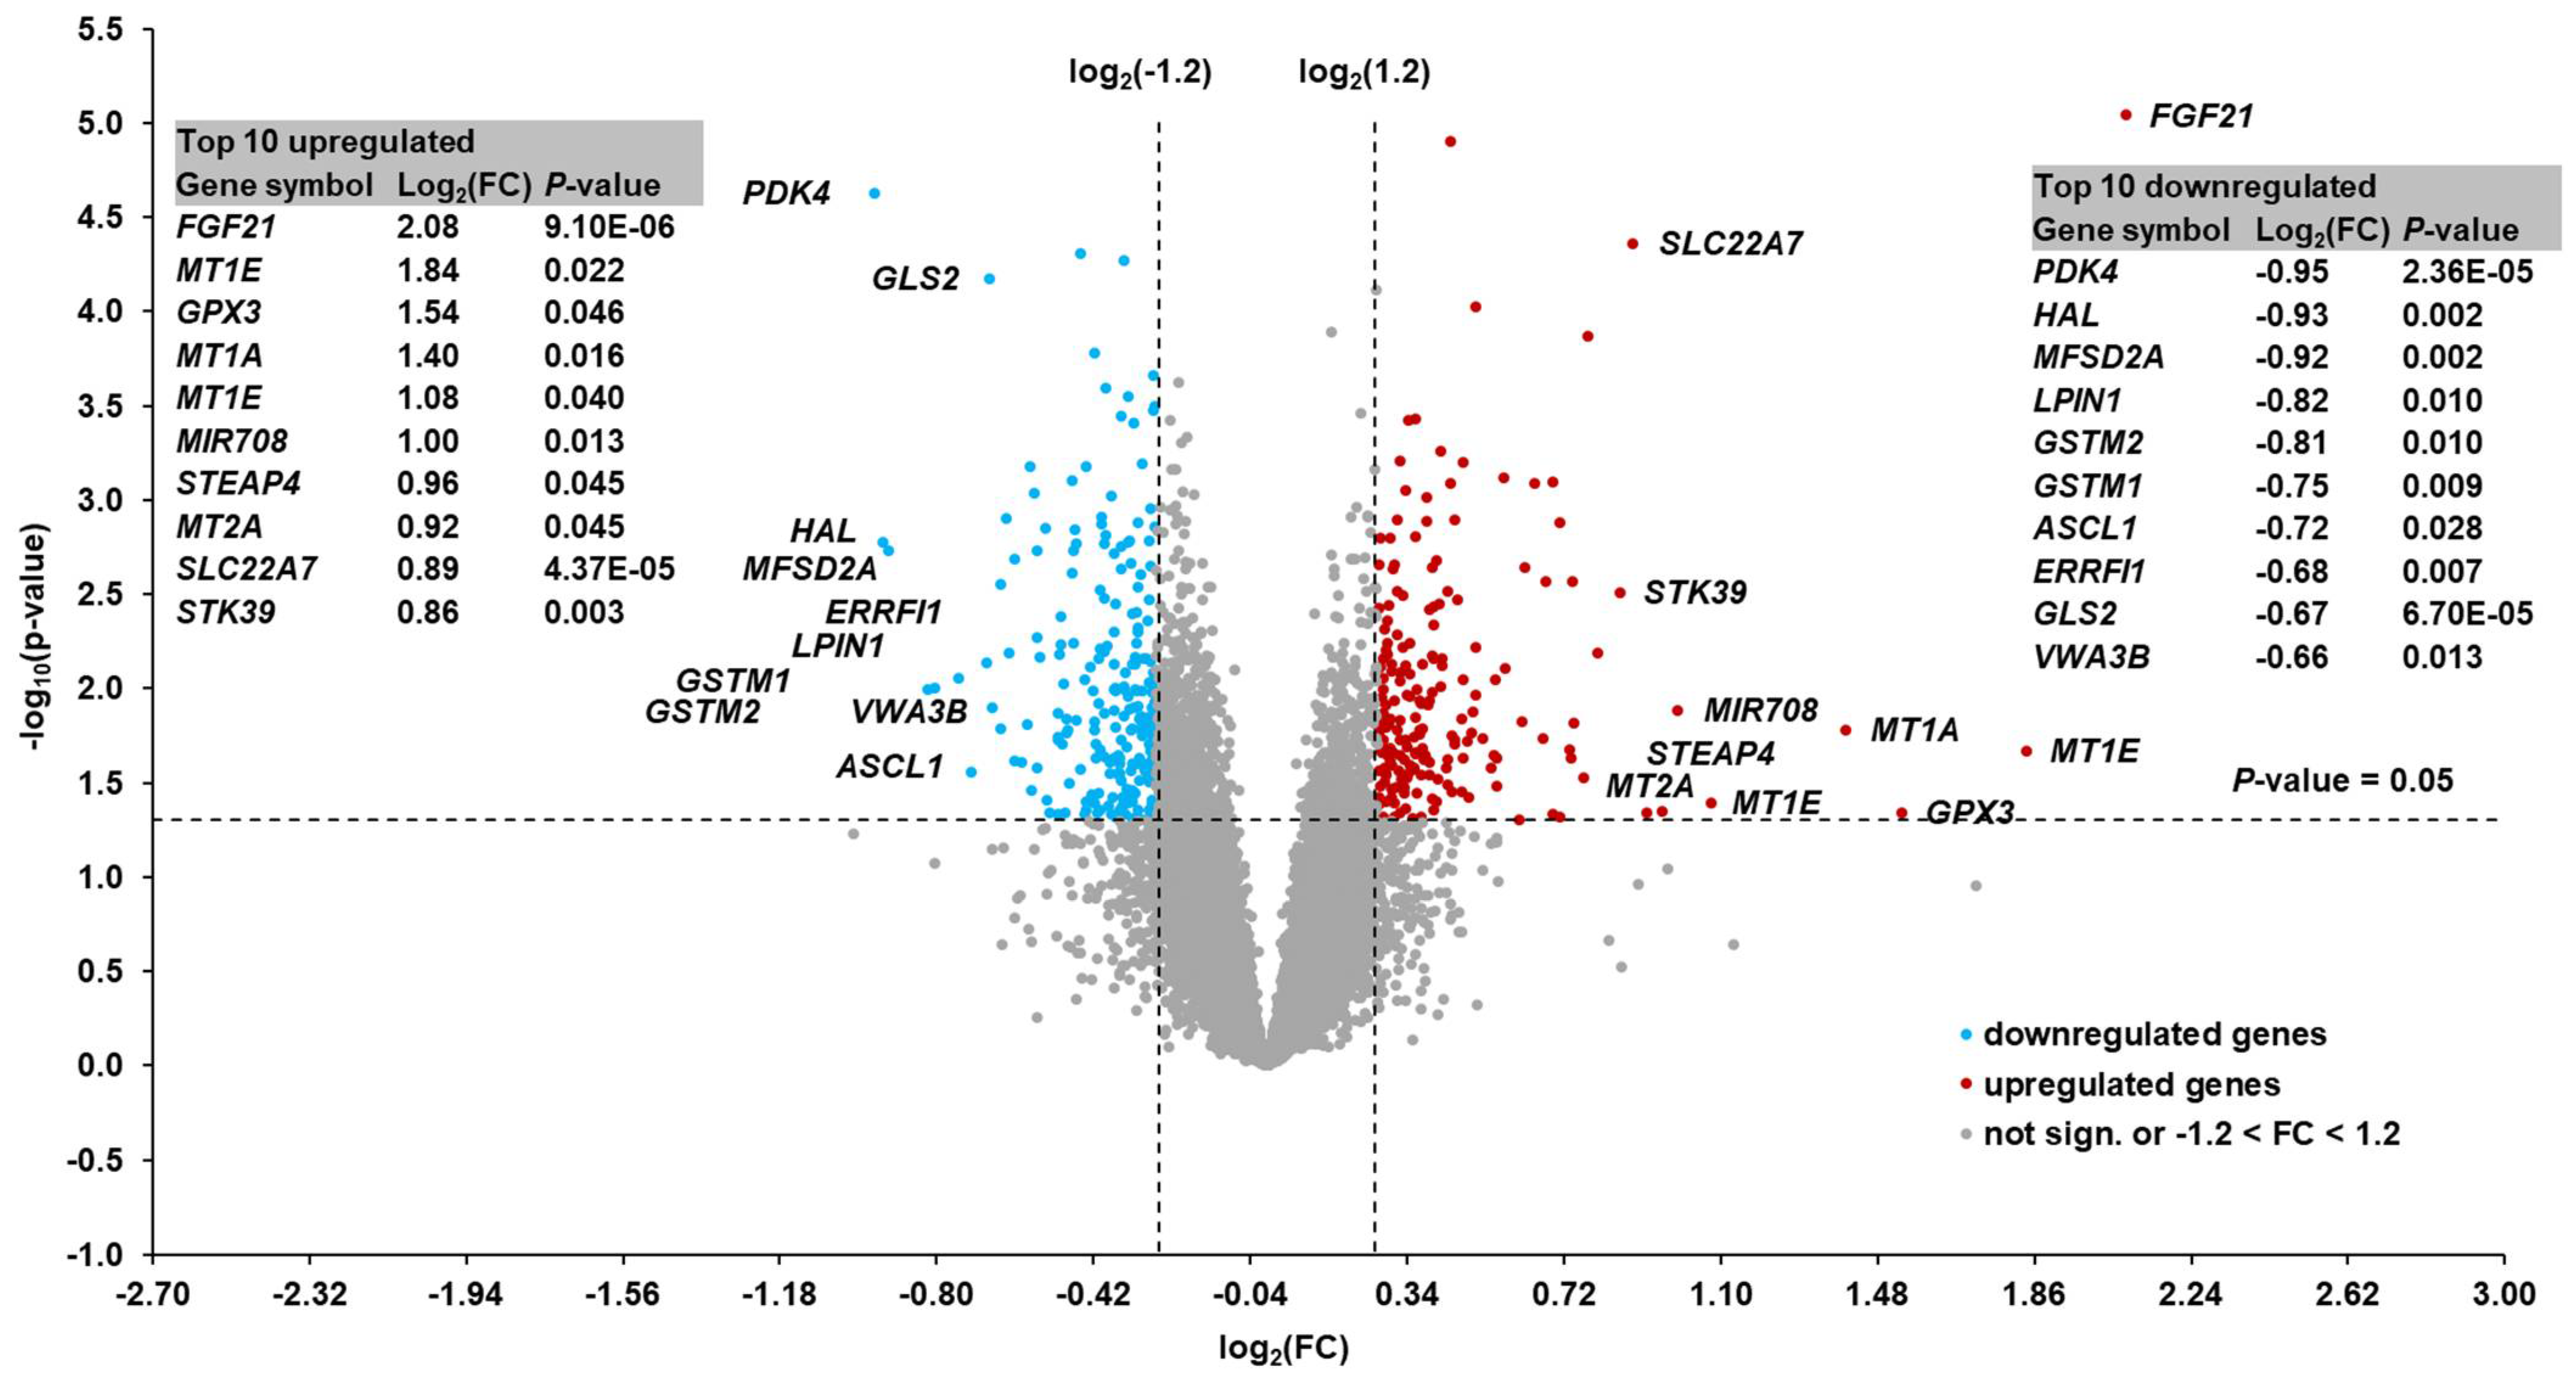
In order to identify metabolic pathways influenced by hepatic FGF21 expression at week 1 postpartum, we performed transcriptomics analysis using microarray technology. The RNA integrity measurement indicates the presence of some kind of RNA degradation that can limit sensitivity (the rate of detection of true positives among all positives) and specificity (the rate of detection of true negatives among all negatives) of microarray performance [49]. Nevertheless, the mean RIN value >6 suggested that the RNA integrity was sufficient to carry out microarray hybridizations. In addition, the microarray analysis was primarily used as a screening technique to identify changes in sets of pathway-specific genes, rather than as a tool to accurately quantify the expression of differentially regulated genes. To obtain deeper insight into the main metabolic pathways of energy metabolism that might differ between the two groups, the microarray expression levels of genes associated with β-oxidation and mitochondrial fatty acid import, gluconeogenesis, ketogenesis, and tricarboxylic acid were evaluated. Due to the low number of selected cows with low and high hepatic FGF21 expression (n = 8), this approach was preferred rather than carrying out principal component analysis or partial least-squares discrimination analysis, both of which require larger sample sizes to detect differences in discriminant genes. Our analysis showed that very few of these genes were differentially regulated between cows with high and low hepatic FGF21 expression and the regulation of these genes was moderate [FC between −1.32 (FBP1) and +1.34 (CS)]. In order to determine whether 
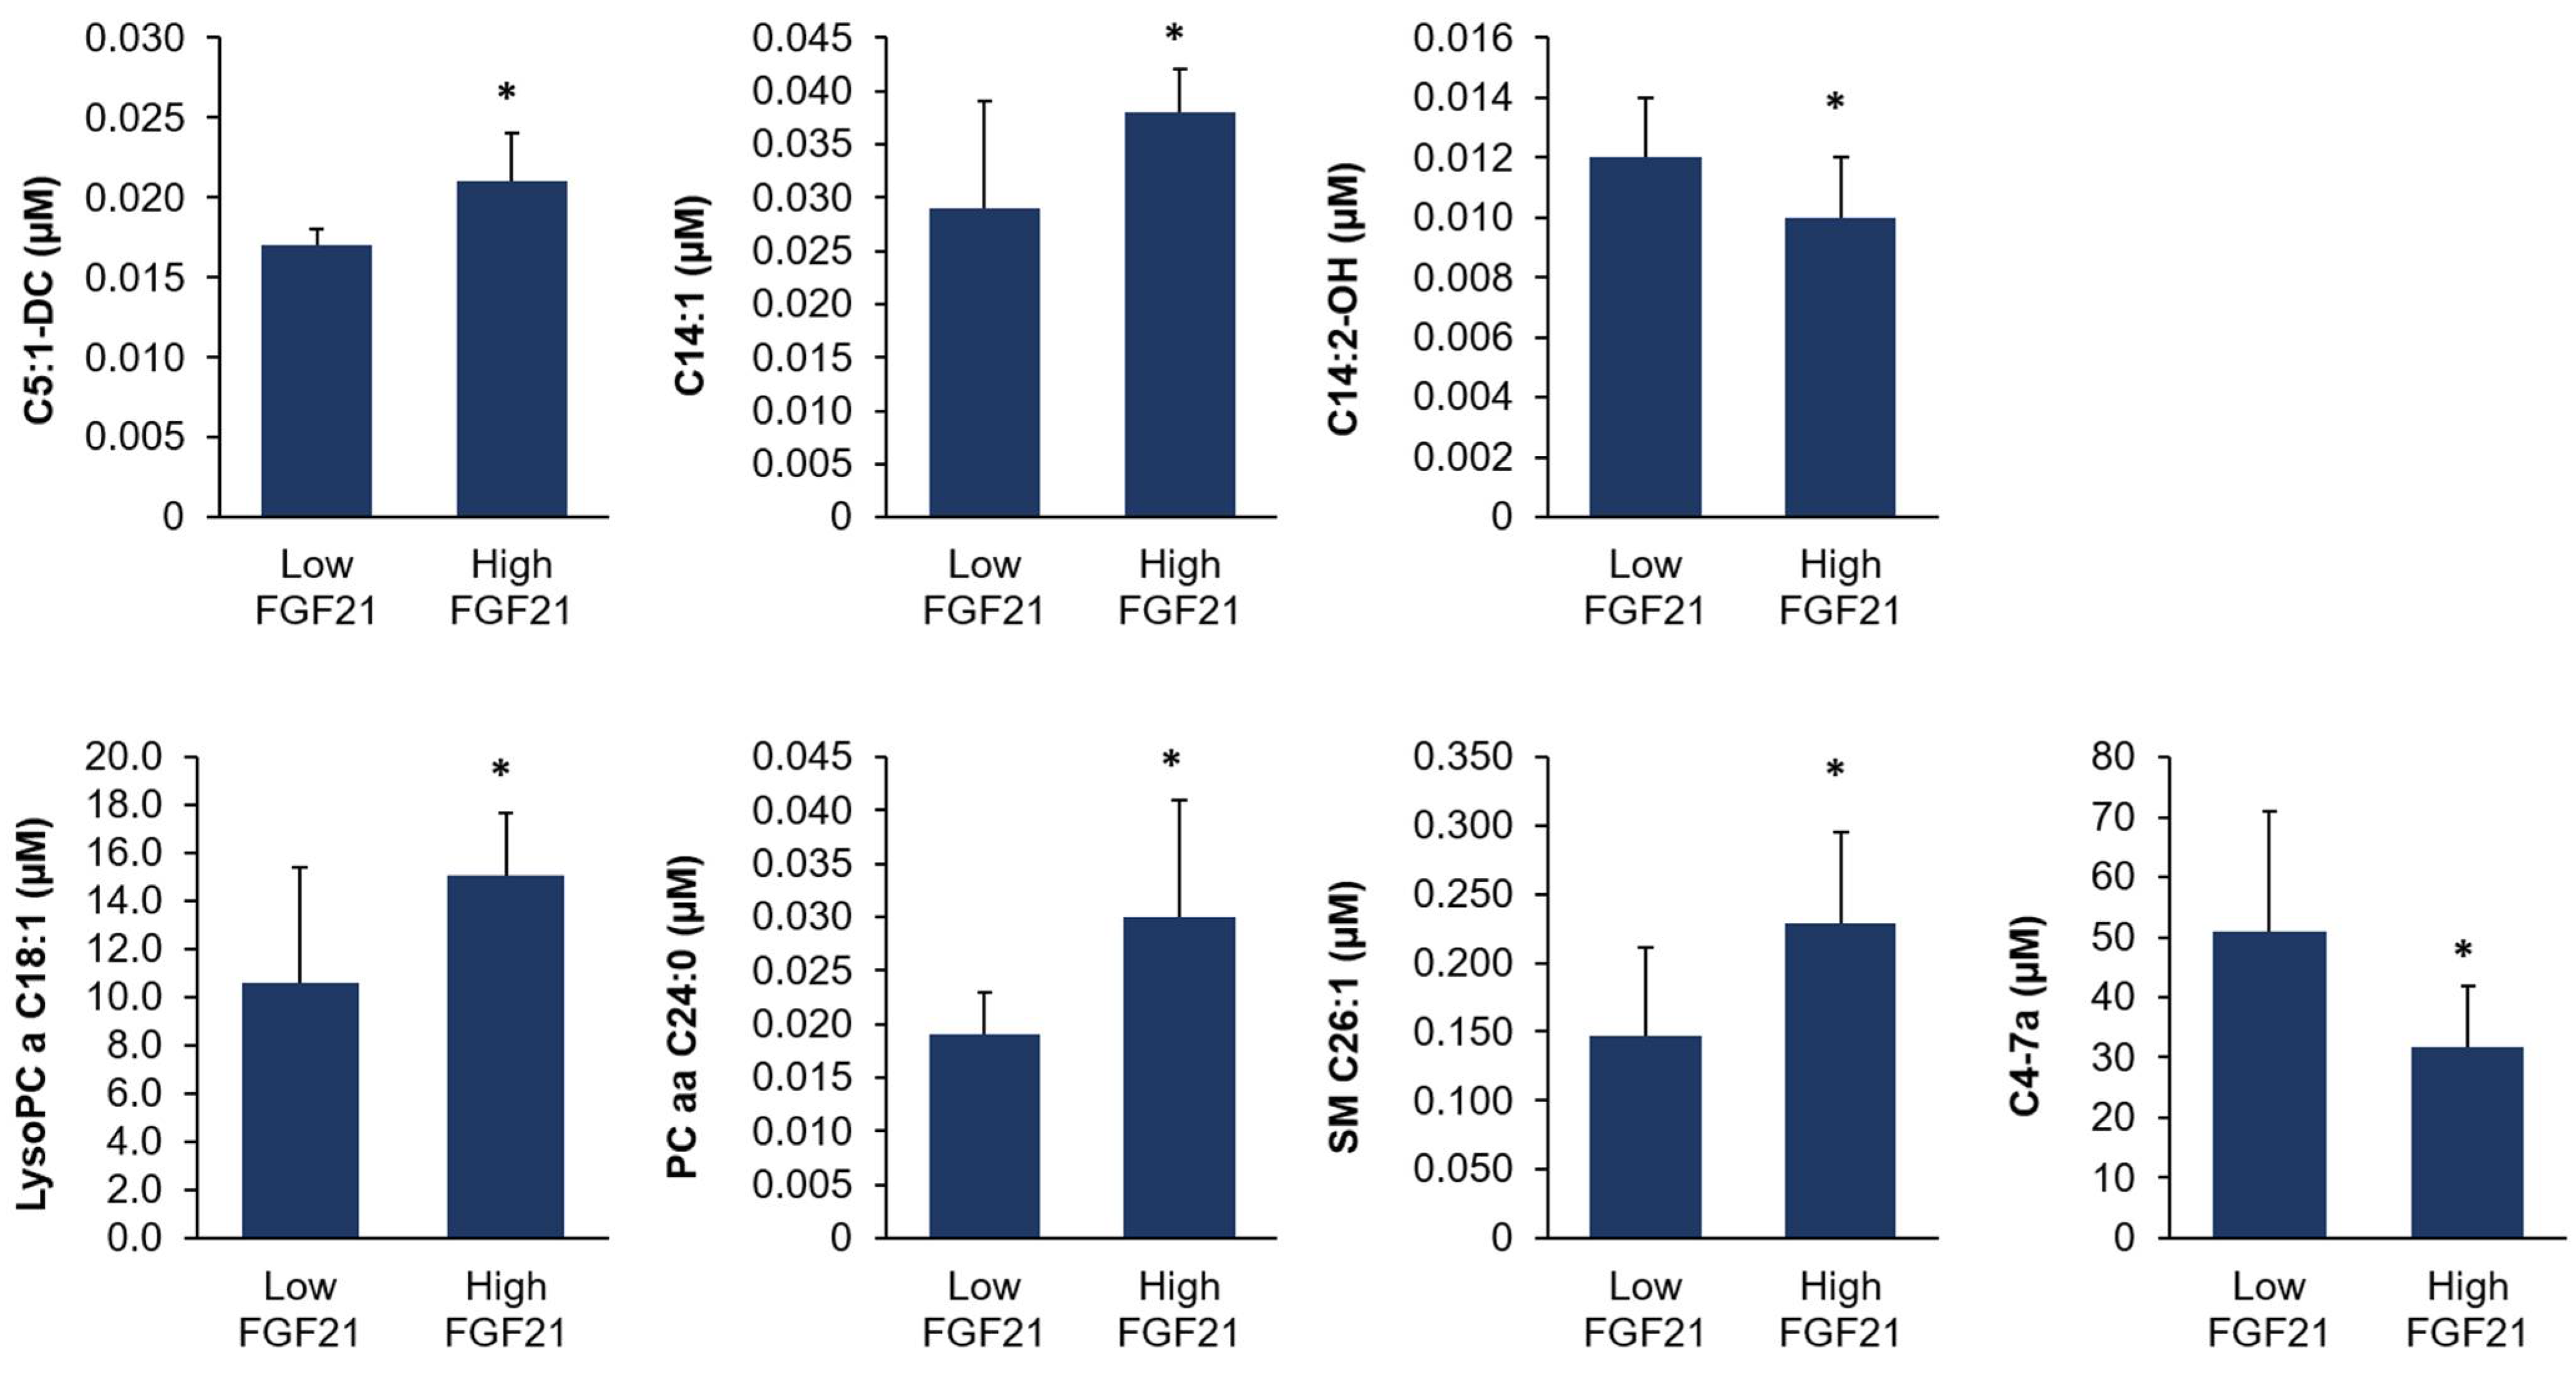
FGF21 expression in the liver was related to alterations on a metabolic level, we performed targeted plasma metabolomics analysis. We observed that the concentrations of only seven out of >200 metabolites were significantly different between the two groups of cows. These seven metabolites belonged to four different metabolite classes (acylcarnitines, glycerophospholipids, sphingolipids, and sterols). Acylcarnitines play a role in the β-oxidation of fatty acids within the mitochondrion. However, acylcarnitines represented only minor species with differing plasma concentrations between the two groups of cows and the concentrations of total carnitine and acetylcarnitine in plasma did not differ between the two group of cows. Therefore, there was no overall indication that FGF21 expression affected the β-oxidation of fatty acids by influencing carnitine metabolism. In a similar manner, the three individual phospholipid species and sterol derivative with differing plasma concentrations between the two groups of cows were minor components, suggesting that FGF21 expression was not linked to substantial effects on phospholipid and sterol metabolism. The observation that the small number of regulated plasma metabolites belonged to four different metabolite classes was a further indication that the hepatic expression level of FGF21 was not associated with the consistent regulation of a specific metabolic pathway. This showed that cows with high and low hepatic FGF21 expression did not differ with regard to hepatic energy metabolism, indicating that other factors must be responsible for the marked difference in hepatic FGF21 expression. Likewise, the application of exogenous FGF21 had no effect on fatty acid metabolism in dairy cows [50]. In addition, FGF21 administration in dairy cows did not affect plasma concentrations of insulin and glucose and insulin concentrations in a glucose tolerance test [51], indicating that glucose metabolism was also not affected by FGF21 in dairy cows. An important reason for the lack of effect of exogenous FGF21 and lack of differences in the main metabolic pathways of energy metabolism between cows with high and low hepatic FGF21 expression might be that the liver, unlike WAT, is not the primary tissue targeted by the action of FGF21. This is reflected by the fact that the physiologic FGF21 receptor FGFR1c, which is strongly expressed in WAT, is nearly absent in cattle liver whereas β-klotho, the co-activator of FGF21, is expressed in cattle liver at a markedly lower level than in WAT [10].
Previous studies have shown that dairy cows are subject to ER stress during early lactation, a phenomenon that could be involved in the development of fatty liver and metabolic diseases during this period [47,52,53,54]. With respect to this finding, an interesting observation from the liver transcriptomics of the present study is that the upregulated transcripts in the cows with high hepatic 
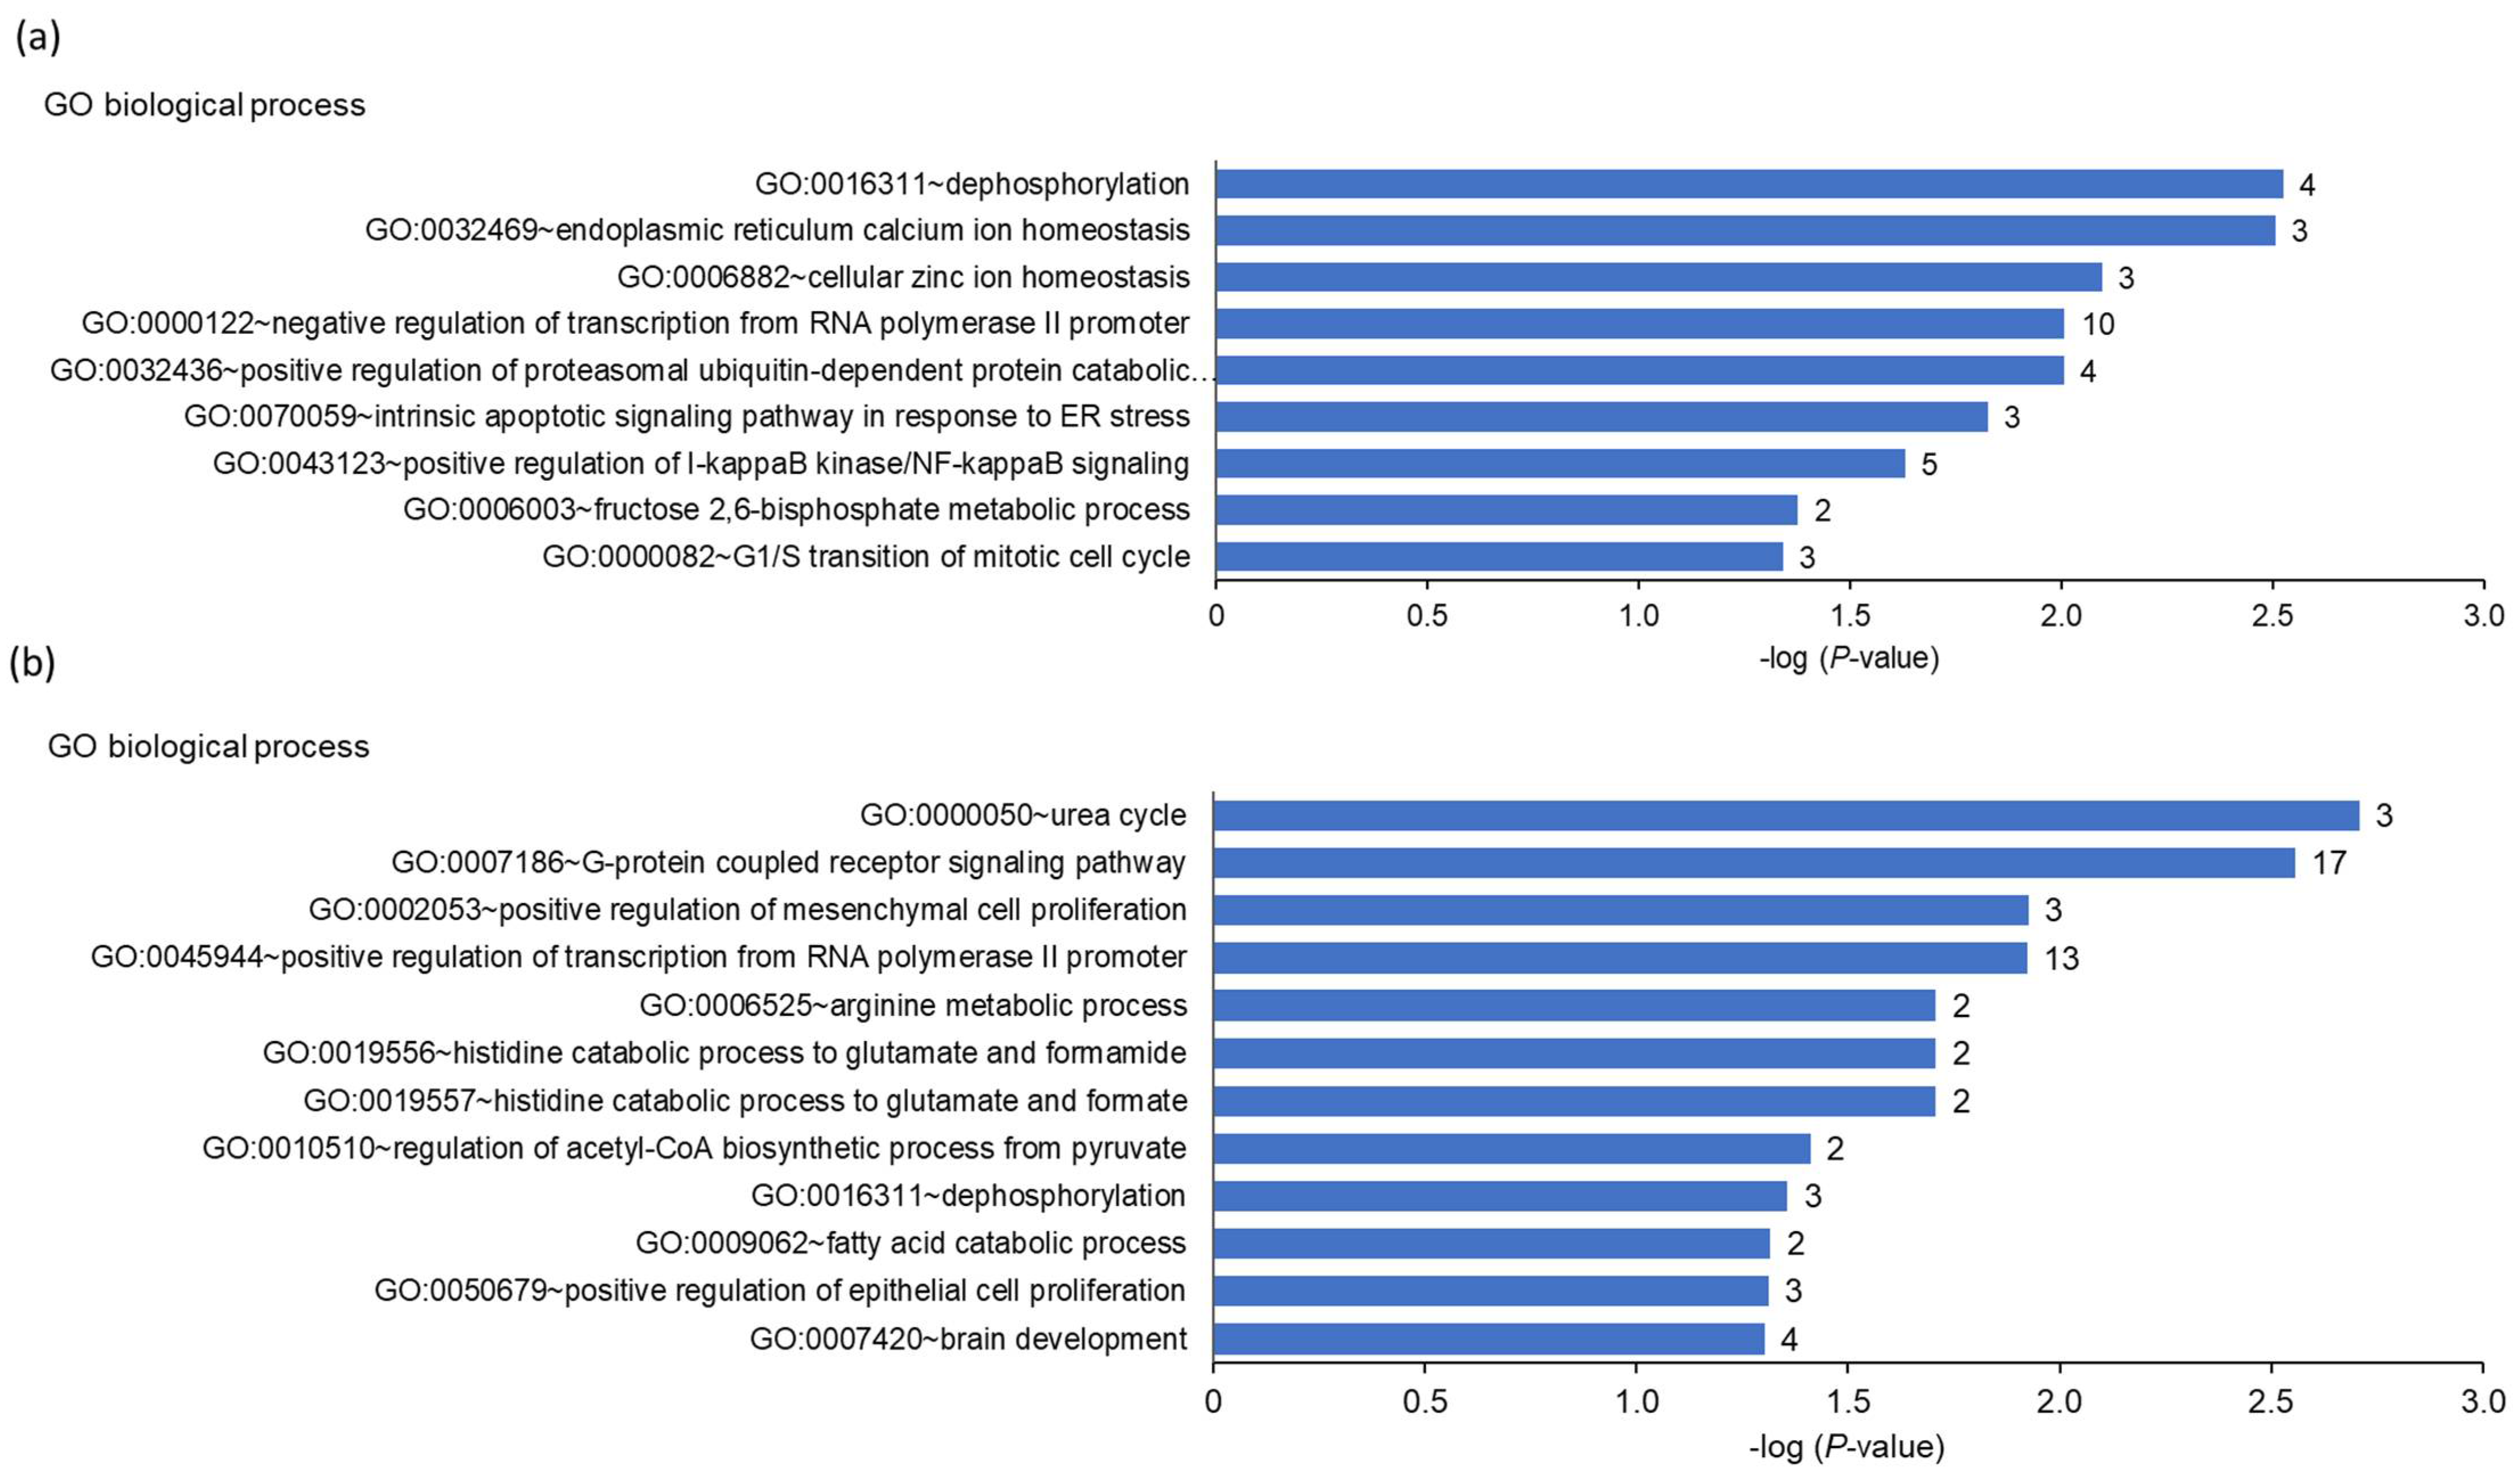
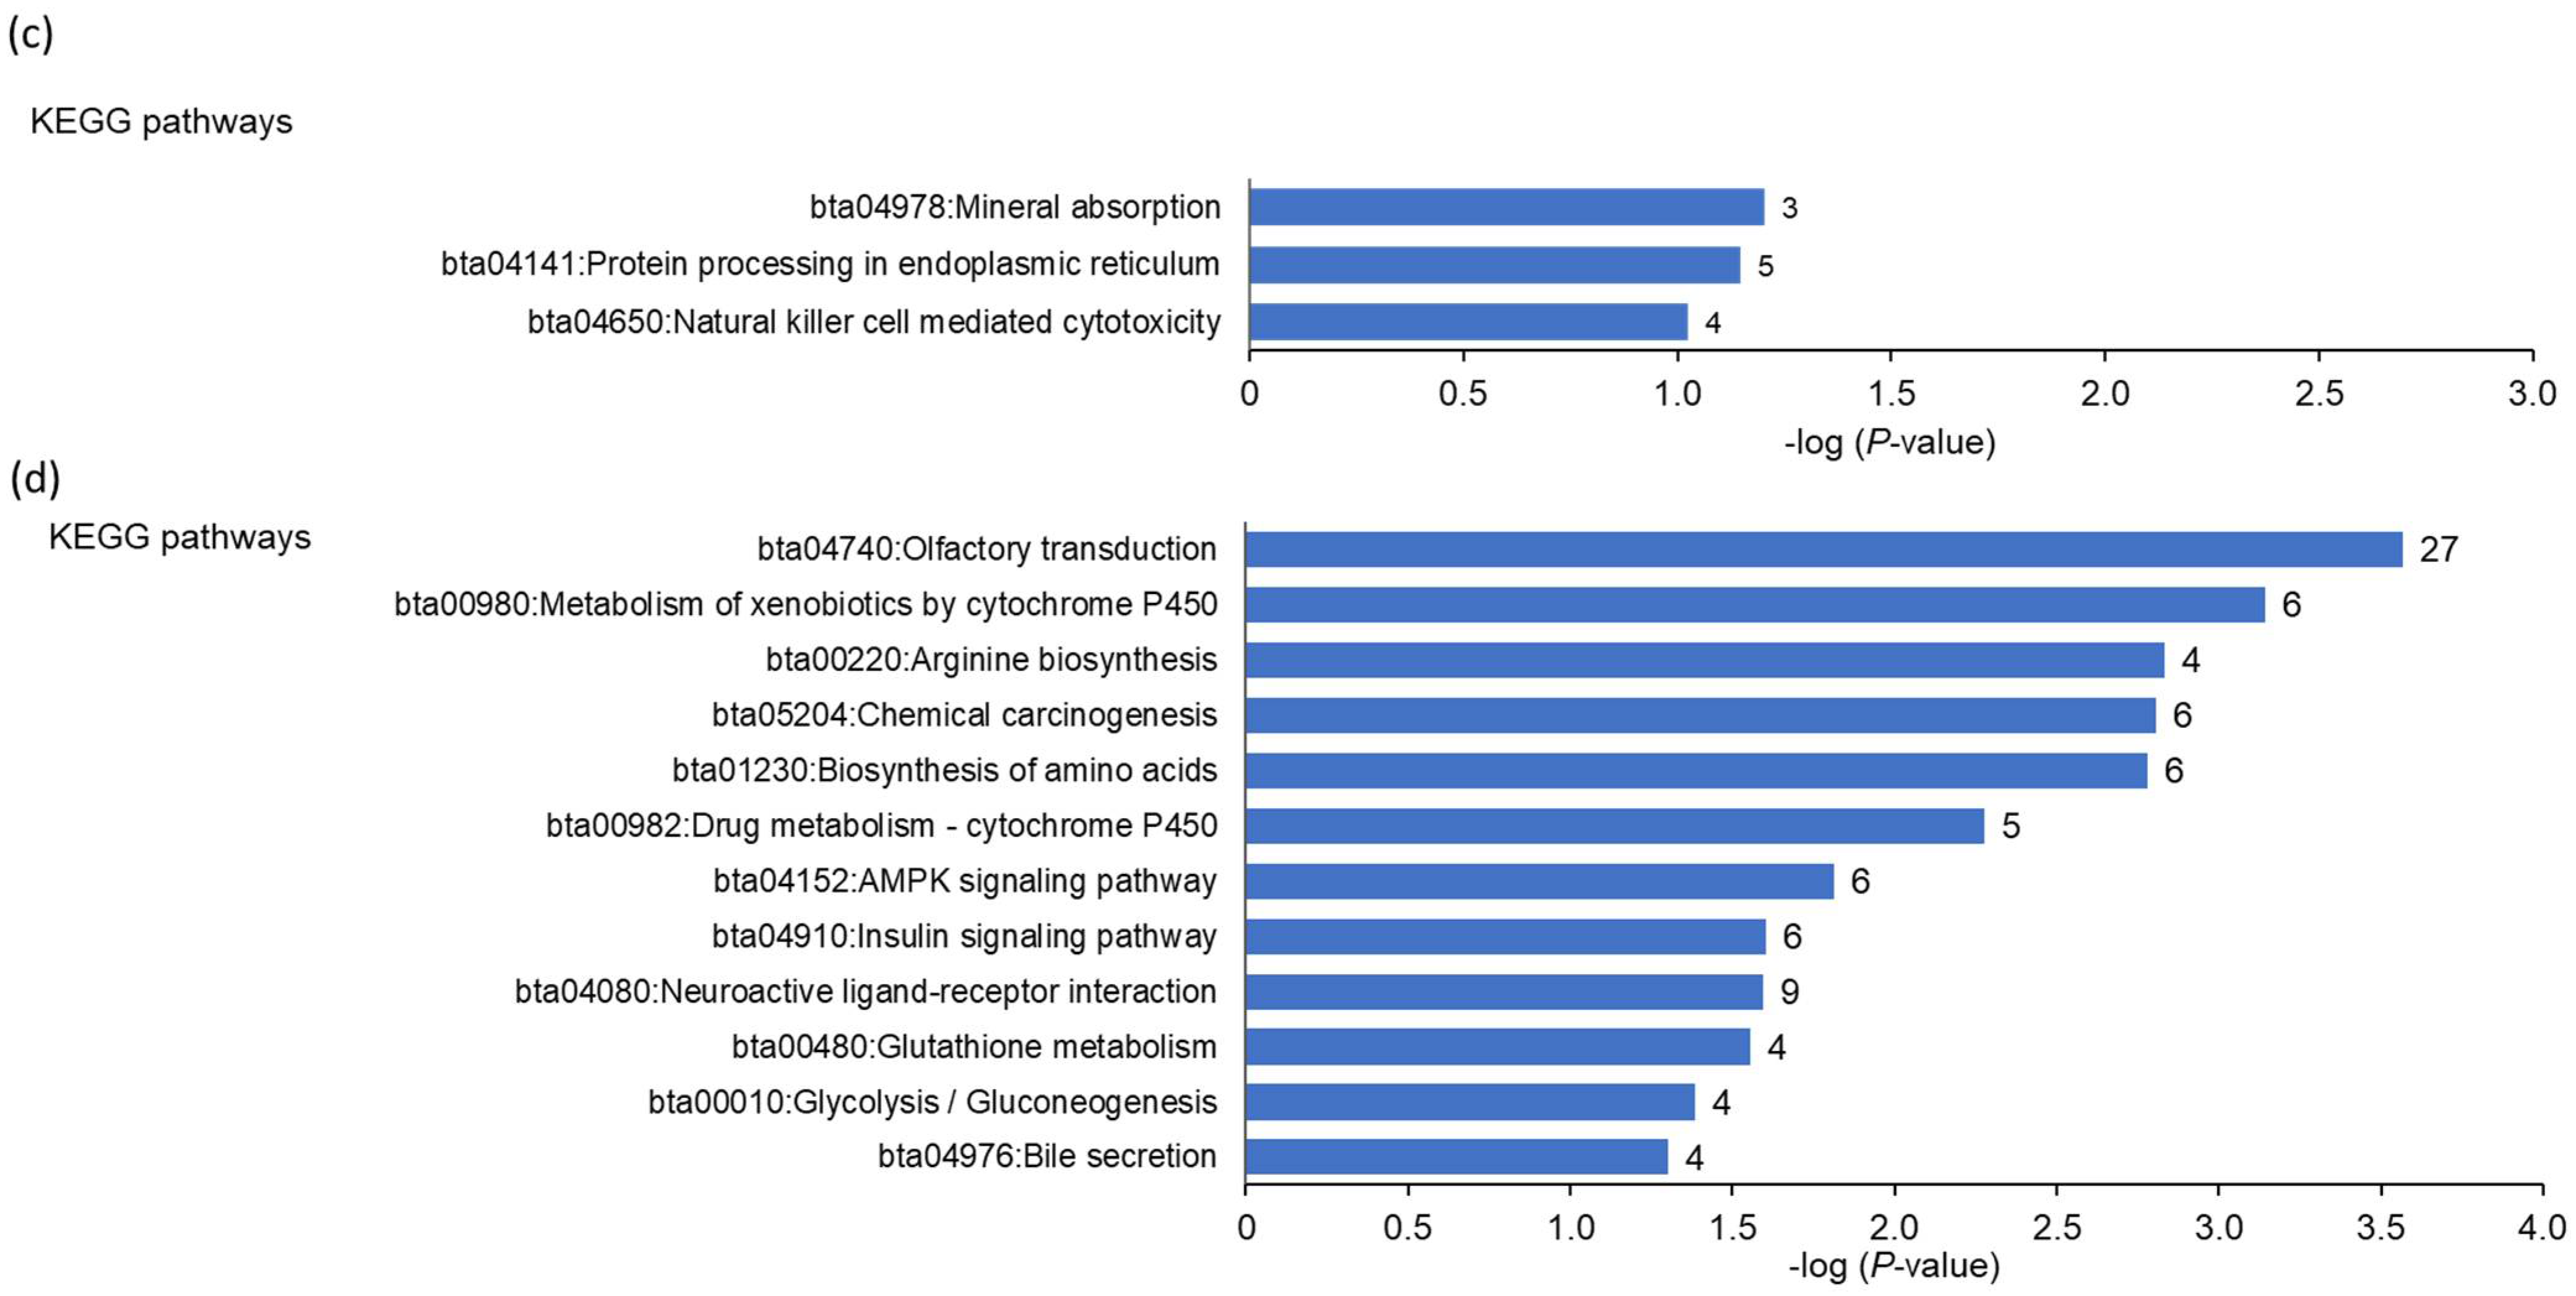
FGF21 expression were involved particularly in the ER stress-induced unfolded protein response (UPR). This was evident from the gene set enrichment analysis, which demonstrated that the intrinsic apoptotic signaling pathway in response to ER stress, response to nutrient levels, response to extracellular stimulus, response to starvation, programmed cell death, and protein processing in the ER were amongst the most enriched biological process terms and KEGG pathways within the genes upregulated in the cows with high hepatic FGF21 expression. In line with this, the upregulated transcripts in cows with high hepatic FGF21 expression included several typical ER stress-target genes, such as ATF4, HERPUD1, HSPA5, DDIT3, WFS1, DNAJB11, CHAC1, and TRIB3. ER stress is well-known to be activated as a consequence of different stress conditions, such as nutrient deprivation, inflammation, and oxidative stress, which cause imbalances in ER quality control pathways leading to the accumulation of unfolded or misfolded proteins in the ER [55]. In order to combat ER stress, mammalian cells are equipped with a defense system, called UPR, which enables the cell to re-establish ER quality control and decrease the accumulation of unfolded or misfolded proteins in the ER [56]. Apart from protein kinase RNA-like ER kinase (PERK)-dependent transient attenuation of new protein synthesis and stimulation of inositol-requiring protein 1a (IRE1)-dependent mRNA degradation, another important UPR mechanism is the targeting of unfolded or misfolded proteins towards the ER-associated degradation pathway, where they are transferred to the cytosol and degraded by the ubiquitin proteasome system (UPS) [57]—the most important pathway of intracellular protein degradation. In agreement with this UPR mechanism, the gene set enrichment analysis also revealed that regulation of protein catabolic process, positive regulation of proteasomal ubiquitin-dependent protein catabolic process, regulation of protein metabolic process, and positive regulation of proteasomal protein catabolic process were overrepresented terms amongst the genes upregulated in the cows with high hepatic FGF21 expression. Remarkably, a recent study convincingly demonstrated that FGF21 plays an important role in muscle atrophy during fasting, reporting that the muscle mass of wild-type mice was significantly reduced in response to fasting, whereas muscle-specific FGF21 knockout mice were protected against muscle loss and weakness during fasting [58]. In addition, the authors showed that in vivo FGF21 overexpression in skeletal muscle induced muscle atrophy, thus supporting a role for FGF21 in skeletal muscle proteolysis. Despite that the authors of this study did not study a possible involvement of ER stress, their results indicated that FGF21 expression was associated with increased protein catabolism.
If ER stress is overwhelming and ER homeostasis cannot be restored, the UPR can also activate signaling pathways that initiate programmed cell death. Convincing evidence has been gained from cell culture studies and studies with laboratory animals that ER stress-induced UPR leads to an upregulation of hepatic FGF21 expression through the activation of ER stress-transducers PERK and IRE1 [18,19]. Based on these findings, it is likely that ER stress was responsible for the strong induction of FGF21 expression in the cows with high hepatic FGF21 expression. Previous observations with dairy cows, in which polyphenol-enriched feeding rations decreased not only the hepatic expression of UPR-associated genes but also the expression of FGF21 [20,21,22], are supportive of such a relationship between hepatic ER stress and FGF21 production.
Activation of nuclear factor E2-related factor 2 (Nrf2) in the liver of dairy cows during early lactation was shown in a previous study [46]. Nrf2 is a transcription factor that regulates the expression of a broad range of antioxidant and cytoprotective genes [59]. Hepatic transcript profiling in the present study revealed the upregulation of several target genes of Nrf2, including GPX3, MT1A, MT2A, and MT1E, in cows with high hepatic FGF21 expression. Because activation of Nrf2 signaling is a known downstream event of ER stress, which aims to counteract oxidative stress and inflammatory conditions which are frequently associated with ER stress [60,61], induction of Nrf2-dependent genes is likely a consequence of the induction of ER stress-related genes and a further indicator of the occurrence of ER stress in the cows with high hepatic FGF21 expression. It has been well established that ER stress is linked to the induction of pro-inflammatory conditions [62]. Therefore, we also considered genes associated with inflammation in the liver and concentrations of acute phase proteins in plasma. We observed that there was an up-regulation of two genes encoding serum amyloid A (SAA2, SAA4) in the liver and an increased concentration of SAA in plasma of the cows with high FGF21 expression in the liver compared to cows with low FGF21 expression in the liver. SAA belongs to the group of acute phase proteins produced in the liver and released into the blood in the course of inflammation [63]. Therefore, increased production of SAA in the liver of the group of cows with high hepatic FGF21 expression indicates that these cows could have suffered pro-inflammatory conditions in the liver. However, the expression of several other genes encoding proteins involved in inflammation (such as TNF) and acute phase reaction (CP, HP) in the liver did not differ between the two groups of cows, indicating that the increased expression of FGF21 was not related to the development of a pro-inflammatory condition. Moreover, plasma concentrations of oxylipids, including 9-HODE, 13-HODE, 12-HETE, 15-HETE, LTB4, and PGF2α, also did not differ between the two groups of cows. Oxylipids are a class of lipid mediators produced by enzymatic and non-enzymatic oxidation of PUFA, dominantly linoleic acid (LA) and arachidonic acid (AA). LA-derived 9-HODE and 13-HODE, but also AA-derived HETEs and eicosanoids, promote inflammatory responses by acting as chemoattractants for circulating immune cells [64]. Thus, the present data suggest that the cows with high hepatic FGF21 expression did not exhibit a systemic inflammatory process. In addition, the cows with high and low hepatic FGF21 expression did not differ with regard to the plasma concentrations of antioxidants, such as tocopherols, β-carotene, and GSH, and indicators of antioxidant status, such as TEAC, TBARS, and protein carbonyls. This indicated that the cows with high hepatic FGF21 expression also did not experience systemic oxidative stress, which is frequently associated with inflammation. Albeit speculative, it is possible that the induction of Nrf2-dependent genes observed in the cows with high hepatic FGF21 expression prevented the development of systemic oxidative stress, because activation of Nrf2 signaling activated the expression of genes encoding cytoprotective enzymes, including antioxidant enzymes, thereby providing protection against ROS generated during the inflammatory process. This assumption is supported by recent evidence that FGF21 inhibits oxidative stress by stimulating Nrf2-dependent induction of cytoprotective and antioxidative genes [65,66,67]. This would suggest that FGF21 plays an important role in the adaptation to cellular stress conditions in dairy cows during early lactation—a phase during which high-yield dairy cows are confronted with several different stress stimuli [5,6,7,8]. Indeed, our assumption of FGF21 as a stress-modulating factor in early-lactation dairy cows is supported by the results from a mice study that suggested that FGF21 induction was a potential strategy to protect against the toxicity resulting from experimentally induced sepsis [68]. While the upregulated genes in the cows with high FGF21 expression were found to be involved particularly in ER stress-induced UPR, the downregulated genes in the cows with high hepatic FGF21 expression were identified to play a role in the cellular amino acid catabolic process, alpha-amino acid metabolic process, glutamine family amino acid metabolic process, arginine biosynthesis, and urea cycle. This indicated that hepatic amino acid catabolism was attenuated in the cows with high compared to low hepatic FGF21 expression. Although speculative, this might be interpreted as a mechanism to provide amino acids for specific organ functions, such as acute phase protein synthesis, which are activated as a consequence of ER stress, as seen in the cows with high hepatic FGF21 expression. Overall, our data indicate that induction of hepatic FGF21 in cows after parturition (1 week postpartum) might be, at least in part, caused by cellular stress such as ER stress. In turn, FGF21 might induce hepatic signaling pathways, such as Nrf2, which helps the body to cope with stress conditions and protect the liver against damage induced by the inflammation process and increased generation of reactive oxygen species commonly observed in dairy cows after parturition [8,69].

5. Conclusions

Analysis of FGF21 expression levels in the livers of a cohort of 30 cows demonstrated that the increase in FGF21 expression in early lactation (week 1 postpartum) showed a great of individual variation. We observed that the performance data of cows with high and low hepatic FGF21 expression did not differ at days 8 –14 postpartum, indicating that animal performance level and energy balance are not major determinants of hepatic FGF21 expression. However, we observed that the FGF21 expression level was associated with the expression of genes related to ER stress and Nrf2 signaling. These findings suggest that hepatic FGF21 expression might be induced by ER stress. Upregulation of Nrf2-dependent genes in cows with high hepatic FGF21 expression might be a compensatory means to combat cellular stress. The finding that the expression of genes involved in metabolic pathways of energy generation (β-oxidation and mitochondrial fatty acid import, gluconeogenesis, ketogenesis, and the tricarboxylic acid cycle) in the liver was not largely different between the two groups of cows indicated that hepatic FGF21 expression had less overall impact on energy metabolism. This suggestion was supported by the finding that the concentrations of only 7 (out of >200) plasma metabolites from different compound classes differed between cows with high or low hepatic FGF21 expression. Overall, in line with observations in other animal species, FGF21 seems to have an important function in the adaptation to cellular stress conditions in cows during early lactation, a time period in which cows are commonly confronted with several different stress stimuli.

Supplementary Materials

The following supporting information can be downloaded at: https://www.mdpi.com/article/10.3390/ani13010131/s1, Table S1: Characteristics of gene-specific primers; Table S2: Fold change (FC) and p-values of all differentially expressed transcripts, Table S3: Validation of gene chip data for selected differentially expressed transcripts by qPCR.

Author Contributions

Conceptualization, K.E. and D.K.G.; methodology, K.E. and D.K.G.; validation, L.M.S. and E.M.; formal analysis, L.M.S., D.K.G. and E.M.; investigation, C.K., L.M.S. and E.M.; resources, K.E.; writing—original draft preparation, D.K.G. and R.R.; writing—review and editing, D.K.G., R.R. and K.E.; visualization, D.K.G. and R.R.; supervision, D.K.G. and K.E.; project administration, D.K.G.; funding acquisition, D.K.G. and K.E. All authors have read and agreed to the published version of the manuscript.

Funding

This research was supported by the German Research Foundation (DFG; Grant no. GE 2925/1-1, GE 2925/2-1).

Institutional Review Board Statement

The animal study protocol was approved by the Provincial Government of Coblenz, Germany (23 177–07/G15–20–040; 06/10/2015).

Informed Consent Statement

Not applicable.

Data Availability Statement

The microarray data have been deposited in MIAME compliant format in the NCBI’s Gene Expression Omnibus public repository; GEO accession no. will be provided during review.

Conflicts of Interest

The authors declare no conflict of interest. The funders had no role in the design of the study; in the collection, analyses, or interpretation of data; in the writing of the manuscript, or in the decision to publish the results.

References

  1. Kharitonenkov, A.; Shiyanova, T.L.; Koester, A.; Ford, A.M.; Micanovic, R.; Galbreath, E.J.; Sandusky, G.E.; Hammond, L.J.; Moyers, J.S.; Owens, R.A.; et al. FGF-21 as a novel metabolic regulator. J. Clin. Invest. 2005, 115, 1627–1635. [Google Scholar] [CrossRef] [PubMed] [Green Version]
  2. nagaki, T.; Dutchak, P.; Zhao, G.; Ding, X.; Gautron, L.; Parameswara, V.; Li, Y.; Goetz, R.; Mohammadi, M.; Esser, V.; et al. Endocrine Regulation of the Fasting Response by PPARα-Mediated Induction of Fibroblast Growth Factor 21. Cell Metab. 2007, 5, 415–425. [Google Scholar] [CrossRef] [PubMed] [Green Version]
  3. Potthoff, M.J.; Inagaki, T.; Satapati, S.; Ding, X.; He, T.; Goetz, R.; Mohammadi, M.; Finck, B.N.; Mangelsdorf, D.J.; Kliewer, S.A.; et al. FGF21 induces PGC-1α and regulates carbohydrate and fatty acid metabolism during the adaptive starvation response. Proc. Natl. Acad. Sci. USA 2009, 106, 10853–10858. [Google Scholar] [CrossRef] [PubMed] [Green Version]
  4. Kim, K.H.; Lee, M.-S. FGF21 as a Stress Hormone: The Roles of FGF21 in Stress Adaptation and the Treatment of Metabolic Diseases. Diabetes Metab. J. 2014, 38, 245–251. [Google Scholar] [CrossRef] [PubMed] [Green Version]
  5. Drackley, J.K. Biology of Dairy Cows During the Transition Period: The Final Frontier? J. Dairy Sci. 1999, 82, 2259–2273. [Google Scholar] [CrossRef] [PubMed]
  6. Plaizier, J.C.; Krause, D.O.; Gozho, G.N.; McBride, B.W. Subacute ruminal acidosis in dairy cows: The physiological causes, incidence and consequences. Vet. J. 2008, 176, 21–31. [Google Scholar] [CrossRef] [PubMed]
  7. Vels, L.; Røntved, C.; Bjerring, M.; Ingvartsen, K. Cytokine and acute phase protein gene expression in repeated liver biopsies of dairy cows with a lipopolysaccharide-induced mastitis. J. Dairy Sci. 2009, 92, 922–934. [Google Scholar] [CrossRef] [Green Version]
  8. Bradford, B.; Yuan, K.; Farney, J.; Mamedova, L.; Carpenter, A. Invited review: Inflammation during the transition to lactation: New adventures with an old flame. J. Dairy Sci. 2015, 98, 6631–6650. [Google Scholar] [CrossRef] [Green Version]
  9. Carriquiry, M.; Weber, W.; Fahrenkrug, S.; Crooker, B. Hepatic gene expression in multiparous Holstein cows treated with bovine somatotropin and fed n-3 fatty acids in early lactation. J. Dairy Sci. 2009, 92, 4889–4900. [Google Scholar] [CrossRef]
  10. Schoenberg, K.M.; Giesy, S.L.; Harvatine, K.; Waldron, M.R.; Cheng, C.; Kharitonenkov, A.; Boisclair, Y.R. Plasma FGF21 Is Elevated by the Intense Lipid Mobilization of Lactation. Endocrinology 2011, 152, 4652–4661. [Google Scholar] [CrossRef]
  11. Schlegel, G.; Ringseis, R.; Keller, J.; Schwarz, F.J.; Windisch, W.; Eder, K. Expression of fibroblast growth factor 21 in the liver of dairy cows in the transition period and during lactation. J. Anim. Physiol. Anim. Nutr. 2012, 97, 820–829. [Google Scholar] [CrossRef] [PubMed]
  12. Drong, C.; Bühler, S.; Frahm, J.; Hüther, L.; Meyer, U.; von Soosten, D.; Gessner, D.; Eder, K.; Sauerwein, H.; Dänicke, S. Effects of body condition, monensin, and essential oils on ruminal lipopolysaccharide concentration, inflammatory markers, and endoplasmatic reticulum stress of transition dairy cows. J. Dairy Sci. 2017, 100, 2751–2764. [Google Scholar] [CrossRef] [PubMed] [Green Version]
  13. Wang, J.G.; Guo, Y.Z.; Kong, Y.Z.; Dai, S.; Zhao, B.Y. High non-esterified fatty acid concentrations promote expression and secretion of fibroblast growth factor 21 in calf hepatocytes cultured in vitro. J. Anim. Physiol. Anim. Nutr. 2017, 102, e476–e481. [Google Scholar] [CrossRef] [PubMed]
  14. Wang, J.; Zhu, X.; She, G.; Kong, Y.; Guo, Y.; Wang, Z.; Liu, G.; Zhao, B. Serum hepatokines in dairy cows: Periparturient variation and changes in energy-related metabolic disorders. BMC Vet. Res. 2018, 14, 236. [Google Scholar] [CrossRef] [PubMed]
  15. Badman, M.K.; Pissios, P.; Kennedy, A.R.; Koukos, G.; Flier, J.S.; Maratos-Flier, E. Hepatic Fibroblast Growth Factor 21 Is Regulated by PPARα and Is a Key Mediator of Hepatic Lipid Metabolism in Ketotic States. Cell Metab. 2007, 5, 426–437. [Google Scholar] [CrossRef] [Green Version]
  16. Khan, M.J.; Jacometo, C.B.; Graugnard, D.E.; Corrêa, M.N.; Schmitt, E.; Cardoso, F.; Loor, J.J. Overfeeding Dairy Cattle during Late-Pregnancy Alters Hepatic PPARα-Regulated Pathways Including Hepatokines: Impact on Metabolism and Peripheral Insulin Sensitivity. Gene Regul. Syst. Biol. 2014, 8, 97–111. [Google Scholar] [CrossRef] [Green Version]
  17. Akbar, H.; Batistel, F.; Drackley, J.K.; Loor, J.J. Alterations in Hepatic FGF21, Co-Regulated Genes, and Upstream Metabolic Genes in Response to Nutrition, Ketosis and Inflammation in Peripartal Holstein Cows. PLoS ONE 2015, 10, e0139963. [Google Scholar] [CrossRef]
  18. Schaap, F.G.; Kremer, A.E.; Lamers, W.H.; Jansen, P.L.; Gaemers, I.C. Fibroblast growth factor 21 is induced by endoplasmic reticulum stress. Biochimie 2013, 95, 692–699. [Google Scholar] [CrossRef]
  19. Jiang, S.; Yan, C.; Fang, Q.-C.; Shao, M.-L.; Zhang, Y.-L.; Liu, Y.; Deng, Y.-P.; Shan, B.; Liu, J.-Q.; Li, H.-T.; et al. Fibroblast Growth Factor 21 Is Regulated by the IRE1α-XBP1 Branch of the Unfolded Protein Response and Counteracts Endoplasmic Reticulum Stress-induced Hepatic Steatosis. J. Biol. Chem. 2014, 289, 29751–29765. [Google Scholar] [CrossRef] [Green Version]
  20. Winkler, A.; Gessner, D.K.; Koch, C.; Romberg, F.-J.; Dusel, G.; Herzog, E.; Most, E.; Eder, K. Effects of a plant product consisting of green tea and curcuma extract on milk production and the expression of hepatic genes involved in endoplasmic stress response and inflammation in dairy cows. Arch. Anim. Nutr. 2015, 69, 425–441. [Google Scholar] [CrossRef]
  21. Gessner, D.K.; Koch, C.; Romberg, F.J.; Winkler, A.; Dusel, G.; Herzog, E.; Most, E.; Eder, K. The effect of grape seed and grape marc meal extract on milk performance and the expression of genes of endoplasmic reticulum stress and inflammation in the liver of dairy cows in early lactation. J. Dairy Sci. 2015, 98, 8856–8868. [Google Scholar] [CrossRef] [PubMed] [Green Version]
  22. Gessner, D.K.; Winkler, A.; Koch, C.; Dusel, G.; Liebisch, G.; Ringseis, R.; Eder, K. Analysis of hepatic transcript profile and plasma lipid profile in early lactating dairy cows fed grape seed and grape marc meal extract. BMC Genom. 2017, 18, 253. [Google Scholar] [CrossRef] [PubMed] [Green Version]
  23. Coskun, T.; Bina, H.A.; Schneider, M.A.; Dunbar, J.D.; Hu, C.C.; Chen, Y.; Moller, D.E.; Kharitonenkov, A. Fibroblast Growth Factor 21 Corrects Obesity in Mice. Endocrinology 2008, 149, 6018–6027. [Google Scholar] [CrossRef] [PubMed]
  24. Xu, J.; Lloyd, D.J.; Hale, C.; Stanislaus, S.; Chen, M.; Sivits, G.; Vonderfecht, S.; Hecht, R.; Li, Y.-S.; Lindberg, R.A.; et al. Fibroblast Growth Factor 21 Reverses Hepatic Steatosis, Increases Energy Expenditure, and Improves Insulin Sensitivity in Diet-Induced Obese Mice. Diabetes 2009, 58, 250–259. [Google Scholar] [CrossRef] [PubMed] [Green Version]
  25. Giralt, M.; Gavaldà-Navarro, A.; Villarroya, F. Fibroblast growth factor-21, energy balance and obesity. Mol. Cell. Endocrinol. 2015, 418, 66–73. [Google Scholar] [CrossRef]
  26. Tillman, E.J.; Rolph, T. FGF21: An Emerging Therapeutic Target for Non-Alcoholic Steatohepatitis and Related Metabolic Diseases. Front. Endocrinol. 2020, 11, 601290. [Google Scholar] [CrossRef]
  27. Staiger, H.; Keuper, M.; Berti, L.; de Angelis, M.H.; Häring, H.-U. Fibroblast Growth Factor 21—Metabolic Role in Mice and Men. Endocr. Rev. 2017, 38, 468–488. [Google Scholar] [CrossRef]
  28. Lin, Z.; Tian, H.; Lam, K.S.; Lin, S.; Hoo, R.C.; Konishi, M.; Itoh, N.; Wang, Y.; Bornstein, S.R.; Xu, A.; et al. Adiponectin Mediates the Metabolic Effects of FGF21 on Glucose Homeostasis and Insulin Sensitivity in Mice. Cell Metab. 2013, 17, 779–789. [Google Scholar] [CrossRef] [Green Version]
  29. Eder, K.; Gessner, D.K.; Ringseis, R. Fibroblast growth factor 21 in dairy cows: Current knowledge and potential relevance. J. Anim. Sci. Biotechnol. 2021, 12, 97. [Google Scholar] [CrossRef]
  30. Gessner, D.K.; Brock, C.; Hof, L.M.; Most, E.; Koch, C.; Eder, K. Effects of supplementation of green tea extract on the milk performance of peripartal dairy cows and the expression of stress response genes in the liver. J. Anim. Sci. Biotechnol. 2020, 11, 57. [Google Scholar] [CrossRef]
  31. VDLUFA. Verband Deutscher Landwirtschaftlicher Untersuchungs- und Forschungsanstalten. In Handbuch der Landwirtschaftlichen Versuchs- und Untersuchungsmethodik (VDLUFA-Methodenbuch), Bd. III. Die chemische Untersuchung von Futtermitteln; VDLUFA-Verlag: Darmstadt, Germany, 2007. [Google Scholar]
  32. Van Soest, P.J.; Robertson, J.B.; Lewis, B.A. Methods for dietary fiber, neutral detergent fiber, and nonstarch polysaccharides in relation to animal nutrition. J. Dairy Sci. 1991, 74, 3583–3597. [Google Scholar] [CrossRef] [PubMed]
  33. German Society of Nutrition Physiology (GfE). Recommendations for the Supply of Energy and Nutrients to Dairy Cows and Heifers; Committee for Requirement Standards of the Society of Nutrition Physiology, DLG Verlag: Frankfurt am Main, Germany, 2001. [Google Scholar]
  34. Hara, A.; Radin, N.S. Lipid extraction of tissues with a low-toxicity solvent. Anal. Biochem. 1978, 90, 420–426. [Google Scholar] [CrossRef] [PubMed] [Green Version]
  35. Eder, K.; Kirchgessner, M. Dietary Fat Influences the Effect of Zinc Deficiency on Liver Lipids and Fatty Acids in Rats Force-Fed Equal Quantities of Diet. J. Nutr. 1994, 124, 1917–1926. [Google Scholar] [CrossRef] [PubMed]
  36. Re, R.; Pellegrini, N.; Proteggente, A.; Pannala, A.; Yang, M.; Rice-Evans, C. Antioxidant activity applying an improved ABTS radical cation decolorization assay. Free Radic Biol Med. 1999, 26, 1231–1237. [Google Scholar] [CrossRef]
  37. Balz, M.K.; Schulte, E.; Their, H.P. Simultaneous determination of tocopheryl acetate, tocopherols and tocotrienols by HPLC with fluorescence detection in foods. Fat Sci. Technol. 1993, 95, 215–220. [Google Scholar] [CrossRef]
  38. Sidwell, C.G.; Salwin, H.; Benca, M.; Mitchell, J.H. The use of thiobarbituric acid as a measure of fat oxidation. J. Am. Oil Chem. Soc. 1954, 31, 603–606. [Google Scholar] [CrossRef]
  39. Levine, R.L.; Garland, D.; Oliver, C.N.; Amici, A.; Climent, I.; Lenz, A.G.; Ahn, B.W.; Shaltiel, S.; Stadtman, E.R. Determination of carbonyl content in oxidatively modified proteins. Methods Enzymol. 1990, 186, 464–478. [Google Scholar] [CrossRef]
  40. Tietze, F. Enzymic method for quantitative determination of nanogram amounts of total and oxidized glutathione: Applications to mammalian blood and other tissues. Anal. Biochem. 1969, 27, 502–522. [Google Scholar] [CrossRef]
  41. Griffith, O.W. Determination of glutathione and glutathione disulfide using glutathione reductase and 2-vinylpyridine. Anal. Biochem. 1980, 106, 207–212. [Google Scholar] [CrossRef]
  42. Zeitz, J.O.; Ehbrecht, T.; Fleischmann, A.; Most, E.; Gessner, D.K.; Friedrichs, S.; Sparenberg, M.; Failing, K.; Whelan, R.; Lütjohann, D.; et al. Effect of DL-Methionine Supplementation on Tissue and Plasma Antioxidant Status and Concentrations of Oxidation Products of Cholesterol and Phytosterols in Heat-Processed Thigh Muscle of Broilers. Animals 2020, 10, 2050. [Google Scholar] [CrossRef]
  43. Huang, D.W.; Sherman, B.T.; Lempicki, R.A. Systematic and integrative analysis of large gene lists using DAVID bioinformatics resources. Nat. Protoc. 2009, 4, 44–57. [Google Scholar] [CrossRef] [PubMed]
  44. Vandesompele, J.; De Preter, K.; Pattyn, F.; Poppe, B.; Van Roy, N.; De Paepe, A.; Speleman, F. Accurate normalization of real-time quantitative RT-PCR data by geometric averaging of multiple internal control genes. Genome Biol. 2002, 3, RESEARCH0034. [Google Scholar] [CrossRef] [PubMed] [Green Version]
  45. Vailati-Riboni, M.; Osorio, J.S.; Trevisi, E.; Luchini, D.; Loor, J.J. Supplemental Smartamine M in higher-energy diets during the prepartal period improves hepatic biomarkers of health and oxidative status in Holstein cows. J. Anim. Sci. Biotechnol. 2017, 8, 17. [Google Scholar] [CrossRef] [PubMed] [Green Version]
  46. Gessner, D.K.; Schlegel, G.; Ringseis, R.; Schwarz, F.J.; Eder, K. Up-regulation of endoplasmic reticulum stress induced genes of the unfolded protein response in the liver of periparturient dairy cows. BMC Vet. Res. 2014, 10, 46. [Google Scholar] [CrossRef] [Green Version]
  47. Gessner, D.K.; Schlegel, G.; Keller, J.; Schwarz, F.J.; Ringseis, R.; Eder, K. Expression of target genes of nuclear factor E2-related factor 2 in the liver of dairy cows in the transition period and at different stages of lactation. J. Dairy Sci. 2013, 96, 1038–1043. [Google Scholar] [CrossRef] [PubMed] [Green Version]
  48. Janovick, N.; Dann, H.; Loor, J.; Drackley, J. Prepartum dietary energy intake alters hepatic expression of genes related to peroxisome proliferator-activated receptor and inflammation in peripartal dairy cows. J. Dairy Sci. 2022, 105, 8069–8086. [Google Scholar] [CrossRef]
  49. Thompson, K.L.; Pine, P.S.; A Rosenzweig, B.; Turpaz, Y.; Retief, J. Characterization of the effect of sample quality on high density oligonucleotide microarray data using progressively degraded rat liver RNA. BMC Biotechnol. 2007, 7, 57. [Google Scholar] [CrossRef] [Green Version]
  50. Caixeta, L.S.; Giesy, S.L.; Krumm, C.S.; Perfield, J.W., 2nd; Butterfield, A.; Boisclair, Y.R. Fibroblast growth factor-21 (FGF21) administration to early-lactating dairy cows. II. Pharmacokinetics, whole-animal performance, and lipid metabolism. J. Dairy Sci. 2019, 102, 11597–11608. [Google Scholar] [CrossRef]
  51. Krumm, C.S.; Giesy, S.L.; Caixeta, L.S.; Perfield, J.W., 2nd; Sauerwein, H.; Moore, B.L.; Boisclair, Y.R. Fibroblast growth factor-21 (FGF21) administration to early-lactating dairy cows. I. Effects on signaling and indices of insulin action. J. Dairy Sci. 2019, 102, 11586–11596. [Google Scholar] [CrossRef]
  52. Ringseis, R.; Gessner, D.K.; Eder, K. Molecular insights into the mechanisms of liver-associated diseases in early-lactating dairy cows: Hypothetical role of endoplasmic reticulum stress. J. Anim. Physiol. Anim. Nutr. 2015, 99, 626–645. [Google Scholar] [CrossRef]
  53. Shi, Z.; Song, Y.; Gao, X.; Loor, J.J.; Aboragah, A.; Yu, H.; Fang, Z.; Zhu, Y.; Du, X.; Li, X.; et al. Disruption of endoplasmic reticulum homeostasis exacerbates liver injury in clinically ketotic cows. J. Dairy Sci. 2021, 104, 9130–9141. [Google Scholar] [CrossRef] [PubMed]
  54. Zhu, Y.; Guan, Y.; Loor, J.; Sha, X.; Coleman, D.N.; Zhang, C.; Du, X.; Shi, Z.; Li, X.; Wang, Z.; et al. Fatty acid-induced endoplasmic reticulum stress promoted lipid accumulation in calf hepatocytes, and endoplasmic reticulum stress existed in the liver of severe fatty liver cows. J. Dairy Sci. 2019, 102, 7359–7370. [Google Scholar] [CrossRef] [PubMed]
  55. Welihinda, A.A.; Tirasophon, W.; Kaufman, R.J. The cellular response to protein misfolding in the endoplasmic reticulum. Gene Expr. 1999, 7, 293–300. [Google Scholar] [PubMed]
  56. Zhang, K.; Kaufman, R.J. Signaling the Unfolded Protein Response from the Endoplasmic Reticulum. J. Biol. Chem. 2004, 279, 25935–25938. [Google Scholar] [CrossRef] [PubMed] [Green Version]
  57. Smith, M.H.; Ploegh, H.L.; Weissman, J.S. Road to Ruin: Targeting Proteins for Degradation in the Endoplasmic Reticulum. Science 2011, 334, 1086–1090. [Google Scholar] [CrossRef] [Green Version]
  58. Oost, L.J.; Kustermann, M.; Armani, A.; Blaauw, B.; Romanello, V. Fibroblast growth factor 21 controls mitophagy and muscle mass. J. Cachexia Sarcopenia Muscle 2019, 10, 630–642. [Google Scholar] [CrossRef] [Green Version]
  59. Niture, S.K.; Kaspar, J.W.; Shen, J.; Jaiswal, A.K. Nrf2 signaling and cell survival. Toxicol. Appl. Pharmacol. 2010, 244, 37–42. [Google Scholar] [CrossRef] [Green Version]
  60. Cullinan, S.B.; Zhang, D.; Hannink, M.; Arvisais, E.; Kaufman, R.J.; Diehl, J.A. Nrf2 Is a Direct PERK Substrate and Effector of PERK-Dependent Cell Survival. Mol. Cell. Biol. 2003, 23, 7198–7209. [Google Scholar] [CrossRef] [Green Version]
  61. Cullinan, S.B.; Diehl, J.A. Coordination of ER and oxidative stress signaling: The PERK/Nrf2 signaling pathway. Int. J. Biochem. Cell Biol. 2006, 38, 317–332. [Google Scholar] [CrossRef]
  62. Kim, O.-K.; Jun, W.; Lee, J. Mechanism of ER Stress and Inflammation for Hepatic Insulin Resistance in Obesity. Ann. Nutr. Metab. 2015, 67, 218–227. [Google Scholar] [CrossRef]
  63. Ceciliani, F.; Ceron, J.J.; Eckersall, P.D.; Sauerwein, H. Acute phase proteins in ruminants. J. Proteom. 2012, 75, 4207–4231. [Google Scholar] [CrossRef] [PubMed]
  64. Powell, W.S.; Rokach, J. Biosynthesis, biological effects, and receptors of hydroxyeicosatetraenoic acids (HETEs) and oxoeicosatetraenoic acids (oxo-ETEs) derived from arachidonic acid. Biochim. Biophys. Acta 2015, 1851, 340–355. [Google Scholar] [CrossRef] [PubMed] [Green Version]
  65. Yu, Y.; He, J.; Li, S.; Song, L.; Guo, X.; Yao, W.; Zou, D.; Gao, X.; Liu, Y.; Bai, F.; et al. Fibroblast growth factor 21 (FGF21) inhibits macrophage-mediated inflammation by activating Nrf2 and suppressing the NF-κB signaling pathway. Int. Immunopharmacol. 2016, 38, 144–152. [Google Scholar] [CrossRef] [PubMed]
  66. Zhang, S.; Yu, D.; Wang, M.; Huang, T.; Wu, H.; Zhang, Y.; Zhang, T.; Wang, W.; Yin, J.; Ren, G.; et al. FGF21 attenuates pulmonary fibrogenesis through ameliorating oxidative stress in vivo and in vitro. Biomed. Pharmacother. 2018, 103, 1516–1525. [Google Scholar] [CrossRef] [PubMed]
  67. Jia, H.; Cheng, J.; Zhou, Q.; Peng, J.; Pan, Y.; Han, H. Fibroblast growth factor 21 attenuates inflammation and oxidative stress in atherosclerotic rat via enhancing the Nrf1-ARE signaling pathway. Int. J. Clin. Exp. Pathol. 2018, 11, 1308–1317. [Google Scholar]
  68. Feingold, K.R.; Grunfeld, C.; Heuer, J.G.; Gupta, A.; Cramer, M.; Zhang, T.; Shigenaga, J.K.; Patzek, S.M.; Chan, Z.W.; Moser, A.; et al. FGF21 Is Increased by Inflammatory Stimuli and Protects Leptin-Deficient ob/ob Mice from the Toxicity of Sepsis. Endocrinology 2012, 153, 2689–2700. [Google Scholar] [CrossRef]
  69. Mavangira, V.; Sordillo, L.M. Role of lipid mediators in the regulation of oxidative stress and inflammatory responses in dairy cattle. Res. Vet. Sci 2018, 116, 4–14. [Google Scholar] [CrossRef]
Figure 1. Hepatic FGF21 expression levels in groups of cows with low versus high hepatic FGF21 expression at week 2 antepartum, week 1 postpartum, week 4 postpartum, and week 7 postpartum, as analyzed by qPCR (n = 8/group). * An asterisk indicates a significant difference between groups. Means without the same uppercase letters (A, B) are significantly different within the low FGF21 group; means without the same lower case letters (a, b, c) are significantly different within the high FGF21 group.
Animals 13 00131 g001
Figure 2. Volcano plot showing hepatic transcripts that were differentially regulated between cows with high and low hepatic FGF21 expression at week 1 postpartum. The double filtering criteria are indicated by horizontal (p-value < 0.05) and vertical [FC: > log2(1.2) or < log2(−1.2)] dashed lines. Transcripts in the upper left and upper right corners represent the downregulated and upregulated transcripts, respectively. The top 10 up- and downregulated transcripts with log2(FC) and p-value are shown in the two tables within the figure.
Animals 13 00131 g002
Figure 3. Enriched gene ontology (GO) biological process (a,b) and KEGG pathways (c,d) terms assigned to the differentially regulated transcripts between cows with high and low hepatic FGF21 expression at week 1 postpartum. GO terms and KEGG pathways are sorted by their enrichment p-values (EASE score) (top: lowest p-value, bottom: highest p-value). The number of genes is shown next to the bars.
Animals 13 00131 g003aAnimals 13 00131 g003b
Figure 4. Concentrations of plasma metabolites that were identified by targeted metabolomics analysis to be different between cows with high and low hepatic FGF21 expression at week 1 postpartum. Bars represent means ± SD, n = 8 for each group. Abbreviations: a, acyl residue; aa, acyl-acyl residue; C4–7a, 7-alpha-hydroxy-cholestenone; C5:1-DC; glutaconylcarnitine; C14:1, tetradecenoylcarnitine; C14:2-OH, hydroxytetradecadienylcarnitine; Lyso PC, lysophosphatidylcholine; PC, phosphatidylcholine; SM, sphingomyelin. * An asterisk indicates a significant difference between the two groups (p < 0.05).
Animals 13 00131 g004
Table 1. Body weights, feed intake, energy balance, and milk performance of cows with high and low hepatic FGF21 expression at days 8–14 postpartum.
Low FGF21High FGF21p-Value
Body weight, kg615 ± 27648 ± 630.187
Dry matter intake, kg/d14.2 ± 4.514.9 ± 1.70.779
Net energy intake, MJ/d99.7 ± 31.3104.4 ± 13.50.790
Energy balance, MJ NEL/d−62.1 ± 18.1−75.6 ± 31.40.484
Milk yield, kg/d37.5 ± 3.636.3 ± 5.30.613
ECM, kg/d40.2 ± 5.742.7 ± 8.60.549
ECM = energy-corrected milk, adjusted to 40 g fat/kg and 34 g protein/kg; data represent means ± SD, n  =  8 for each group.
Table 2. Plasma and liver concentrations of metabolic parameters in cows with high and low hepatic FGF21 expression in week 1 postpartum.
Low FGF21High FGF21p-Value
Plasma
NEFA, µmol/L577 ± 245507 ± 3050.623
BHBA, mmol/L1.06 ± 0.4861.08 ± 0.531.000
TAG, µmol/L111 ± 21.998.6 ± 16.30.238
Cholesterol, µmol/L2.58 ± 1.052.17 ± 0.480.462
Liver
TAG, µmol/g27.4 ± 18.335.7 ± 17.20.363
Cholesterol, µmol/g3.25 ± 0.702.98 ± 0.490.406
NEFA = Non-esterified fatty acids; BHBA = β-hydroxybutyrate; TAG = triacylglycerol; data represent means ± SD, n = 8 for each group.
Table 3. Expression [fold change (FC)] of hepatic genes involved in β-oxidation and mitochondrial fatty acid uptake, gluconeogenesis, ketogenesis, and the tricarboxylic acid cycle in cows with high vs. low hepatic FGF21 expression at week 1 postpartum.
Gene SymbolGene DescriptionFCp-Value
β-oxidation and mitochondrial fatty acid uptake
ACAA1Acetyl-CoA acyltransferase 10.950.447
ACAA2Acetyl-CoA acyltransferase 2−1.130.006
ACADLAcyl-CoA dehydrogenase long chain0.970.640
ACADMAcyl-CoA dehydrogenase medium chain0.970.438
ACADSAcyl-CoA dehydrogenase short chain0.940.341
ACADSBAcyl-CoA dehydrogenase short/branched chain1.020.776
ACAA1Acetyl-CoA acyltransferase 10.950.447
ACADVLAcyl-CoA dehydrogenase very long chain0.990.910
ACOX1Acyl-CoA oxidase 10.970.623
CPT1ACarnitine palmitoyltransferase 1A0.880.103
CPT1BCarnitine palmitoyltransferase 1B1.090.629
ECH1Enoyl-CoA hydratase 11.070.310
ECHS1Enoyl-CoA hydratase, short chain 10.950.233
EHHADHEnoyl-CoA hydratase and 3-hydroxyacyl CoA dehydrogenase−1.100.029
HADHHydroxyacyl-CoA dehydrogenase−1.190.007
HADHAHydroxyacyl-CoA dehydrogenase trifunctional multienzyme complex subunit alpha0.970.751
HADHBHydroxyacyl-CoA dehydrogenase trifunctional multienzyme complex subunit beta0.970.712
HSD17B4Hydroxysteroid 17-beta dehydrogenase 4−1.110.007
SLC25A20Solute carrier family 25 member 20 (Previous name: carnitine/acylcarnitine translocase)1.060.518
Gluconeogenesis
ALDOAAldolase, fructose-bisphosphate A0.940.172
ALDOBAldolase, fructose-bisphosphate B−1.110.024
ALDOCAldolase, fructose-bisphosphate C0.880.163
BPGMBisphosphoglycerate mutase0.970.370
ENO1Enolase 10.940.326
ENO2Enolase 2−1.220.022
ENO3Enolase 31.040.657
ENO4Enolase 41.160.018
FBP1Fructose-bisphosphatase 1−1.320.001
FBP2Fructose-bisphosphatase 21.300.402
GAPDHGlyceraldehyde-3-phosphate dehydrogenase0.980.678
PCK1Phosphoenolpyruvate carboxykinase 11.000.986
PCK2Phosphoenolpyruvate carboxykinase 21.010.944
PGAM1Phosphoglycerate mutase 10.900.168
PGAM2Phosphoglycerate mutase 10.950.461
PGK1Phosphoglycerate kinase 11.010.948
PGK2Phosphoglycerate kinase 21.070.189
TPI1Triosephosphate isomerase 10.930.258
Ketogenesis
ACAT1Acetyl-CoA acetyltransferase 10.900.058
ACAT2Acetyl-CoA acetyltransferase 21.000.983
BDH13-Hydroxybutyrate dehydrogenase 10.910.369
BDH23-Hydroxybutyrate dehydrogenase 21.130.362
HMGCL3-Hydroxy-3-methylglutaryl-CoA lyase0.980.632
HMGCLL13-Hydroxymethyl-3-methylglutaryl-CoA lyase like 10.990.902
HMGCS13-Hydroxy-3-methylglutaryl-CoA synthase 11.210.248
HMGCS23-Hydroxy-3-methylglutaryl-CoA synthase 20.930.447
Tricarboxylic acid cycle
ACO1Aconitase 11.020.558
ACO2Aconitase 20.940.266
CSCitrate synthase1.340.004
DLDDihydrolipoamide dehydrogenase0.950.282
DLSTDihydrolipoamide S-succinyltransferase0.920.185
FHFumarate hydratase0.970.695
IDH1Isocitrate dehydrogenase (NADP(+)) 10.990.835
IDH2Isocitrate dehydrogenase (NADP(+)) 21.170.111
IDH3Aisocitrate dehydrogenase (NAD(+)) 3 catalytic subunit alpha1.050.314
IDH3BIsocitrate dehydrogenase (NAD(+)) 3 non-catalytic subunit beta−1.110.027
IDH3GIsocitrate dehydrogenase (NAD(+)) 3 non-catalytic subunit gamma0.950.134
MDH1Malate dehydrogenase 10.940.465
MDH2Malate dehydrogenase 2−1.090.017
OGDHOxoglutarate dehydrogenase0.820.090
OGDHLOxoglutarate dehydrogenase L−1.120.038
SDHASuccinate dehydrogenase complex flavoprotein subunit A0.930.251
SDHBSuccinate dehydrogenase complex iron sulfur subunit B−1.100.036
SDHCSuccinate dehydrogenase complex subunit C0.880.172
SDHDSuccinate dehydrogenase complex subunit D0.900.076
SUCLG1Succinate-CoA ligase GDP/ADP-forming subunit alpha0.890.109
SUCLG2Succinate-CoA ligase GDP-forming subunit beta−1.120.005
n = 8 for each group.
Table 4. Expression [fold change (FC)] of hepatic genes involved in inflammation, endoplasmic reticulum (ER) stress/unfolded protein response (UPR), and nuclear factor erythroid 2-related factor 2 (Nrf2)-dependent cytoprotection in cows with high vs. low hepatic FGF21 expression at week 1 postpartum.
Gene SymbolGene DescriptionFCp-Value
Inflammation
CCL2C-C motif chemokine ligand 20.870.206
CPCeruloplasmin0.930.180
CRPC-reactive protein1.040.516
CXCL8C-X-C motif chemokine ligand 80.990.950
FYNFYN proto-oncogene, Src family tyrosine kinase1.240.002
HPHaptoglobin3.290.110
IFNGInterferon gamma1.090.326
IL1BInterleukin 1 beta1.270.055
IL6Interleukin 61.120.486
LITAFLipopolysaccharide induced TNF factor1.230.024
PTGS2Prostaglandin-endoperoxide synthase 21.090.425
SAA2Serum amyloid A21.330.069
SAA3Serum amyloid A3, pseudogene1.780.215
SAA4Serum amyloid A4, constitutive1.640.048
TNFTumor necrosis factor1.010.927
ER stress/UPR
ATF4Activating transcription factor 41.310.001
ATF6Activating transcription factor 61.010.861
BAK1BCL2 antagonist/killer 10.930.139
BAXBCL2 associated X, apoptosis regulator1.070.178
CASP3Caspase 30.980.741
CASP8Caspase 81.000.965
CASP9Caspase 91.010.865
CHAC1ChaC glutathione specific gamma-glutamylcyclotransferase 11.230.025
DDIT3DNA damage inducible transcript 31.190.013
DNAJC3DNAJ heat shock protein family (Hsp40) member C31.050.581
EDEM1ER degradation enhancing alpha-mannosidase like protein 11.020.675
HERPUD1Homocysteine inducible ER protein with ubiquitin like domain 11.320.044
HSP90B1Heat shock protein 90 beta family member 11.140.372
HSPA5Heat shock protein family A (Hsp70) member 51.530.050
PDIA4Protein disulfide isomerase family A member 41.180.294
PPP1R15AProtein phosphatase 1 regulatory subunit 15A0.950.459
TRIB3Tribbles pseudokinase 31.240.034
XBP1X-box binding protein 11.210.112
Nrf2-dependent cytoprotection
CATCatalase −1.070.019
GCLCGlutamate-cysteine ligase catalytic subunit0.950.677
GCLMGlutamate-cysteine ligase modifier subunit0.920.281
GPX1Glutathione peroxidase 10.980.858
GPX3Glutathione peroxidase 32.900.046
GSTA2Glutathione S-transferase alpha 2 −1.360.040
HMOX1Heme oxygenase 11.090.325
MT1AMetallothionein 1A2.640.016
MT2AMetallothionein 2A1.890.045
MT1EMetallothionein 1E3.580.022
MT3Metallothionein 30.980.608
MT4Metallothionein 4 −1.110.031
NFE2L2Nuclear factor, erythroid 2 like 21.040.420
NQO1NAD(P)H quinone dehydrogenase 10.920.354
SOD1Superoxide dismutase 10.980.634
SRXN1Sulfiredoxin 11.080.295
TXNThioredoxin0.920.221
TXNRD1Thioredoxin reductase 11.010.866
UGT1A1UDP glucuronosyltransferase family 1 member A10.910.061
UGT1A6UDP glucuronosyltransferase family 1 member A61.240.452
n = 8 for each group.
Table 5. Plasma concentrations of parameters indicative of antioxidant status in cows with high and low hepatic FGF21 expression at week 1 postpartum.
Low FGF21High FGF21p-Value
Plasma
α-tocopherol, µmol/L6.12 ± 1.425.69 ± 1.960.619
γ-tocopherol, µmol/L0.126 ± 0.0570.102 ± 0.0410.357
β-carotene, µmol/L12.8 ± 3.8312.8 ± 4.220.992
GSH, µmol/L3.51 ± 4.234.23 ± 0.720.075
TEAC, mmol/L3.54 ± 0.533.72 ± 0.410.458
TBARS, µmol/L0.814 ± 0.1590.781 ± 0.1440.670
Protein carbonyls, µmol/L0.326 ± 0.0700.265 ± 0.0530.093
GSH = glutathione; TEAC = trolox equivalent antioxidant capacity; TBARS = thiobarbituric acid-reactive substances; data are means ± SD, n  =  8 for each group.
Table 6. Concentrations of positive and negative acute phase proteins and oxylipids in plasma of cows with high and low hepatic FGF21 expression at week 1 postpartum.
Low FGF21High FGF21p-Value
Positive acute phase proteins
HP, µg/mL1489 ± 1723367 ± 4110.338
SAA, ng/mL294 ± 63372 ± 680.038
Negative acute phase proteins
Albumin, g/dL2.96 ± 0.372.90 ± 0.360.836
RBP4, ng/mL1465 ± 4391519 ± 4630.820
Oxylipids, nmol/L
9-HODE22.5 ± 7.1523.5 ± 3.420.727
13-HODE21.4 ± 5.1820.1 ± 3.040.568
12-HETE6.56 ± 2.626.05 ± 1.590.875
15-HETE1.53 ± 0.551.49 ± 0.340.864
LTB41.74 ± 0.672.02 ± 0.970.504
PGF2α0.313 ± 0.2010.350 ± 0.3920.869
HETE = hydroxyeicosatetraenoic acid; HODE = hydroxy-octadecadienoic acid; HP = haptoglobin =; LTB4 = leukotriene B4; PGF2α = prostaglandin F2α; RBP4 = retinol-binding protein 4; SAA = serum amyloid A; data represent means ± SD, n = 8 for each group.
Disclaimer/Publisher’s Note: The statements, opinions and data contained in all publications are solely those of the individual author(s) and contributor(s) and not of MDPI and/or the editor(s). MDPI and/or the editor(s) disclaim responsibility for any injury to people or property resulting from any ideas, methods, instructions or products referred to in the content.

