The Effects of Water Level Fluctuation on Zooplankton Communities in Shahu Lake Based on DNA Metabarcoding and Morphological Methods

Abstract
:Simple Summary
Abstract
1. Introduction
2. Materials and Methods
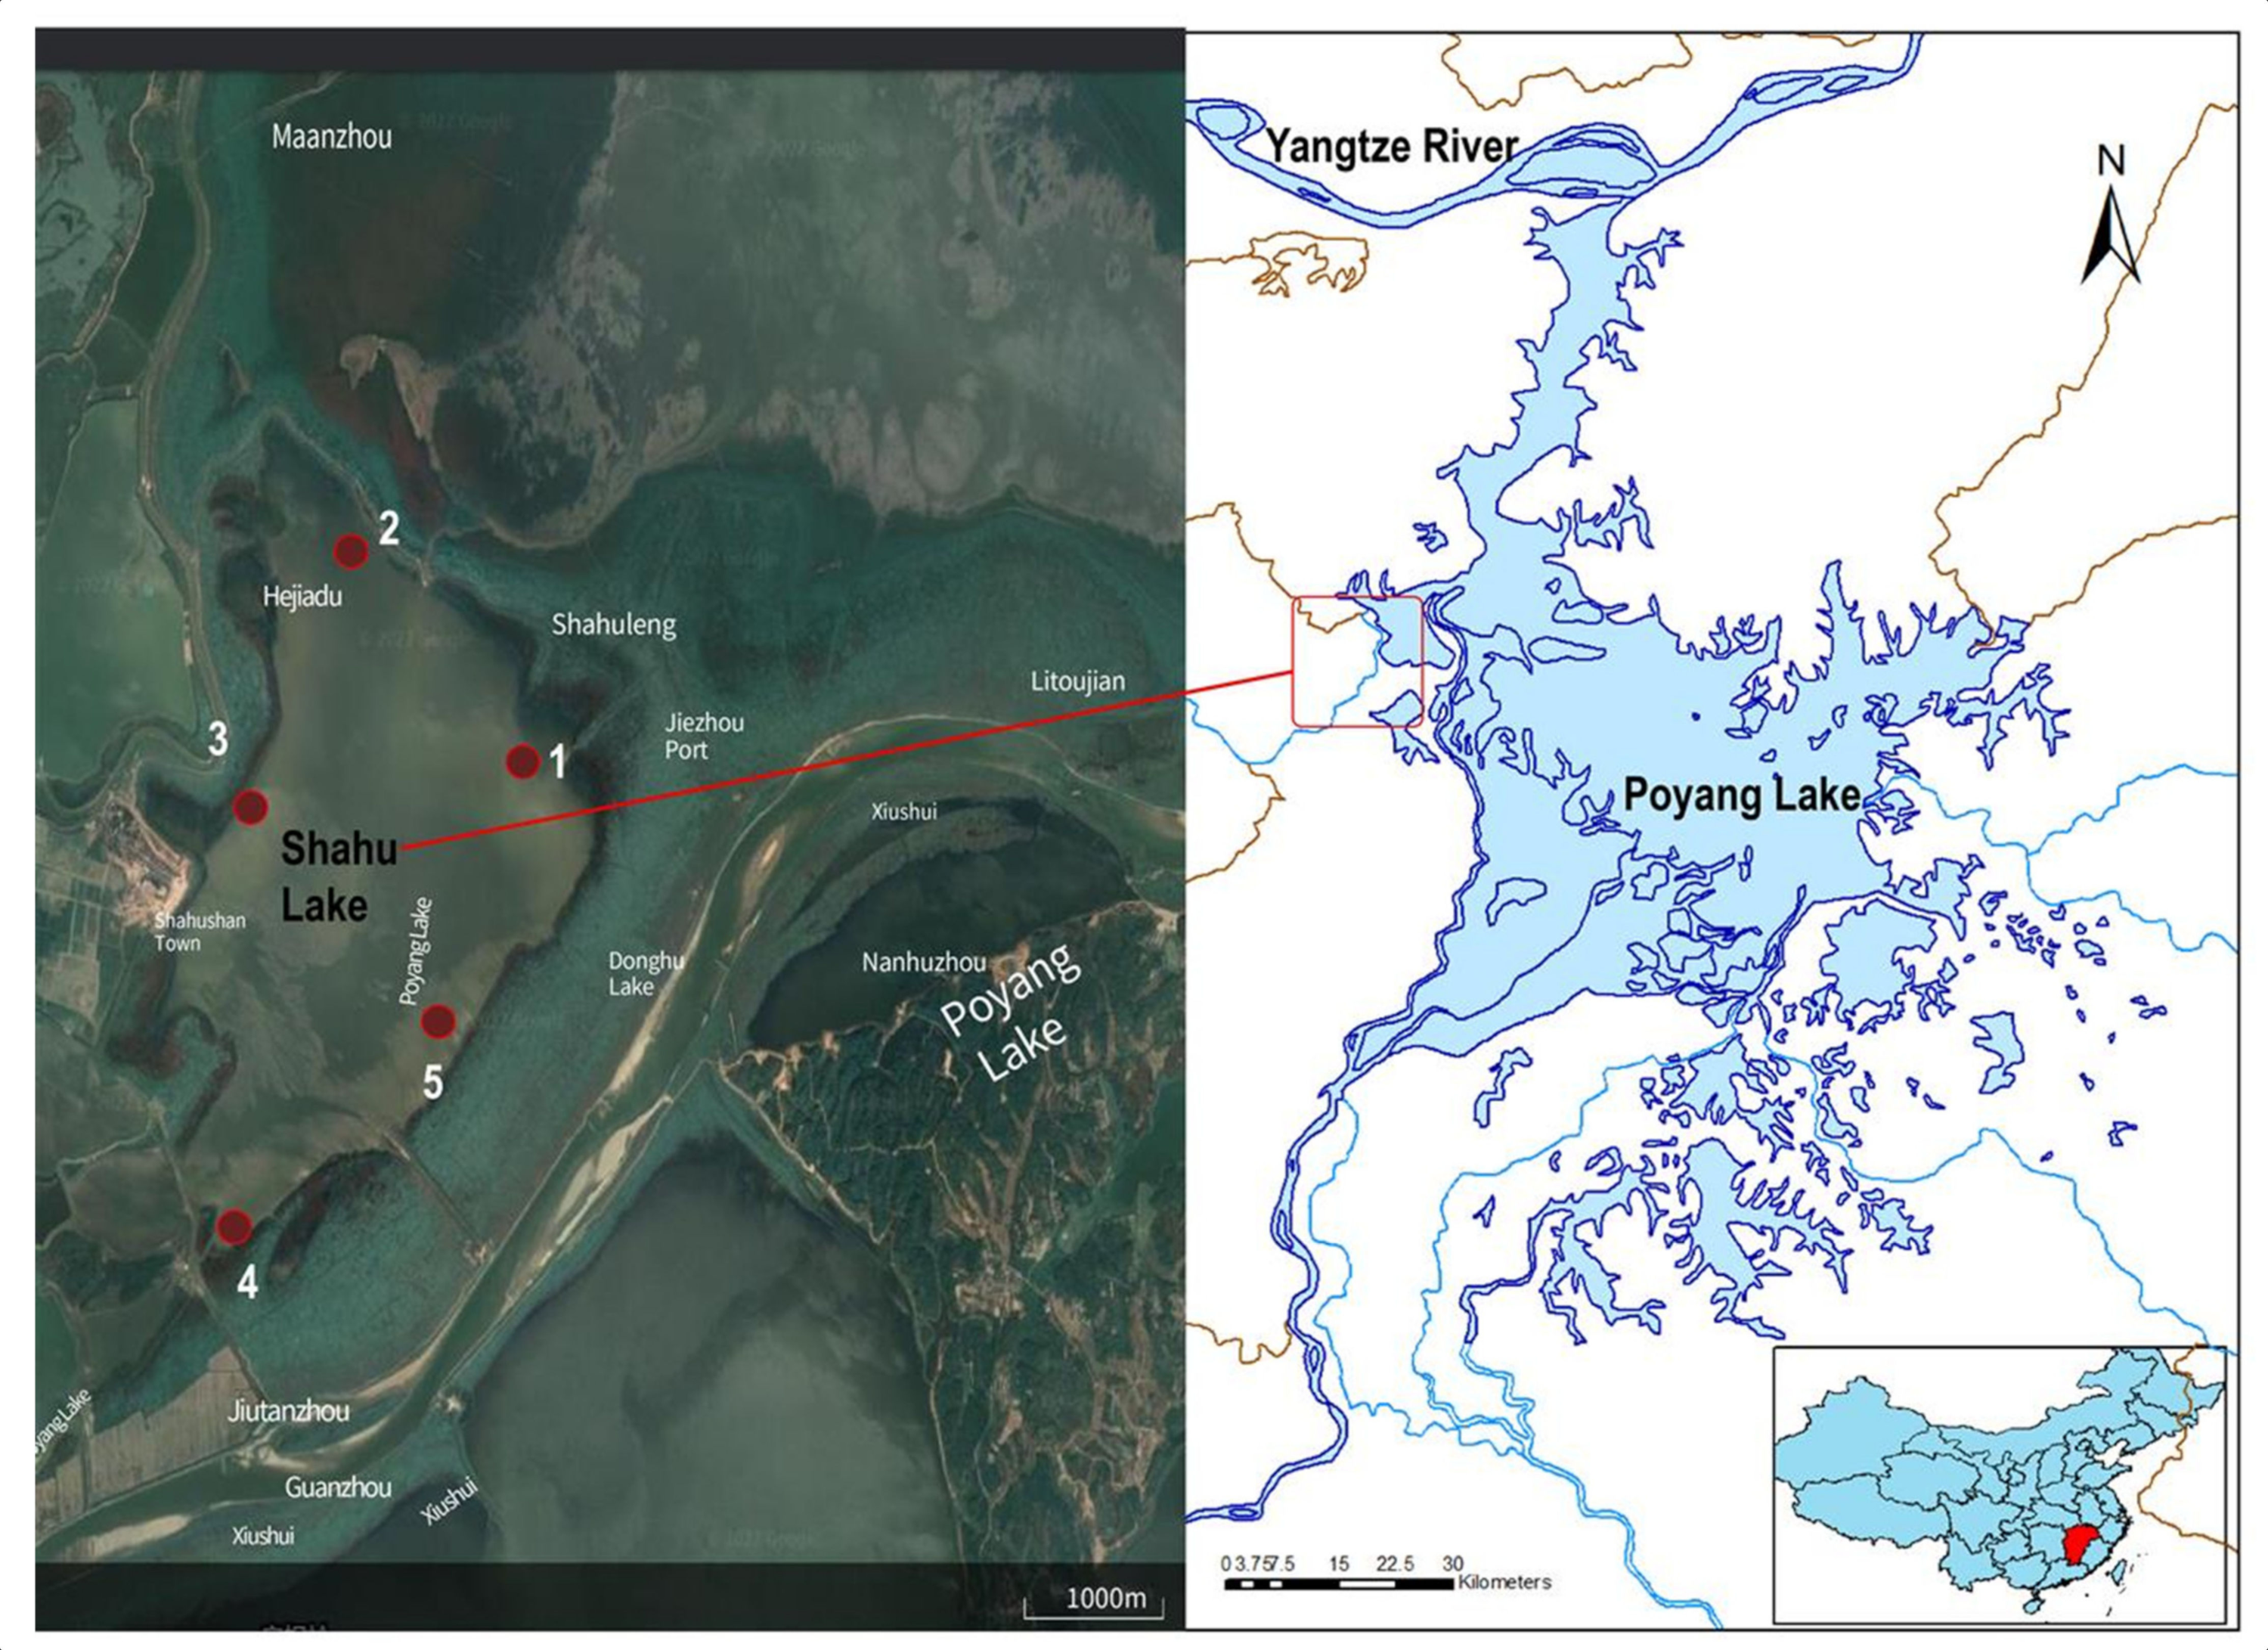
2.1. Sample Collection
2.2. Physiochemical Analysis of the Water
2.3. Morphological and Molecular Research Methods
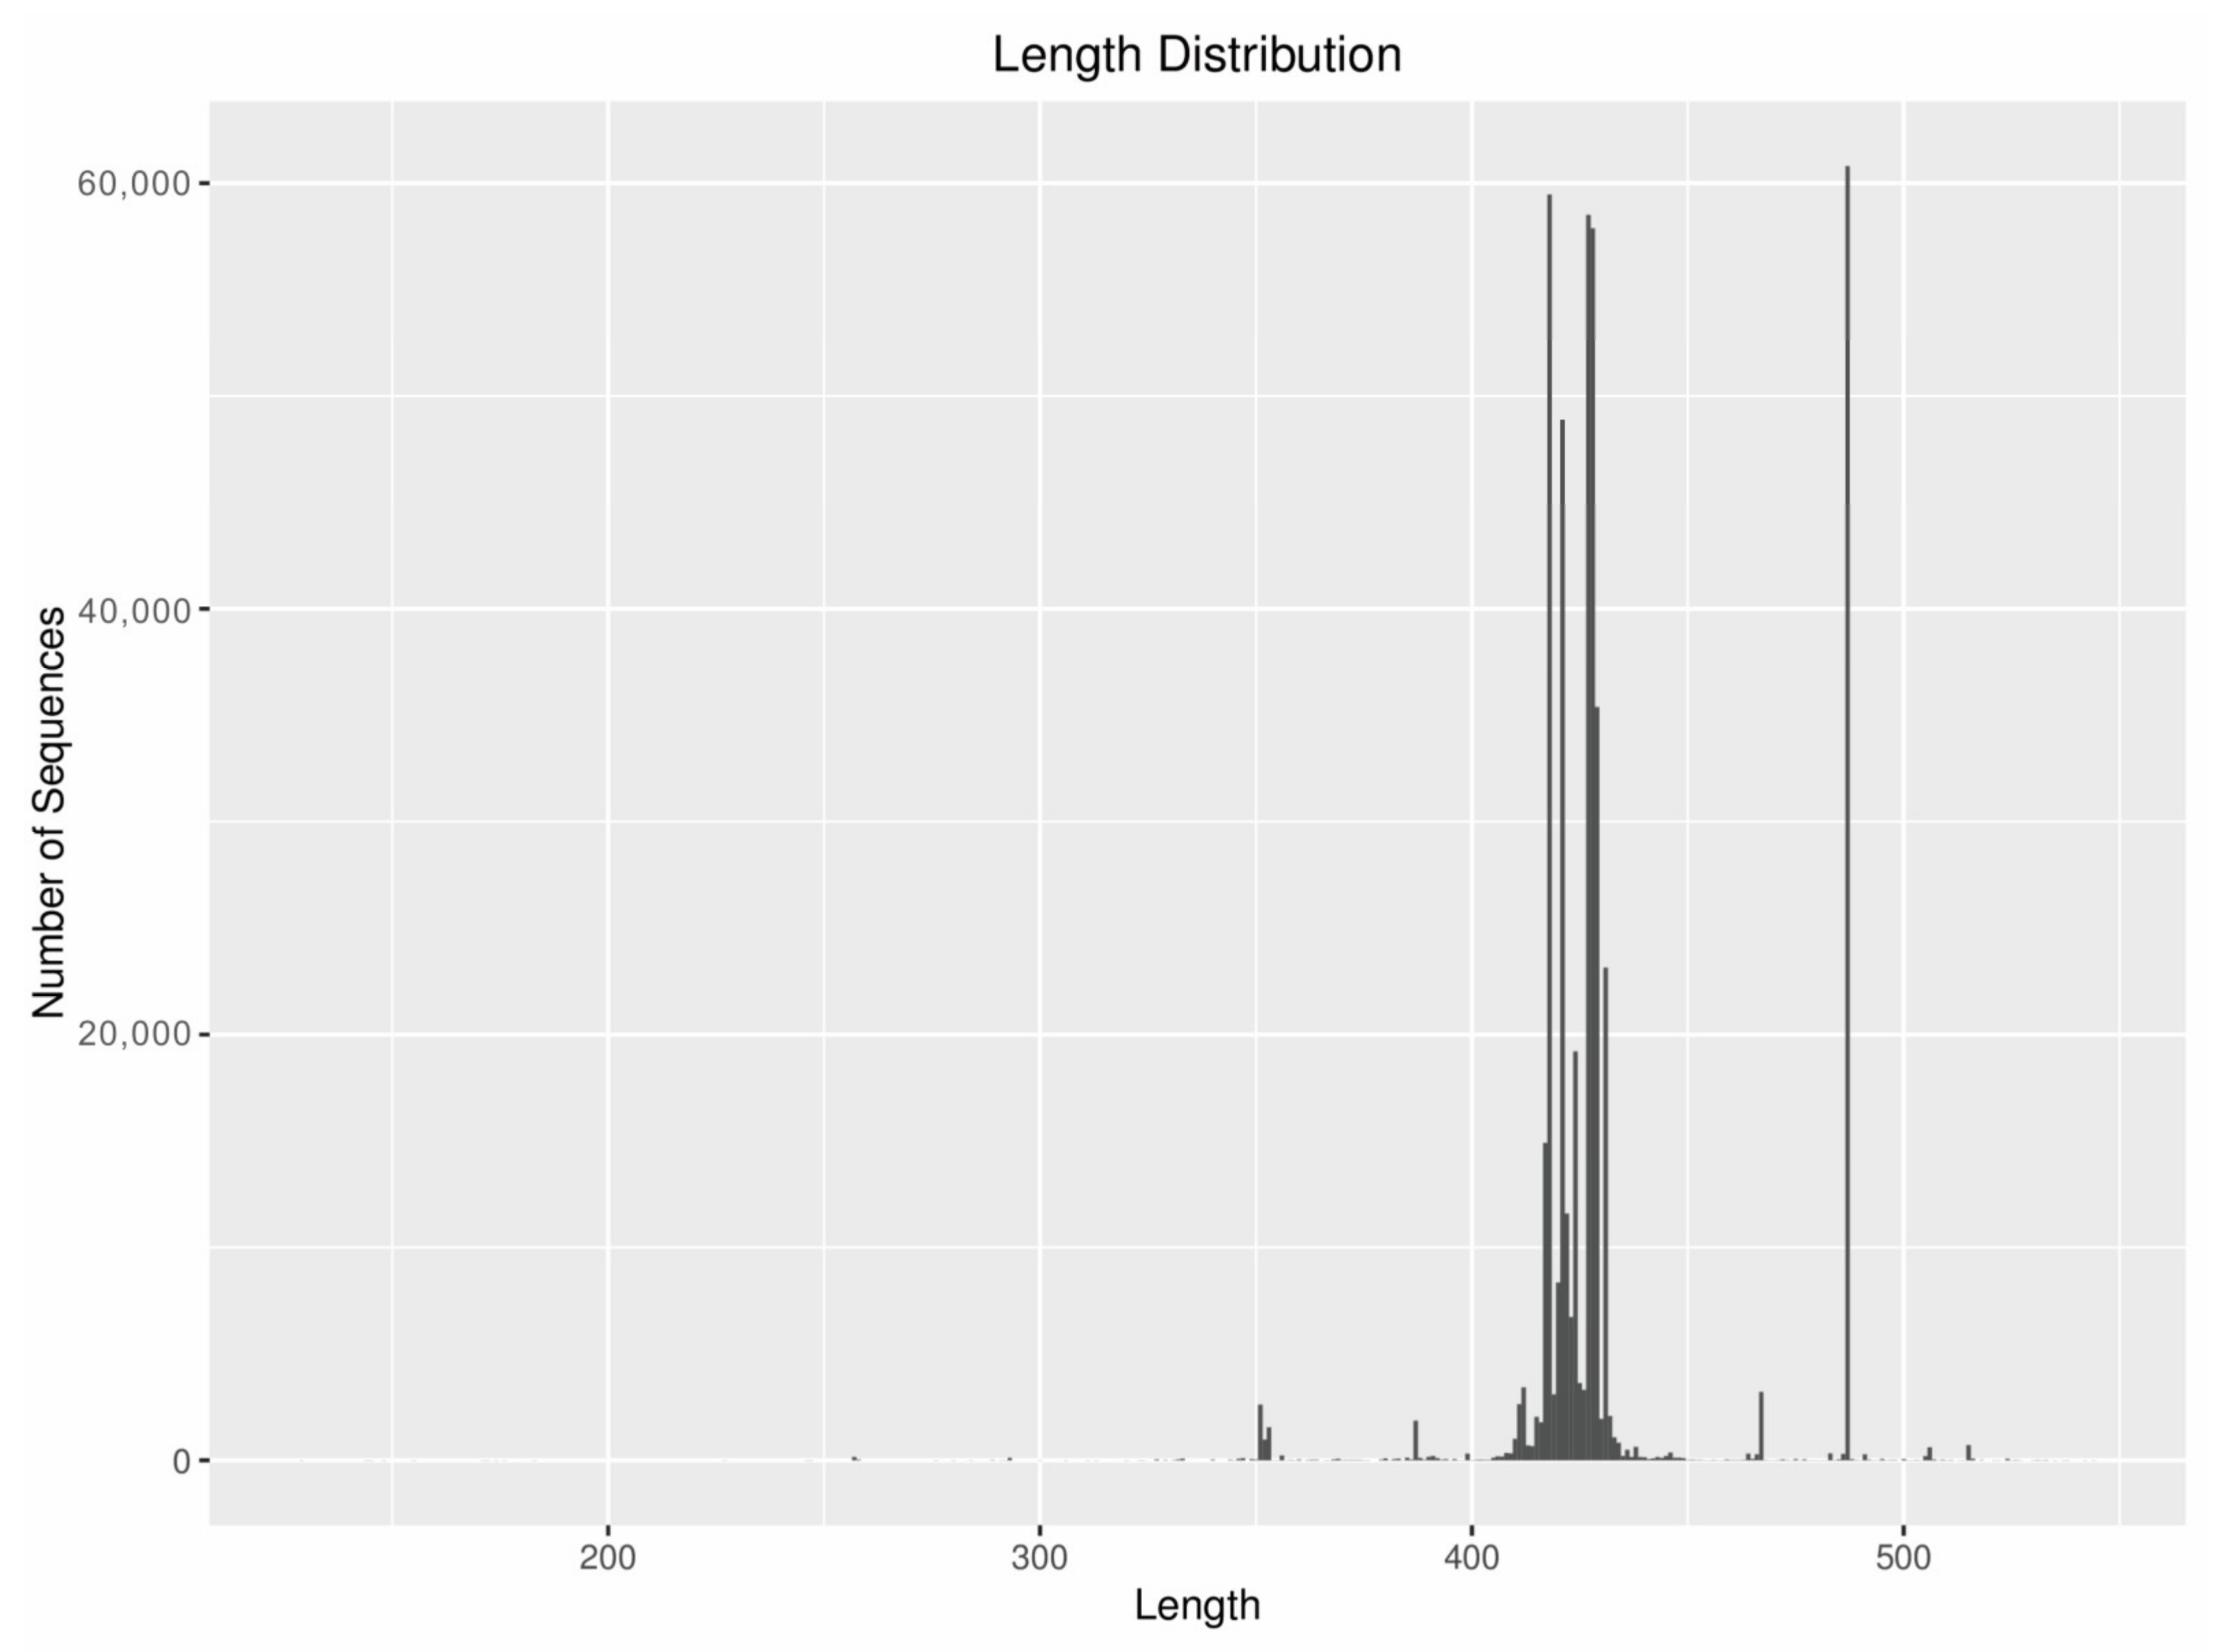
2.4. High-Throughput Sequencing and Bioinformatics
2.5. Analytical Method
3. Results
3.1. Sequence Classification Composition and Richness
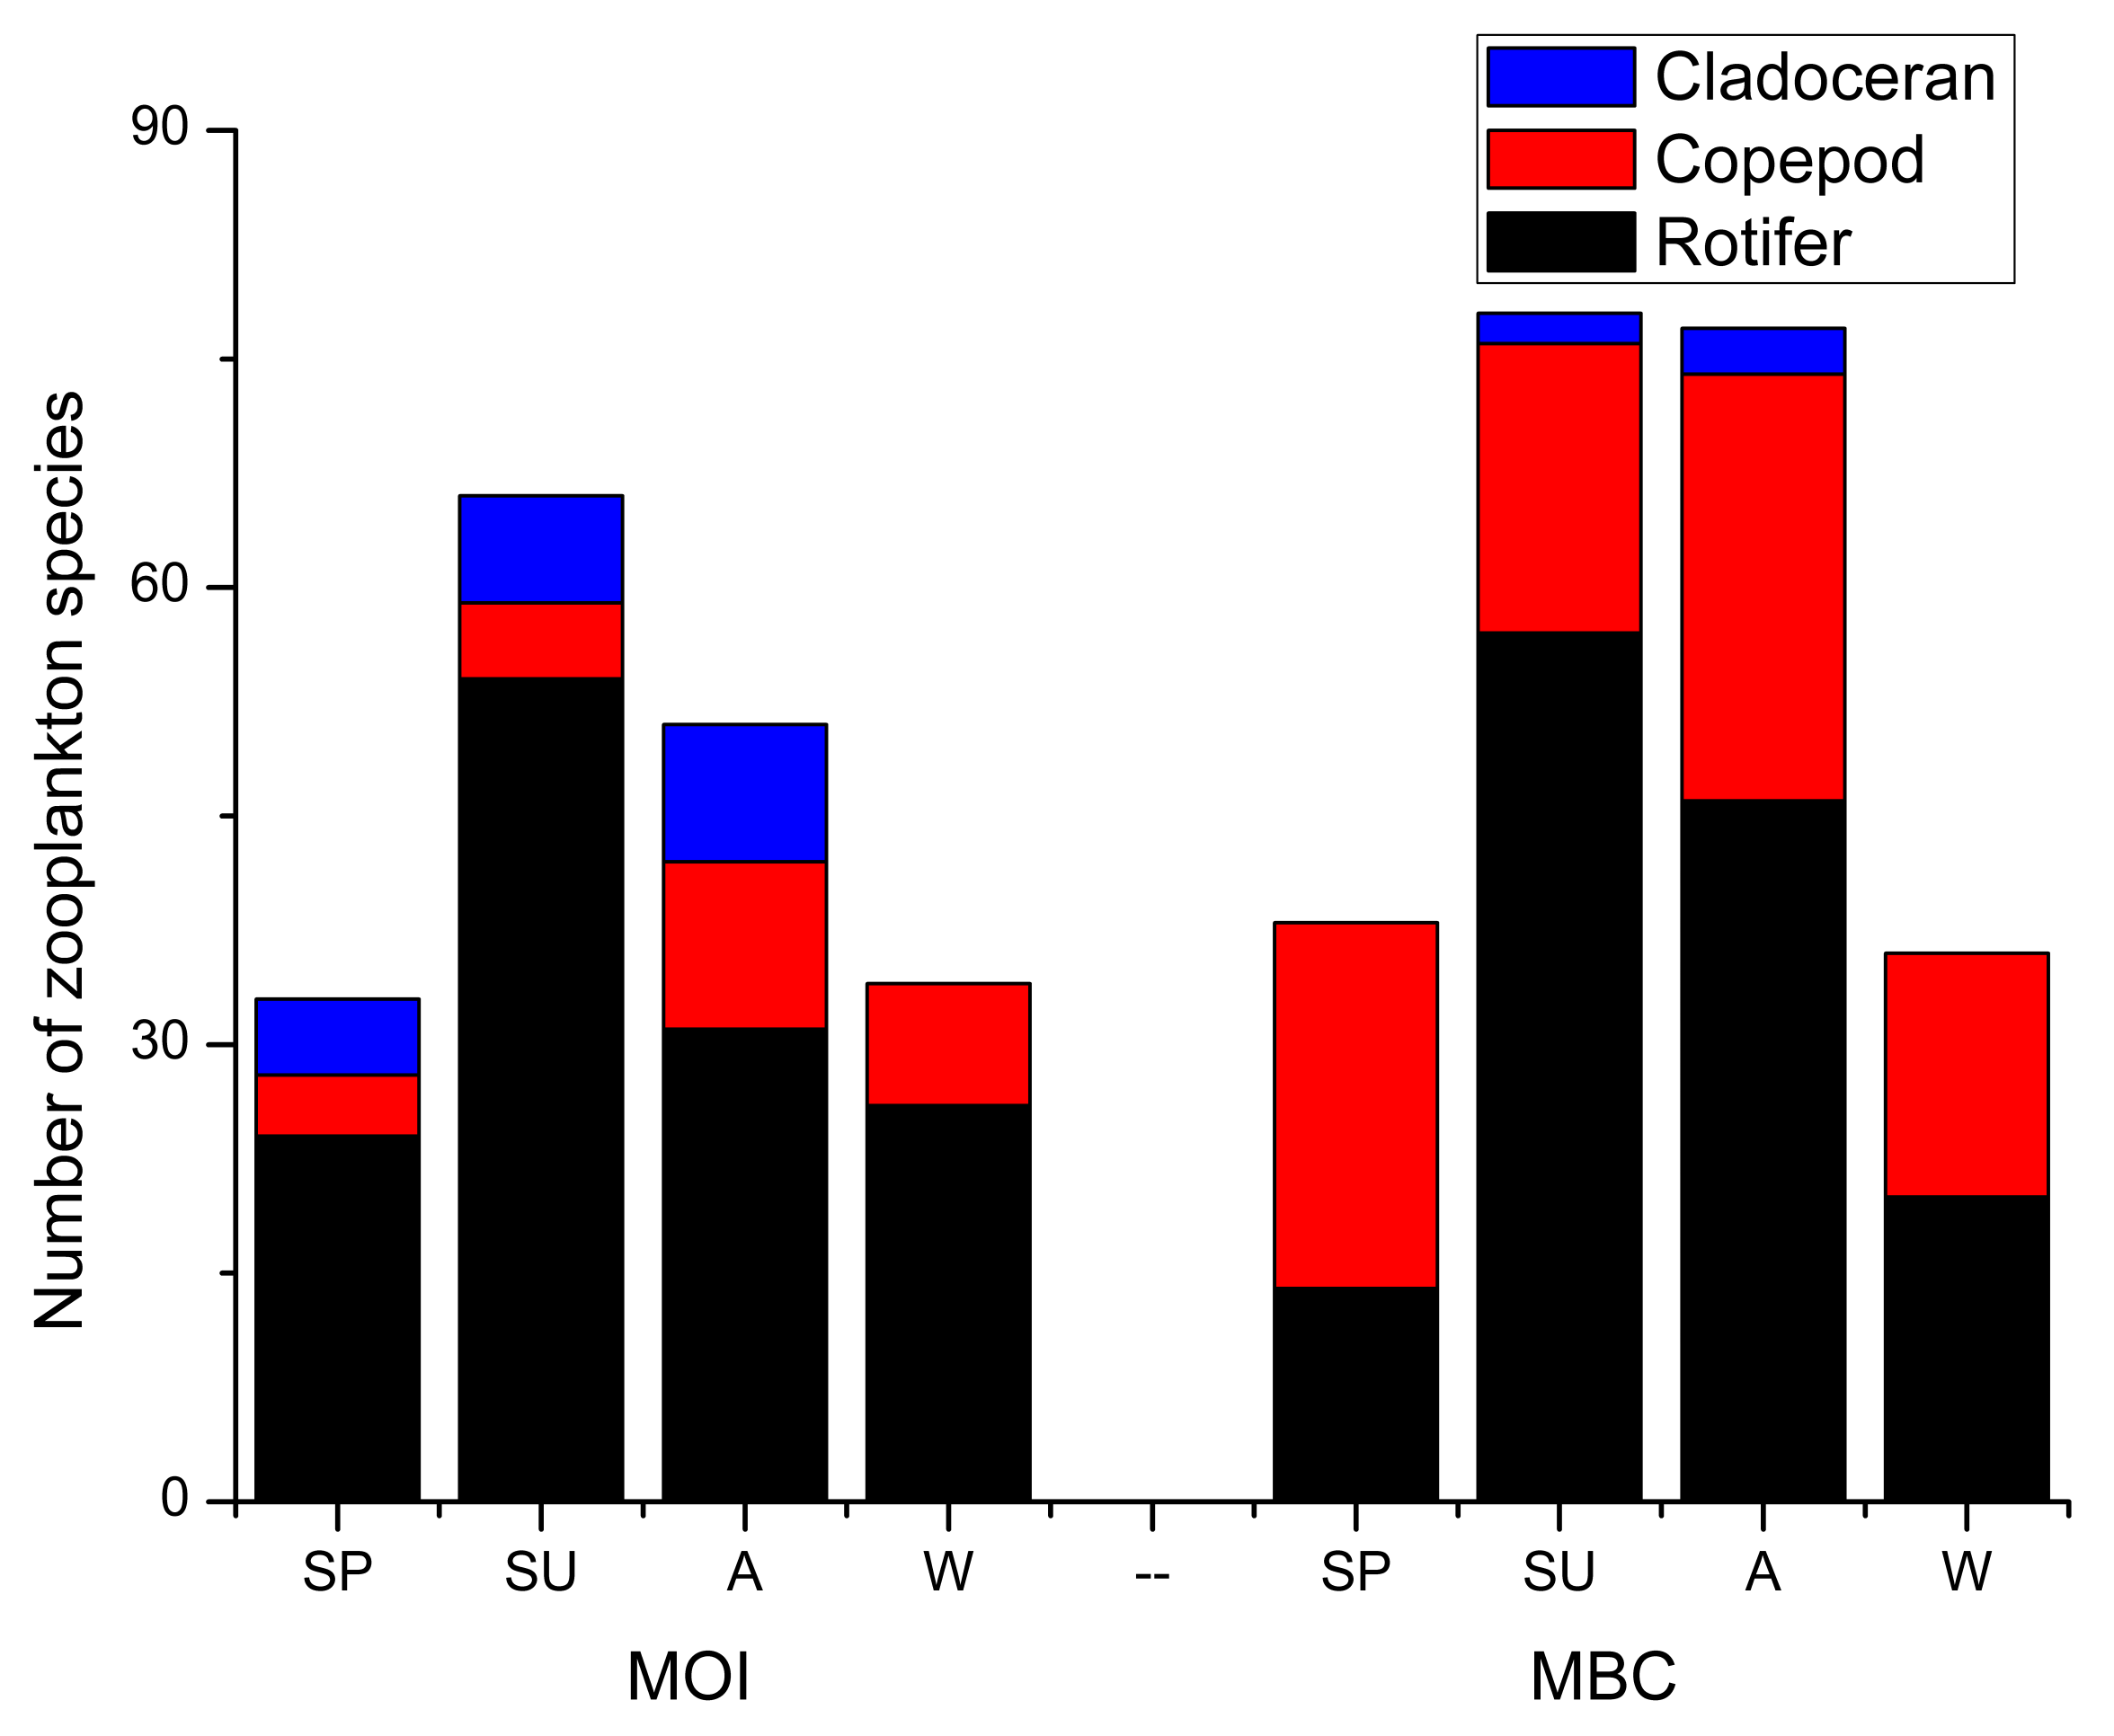
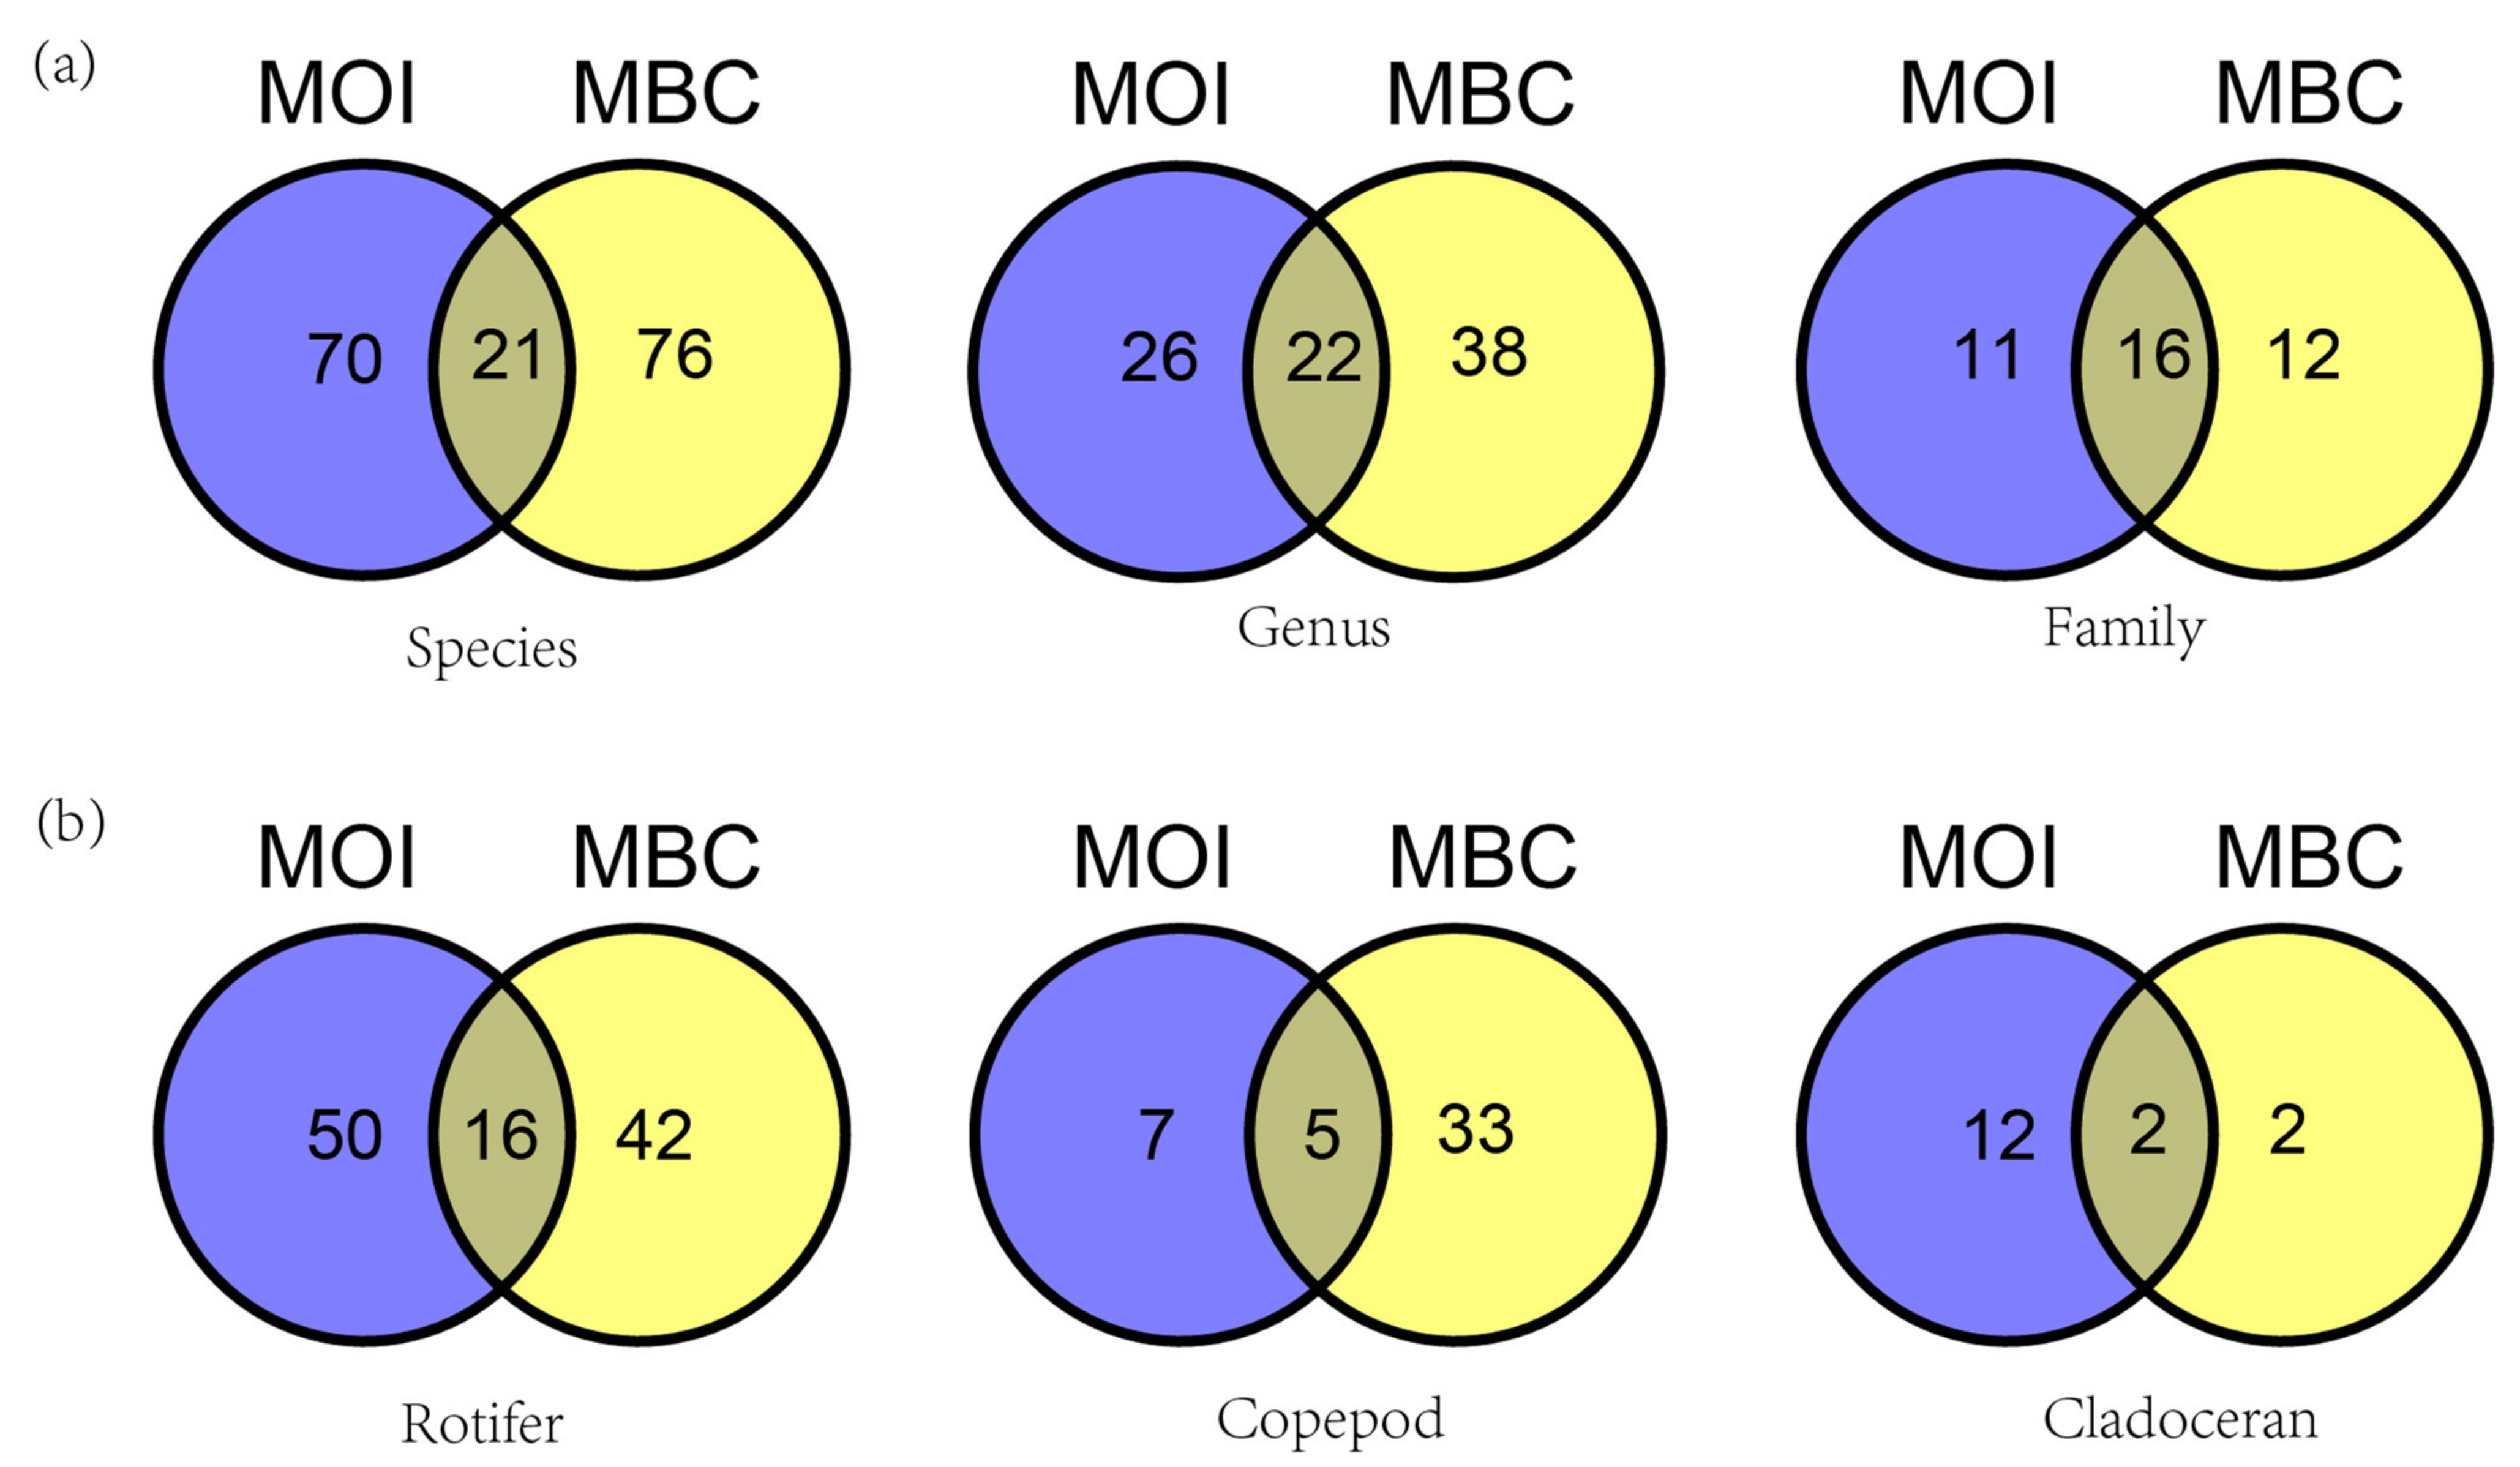
3.2. Taxon and Species Composition
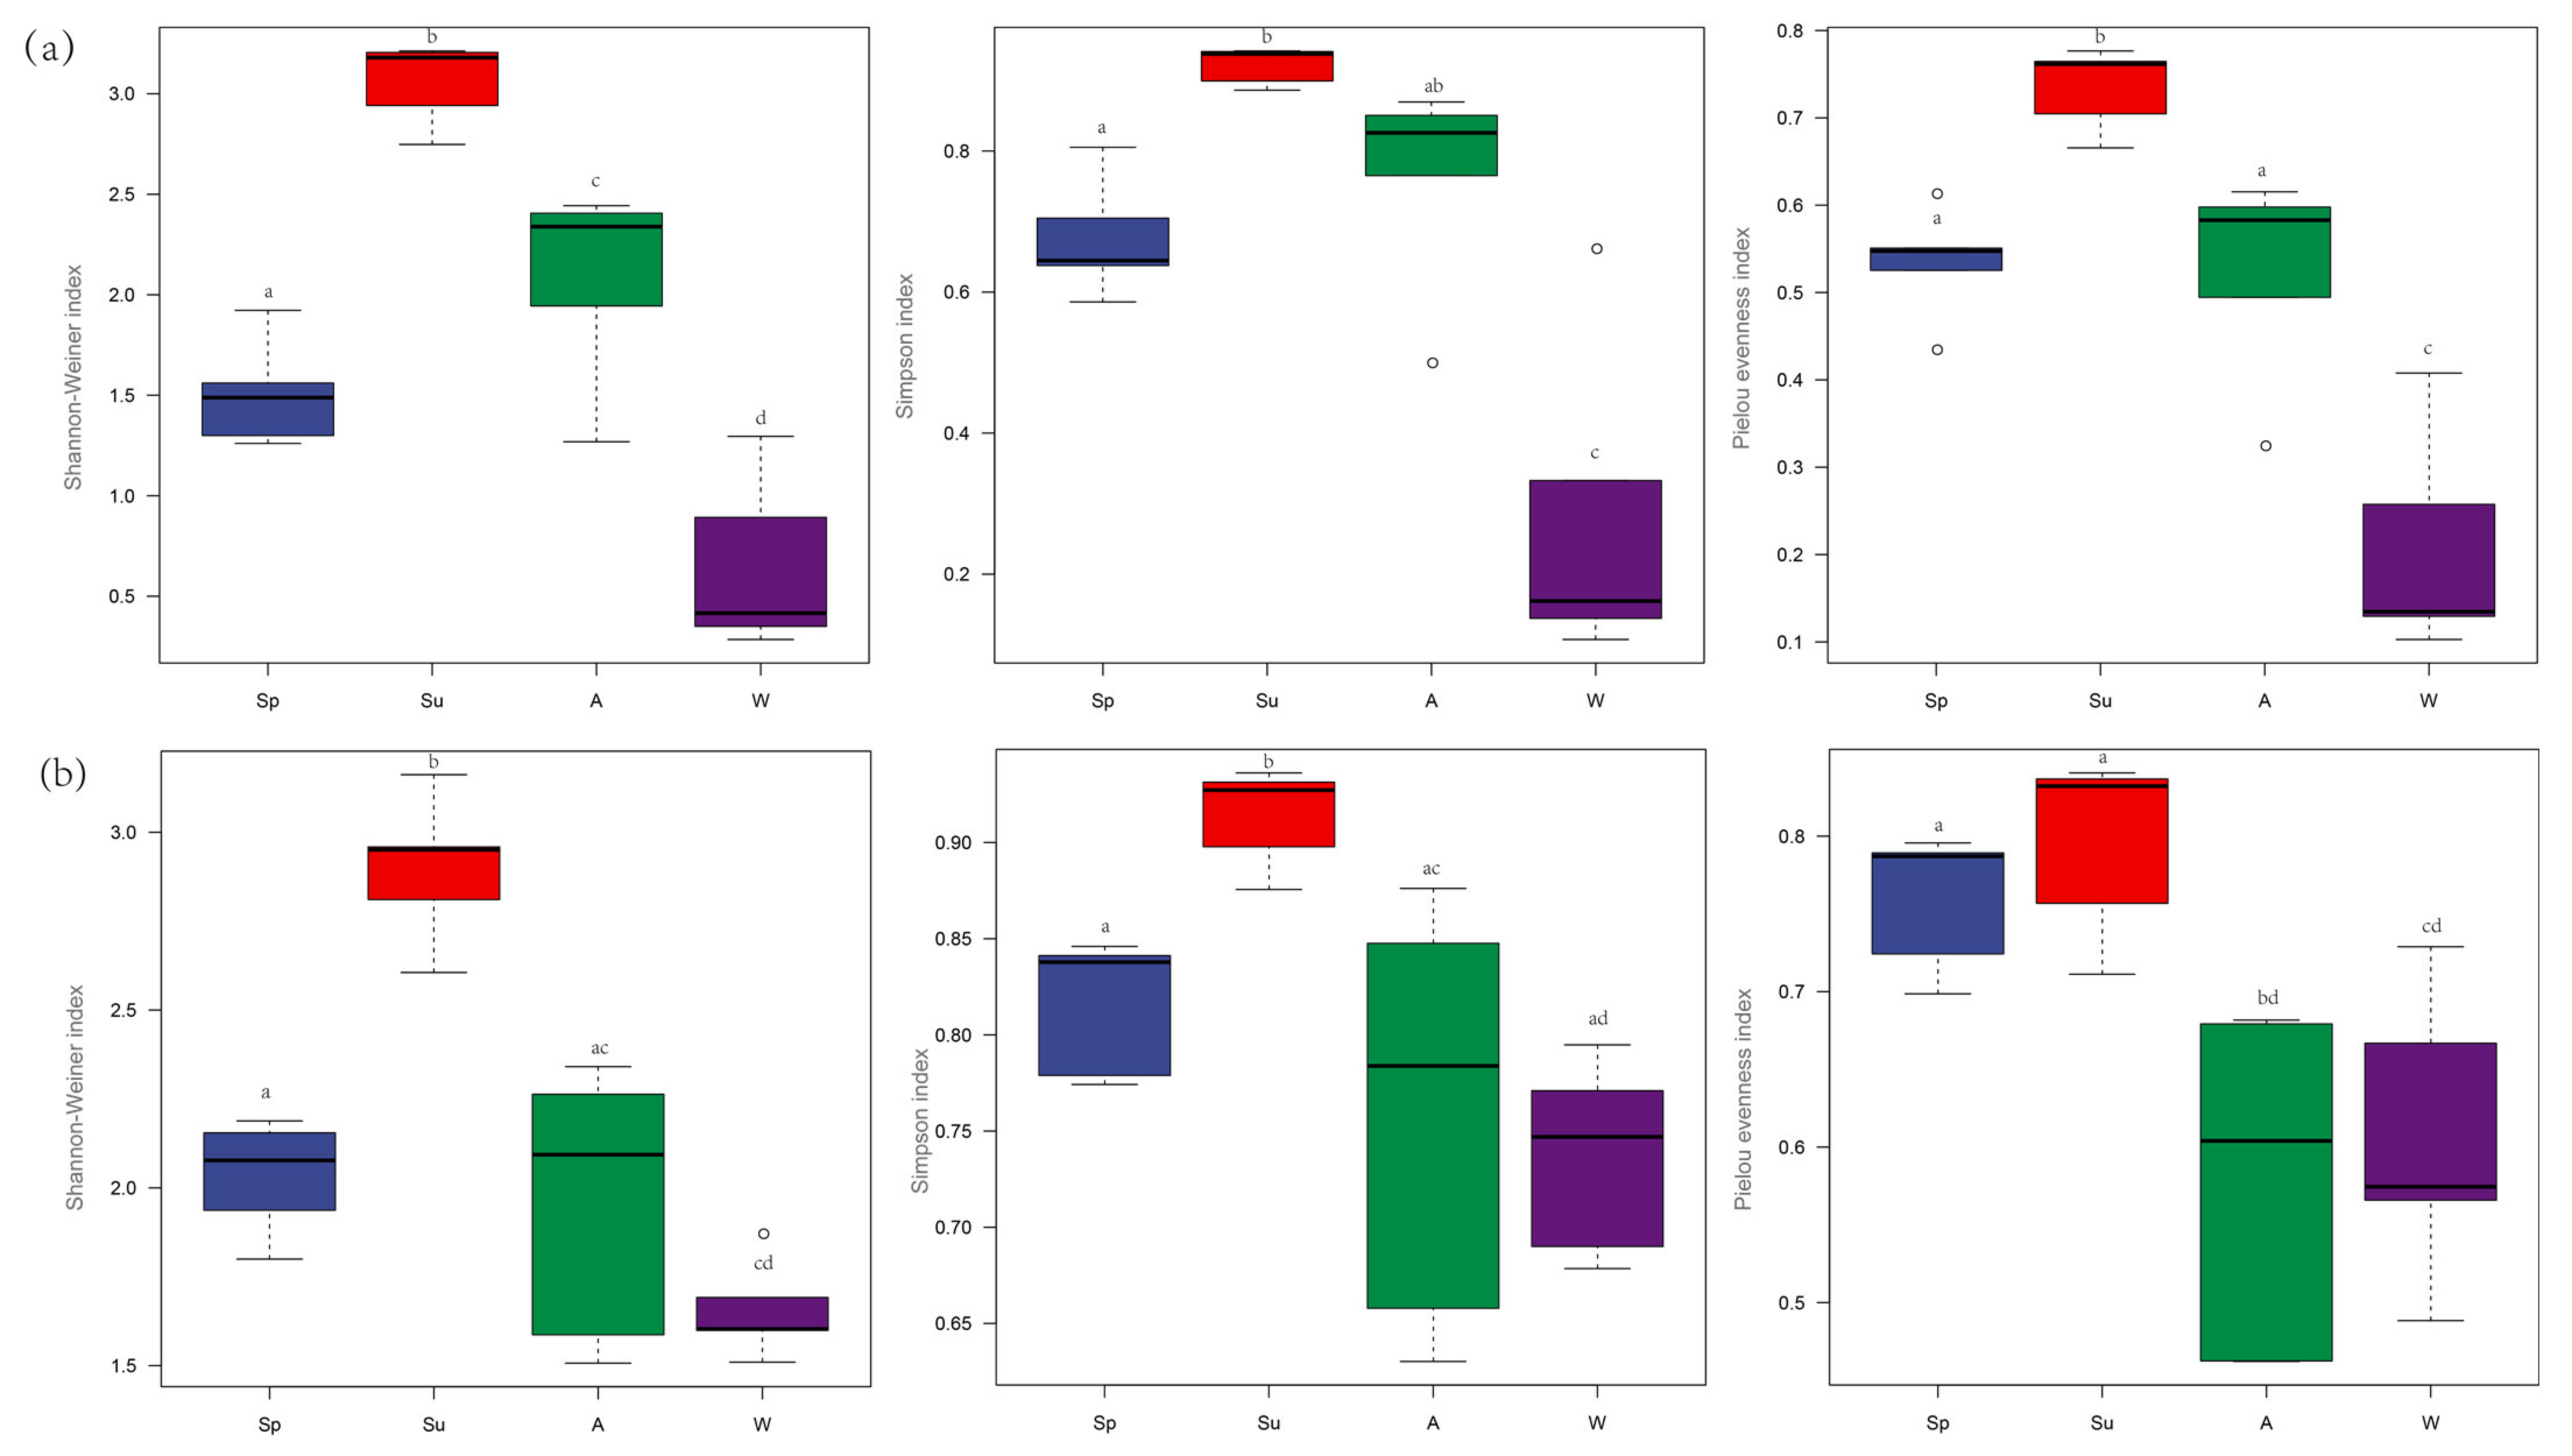
3.3. The α−Diversity Index
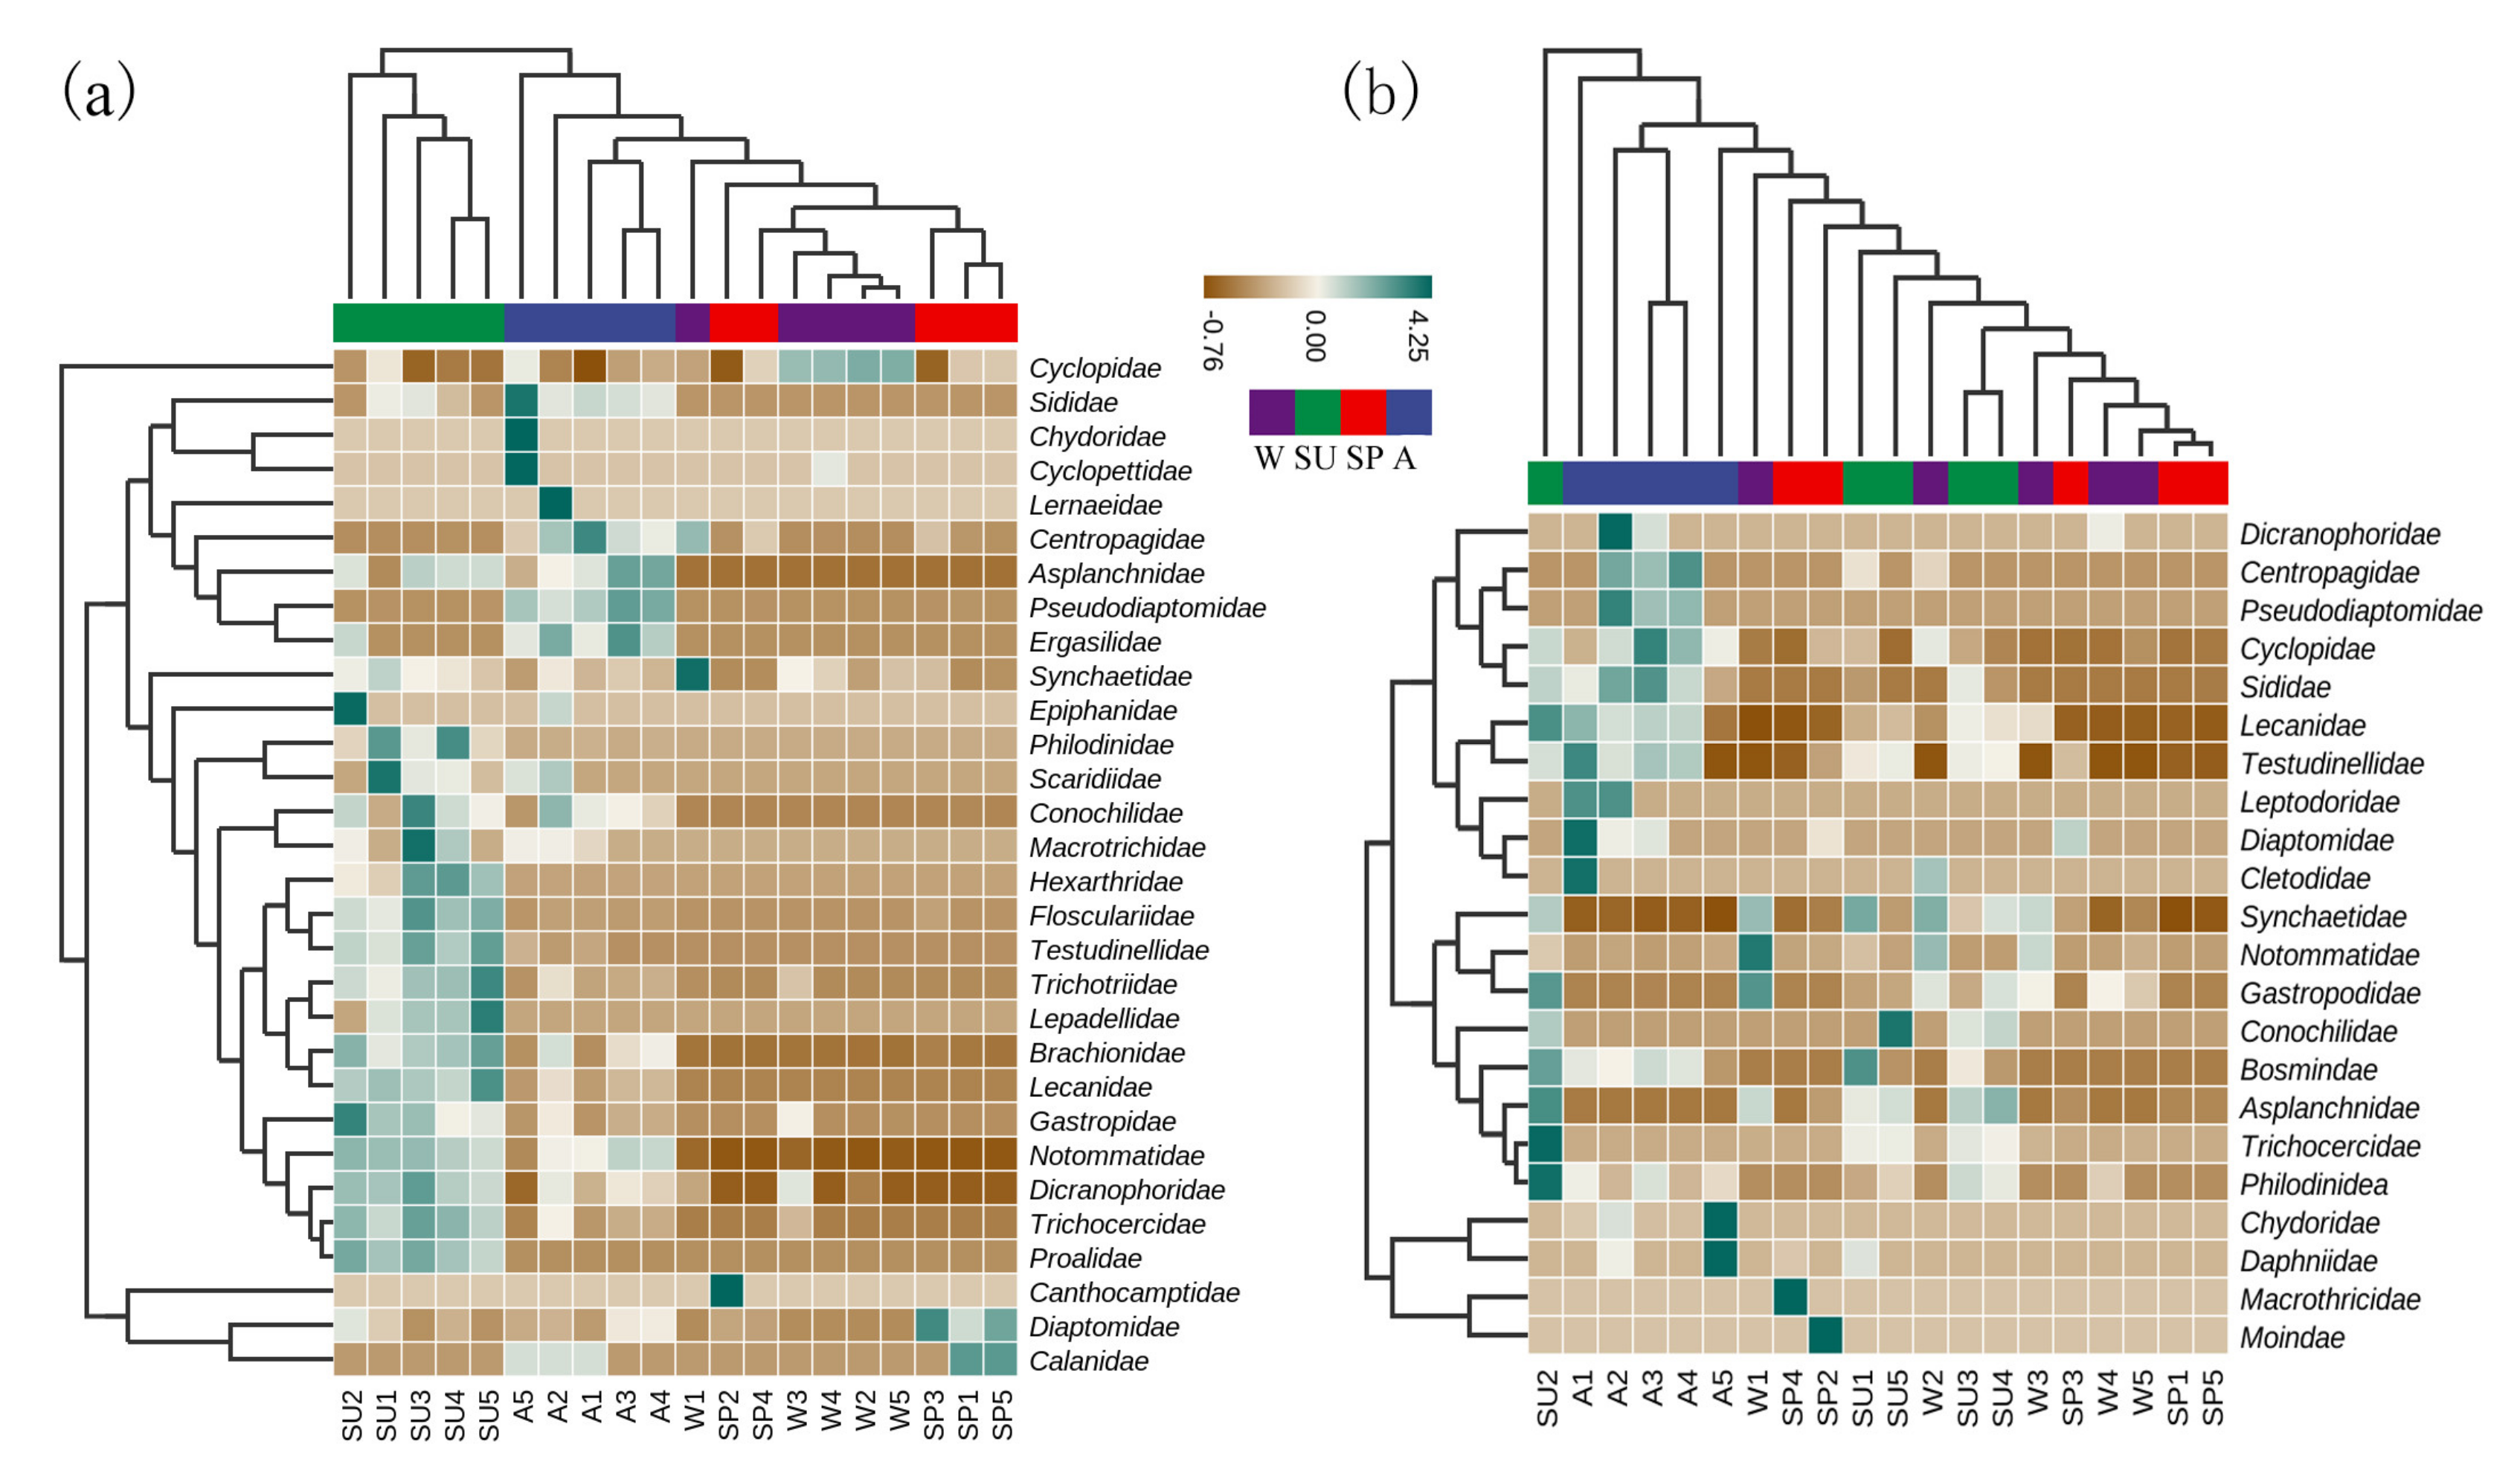
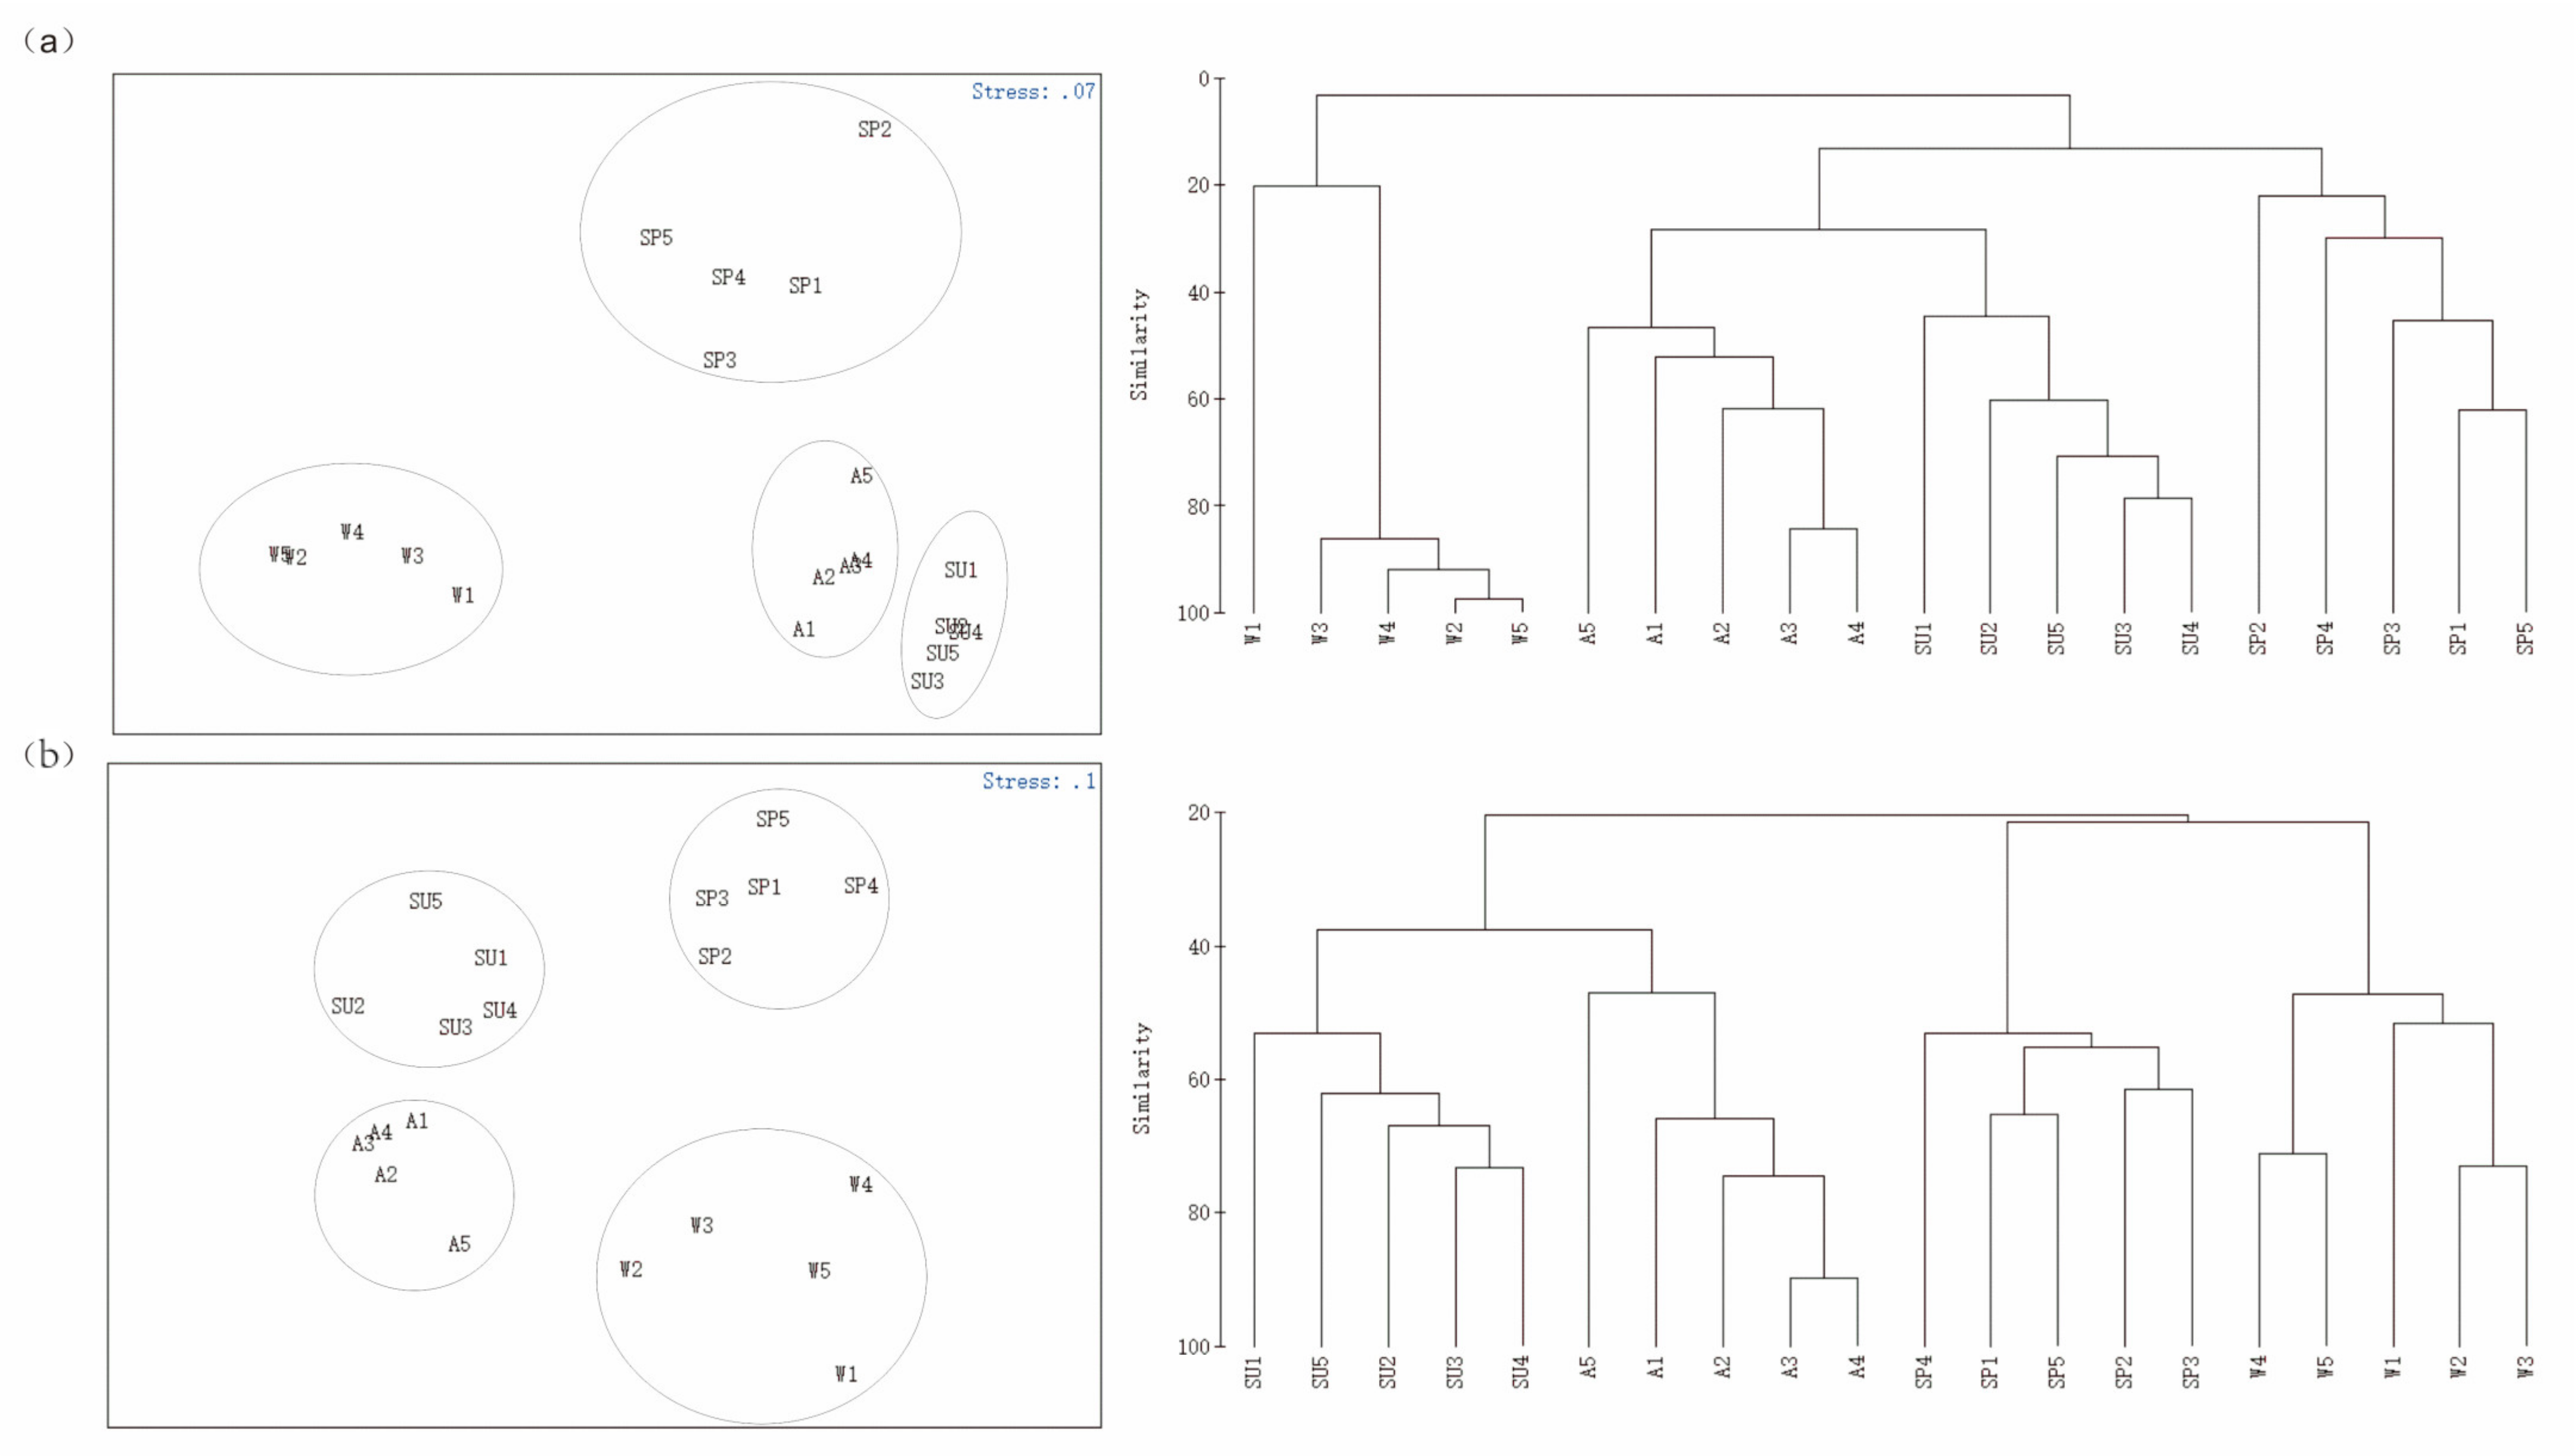
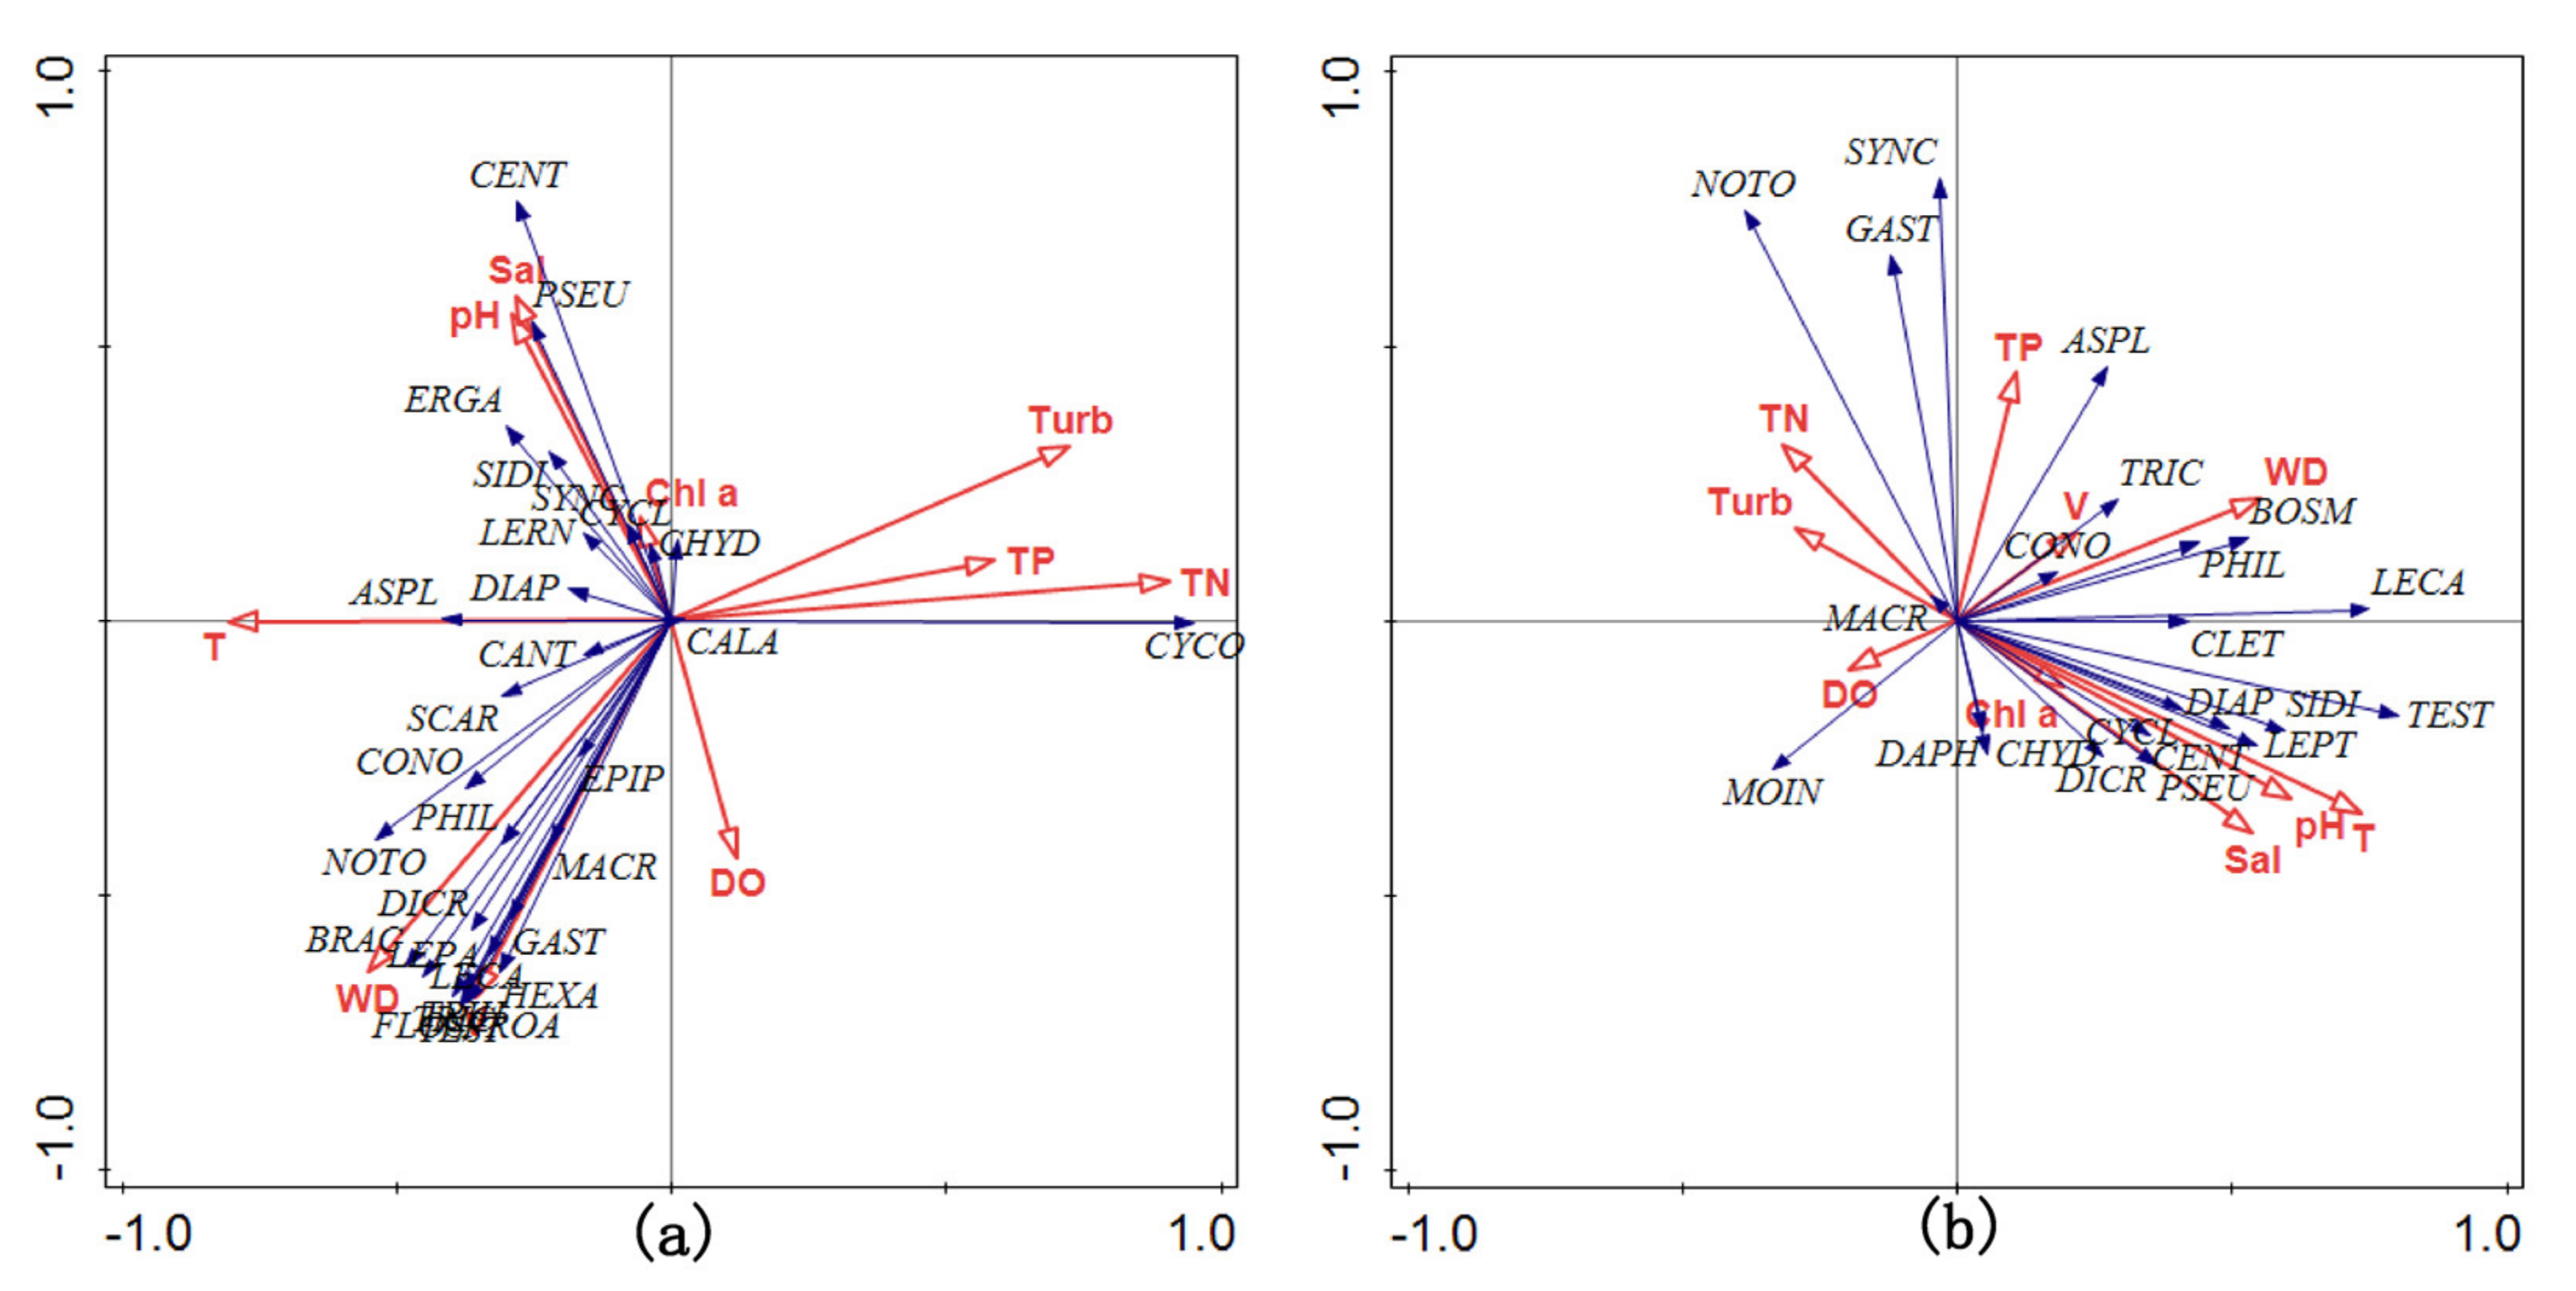
3.4. Community Feature
4. Discussion
5. Conclusions
Supplementary Materials
Author Contributions
Funding
Data Availability Statement
Conflicts of Interest
Appendix A

| MBC | MOI | ||||||
|---|---|---|---|---|---|---|---|
| Group | Family | Genus | Species | Group | Family | Genus | Species |
| Rotifers | - | - | Bdelloidea sp. 1 | Rotifers | Asplanchnidae | Asplanchna | Asplanchna brightwellii |
| Asplanchnidae | Asplanchna | Asplanchna brightwellii | Asplanchna | Asplanchna girodi | |||
| Asplanchnopus | Asplanchnopus dahlgreni | Asplanchna | Asplanchna priodonta | ||||
| Brachionidae | Brachionus | Brachionus calyciflorus | Asplanchnopus | Asplanchnopus multiceps | |||
| Brachionus plicatilis | Brachionidae | Anuraeopsis | Anuraeopsis fissa | ||||
| Brachionus sp. 1 | Brachionus | Brachionus angularis | |||||
| Brachionus urceolaris | Brachionus | Brachionus budapestinensis | |||||
| Epiphanes | Epiphanes senta | Brachionus | Brachionus calyciflorus | ||||
| Euchlanis | Euchlanis dilatata | Brachionus | Brachionus diversicornis | ||||
| Keratella | Keratella quadrata | Brachionus | Brachionus falcatus | ||||
| Lepadella | Lepadella rhomboides | Brachionus | Brachionus forficula | ||||
| Mytilina | Mytilina mucronata | Brachionus | Brachionus leydigii | ||||
| Plationus | Plationus patulus | Brachionus | Brachionus quadridentatus | ||||
| Collothecidae | Collotheca | Collotheca campanulata | Brachionus | Brachionus urceus | |||
| Collotheca tenuilobata | Epiphanes | Epiphanes senta | |||||
| Conochilidae | Conochilus | Conochilus coenobasis | Euchlanis | Euchlanis dilatata | |||
| Conochilus hippocrepis | Keratella | Keratella cochlearis | |||||
| Conochilus unicornis | Keratella | Keratella quadrata | |||||
| Dicranophoridae | Dicranophorus | Dicranophorus forcipatus | Keratella | Keratella valga | |||
| Encentrum | Encentrum astridae | Lepadella | Lepadella patella | ||||
| Flosculariidae | Floscularia | Floscularia armata | Notholca | Notholca labis | |||
| Lacinularia | Lacinularia flosculosa | Plationus | Plationus patulus | ||||
| Limnias | Limnias ceratophylli | Conochilidae | Conochilus | Conochilus unicornis | |||
| Limnias melicerta | Dicranophoridae | Dicranophorus | Dicranophorus forcipatus | ||||
| Pentatrocha | Pentatrocha gigantea | Dicranophoridae | Dicranophorus | Dicranophorus luetkeni | |||
| Ptygura | Ptygura libera | Gastropodidae | Ascomorpha | Ascomorpha ecaudis | |||
| Sinantherina | Sinantherina ariprepes | Ascomorpha | Ascomorpha ovalis | ||||
| Sinantherina semibullata | Ascomorpha | Ascomorpha saltans | |||||
| Sinantherina socialis | Gastropus | Gastropus hyptopus | |||||
| Gastropodidae | Ascomorpha | Ascomorpha ovalis | Lecanidae | Lecane | Lecane bulla | ||
| Lecanidae | Lecane | Lecane bulla | Lecane | Lecane cornuta | |||
| Lecane inermis | Lecane | Lecane luna | |||||
| Lecane ungulata | Lecane | Lecane inermis | |||||
| Monostyla | Monostyla sp. 1 | Lecane | Lecane niothis | ||||
| Notommatidae | Cephalodella | Cephalodella forficula | Lecane | Lecane sp.1 | |||
| Monommata | Monommata maculata | Lecane | Lecane ungulata | ||||
| Notommata allantois | Notommatidae | Cephalodella | Cephalodella gibba | ||||
| Notommata codonella | Eothinia | Eothinia elongata | |||||
| Philodinidae | Anomopus | Anomopus telphusae | Notommata | Notommata tripus | |||
| Philodina | Philodina megalotrocha | Rhinoglena | Rhinoglena frontalis | ||||
| Rotaria | Rotaria rotatoria | Scaridium | Scaridium longicauda | ||||
| Proalidae | Proales | Proales doliaris | Philodinidae | Rotaria | Rotaria neptunia | ||
| Synchaetidae | Macrochaetus | Macrochaetus collinsii | Rotaria | Rotaria rotatoria | |||
| Ploesoma | Ploesoma hudsoni | Synchaetidae | Ploesoma | Ploesoma hudsoni | |||
| Ploesoma truncatum | Ploesoma | Ploesoma truncatum | |||||
| Polyarthra | Polyarthra dolichoptera | Polyarthra | Polyarthra dolichoptera | ||||
| Polyarthra remata | Polyarthra | Polyarthra euryptera | |||||
| Synchaeta | Synchaeta pectinata | Polyarthra | Polyarthra trigla | ||||
| Synchaeta tremula | Polyarthra | Polyarthra vulgaris | |||||
| Scaridiidae | Scaridium | Scaridium longicauda | Synchaeta | Synchaeta grandis | |||
| Testudinellidae | Hexarthra | Hexarthra intermedia | Synchaeta | Synchaeta longipes | |||
| Hexarthra mira | Synchaeta | Synchaeta oblonga | |||||
| Testudinella | Testudinella patina | Synchaeta | Synchaeta pectinata | ||||
| Testudinella sp. 1 | Synchaeta | Synchaeta tremula | |||||
| Trichocercidae | Trichocerca | Trichocerca elongata | Testudinellidae | Filinia | Filinia longiseta | ||
| Trichocerca rattus | Filinia | Filinia passa | |||||
| Trichocerca tenuior | Hexarthra | Hexarthra mira | |||||
| Trichotriidae | Trichotria | Trichotria tetractis | Trichocercidae | Trichocerca | Trichocerca capucina | ||
| Copepods | - | - | Cyclops sp. 1 | Trichocerca | Trichocerca cylindrica | ||
| Acantholeberis | Acantholeberis | Acantholeberis curvirostris | Trichocerca | Trichocerca longiseta | |||
| Canthocamptidae | Attheyella | Attheyella crassa | Trichocerca | Trichocerca lophoessa | |||
| Centropagidae | Sinocalanus | Sinocalanus sinensis | Trichocerca | Trichocerca rattus | |||
| Sinocalanus tenellus | Trichocerca | Trichocerca similis | |||||
| Limnocalanus | Limnocalanus macrurus | Trichocerca | Trichocerca weberi | ||||
| Cyclopidae | Acanthocyclops | Acanthocyclops bicuspidatus | Trichotria | Trichotria pocillum | |||
| Acanthocyclops galbinus | Trichotria | Trichotria tetractis | |||||
| Diacyclops | Diacyclops jasnitskii | Copepods | - | - | Copepod nauplii | ||
| Diacyclops sp. 1 | Centropagidae | Sinocalanus | Sinocalanus dorrii | ||||
| Ectocyclops | Ectocyclops polyspinosus | Cyclopidae | Cyclopidae | Cyclopidae vicinus | |||
| Eucyclops | Eucyclops dumonti | Eucyclops | Eucyclops speratus | ||||
| Eucyclops serrulatus | Cletodidae | Limnocletodes | Limnocletodes behningi | ||||
| Eucyclops speratus | Cyclopidae | Mesocyclops | Mesocyclops leuckarti | ||||
| Eucyclops macruroides | Microcyclops | Microcyclops varicans | |||||
| Eucyclops sp. 1 | Thermocyclops | Thermocyclops taihokuensis | |||||
| Megacyclops | Megacyclops viridis | Diaptomidae | Neodiaptomus | Neodiaptomus schmackeri | |||
| Mesocyclops | Mesocyclops dissimilis | Neutrodiaptomus | Neutrodiaptomus incongruens | ||||
| Mesocyclops leuckarti | Pseudodiaptomidae | Schmackeria | Schmackeria forbesi | ||||
| Mesocyclops pehpeiensis | Cladocerans | Bosminidae | Bosmina | Bosmina coregoni | |||
| Microcyclops | Microcyclops varicans | Bosmina | Bosmina longirostris | ||||
| Neodiaptomus | Neodiaptomus schmackeri | Bosminopsis | Bosminopsis deitersi | ||||
| Thermocyclops | Thermocyclops sp. 1 | Chydoridae | Alona | Alona guttata | |||
| Thermocyclops crassus | Alona | Alona rectangula | |||||
| Thermocyclops decipiens | Chydorus | Chydorus sphaericus | |||||
| Tropocyclops | Tropocyclops ishidai | Daphniidae | Ceriodaphnia | Ceriodaphnia quadrangula | |||
| Paracyclops | Paracyclops fimbriatus | Diaphnia | Diaphnia cucullata | ||||
| Diaptomidae | Acanthodiaptomus | Acanthodiaptomus pacificus | Leptodoridae | Leptodora | Leptodora kindtii | ||
| Arctodiaptomus | Arctodiaptomus stephanidesi | Macrothricidae | Ilyocryptus | Ilyocryptus sordidus | |||
| Arctodiaptomus wierzejskii | Moinidae | Moina | Moina micrura | ||||
| Paracyclopina | Paracyclopina nana | Sididae | Diaphanosoma | Diaphanosoma brachyurum | |||
| Sinodiaptomus | Sinodiaptomus sarsi | Diaphanosoma | Diaphanosoma leuchtenbergianum | ||||
| Ergasilidae | Ergasilus | Ergasilus hypomesi | |||||
| Neoergasilus | Neoergasilus japonicus | ||||||
| Pseudergasilus | Pseudergasilus parasiluri | ||||||
| Sinergasilus | Sinergasilus polycolpus | ||||||
| Lernaeidae | Lernaea | Lernaea cyprinacea | |||||
| Pseudodiaptomidae | Pseudodiaptomus | Pseudodiaptomus inopinus | |||||
| Cladocerans | Chydoridae | Chydorus | Chydorus sphaericus | ||||
| Sididae | Diaphanosoma | Diaphanosoma sp. 1 | |||||
| Family of MBC | Abbreviation | Family of MOI | Abbreviation |
|---|---|---|---|
| Acantholeberis | ACAN | Asplanchnidae | ASPL |
| Asplanchnidae | ASPL | Brachionidae | BRAC |
| Brachionidae | BRAC | Bosmindae | BOSM |
| Canthocamptidae | CANT | Centropagidae | CENT |
| Centropagidae | CENT | Chydoridae | CHYD |
| Chydoridae | CHYD | Cletodidae | CLET |
| Collothecidae | COLL | Conochilidae | CONO |
| Conochilidae | CONO | Cyclopidae | CYCL |
| Cyclopidae | CYCO | Daphniidae | DAPH |
| Diaptomidae | DIAP | Dicranophoridae | DICR |
| Dicranophoridae | DICR | Diaptomidae | DIAP |
| Ergasilidae | ERGA | Gastropodidae | GAST |
| Flosculariidae | FLOS | Lecanidae | LECA |
| Gastropidae | GAST | Leptodoridae | LEPT |
| Lecanidae | LECA | Macrothricidae | MACR |
| Lernaeidae | LERN | Moindae | MOIN |
| Notommatidae | NOTO | Notommatidae | NOTO |
| Philodinidae | PHIL | Philodinidea | PHIL |
| Proalidae | PROA | Pseudodiaptomidae | PSEU |
| Pseudodiaptomidae | PSEU | Sididae | SIDI |
| Scaridiidae | SCAR | Synchaetidae | SYNC |
| Sididae | SIDI | Testudinellidae | TEST |
| Synchaetidae | SYNC | Trichocercidae | TRIC |
| Testudinellidae | TEST | ||
| Trichocercidae | TRIC | ||
| Trichotriidae | TRIH |
| WD | V | Turb | T | Sal | DO | Chl a | pH | TN | TP | |
|---|---|---|---|---|---|---|---|---|---|---|
| SP | 1.28 ± 0.05 | 0.11 ± 0.00 | 13.00 ± 1.86 | 22.29 ± 0.1 | 0.03 ± 0.00 | 10.21 ± 0.13 | 17.93 ± 0.65 | 7.10 ± 0.08 | 1.23 ± 0.06 | 0.13 ± 0.01 |
| SU | 3.38 ± 0.08 | 0.17 ± 0.01 | 13.84 ± 1.46 | 30.03 ± 0.13 | 0.11 ± 0.00 | 8.4 ± 0.09 | 16.32 ± 0.31 | 7.28 ± 0.01 | 1.22 ± 0.02 | 0.2 ± 0.01 |
| A | 1.46 ± 0.04 | 0.1 ± 0.00 | 49.46 ± 3.52 | 16.6 ± 0.26 | 0.02 ± 0.00 | 9.53 ± 0.16 | 19.68 ± 0.61 | 7.46 ± 0.06 | 1.28 ± 0.07 | 0.20 ± 0.01 |
| W | 0.86 ± 0.04 | 0.1 ± 0.00 | 129.92 ± 8.31 | 8.81 ± 0.13 | 0.03 ± 0.00 | 8.07 ± 0.09 | 16.54 ± 0.89 | 6.69 ± 0.04 | 3.63 ± 0.15 | 0.33 ± 0.03 |
References
- Nie, X.; Hu, X.R.; Liu, G.; Jin, B.; Qin, H. Species diversity of zooplankton and water quality biological assessment in a sub-lake of Poyang Lake. J. Nanchang Univ. Nat. Sci. 2018, 42, 161–167. [Google Scholar]
- Chen, B.; Chen, L.; Huang, B.; Michishita, R.; Xu, B. Surface groundwater interaction in the dish lake wetland system of poyang Lake floodplain. J. Lake Sci. 2021, 33, 842–853. [Google Scholar]
- Lu, Q.; Hu, X.; Nie, X.; Ouyang, S.; Wang, C.; Qin, H. Impact of water level fluctuations on the succession of zooplankton in Poyang lake. Acta Ecol. Sin. 2020, 40, 1486–1495. [Google Scholar]
- Tan, C.; Sheng, T.; Wang, L.; Mbao, E.; Gao, J.; Wang, B. Water-level fluctuations affect the alpha and beta diversity of macroinvertebrates in Poyang Lake, China. Fundam. Appl. Limnol. 2021, 194, 321–334. [Google Scholar] [CrossRef]
- Hu, B.; Hu, X.; Nie, X.; Zhang, X.; Wu, N.; Hong, Y.; Qin, H.M. Seasonal and inter-annual community structure characteristics of zooplankton driven by water environment factors in a sub-lake of Lake Poyang, China. PeerJ 2019, 7, e7590. [Google Scholar] [CrossRef] [Green Version]
- Gomes, L.F.; Pereira, H.R.; Gomes, A.C.A.M.; Vieira, M.C.; Martins, P.R.; Roitman, I.; Vieira, L.C.G. Zooplankton functional-approach studies in continental aquatic environments: A systematic review. Aquat. Ecol. 2019, 53, 191–203. [Google Scholar] [CrossRef]
- Mehner, T.; Keeling, C.; Emmrich, M.; Holmgren, K.; Argillier, C.; Volta, P.; Winfield, I.J.; Brucet, S. Effects of fish predation on density and size spectra of prey fish communities in lakes. Can. J. Fish. Aquat. Science 2016, 73, 506–518. [Google Scholar] [CrossRef] [Green Version]
- Park, K.S.; Shin, H.W. Studies on phyto-and-zooplankton composition and its relation to fish productivity in a west coast fish pond ecosystem. J. Environ. Biol. 2007, 28, 415–422. [Google Scholar]
- Korponai, J.; Braun, M.; Forró, L.; Gyulai, I.; Kövér, C.; Nédli, J.; Urák, I.; Buczkó, K. Taxonomic, functional and phylogenetic diversity: How subfossil cladocerans mirror contemporary community for ecosystem functioning: A comparative study in two oxbows. Limnetica 2019, 38, 431–456. [Google Scholar] [CrossRef]
- Jeppesen, E.; Nõges, P.; Davidson, T.; Haberman, J.; Nõges, T.; Blank, K.; Lauridsen, T.; Søndergaard, M.; Sayer, C.; Laugaste, R.; et al. Zooplankton as indicators in lakes: A scientific-based plea for including zooplankton in the ecological quality assessment of lakes according to the European Water Framework Directive (WFD). Hydrobiologia 2011, 676, 279–297. [Google Scholar] [CrossRef]
- Chen, G.; Dalton, C.; Taylor, D. Cladocera as indicators of trophic state in Irish lakes. J. Paleolimnol. 2010, 44, 465–481. [Google Scholar] [CrossRef]
- Ekvall, M.K.; Urrutia-Cordero, P.; Hansson, L.-A. Linking Cascading Effects of Fish Predation and Zooplankton Grazing to Reduced Cyanobacterial Biomass and Toxin Levels Following Biomanipulation. PLoS ONE 2014, 9, e112956. [Google Scholar] [CrossRef] [PubMed] [Green Version]
- Berta, C.; Tóthmérész, B.; Wojewódka, M.; Augustyniuk, O.; Korponai, J.; Bertalan-Balázs, B.; Nagy, A.S.; Grigorszky, I.; Gyulai, I.; Balázs, B.; et al. Community Response of Cladocera to Trophic Stress by Biomanipulation in a Shallow Oxbow Lake. Water 2019, 11, 929. [Google Scholar] [CrossRef] [Green Version]
- Montes-Ortiz, L.; Elias-Gutierrez, M. Faunistic survey of the zooplankton community in an oligotrophic sinkhole, Cenote Azul (Quintana Roo, Mexico), using different sampling methods, and documented with DNA barcodes. J. Limnol. 2018, 77, 428–440. [Google Scholar] [CrossRef]
- Choquet, M.; Kosobokova, K.; Kwaśniewski, S.; Hatlebakk, M.; Dhanasiri, A.K.S.; Melle, W.; Daase, M.; Svensen, C.; Søreide, J.E.; Hoarau, G. Can morphology reliably distinguish between the copepods Calanus finmarchicus and C. glacialis, or is DNA the only way? Limnol. Oceanogr. Methods 2018, 16, 237–252. [Google Scholar] [CrossRef] [Green Version]
- Abad, D.; Albaina, A.; Aguirre, M.; Laza-Martínez, A.; Uriarte, I.; Iriarte, A.; Villate, F.; Estonba, A. Is metabarcoding suitable for estuarine plankton monitoring? A comparative study with microscopy. Mar. Biol. 2016, 163, 149. [Google Scholar] [CrossRef]
- Van der Loos, L.M.; Nijland, R. Biases in bulk: DNA metabarcoding of marine communities and the methodology involved. Mol. Ecol. 2021, 30, 3270–3288. [Google Scholar] [CrossRef]
- Stefanni, S.; Stanković, D.; Borme, D.; De Olazabal, A.; Juretić, T.; Pallavicini, A.; Tirelli, V. Multi-marker metabarcoding approach to study mesozooplankton at basin scale. Sci. Rep. 2018, 8, 12085. [Google Scholar] [CrossRef] [Green Version]
- Chain, F.J.; Brown, E.A.; MacIsaac, H.J.; Cristescu, M.E. Metabarcoding reveals strong spatial structure and temporal turnover of zooplankton communities among marine and freshwater ports. Divers. Distrib. 2016, 22, 493–504. [Google Scholar] [CrossRef] [Green Version]
- Deagle, B.E.; Jarman, S.N.; Coissac, E.; Pompanon, F.; Taberlet, P. DNA metabarcoding and the cytochrome c oxidase subunit I marker: Not a perfect match. Biol. Lett. 2014, 10, 20140562. [Google Scholar] [CrossRef] [Green Version]
- Zhang, X.W. Environmental DNA Shaping a New Era of Ecotoxicological Research. Environ. Sci. Technol. 2019, 53, 5605–5612. [Google Scholar] [CrossRef] [PubMed]
- Yang, J.; Zhang, X.; Xie, Y.; Song, C.; Zhang, Y.; Yu, H.; Burton, G.A., Jr. Zooplankton Community Profiling in a Eutrophic Freshwater Ecosystem-Lake Tai Basin by DNA Metabarcoding. Sci. Rep. 2017, 7, 1773. [Google Scholar] [CrossRef] [PubMed]
- Yang, J.; Zhang, X.; Zhang, W.; Sun, J.; Xie, Y.; Zhang, Y.; Burton, G.A., Jr.; Yu, H. Indigenous species barcode database improves the identification of zooplankton. PLoS ONE 2017, 12, e0185697. [Google Scholar] [CrossRef] [PubMed] [Green Version]
- Bucklin, A.; Lindeque, P.K.; Rodriguez-Ezpeleta, N.; Albaina, A.; Lehtiniemi, M. Metabarcoding of marine zooplankton: Prospects, progress and pitfalls. J. Plankton Res. 2016, 38, 393–400. [Google Scholar] [CrossRef] [Green Version]
- Casas, L.; Pearman, J.K.; Irigoien, X. Metabarcoding Reveals Seasonal and Temperature-Dependent Succession of Zooplankton Communities in the Red Sea. Front. Mar. Sci. 2017, 4, 241. [Google Scholar] [CrossRef] [Green Version]
- Zhang, G.K.; Chain, F.J.J.; Abbott, C.L.; Cristescu, M.E. Metabarcoding using multiplexed markers increases species detection in complex zooplankton communities. Evol. Appl. 2018, 11, 1901–1914. [Google Scholar] [CrossRef] [Green Version]
- Chaparro, G.; O’Farrell, I.; Hein, T. Multi-scale analysis of functional plankton diversity in floodplain wetlands: Effects of river regulation. Sci. Total Environ. 2019, 667, 338–347. [Google Scholar] [CrossRef]
- Pennak, R.W. Freshwater Invertebrates of the United States, 3rd ed.; John Wiley and Sons, Inc.: New York, NY, USA, 1989. [Google Scholar]
- Witty, L.M. Practical Guide to Identifying Freshwater Crustacean Zooplankton, 2nd ed.; Cooperative Freshwater Ecology Unit: Greater Sudbury, ON, Canada, 2004. [Google Scholar]
- Shiel, R.J. A Guide to Identification of Rotifers, Cladocerans and Copepods from Australian Inland Waters; Murray-Darling Freshwater Research Centre: Wodonga, Australia, 1995. [Google Scholar]
- Phan, D.D.; Nguyen, V.K.; Nga, N.; Thi, L.; Ngoc, T.D.; Hai, H.T. Identification Handbook of Freshwater Zooplankton of the Mekong River and its Tributaries; Mekong River Commission: Vientiane, Lao, 2015. [Google Scholar]
- Wang, J.J. Fauna Sinica: Freshwater Rotifera; Science Press: Beijing, China, 1961. [Google Scholar]
- Jiang, Y.Z.; Du, N.S. Fauna Sinica (Crustacea): Freshwater Cladocera; Science Press: Beijing, China, 1979. [Google Scholar]
- Zhang, Z.S.; Huang, X.F. Research Methods of Freshwater Plankton; Science Press: Beijing, China, 1995. [Google Scholar]
- Institute of Zoology, Chinese Academy of Sciences. Fauna Sinica (Crustacea): Freshwater Copepods; Science Press: Beijing, China, 1979. [Google Scholar]
- Han, M.S.; Shu, W.F. Picture of Chinese Freshwater Biota; China Ocean Press: Beijing, China, 1995. [Google Scholar]
- Pilliod, D.S.; Goldberg, C.S.; Arkle, R.S.; Waits, L.P. Estimating occupancy and abundance of stream amphibians using environmental DNA from filtered water samples. Can. J. Fish. Aquat. Sci. 2013, 70, 1123–1130. [Google Scholar] [CrossRef]
- Xiong, W.; Ni, P.; Chen, Y.; Gao, Y.; Shan, B.; Zhan, A. Zooplankton community structure along a pollution gradient at fine geographical scales in river ecosystems: The importance of species sorting over dispersal. Mol. Ecol. 2017, 26, 4351–4360. [Google Scholar] [CrossRef]
- Borcard, D.; Gillet, F.; Legendre, L. Numerical Ecology with R; Springer: New York, NY, USA, 2011. [Google Scholar]
- Novotny, A.; Zamora-Terol, S.; Winder, M. DNA metabarcoding reveals trophic niche diversity of micro and mesozooplankton species. Proc. R. Soc. B 2021, 288, 20210908. [Google Scholar] [CrossRef]
- Ren, Z.; Qu, X.; Zhang, M.; Yu, Y.; Peng, W. Distinct Bacterial Communities in Wet and Dry Seasons During a Seasonal Water Level Fluctuation in the Largest Freshwater Lake (Poyang Lake) in China. Front. Microbiol. 2019, 10, 1167. [Google Scholar] [CrossRef] [PubMed]
- Barnett, A.; Beisner, B. zooplankton biodiversity and lake trophic state: Explanations invoking resource abundance and distribution. Ecology 2007, 88, 1675–1686. [Google Scholar] [CrossRef] [PubMed]
- Zhou, J.; Qin, B.; Zhu, G.; Zhang, Y.; Gao, G. Long-term variation of zooplankton communities in a large, heterogenous lake: Implications for future environmental change scenarios. Environ. Res. 2020, 187, 109704. [Google Scholar] [CrossRef]
- Wang, S.; Gao, Y.; Jia, J.; Kun, S.; Lyu, S.; Li, Z.; Lu, Y.; Wen, X. Water level as the key controlling regulator associated with nutrient and gross primary productivity changes in a large floodplain-lake system (Lake Poyang), China. J. Hydrol. 2021, 599, 126414. [Google Scholar] [CrossRef]
- Qian, K.; Dokulil, M.; Lei, W.; Chen, Y. The effects of water-level changes on periphytic algal assemblages in Poyang Lake. Fundam. Appl. Limnol. 2021, 194, 311–320. [Google Scholar] [CrossRef]
- Liu, B.; Liu, J.; Jeppesen, E.; Chen, Y.; Liu, X.; Zhang, W. Horizontal distribution of pelagic crustacean zooplankton biomass and body size in contrasting habitat types in Lake Poyang, China. Environ. Sci. Pollut. Res. 2019, 26, 2270–2280. [Google Scholar] [CrossRef] [PubMed]
- Cao, J.; Chu, Z.; Du, Y.; Hou, Z.; Wang, S. Phytoplankton dynamics and their relationship with environmental variables of Lake Poyang. Hydrol. Res. 2016, 47, 249–260. [Google Scholar] [CrossRef] [Green Version]
- Zamora-Terol, S.; Novotny, A.; Winder, M. Reconstructing marine plankton food web interactions using DNA metabarcoding. Mol. Ecol. 2020, 29, 3380–3395. [Google Scholar] [CrossRef]
- Amorim, C.A.; Moura, A.N. Ecological impacts of freshwater algal blooms on water quality, plankton biodiversity, structure, an. ecosystem functioning. Sci. Total Environ. 2020, 758, 143605. [Google Scholar] [CrossRef]
- Gołdyn, R.; Kowalczewska-Madura, K. Interactions between phytoplankton and zooplankton in the hypertrophic Swarzedzkie Lake in western Poland. J. Plankton Res. 2008, 30, 33–42. [Google Scholar] [CrossRef] [Green Version]
- Špoljar, M.; Dražina, T.; Šargač, J.; Borojević, K.K.; Žutinić, P. Submerged macrophytes as a habitat for zooplankton development in two reservoirs of a flow-through system (Papuk Nature Park, Croatia). Ann. Limnol. Int. J. Lim. 2012, 48, 161–175. [Google Scholar] [CrossRef] [Green Version]
- Sharma, P.; Gutierrez, M.E.; Kobayashi, T. Identification of common cladocerans and calanoids in two south Australian reservoirs using DNA barcoding and morphological analysis: An integrative approach. Crustaceana 2014, 87, 834–855. [Google Scholar] [CrossRef]
- Schroeder, A.; Stanković, D.; Pallavicini, A.; Gionechetti, F.; Pansera, M.; Camatti, E. DNA metabarcoding and morphological analysis—Assessment of zooplankton biodiversity in transitional waters. Mar. Environ. Res. 2020, 160, 104946. [Google Scholar] [CrossRef] [PubMed]
- Walczyńska, K.S.; Søreide, J.E.; Weydmann-Zwolicka, A.; Ronowicz, M.; Gabrielsen, T.M. DNA barcoding of Cirripedia larvae reveals new knowledge on their biology in Arctic coastal ecosystems. Hydrobiologia 2019, 837, 149–159. [Google Scholar] [CrossRef] [Green Version]
- Frontalini, F.; Cordier, T.; Balassi, E.; du Chatelet, E.A.; Cermakova, K.; Apothéloz-Perret-Gentil, L.; Martins, M.V.A.; Bucci, C.; Scantamburlo, E.; Treglia, M.; et al. Benthic foraminiferal metabarcoding and morphology-based assessment around three offshore gas platforms: Congruence and complementarity. Environ. Int. 2020, 144, 106049. [Google Scholar] [CrossRef]
- Elías-Gutiérrez, M.; Valdez-Moreno, M.; Topan, J.; Young, M.R.; Cohuo-Colli, J.A. Improved protocols to accelerate the assembly of DNA barcode reference libraries for freshwater zooplankton. Ecol. Evol. 2018, 8, 3002–3018. [Google Scholar] [CrossRef]
- Cordier, T.; Lanzén, A.; Apothéloz-Perret-Gentil, L.; Stoeck, T.; Pawlowski, J. Embracing Environmental Genomics and Machine Learning for Routine Biomonitoring. Trends Microbiol. 2019, 27, 387–397. [Google Scholar] [CrossRef]
- Banerji, A.; Bagley, M.; Elk, M.; Pilgrim, E.; Martinson, J.; Domingo, J.S. Spatial and temporal dynamics of a freshwater eukaryotic plankton community revealed via 18S rRNA gene metabarcoding. Hydrobiologia 2018, 818, 71–86. [Google Scholar] [CrossRef]
- Djurhuus, A.; Pitz, K.; Sawaya, N.; Rojas-Márquez, J.; Michaud, B.; Montes, E.; Muller-Karger, F.; Breitbart, M. Evaluation of marine zooplankton community structure through environmental DNA metabarcoding. Limnol. Oceanogr. Methods 2018, 16, 209–221. [Google Scholar] [CrossRef] [Green Version]
- Makino, W.; Maruoka, N.; Nakagawa, M.; Takamura, N. DNA barcoding of freshwater zooplankton in Lake Kasumigaura, Japan. Ecol. Res. 2017, 32, 481–493. [Google Scholar] [CrossRef]
- Shackleton, M.; Dafforn, K.; Murphy, N.; Greenfield, P.; Cassidy, M.; Besley, C. How does molecular taxonomy for deriving river health indices correlate with traditional morphological taxonomy? Ecol. Indic. 2021, 125, 107537. [Google Scholar] [CrossRef]
- Lim, N.K.M.; Tay, Y.C.; Srivathsan, A.; Tan, J.W.T.; Kwik, J.T.B.; Baloglu, B.; Meier, R.; Yeo, D.C.J. Next-generation freshwater bioassessment: eDNA metabarcoding with a conserved metazoan primer reveals species-rich and reservoir-specific communities. R. Soc. Open Sci. 2016, 3, 160635. [Google Scholar] [CrossRef] [Green Version]
- Nistal-García, A.; García-García, P.; García-Girón, J.; Borrego-Ramos, M.; Blanco, S.; Bécares, E. DNA metabarcoding and morphological methods show complementary patterns in the metacommunity organization of lentic epiphytic diatoms. Sci. Total Environ. 2021, 786, 147410. [Google Scholar] [CrossRef] [PubMed]
- Leray, M.; Knowlton, N.; Ho, S.-L.; Nguyen, B.N.; Machida, R.J. GenBank is a reliable resource for 21st century biodiversity research. Proc. Natl. Acad. Sci. USA 2019, 116, 22651–22656. [Google Scholar] [CrossRef] [PubMed] [Green Version]


| Group | Species | SP | SU | A | W |
|---|---|---|---|---|---|
| Rotifers | Anuraeopsis fissa (MOI) | − | 0.04 | − | 0.12 |
| Ascomorpha ovalis (MBC) | − | 0.03 | − | − | |
| Asplanchna priodonta (MOI) | − | 0.02 | − | − | |
| Asplanchnopus dahlgreni (MBC) | − | − | 0.04 | − | |
| Asplanchna brightwellii (MBC) | − | 0.04 | 0.04 | − | |
| Brachionus angularis (MOI) | 0.06 | − | − | − | |
| Brachionus calyciflorus (MOI)/(MBC) | 0.14/− | −/0.14 | −/0.02 | −/− | |
| Brachionus budapestiensis (MOI) | − | 0.03 | − | − | |
| Brachionus falcatus (MOI) | − | 0.04 | − | − | |
| Brachionus diversicornis (MOI) | − | 0.03 | 0.08 | − | |
| Brachionus urceolaris (MBC) | − | 0.07 | 0.04 | − | |
| Brachionus sp. 1 (MBC) | − | 0.02 | − | − | |
| Cephalodella gibba (MOI) | − | − | − | 0.22 | |
| Collotheca tenuilobata (MBC) | − | 0.03 | − | − | |
| Filinia longiseta (MOI) | 0.04 | − | 0.04 | − | |
| Hexarthra intermedia (MBC) | − | 0.06 | − | − | |
| Keratella valga (MOI) | − | 0.09 | 0.11 | − | |
| Keratella cochlearis (MOI) | − | 0.15 | 0.24 | − | |
| Keratella quadrata (MBC) | − | 0.11 | 0.05 | − | |
| Lecane sp. 1 (MOI) | 0.02 | − | − | − | |
| Polyarthra dolichoptera (MOI)/(MBC) | 0.15/− | 0.06/0.03 | −/− | −/− | |
| Polyarthra vulgaris (MOI) | − | 0.07 | − | − | |
| Polyarthra remata (MBC) | − | 0.02 | − | − | |
| Ptygura libera (MBC) | − | 0.04 | − | − | |
| Rotaria neptunia (MOI) | − | 0.02 | − | − | |
| Synchaeta tremula (MOI)/(MBC) | −/− | −/− | −/− | 0.22/0.11 | |
| Trichocerca cylindrica (MOI) | − | 0.02 | − | − | |
| Trichocerca capucina (MOI) | − | 0.05 | − | − | |
| Trichocerca lophoessa (MOI) | − | 0.04 | − | − | |
| Copepods | Copepod nauplii (MOI) | 0.32 | 0.08 | 0.33 | 0.32 |
| Eucyclops serrulatus (MBC) | 0.02 | − | − | − | |
| Eucyclops dumonti (MBC) | 0.06 | − | − | − | |
| Mesocyclops leuckarti (MOI) | − | − | 0.03 | − | |
| Microcyclops varicans (MOI) | 0.04 | − | − | − | |
| Mesocyclops pehpeiensis (MBC) | 0.02 | 0.03 | − | − | |
| Mesocyclops dissimilis (MBC) | 0.3 | 0.05 | 0.06 | − | |
| Neodiaptomus schmackeri (MBC) | 0.31 | − | − | − | |
| Pseudodiaptomus inopinus (MBC) | − | − | 0.2 | − | |
| Sinocalanus sinensis (MBC) | 0.08 | − | 0.31 | 0.08 | |
| Thermocyclops sp. 1 (MBC) | − | − | − | 0.74 | |
| Thermocyclops crassus (MBC) | − | 0.05 | 0.12 | − | |
| Thermocyclops decipiens (MBC) | − | − | − | 0.03 |
Publisher’s Note: MDPI stays neutral with regard to jurisdictional claims in published maps and institutional affiliations. |
© 2022 by the authors. Licensee MDPI, Basel, Switzerland. This article is an open access article distributed under the terms and conditions of the Creative Commons Attribution (CC BY) license (https://creativecommons.org/licenses/by/4.0/).
Share and Cite
Qiu, X.; Lu, Q.; Jia, C.; Dai, Y.; Ouyang, S.; Wu, X. The Effects of Water Level Fluctuation on Zooplankton Communities in Shahu Lake Based on DNA Metabarcoding and Morphological Methods. Animals 2022, 12, 950. https://doi.org/10.3390/ani12080950
Qiu X, Lu Q, Jia C, Dai Y, Ouyang S, Wu X. The Effects of Water Level Fluctuation on Zooplankton Communities in Shahu Lake Based on DNA Metabarcoding and Morphological Methods. Animals. 2022; 12(8):950. https://doi.org/10.3390/ani12080950
Chicago/Turabian StyleQiu, Xuemei, Quanfeng Lu, Chenchen Jia, Yuting Dai, Shan Ouyang, and Xiaoping Wu. 2022. "The Effects of Water Level Fluctuation on Zooplankton Communities in Shahu Lake Based on DNA Metabarcoding and Morphological Methods" Animals 12, no. 8: 950. https://doi.org/10.3390/ani12080950