
An Integrated Bioinformatics Approach to Identify Network-Derived Hub Genes in Starving Zebrafish

 ,
, 
 and
and 
Abstract
:Simple Summary
Abstract
1. Introduction
2. Materials and Methods
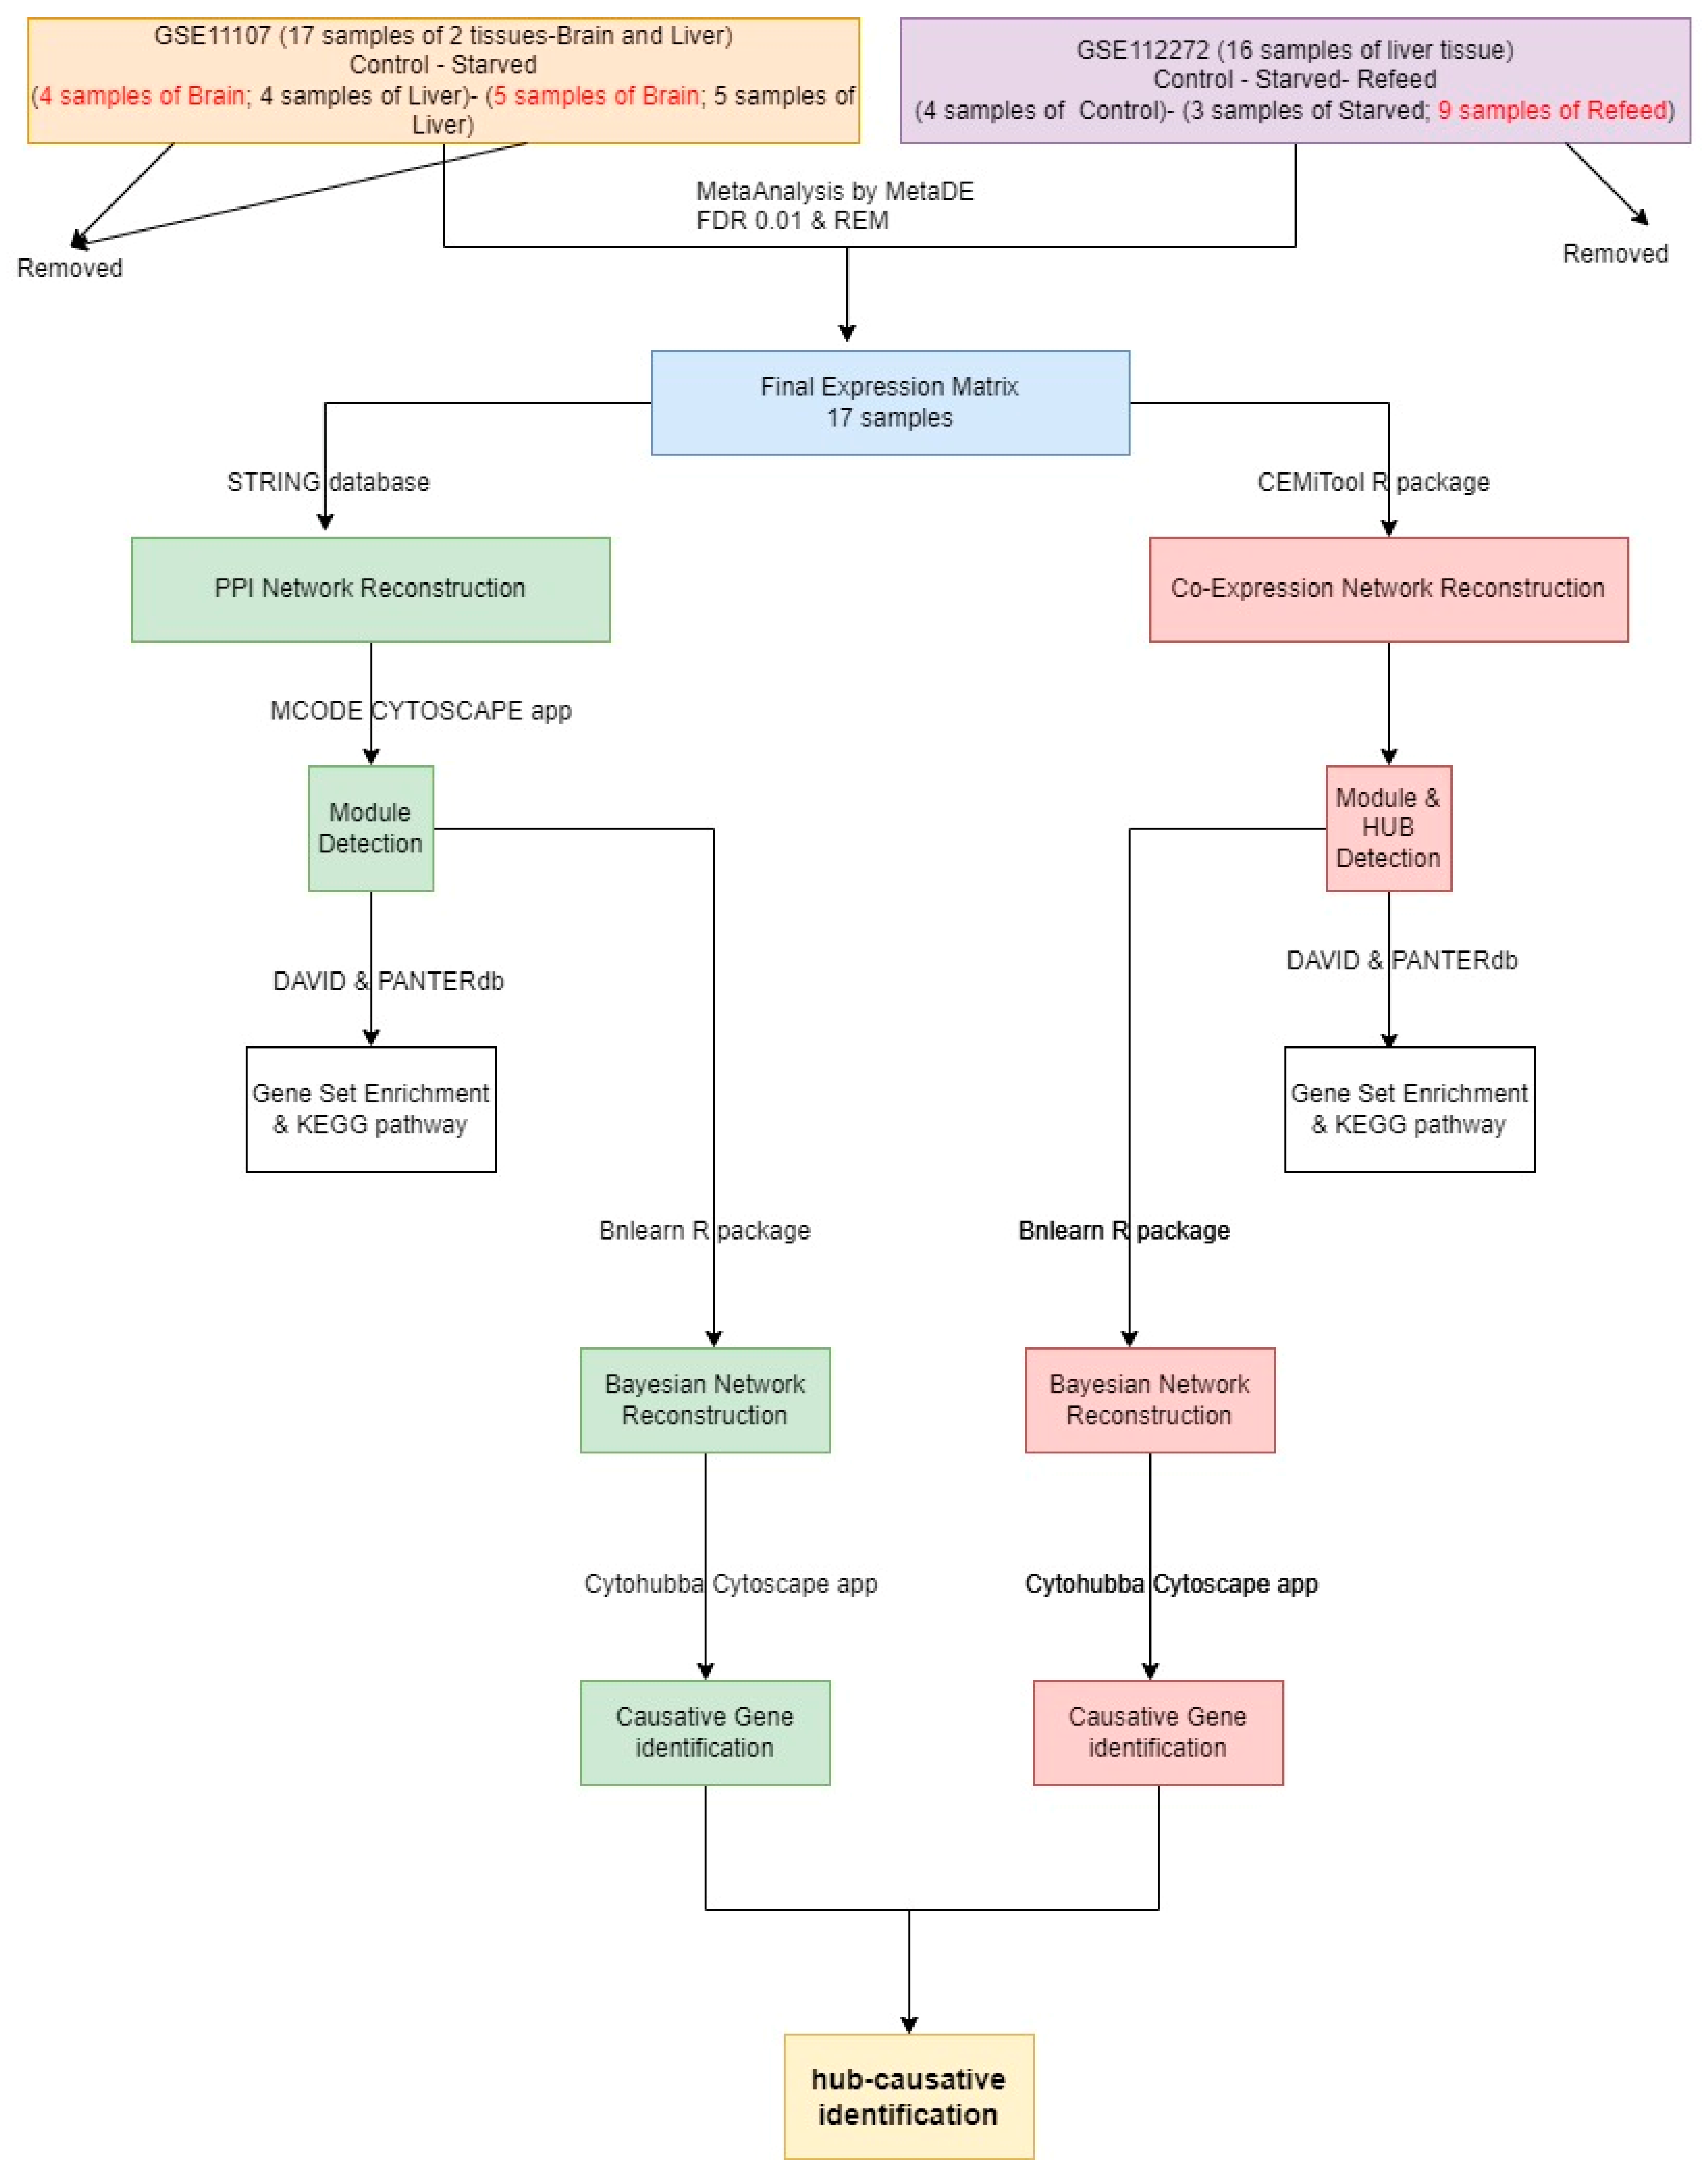
2.1. Data and Methods
2.2. Module Detection
2.3. CST Gene Detection
3. Results
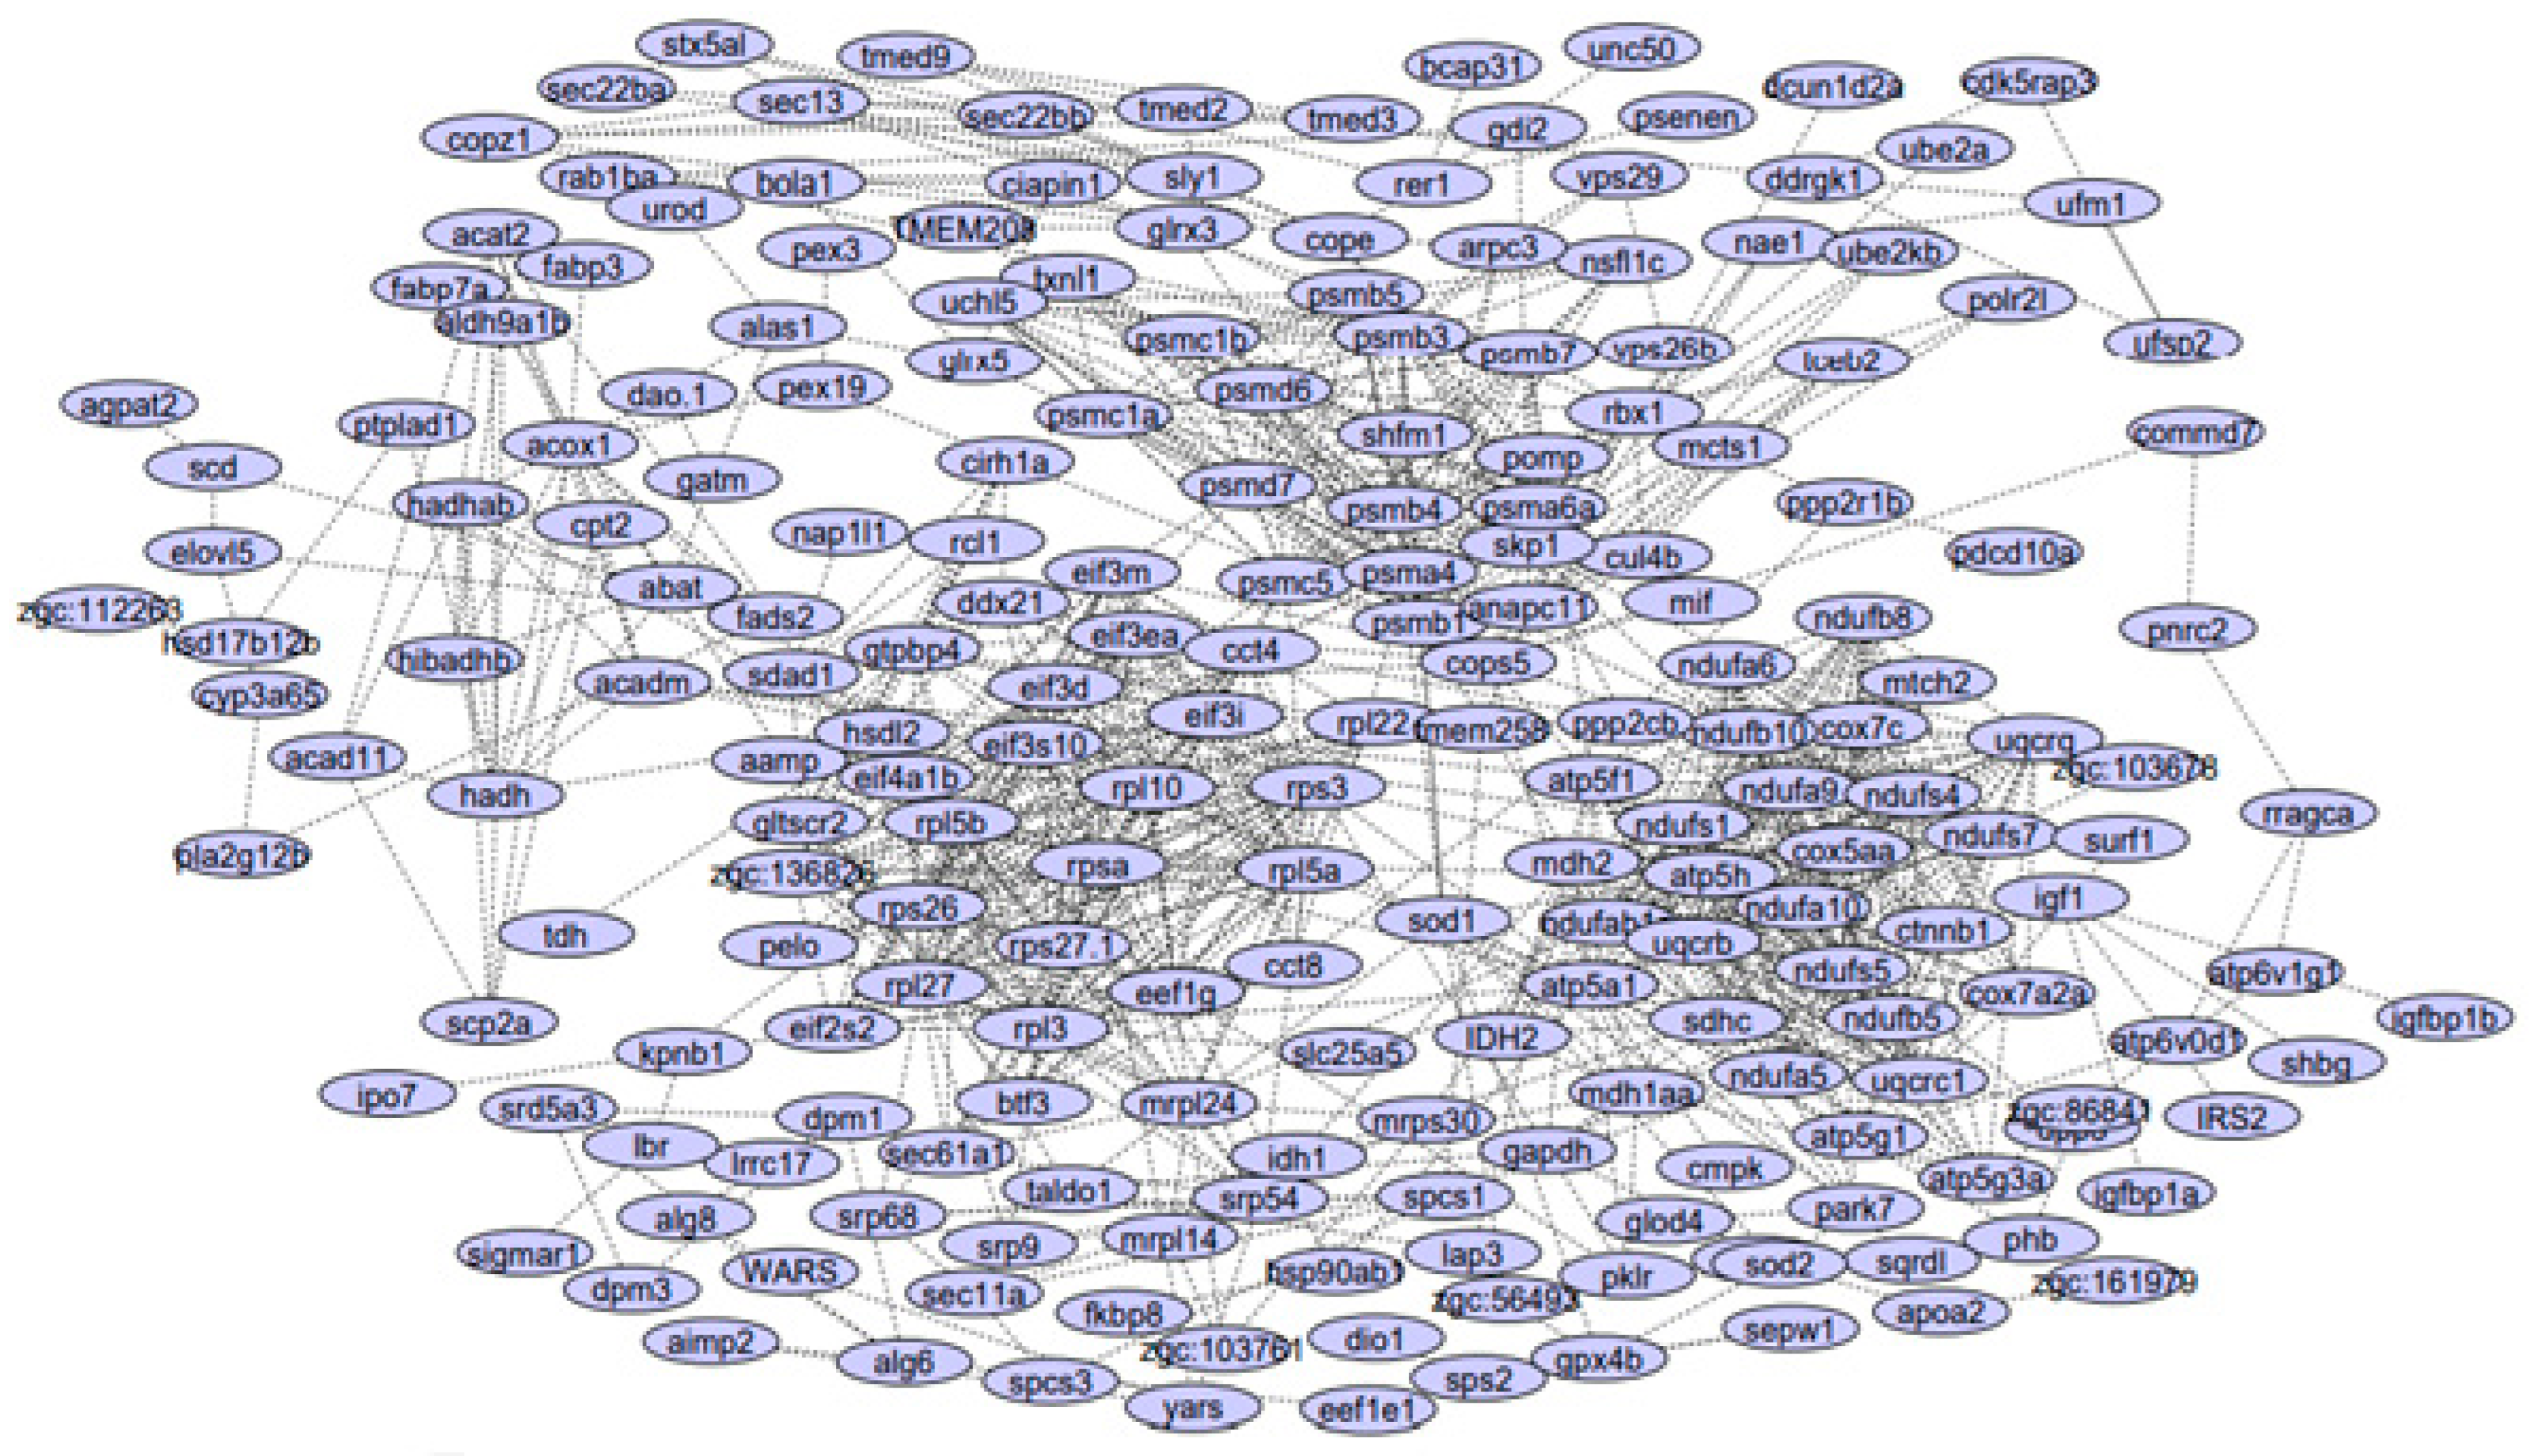
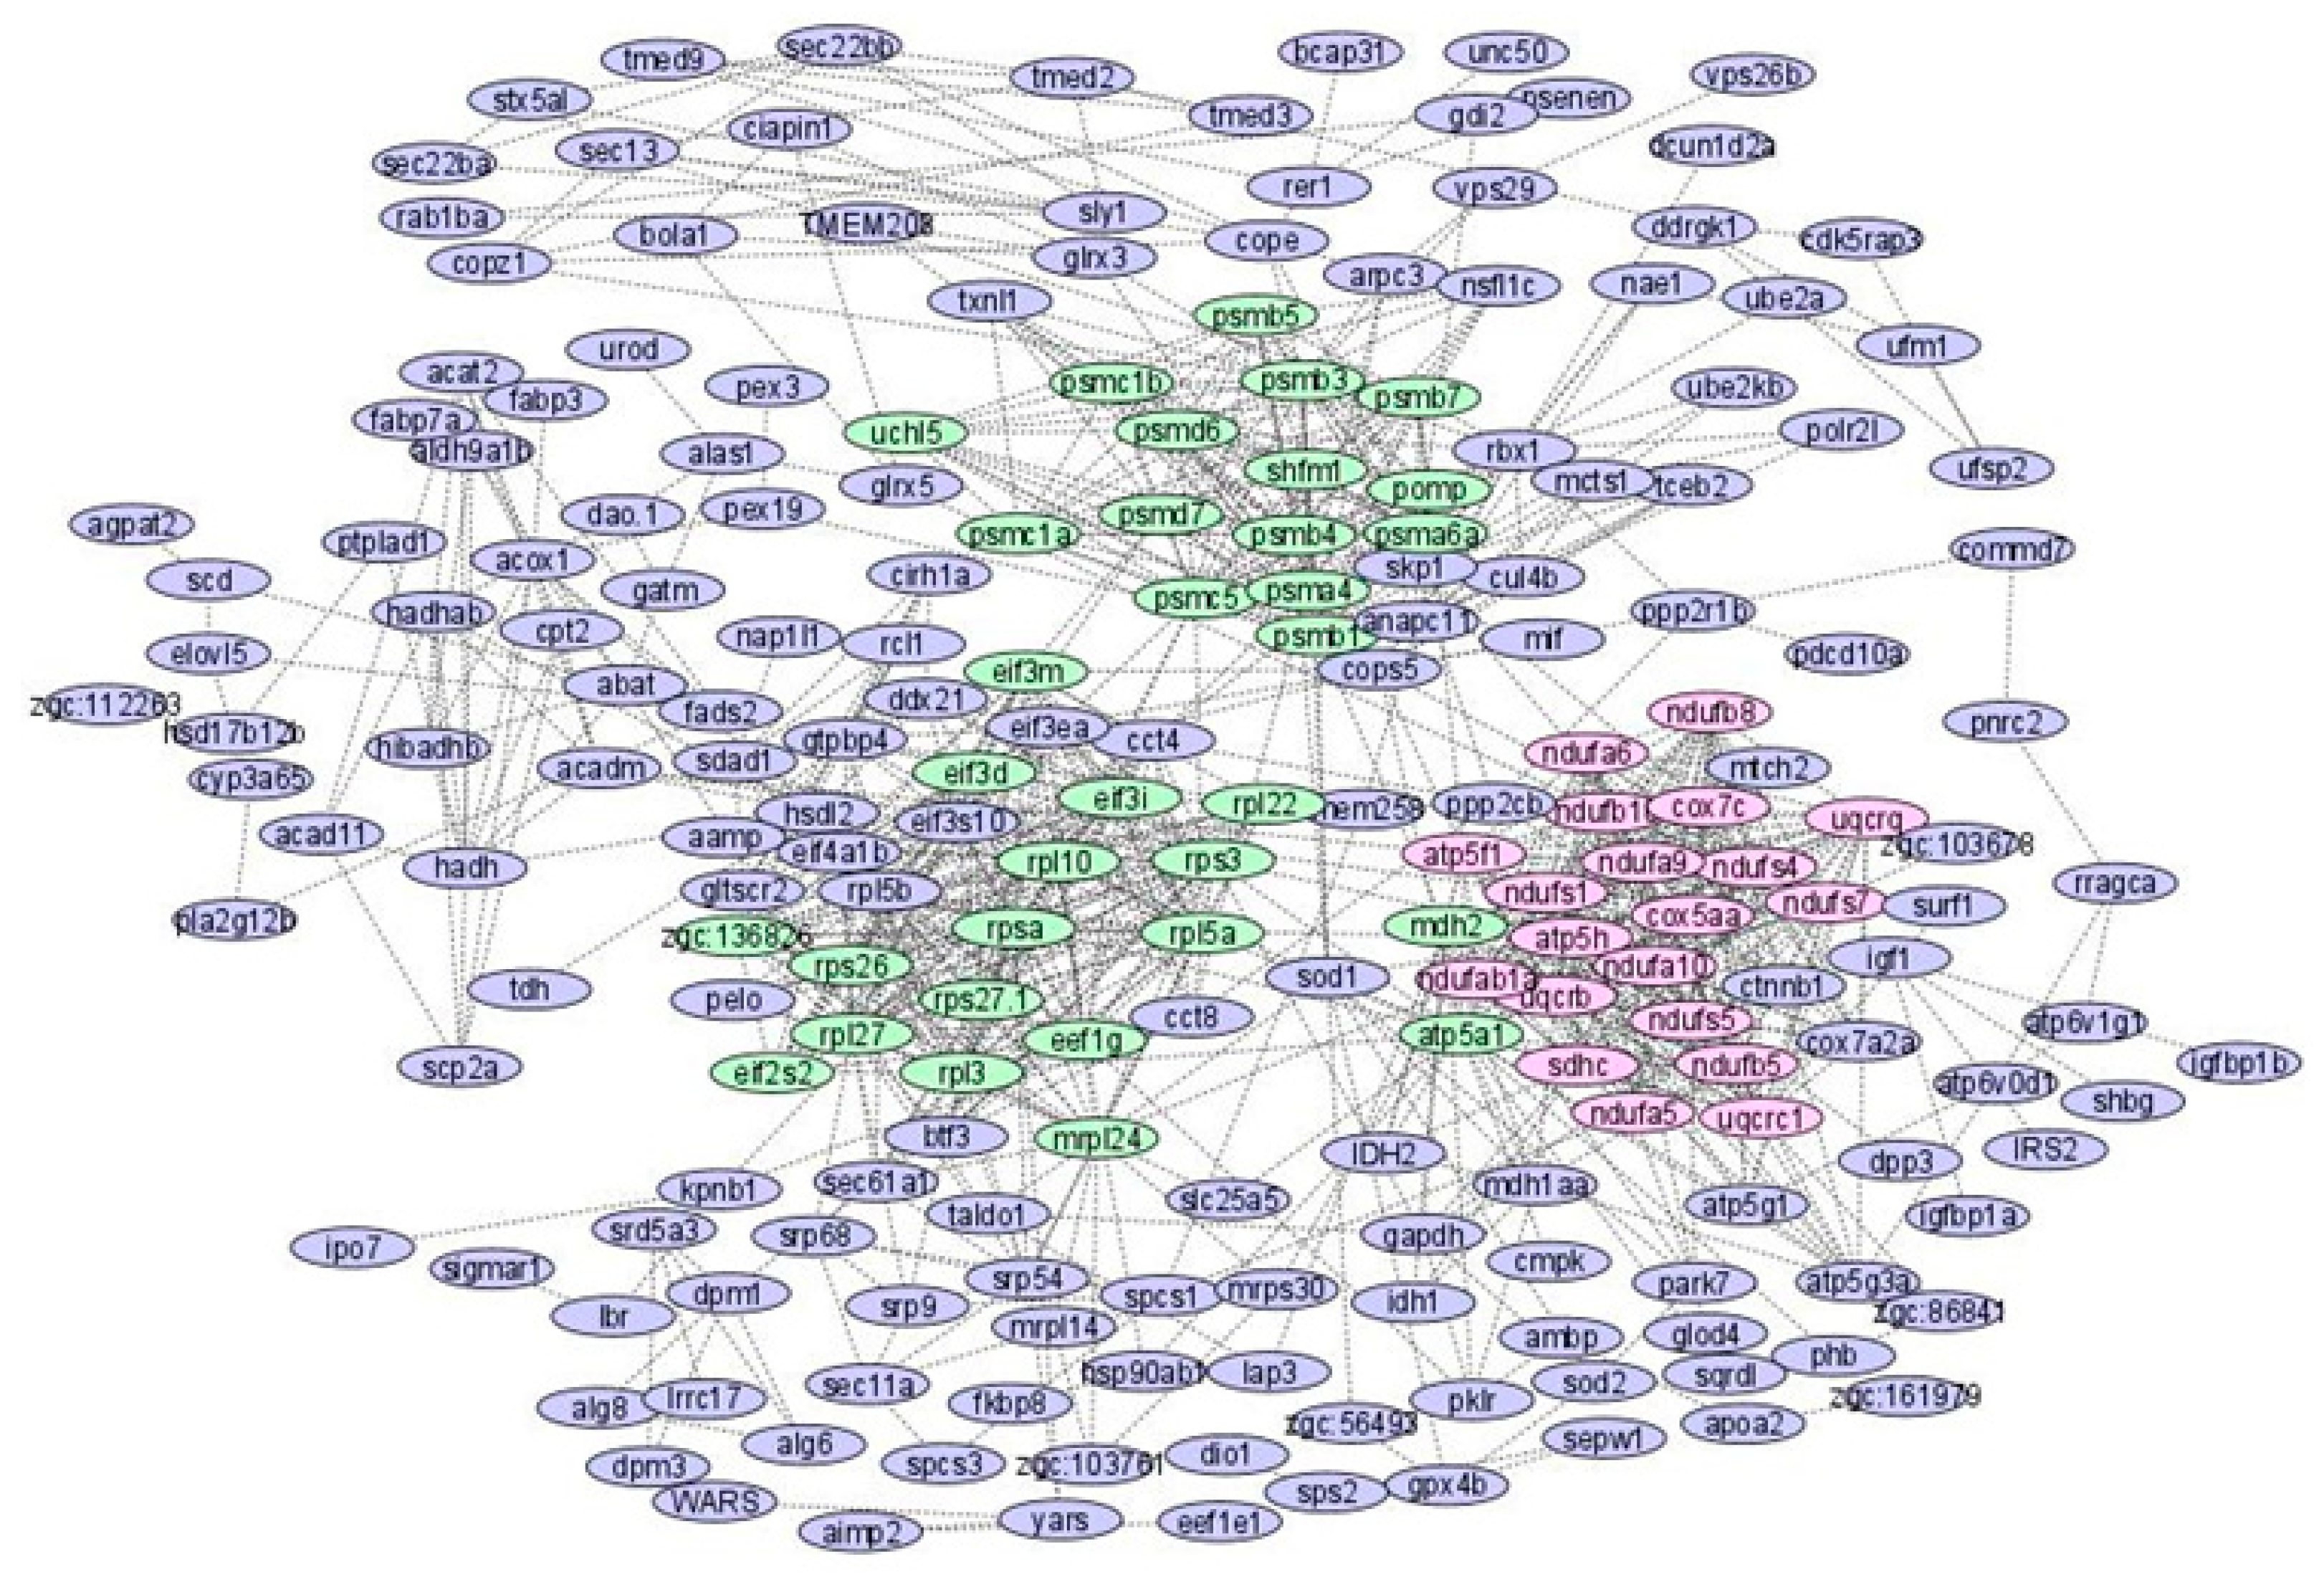
3.1. PPI Network Reconstruction
3.2. COEX Network Reconstruction
3.3. KEGG Pathway
3.4. GSEA
4. Discussion
5. Conclusions
Supplementary Materials
Author Contributions
Funding
Institutional Review Board Statement
Informed Consent Statement
Data Availability Statement
Acknowledgments
Conflicts of Interest
References
- Yarmohammadi, M.; Shabani, A.; Pourkazemi, M.; Soltanloo, H.; Imanpour, M.R.; Ramezanpour, S.; Smith-Keune, C.; Jerry, D.R. Effects of starvation and re-feeding on compensatory growth performance, plasma metabolites and igf-i gene expression of Persian Sturgeon (Acipenser Persicus, borodin 1897). Iran. J. Fish. Sci. 2013, 12, 465–483. [Google Scholar]
- Zaefarian, A.; Yeganeh, S.; Oraji, H.; Khalili, K.J. Effects of starvation and refeeding on the hematological and serum parameters and body proximate composition of Caspian salmon (Salmo trutta caspius) fingerligs. ISFJ 2016, 25, 161–173. [Google Scholar] [CrossRef]
- Yabu, T.; Imamura, S.; Mizusawa, N.; Touhata, K.; Yamashita, M. Induction of Autophagy by Amino Acid Starvation in Fish Cells. Mar. Biotechnol. 2012, 14, 491–501. [Google Scholar] [CrossRef] [Green Version]
- Ölmez, A.; Bayir, M.; Wang, C.; Bayir, A. Effects of long-term starvation and refeeding on fatty acid metabolism-related gene expressions in liver of zebrafish, Danio rerio. Turk. J. Vet. Anim. Sci. 2015, 39, 1. [Google Scholar] [CrossRef]
- Enyu, Y.-L.; Shu-Chien, A. Proteomics analysis of mitochondrial extract from liver of female zebrafish undergoing starvation and refeeding. Aquac. Nutr. 2011, 17, e413–e423. [Google Scholar] [CrossRef]
- Arslan, G.; Bayır, M.; Yağanoğlu, A.M.; Bayır, A. Changes in fatty acids, blood biochemistry and mRNA expressions of genes involved in polyunsaturated fatty acid metabolism in brown trout (Salmo trutta) during starvation and refeeding. Aquac. Res. 2021, 52, 494–504. [Google Scholar] [CrossRef]
- Sakyi, M.E.; Cai, J.; Tang, J.; Abarike, E.D.; Xia, L.; Li, P.; Kuebutornye, F.K.A.; Zou, Z.; Liang, Z.; Jian, J. Effects of starvation and subsequent re-feeding on intestinal microbiota, and metabolic responses in Nile tilapia, Oreochromis niloticus. Aquac. Rep. 2020, 17, 100370. [Google Scholar] [CrossRef]
- Jia, J.; Qin, J.; Yuan, X.; Liao, Z.; Huang, J.; Wang, B.; Sun, C.; Li, W. Microarray and metabolome analysis of hepatic response to fasting and subsequent refeeding in zebrafish (Danio rerio). BMC Genom. 2019, 20, 919. [Google Scholar] [CrossRef] [Green Version]
- Fan, X.; Hou, T.; Sun, T.; Zhu, L.; Zhang, S.; Tang, K.; Wang, Z. Starvation stress affects the maternal development and larval fitness in zebrafish (Danio rerio). Sci. Total Environ. 2019, 695, 133897. [Google Scholar] [CrossRef]
- Dar, S.A.; Srivastava, P.P.; Varghese, T.; Nazir, M.I.; Gupta, S.; Krishna, G. Temporal changes in superoxide dismutase, catalase, and heat shock protein 70 gene expression, cortisol and antioxidant enzymes activity of Labeo rohita fingerlings subjected to starvation and refeeding. Gene 2019, 692, 94–101. [Google Scholar] [CrossRef]
- Defour, M.; Hooiveld, G.J.E.J.; van Weeghel, M.; Kersten, S. Probing metabolic memory in the hepatic response to fasting. Physiol. Genom. 2020, 52, 602–617. [Google Scholar] [CrossRef] [PubMed]
- Drew, R.E.; Rodnick, K.J.; Settles, M.; Wacyk, J.; Churchill, E.; Powell, M.S.; Hardy, R.W.; Murdoch, G.K.; Hill, R.A.; Robison, B.D. Effect of starvation on transcriptomes of brain and liver in adult female zebrafish (Danio rerio). Physiol. Genom. 2008, 35, 283–295. [Google Scholar] [CrossRef] [PubMed] [Green Version]
- Favero, G.; Gimbo, R.Y.; Montoya, L.N.F.; Carneiro, D.J.; Urbinati, E.C. A fasting period during grow-out make juvenile pacu (Piaractus mesopotamicus) leaner but does not impair growth. Aquaculture 2020, 524, 735242. [Google Scholar] [CrossRef]
- Li, H.; Xu, W.; Jin, J.; Yang, Y.; Zhu, X.; Han, D.; Liu, H.; Xie, S. Effects of starvation on glucose and lipid metabolism in gibel carp (Carassius auratus gibelio var. CAS III). Aquaculture 2018, 496, 166–175. [Google Scholar] [CrossRef]
- Lu, D.; Ma, Q.; Wang, J.; Li, D.-L.; Han, S.; Limbu, S.; Chen, L.; Zhang, M.; Du, Z. Fasting enhances cold resistance in fish through stimulating lipid catabolism and autophagy. J. Physiol. 2019, 597, 1585–1603. [Google Scholar] [CrossRef] [PubMed] [Green Version]
- Qian, B.; Xue, L.; Huang, H. Liver Transcriptome Analysis of the Large Yellow Croaker (Larimichthys crocea) during Fasting by Using RNA-Seq. PLoS ONE 2016, 11, e0150240. [Google Scholar] [CrossRef]
- Rimoldi, S.; Benedito-Palos, L.; Terova, G.; Pérez-Sánchez, J. Wide-targeted gene expression infers tissue-specific molecular signatures of lipid metabolism in fed and fasted fish. Rev. Fish Biol. Fish. 2015, 26, 93–108. [Google Scholar] [CrossRef] [Green Version]
- Salem, M.; Silverstein, J.; Rexroad, C.E., 3rd; Yao, J. Effect of starvation on global gene expression and proteolysis in rainbow trout (Oncorhynchus mykiss). BMC Genom. 2007, 8, 328. [Google Scholar] [CrossRef] [Green Version]
- Waagbø, R.; Jørgensen, S.M.; Timmerhaus, G.; Breck, O.; Olsvik, P.A. Short-term starvation at low temperature prior to harvest does not impact the health and acute stress response of adult Atlantic salmon. PeerJ 2017, 5, e3273. [Google Scholar] [CrossRef] [Green Version]
- Yarmohammadi, M.; Pourkazemi, M.; Kazemi, R.; PouraliFashtami, H.R.; YazdaniSadati, M.A.; Yeganeh, H. The effect of starvation on growth performance, blood serum metabolites and insulin of Persian sturgeon juvenile, Acipenser persicus (Borodin, 1897) during compensatory growth. JAIR 2015, 3, 65–80. [Google Scholar]
- Zhu, Q.; Song, H.; Zhang, Y.; Chen, R.; Tian, L.; Xu, D. Effects of cold stress and starvation on the liver of yellow drum Nibea albiflora: Histological alterations and transcriptomic analysis. Aquac. Environ. Interact. 2020, 12, 359–369. [Google Scholar] [CrossRef]
- Russo, P.S.T.; Ferreira, G.R.; Cardozo, L.E.; Bürger, M.C.; Arias-Carrasco, R.; Maruyama, S.R.; Hirata, T.D.C.; Lima, D.S.; Passos, F.M.; Fukutani, K.F.; et al. CEMiTool: A Bioconductor package for performing comprehensive modular co-expression analyses. BMC Bioinform. 2018, 19, 56. [Google Scholar] [CrossRef] [PubMed]
- Fuller, T.F.; Ghazalpour, A.; Aten, J.E.; Drake, T.A.; Lusis, A.J.; Horvath, S. Weighted gene coexpression network analysis strategies applied to mouse weight. Mamm. Genome 2007, 18, 463–472. [Google Scholar] [CrossRef] [Green Version]
- Scutari, M. Bayesian network constraint-based structure learning algorithms: Parallel and optimised implementations in the bnlearn R package. arXiv 2014, arXiv:1406.7648. [Google Scholar]
- Kondo, H.; Sano, H.; Wang, Y.; Kawase, J.; Shimanoki, E.; Jirapongpairoj, W.; Nozaki, R.; Hirono, I. Starvation–refeeding causes cellular stress responses in the gut and liver of Masu salmon Oncorhynchus masou masou. Fish. Sci. 2020, 86, 1037–1042. [Google Scholar] [CrossRef]
- Jawahar, J.; McCumber, A.; Lickwar, C.; Amoroso, C.; Canny, S.; Wong, S.; Morash, M.; Thierer, J.H.; Farber, S.A.; Bohannan, B.J.M.; et al. Starvation causes changes in the intestinal transcriptome and microbiome that are reversed upon refeeding. BMC Genom. 2020, 23, 225. [Google Scholar] [CrossRef]
- Koven, W.; Schulte, P. The effect of fasting and refeeding on mRNA expression of PepT1 and gastrointestinal hormones regulating digestion and food intake in zebrafish (Danio rerio). Fish Physiol. Biochem. 2012, 38, 1565–1575. [Google Scholar] [CrossRef]
- Pan, Y.; Tao, J.; Zhou, J.; Cheng, J.; Chen, Y.; Xiang, J.; Bao, L.; Zhu, X.; Zhang, J.; Chu, W. Effect of starvation on the antioxidative pathway, autophagy, and mitochondrial function in the intestine of Chinese perch Siniperca chuatsi. Aquaculture 2021, 548, 737683. [Google Scholar] [CrossRef]
- Zhou, R.; Wu, G.; Qu, L.; Zhong, X.; Gao, Y.; Ding, Z.; Xu, J.; Chen, X.; Cheng, H. Effect of starvation on intestinal morphology, digestive enzyme activity and expression of lipid metabolism-related genes in javelin goby (Synechogobius hasta). Aquac. Res. 2021, 53, 87–97. [Google Scholar] [CrossRef]
- Liao, K.; Meng, R.; Ran, Z.; Cheng, G.; Wang, Y.; Xu, J.; Xu, S.; Yan, X. Short-term starvation in silver pomfret (Pampus argenteus): Molecular effects on lipid mobilization and utilization. Aquac. Res. 2017, 48, 4874–4885. [Google Scholar] [CrossRef]
- Silva-Marrero, J.I.; Sáez, A.; Caballero-Solares, A.; Viegas, I.; Almajano, M.P.; Fernández, F.; Baanante, I.V.; Metón, I. A transcriptomic approach to study the effect of long-term starvation and diet composition on the expression of mitochondrial oxidative phosphorylation genes in gilthead sea bream (Sparus aurata). BMC Genom. 2017, 18, 1–16. [Google Scholar] [CrossRef] [Green Version]
- Wu, P.; Wang, A.; Cheng, J.; Chen, L.; Pan, Y.; Li, H.; Zhang, Q.; Zhang, J.; Chu, W.; Zhang, J. Effects of Starvation on Antioxidant-Related Signaling Molecules, Oxidative Stress, and Autophagy in Juvenile Chinese Perch Skeletal Muscle. Mar. Biotechnol. 2020, 22, 81–93. [Google Scholar] [CrossRef]
- Cleveland, B.M.; Weber, G.M.; Blemings, K.P.; Silverstein, J.T. Insulin-like growth factor-I and genetic effects on indexes of protein degradation in response to feed deprivation in rainbow trout (Oncorhynchus mykiss). Am. J. Physiol. Integr. Comp. Physiol. 2009, 297, R1332–R1342. [Google Scholar] [CrossRef] [PubMed]
- Del Vecchio, G.; Lai, F.; Gomes, A.S.; Verri, T.; Kalananthan, T.; Barca, A.; Handeland, S.; Rønnestad, I. Effects of Short-Term Fasting on mRNA Expression of Ghrelin and the Peptide Transporters PepT1 and 2 in Atlantic Salmon (Salmo salar). Front. Physiol. 2021, 12, 821. [Google Scholar] [CrossRef]
- Orozco, Z.G.A.; Soma, S.; Kaneko, T.; Watanabe, S. Spatial mRNA Expression and Response to Fasting and Refeeding of Neutral Amino Acid Transporters slc6a18 and slc6a19a in the Intestinal Epithelium of Mozambique tilapia. Front. Physiol. 2018, 9, 212. [Google Scholar] [CrossRef] [Green Version]
- Xu, H.; Fan, S.-Q.; Wang, G.; Miao, X.-M.; Li, Y. Transcriptome analysis reveals the importance of exogenous nutrition in regulating antioxidant defenses during the mouth-opening stage in oviparous fish. Fish Physiol. Biochem. 2021, 47, 1087–1103. [Google Scholar] [CrossRef]
- Lo Cascio, P.; Calabrò, C.; Bertuccio, C.; Paterniti, I.; Palombieri, D.; Calò, M.; Albergamo, A.; Salvo, A.; Denaro, M.G. Effects of fasting and refeeding on the digestive tract of zebrafish (Danio rerio) fed with Spirulina (Arthrospira platensis), a high protein feed source. Nat. Prod. Res. 2017, 31, 1478–1485. [Google Scholar] [CrossRef]
- Davis, S.; Meltzer, P.S. GEOquery: A bridge between the Gene Expression Omnibus (GEO) and BioConductor. Bioinformatics 2007, 23, 1846–1847. [Google Scholar] [CrossRef] [PubMed] [Green Version]
- Wang, X.; Kang, D.D.; Shen, K.; Song, C.; Lu, S.; Chang, L.-C.; Liao, S.G.; Huo, Z.; Tang, S.; Ding, Y.; et al. An R package suite for microarray meta-analysis in quality control, differentially expressed gene analysis and pathway enrichment detection. Bioinformatics 2012, 28, 2534–2536. [Google Scholar] [CrossRef] [Green Version]
- Griss, J.; Viteri, G.; Sidiropoulos, K.; Nguyen, V.; Fabregat, A.; Hermjakob, H. ReactomeGSA—Efficient Multi-Omics Comparative Pathway Analysis. Mol. Cell. Proteom. 2020, 19, 2115–2125. [Google Scholar] [CrossRef] [PubMed]
- Bader, G.D.; Hogue, C.W.V. An automated method for finding molecular complexes in large protein interaction networks. BMC Bioinform. 2003, 4, 2–27. [Google Scholar] [CrossRef] [Green Version]
- Heberle, H.; Meirelles, G.V.; Da Silva, F.R.; Telles, G.P.; Minghim, R. InteractiVenn: A Web-Based Tool for the Analysis of Sets through Venn Diagrams. BMC Bioinform. 2015, 16, 169. [Google Scholar] [CrossRef] [PubMed] [Green Version]
- Chin, C.-H.; Chen, S.-H.; Wu, H.-H.; Ho, C.-W.; Ko, M.-T.; Lin, C.-Y. cytoHubba: Identifying hub objects and sub-networks from complex interactome. BMC Syst. Biol. 2014, 8, S11. [Google Scholar] [CrossRef]
- Shannon, P.; Markiel, A.; Ozier, O.; Baliga, N.S.; Wang, J.T.; Ramage, D.; Amin, N.; Schwikowski, B.; Ideker, T. Cytoscape: A software environment for integrated models of Biomolecular Interaction Networks. Genome Res. 2003, 13, 2498–2504. [Google Scholar] [CrossRef] [PubMed]
- Huang, D.W.; Sherman, B.T.; Lempicki, R.A. Systematic and integrative analysis of large gene lists using DAVID bioinformatics resources. Nat. Protoc. 2009, 4, 44–57. [Google Scholar] [CrossRef]
- Mi, H.; Huang, X.; Muruganujan, A.; Tang, H.; Mills, C.; Kang, D.; Thomas, P.D. PANTHER version 11: Expanded annotation data from Gene Ontology and Reactome pathways, and data analysis tool enhancements. Nucleic Acids Res. 2016, 45, D183–D189. [Google Scholar] [CrossRef] [PubMed] [Green Version]
- Panagiotou, O.A.; Willer, C.J.; Hirschhorn, J.N.; Ioannidis, J.P. The Power of Meta-Analysis in Genome-Wide Association Studies. Annu. Rev. Genom. Hum. Genet. 2013, 14, 441–465. [Google Scholar] [CrossRef] [Green Version]
- Tao, J.; Hao, Y.; Li, X.; Yin, H.; Nie, X.; Zhang, J.; Xu, B.; Chen, Q.; Li, B. Systematic Identification of Housekeeping Genes Possibly Used as References in Caenorhabditis elegans by Large-Scale Data Integration. Cells 2020, 9, 786. [Google Scholar] [CrossRef] [Green Version]
- Sprague, J.; Bayraktaroglu, L.; Clements, D.; Conlin, T.; Fashena, D.; Frazer, K.; Haendel, M.; Howe, D.G.; Mani, P.; Ramachandran, S.; et al. The Zebrafish Information Network: The zebrafish model organism database. Nucleic Acids Res. 2006, 34, D581–D585. [Google Scholar] [CrossRef] [Green Version]
- Gerlai, R. Zebra Fish: An Uncharted Behavior Genetic Model. Behav. Genet. 2003, 33, 461–468. [Google Scholar] [CrossRef]
- Zhou, X.; Liao, W.-J.; Liao, J.-M.; Liao, P.; Lu, H. Ribosomal proteins: Functions beyond the ribosome. J. Mol. Cell Biol. 2015, 7, 92–104. [Google Scholar] [CrossRef] [PubMed] [Green Version]
- Joo, Y.J.; Kim, J.-H.; Kang, U.-B.; Yu, M.-H.; Kim, J. Gcn4p-mediated transcriptional repression of ribosomal protein genes under amino-acid starvation. EMBO J. 2010, 30, 859–872. [Google Scholar] [CrossRef] [PubMed]
- Hong, S.-H.; Ahmadian, M.; Yu, R.T.; Atkins, A.R.; Downes, M.; Evans, R.M. Nuclear receptors and metabolism: From feast to famine. Diabetologia 2014, 57, 860–867. [Google Scholar] [CrossRef] [PubMed]
- Mohapatra, S.; Chakraborty, T.; Reza, M.A.N.; Shimizu, S.; Matsubara, T.; Ohta, K. Short-term starvation and realimentation helps stave off Edwardsiella tarda infection in red sea bream (Pagrus major). Comp. Biochem. Physiol. Part B Biochem. Mol. Biol. 2017, 206, 42–53. [Google Scholar] [CrossRef]


| Reference | Fish | Tissue | Duration | Platform | Endpoints |
|---|---|---|---|---|---|
| [18] | Rain bow trout | Liver | 21 d | DNA microarray+ RT-PCR | Upregulation of 20S proteasome and calpain |
| [12] (GSE11107) | Zebrafish | Liver+ Brain | 21 d | DNA microarray + qRT-PCR | Downregulation of metabolic activity, lipid metabolism, protein biosynthesis, proteolysis, cellular respiration and increased gluconeogenesis genes |
| [8] (GSE112272) | Zebrafish | Liver | 21 d + 15 d refeeding | DNA microarray | Upregulation of TCA cycle and oxidative phosphorylation processes |
| [26] (GSE87704) | Zebrafish | Intestine | 21 d | RNA-seq | Upregulation of ribosome biogenesis; downregulation of antiviral immunity and lipid transport genes |
| [27] | Zebrafish | Gastrointestinal | 1, 2 & 5 d | DNA microarray + qRT-PCR | Downregulation of CCK, GRP and GHR |
| [30] | Zebrafish | Kidney | 21 d | qRT-PCR | Upregulation of oxidative stress, catalase and superoxide dismutase genes |
| [29] | S. hasta specimens | Intestine | 3, 7 & 14 d | qRT-PCR | Downregulation of stearoyl-CoA desaturase 1 diminishing lipid biosynthesis, as well as upregulation of lipolysis and fatty acid transport. |
| [31] | Gilthead sea bream (Sparus aurata) | Liver and skeletal muscle | 23 d | RNA-seq | Upregulation of OXPHOS, cytochrome c oxidase families and SLC25A6 |
| [28] | Chinese perch Siniperca chuatsi | Intestine | 0, 7, and 14 d | RT–qPCR | Upregulation of ROS and MDA |
| [7] | Nile tilapia, Oreochromis niloticus | Intestine | 14 and 21 d | RT–qPCR | Upregulation of antioxidant gene expression; downregulation of leptin |
| [4] | Zebrafish | Liver | 70 d | RT-PCR | Downregulation of genes involved in fatty acid metabolism (elovl5, fads2, cpt1-β, acox1, acadvl, fabp1a and fabp7a) |
| [25] | Masu salmon | Liver and gut | 3 d | RT–qPCR | DEG involved in fatty acid and carbohydrate metabolism |
| [6] | Brown trout | Blood | 42 d | RT–PCR | Downregulation of genes involved in the elongation, desaturation and fatty acid oxidation pathways (except Δ6fadc); upregulation of pparα, pparγ and pparß |
| [32] | Chinese perch | Muscle | 2 & 5 d | RT–qPCR | Upregulation of antioxidant-related signaling genes, Nrf2 and S6K; downregulation of Keap1 |
| [33] | Rainbow trout | Muscle | 21 d | RT–qPCR | Upregulation of genes in the ubiquitin-proteasome, lysosomal, and calpain- and caspase-dependent pathways |
| [34] | Atlantic Salmon | Gastrointestinal tract | 4 d | RT-qPCR | Downregulation slc15a1a and slc15a1b and with significantly lowered slc15a1a |
| [35] | Mozambique tilapia | Intestine | 14 d | RT-qPCR | Downregulation of slc6a19a expression |
| [36] | Zebrafish | Larvae | 3 d | RNA-seq | DEG of growth regulation (i.e., DNA replication and cell cycle), energy metabolism (i.e., glycolysis/gluconeogenesis and fatty acid metabolism) and antioxidant defenses |
| [37] | Zebrafish | Intestine and gut | 2 & 5 d | Western blot | Downregulation of PepT1 and CCK8 |
| Datasets | Samples | Tissue | Species | Platform | Number *** | Reference |
|---|---|---|---|---|---|---|
| GSE11107 * | GSM280434-GSM280443 | Liver | Zebrafish | GPL1319 affymetrix | 10 (5/5) | [12] |
| GSE112272 ** | GSM3064825-GSM3064831 | Liver | Zebrafish | GPL14664 Agilent | 16(4/3) | [8] |
| Module 1 | ndufb10, ndufa9, uqcrb, uqcrq, ndufa6, cox7c, ndufa10, atp5h, uqcrc1, sdhc, ndufs4, ndufs1, ndufab1a, ndufs7, ndufs5, atp5f1, ndufb8, ndufb5, cox5aa, ndufa5 |
| Module 2 | psmd6, psma4, eif3d, rps3, shfm1, atp5a1, psmb3, mdh2, psmb5, psmb7, eef1g, pomp, psmd7, rpl27, psmb1, uchl5, psmc5, eif3m, rpl3, eif3i, rps27.1, rpl5a, eif2s2, psmb4, rpl22, rpl10, rpsa, psmc1a, mrpl24, rps26, psmc1b, zgc:136826, psma6a |
| Module 3 | spcs1, srp9, srp68, sec11a |
| Module 4 | tecb2, anapc11, cops5, cul4b |
| Module 5 | ufsp2, cdk5rap3, ddrgk1, ufm1 |
| Module 6 | eif4a1b, eif3s10, eif3ea |
| Module 7 | sdad1, gtpbp4, ddx21 |
| Module 8 | cirh1a, gltscr2, rcl1 |
| Module 9 | abat, aldh9a1b, hibadhb |
| Module 10 | stx5al, sec22bb, sec22ba |
| Module 11 | gpx4b, zgc:56493, sod2 |
| Module 12 | zgc:103761, mrpl14, mrps30 |
| Module 13 | mtx2, dnajc11, chchd3 |
| Module 14 | gatm, bola1, glrx5, dao.1, ciapin1, alas1 |
| Method | Hub/CST genes |
|---|---|
| PPI network | |
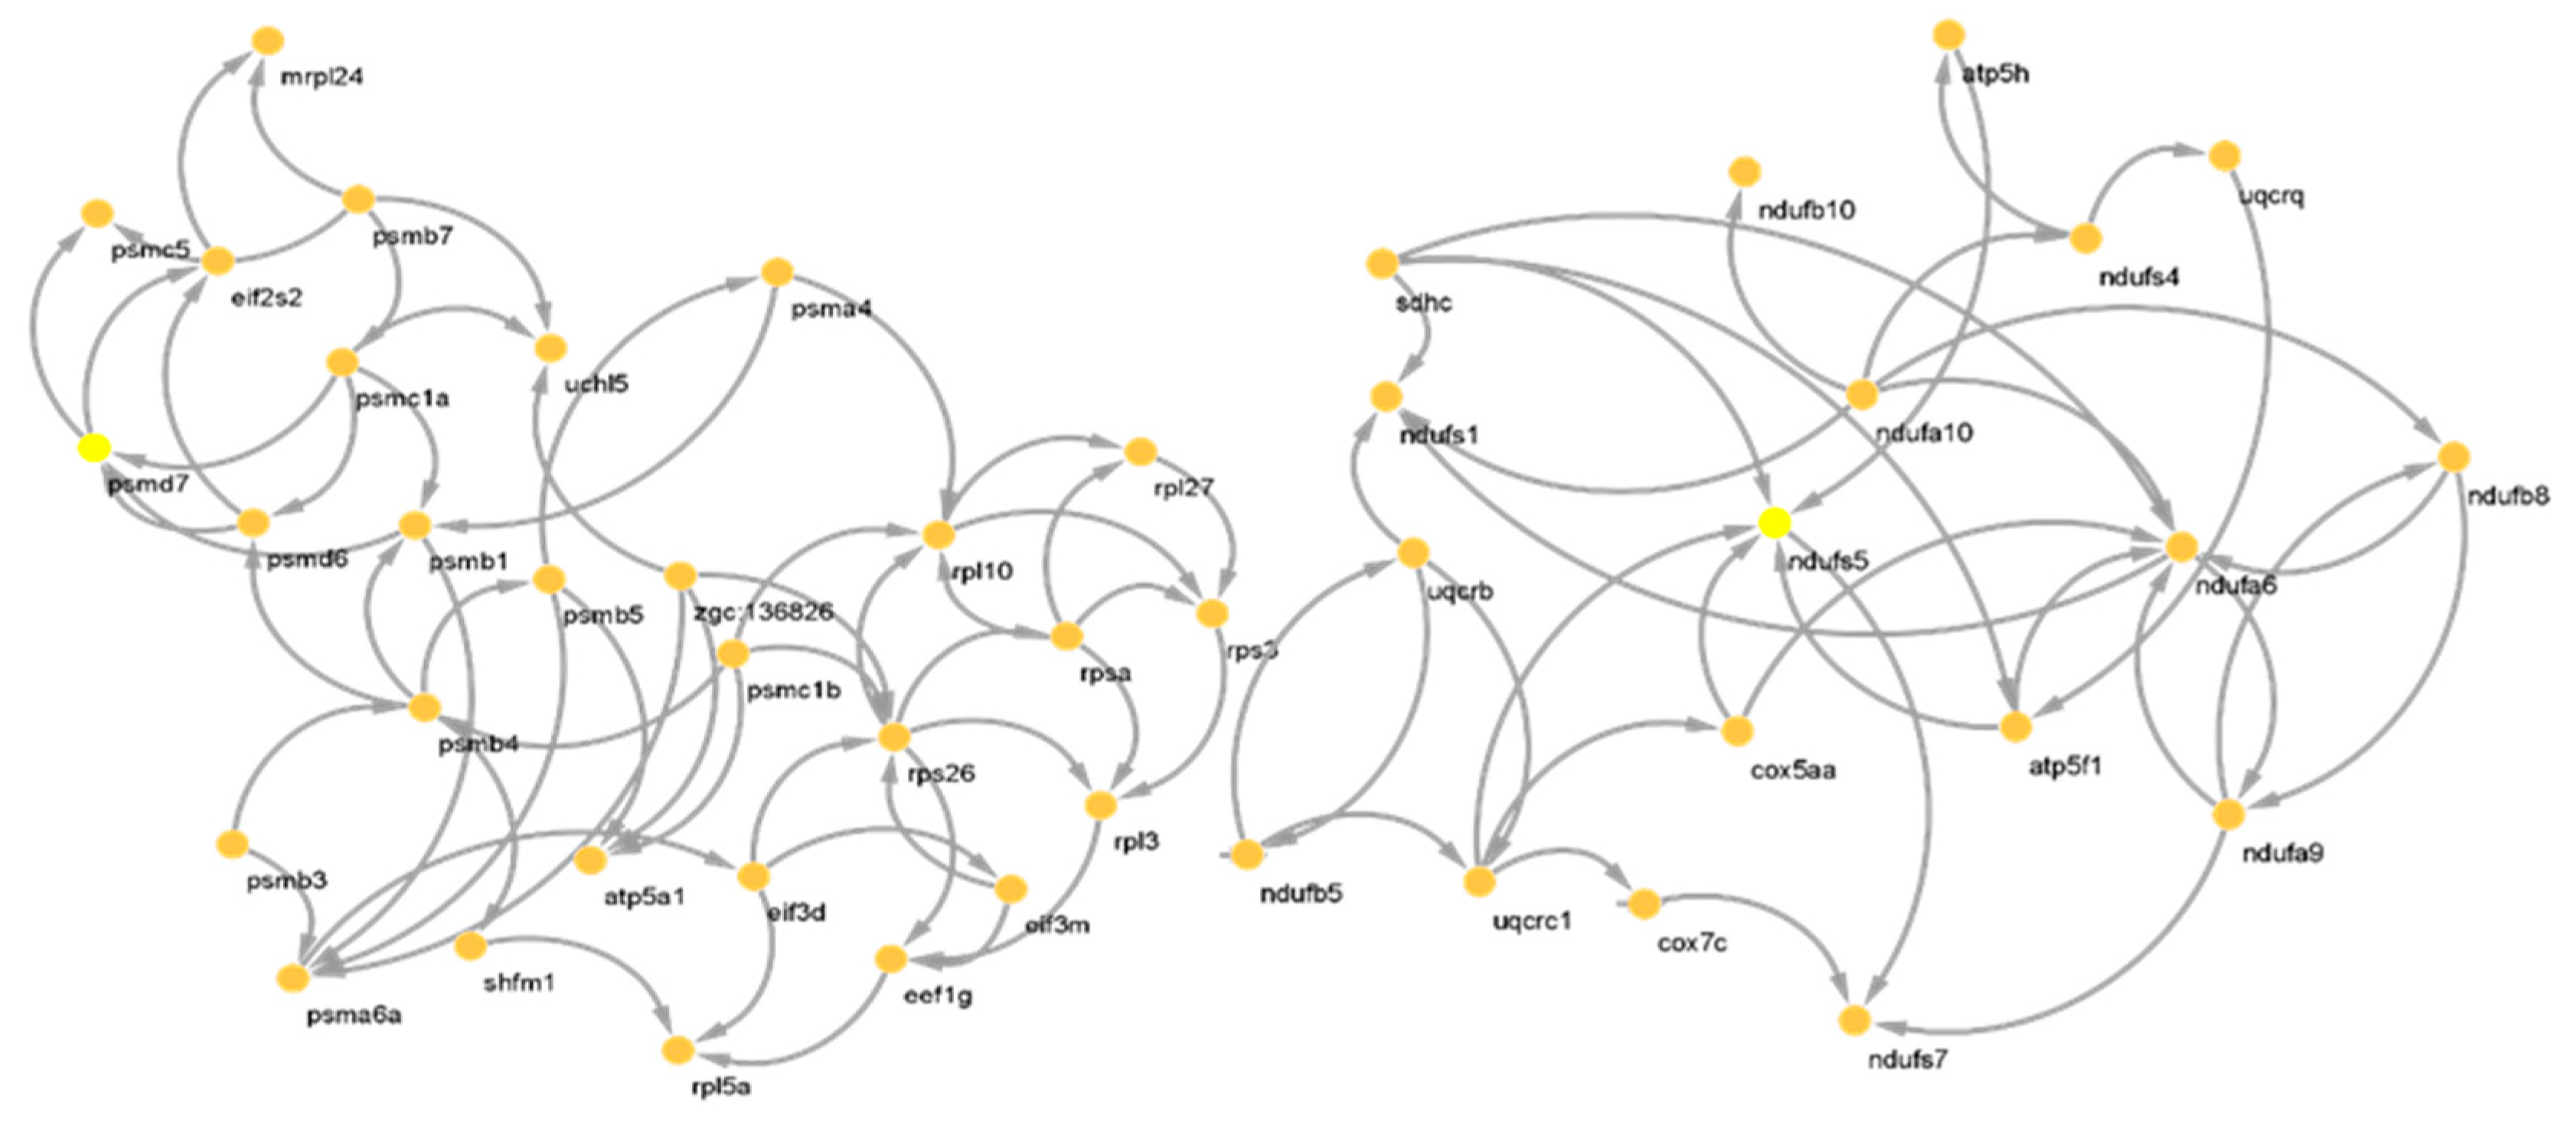
| CST of M1 | ndufa6,ndufs5, uqcrc1,ndufa10, atp5f1, ndufs1, sdhc, uqcrb,ndufb8, ndufs7 |
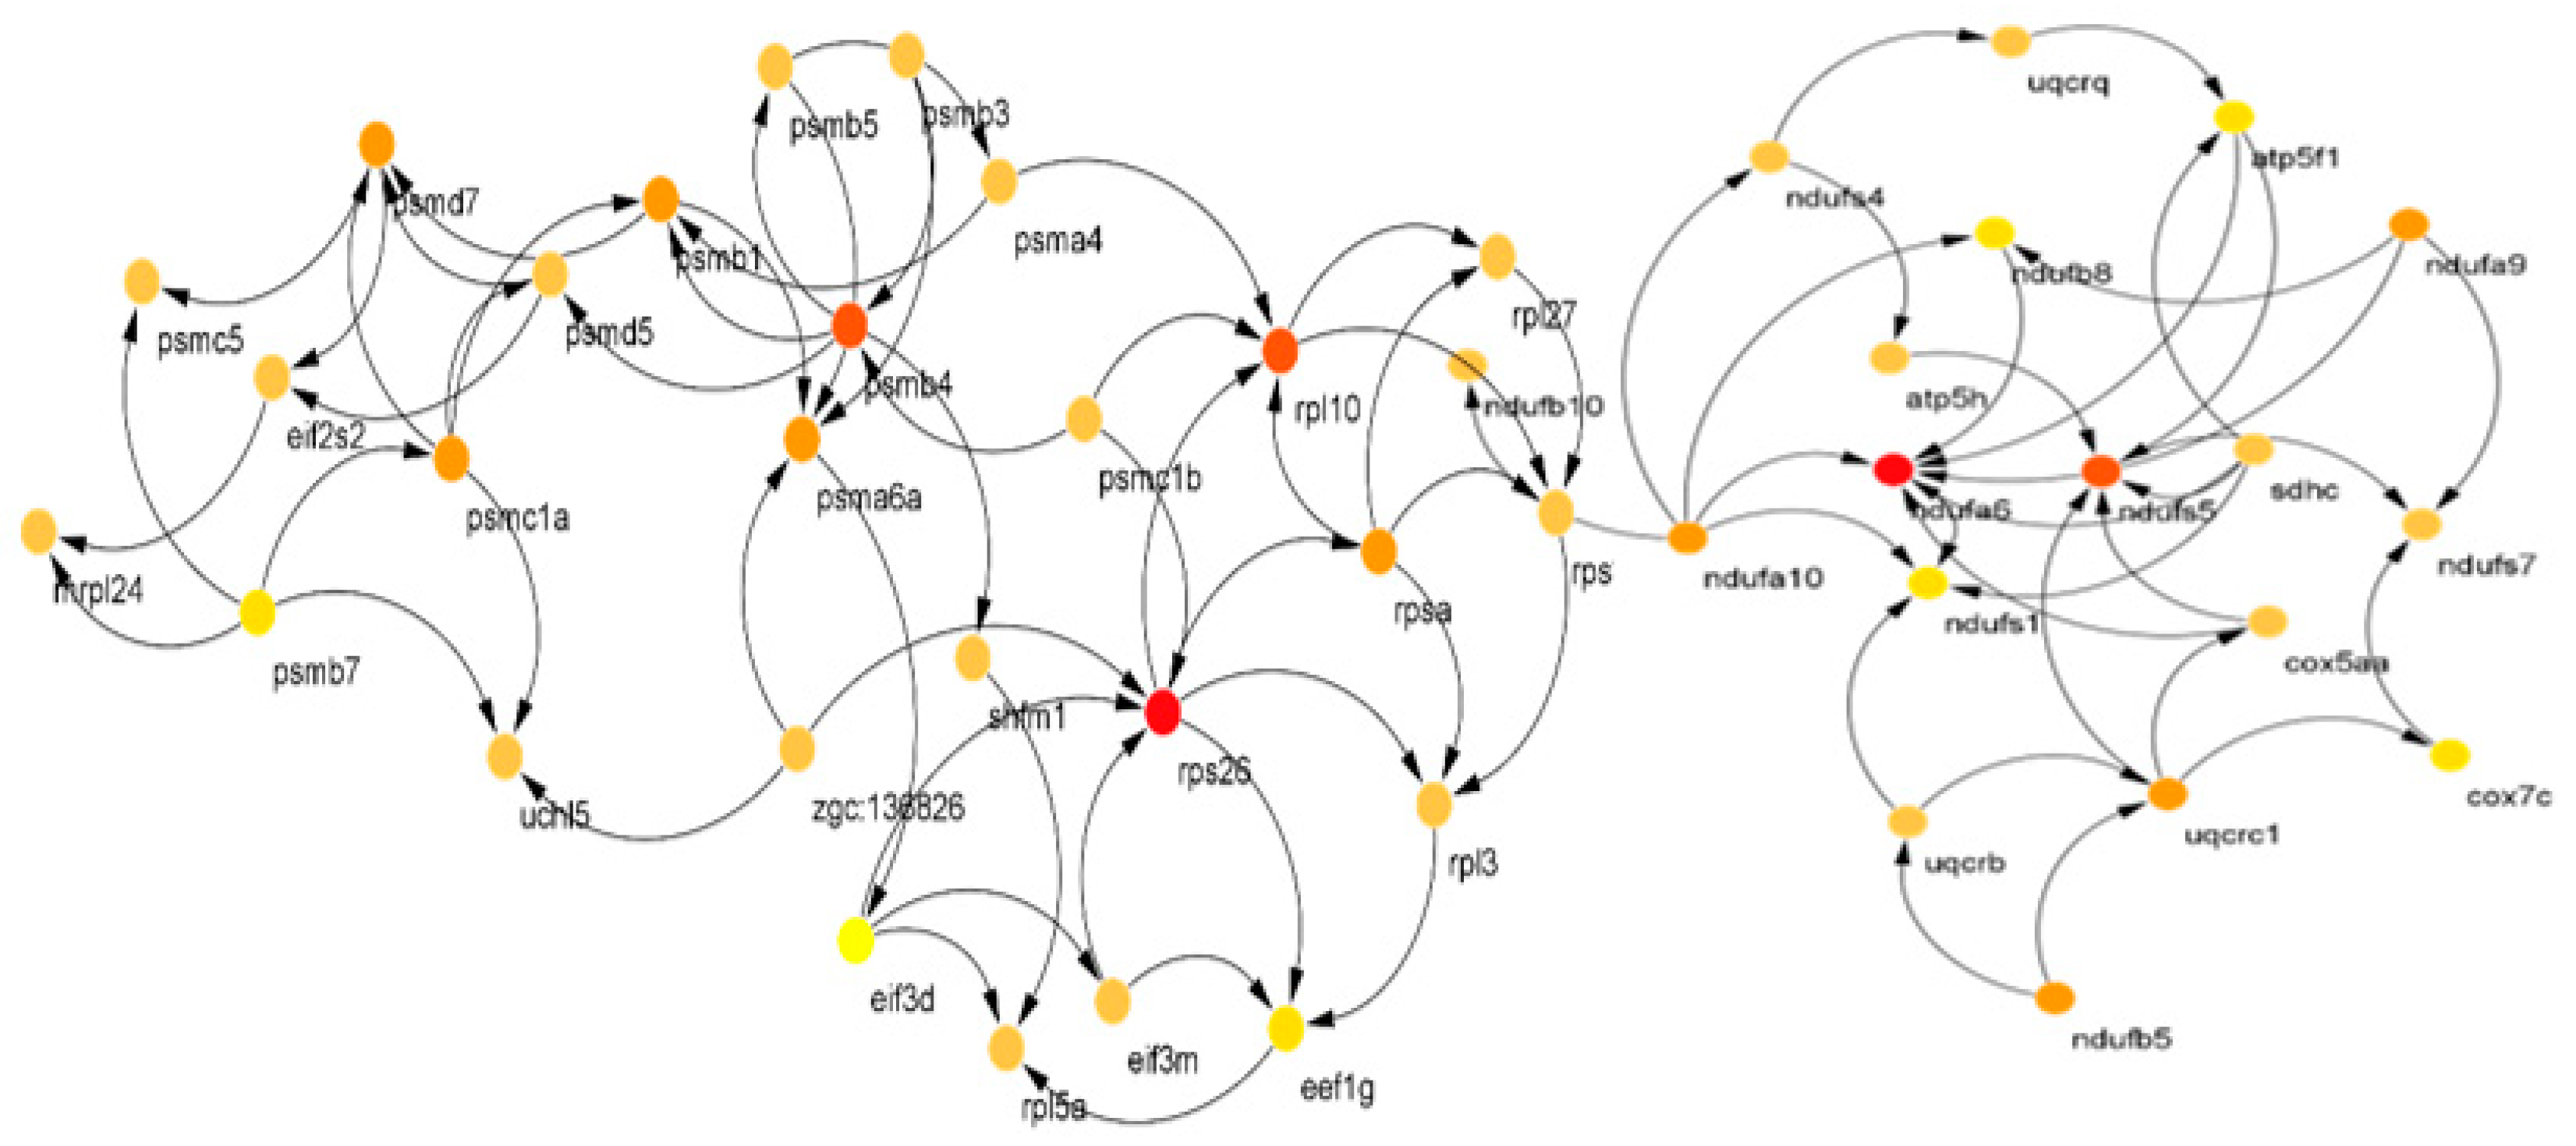
| CST of M2 | rps26,rpl10, psmb4, psmc1a, psmb1, psmd7, psma6a, rpsa, psmb7, eef1g |
| Coexpression network | |
| By CEMiTool (adjacency) | |
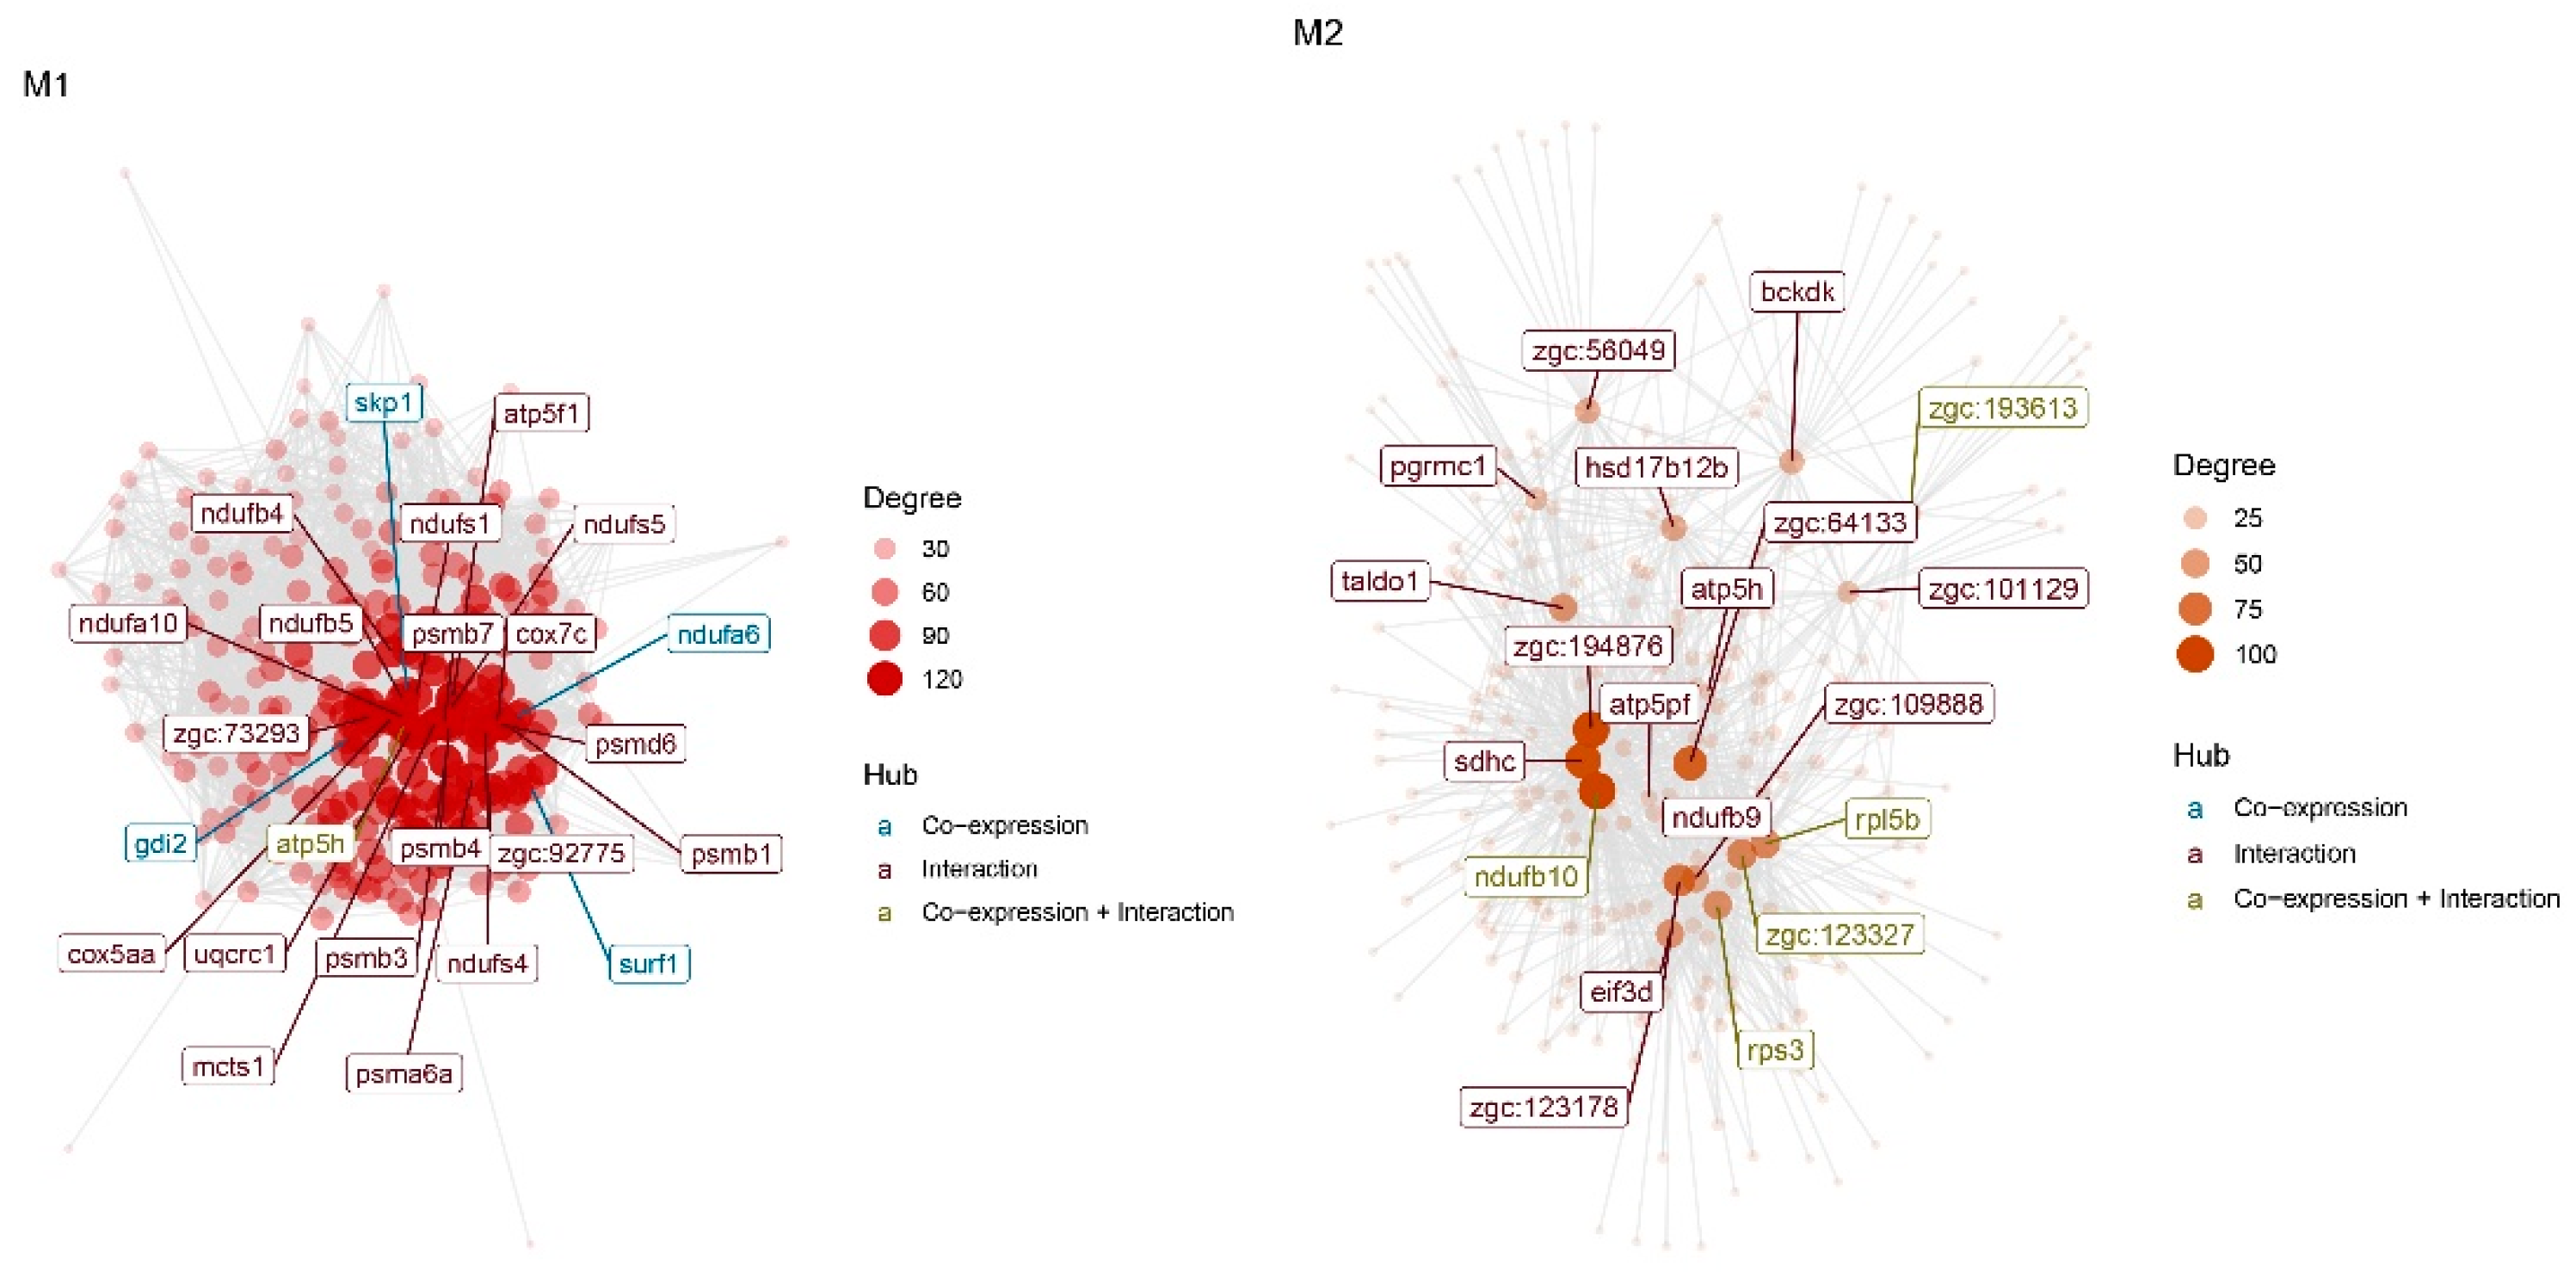
| Hub of M1 | skp1,atp5h, gdi2, surf1, ndufa6,ndufs5, ndufb5, cox5aa, alg8, nnt, rab11b,ndufa10, zgc:73210, glod4, hadh, pdcd10a,ndufb8, slc30a5, rhoaa, psmc1b |
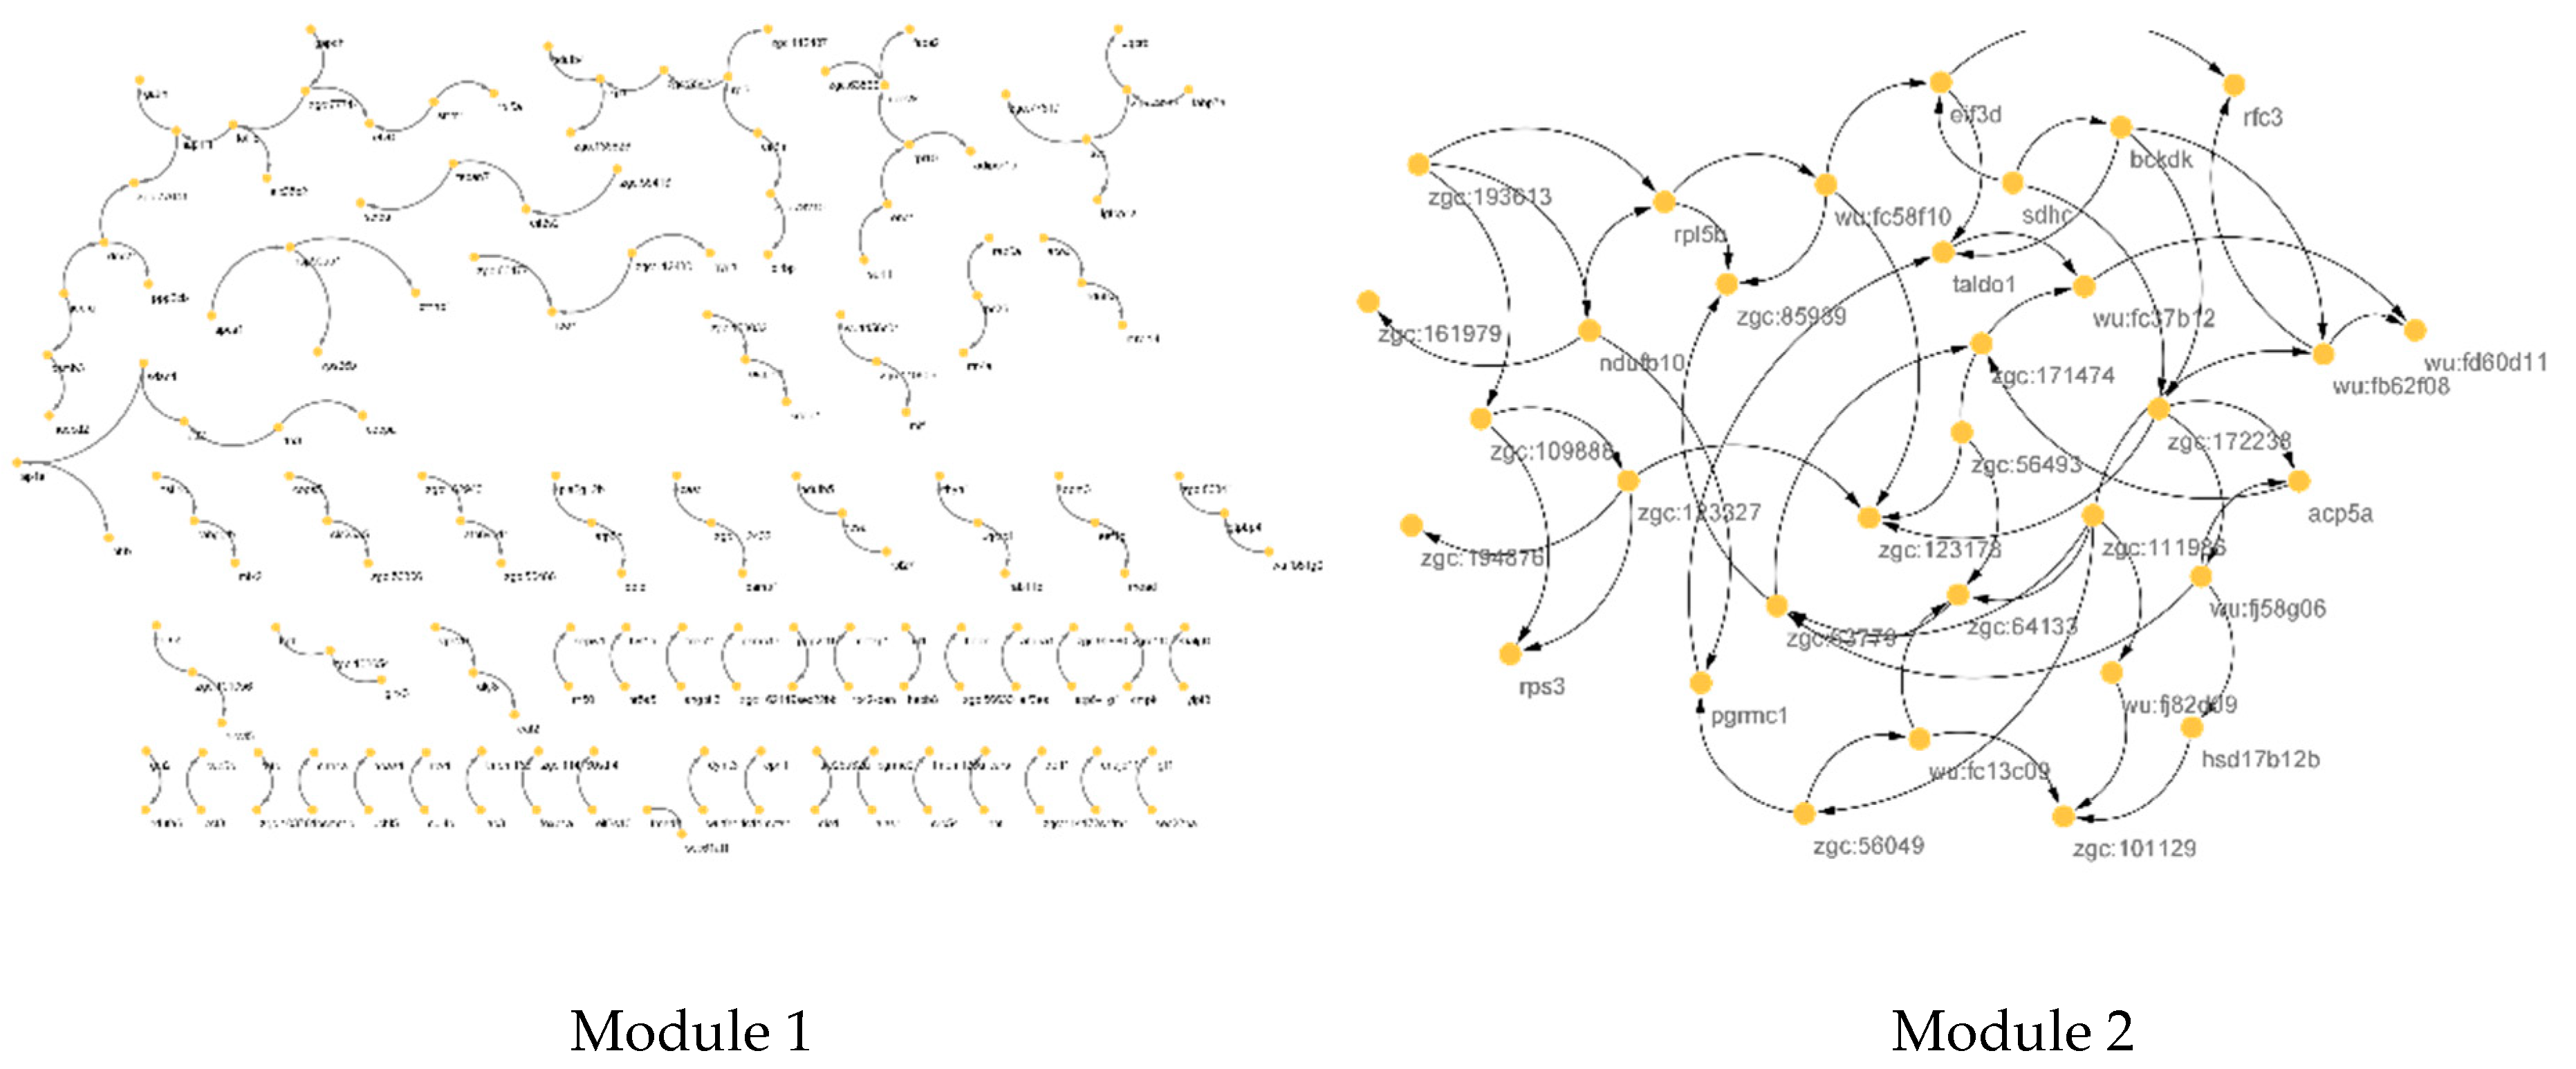
| Hub of M2 | ndufb10,rpl5b,zgc:193613,zgc:123327, rps3, zgc:109888, zgc:161979, pgrmc1,zgc:123178, zgc:194876, zgc:85939,wu:fc58f10,zgc:111986, wu:fd60d11,wu:fc37b12,taldo1, wu:fj82d09,wu:fb62f08,zgc:64133,acp5a |
| By BNLEARN (degree) | |
| CST of M1 | skp1, hsp90ab1, zgc:73269, scd,rpl10, tollip, zgc:77714, ddx21, rpl3, nap1l1, ube2k, zgc:110609, rabggtb, uqcrq, eif3m, tspan7,atp5h, zgc:112432, rps26,ndufs5 |
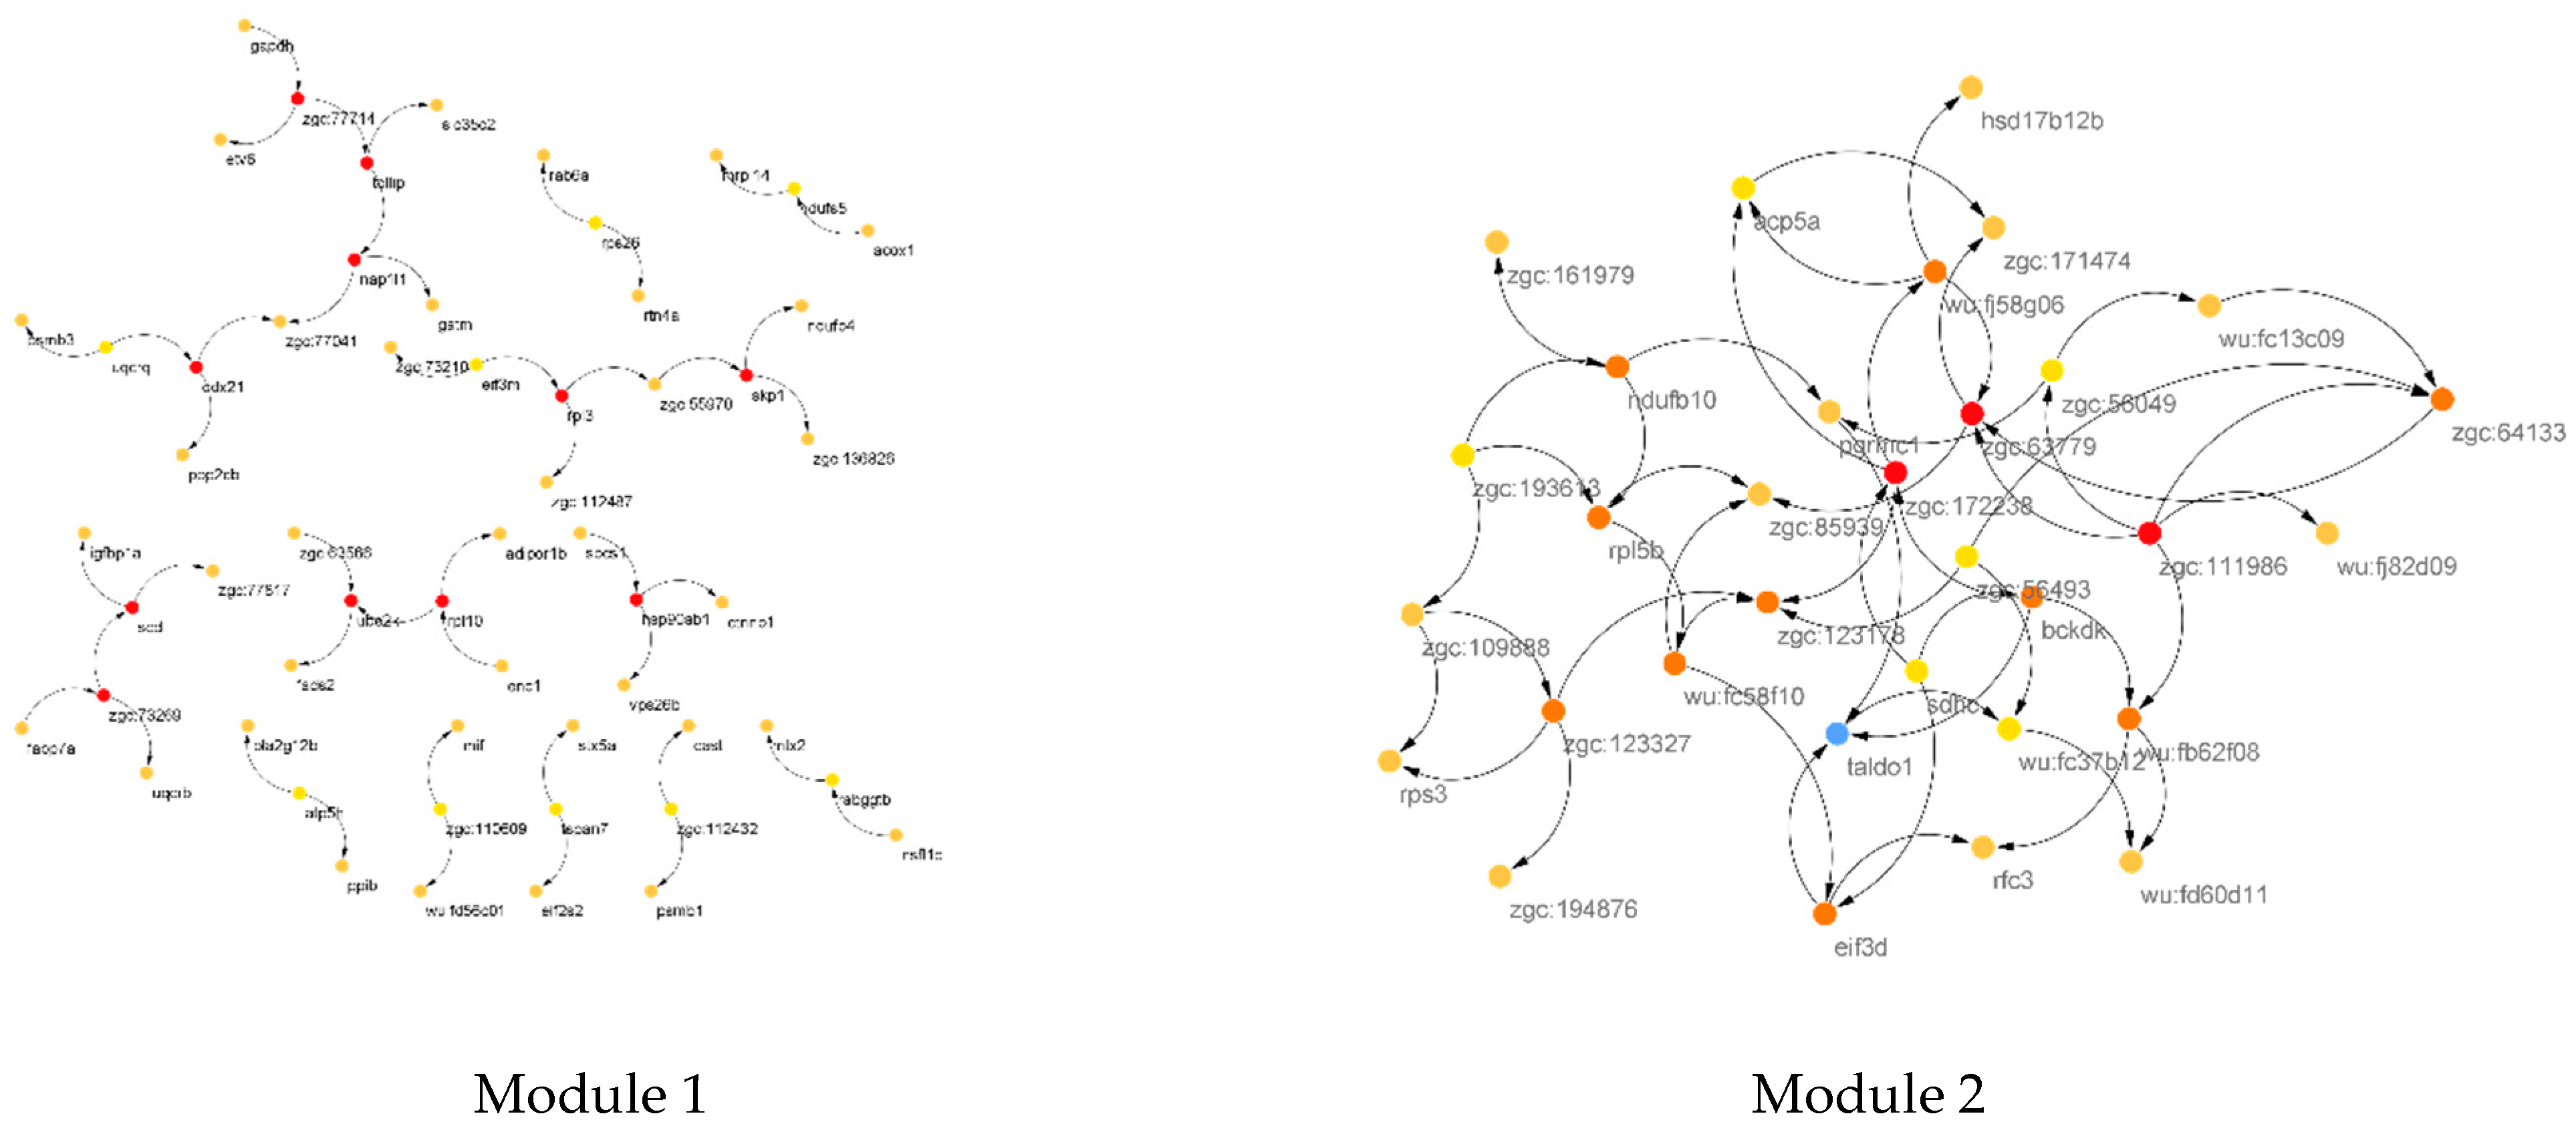
| CST of M2 | zgc:172238,zgc:111986, zgc:63779,zgc:123327,taldo1, eif3d, bckdk,zgc:64133,wu:fb62f08,zgc:123178, wu:fj58g06,ndufb10,rpl5b,wu:fc58f10, zgc:56493,wu:fc37b12, sdhc, zgc:56049,acp5a,zgc:193613 |
| Module 1 | |||
| Term | p-Value | Benjamini | Genes |
| Oxidative phosphorylation | 1.70 × 1026 | 1.00 × 1025 | atp5f1, atp5h, ndufa10, ndufa6, ndufb5, ndufb10, ndufb8, ndufs1, ndufs4, ndufs5, ndufs7, coxaa, cox7c, sdhc, uqcrb, uqcrc1, uqcrq |
| Metabolic pathways | 6.70× 10¹¹ | 2.00 × 10¹⁰ | atp5f1, atp5h, ndufa10, ndufa6, ndufb5, ndufb10, ndufb8, ndufs1, ndufs4, ndufs5, ndufs7, coxaa, cox7c, sdhc, uqcrb, uqcrc1, uqcrq |
| Cardiac muscle contraction | 1.40 × 10⁴ | 2.90 × 10⁴ | cox5aa, cox7c, uqcrb, uqcrc1, uqcrq |
| Module 2 | |||
| Term | p-Value | Benjamini | Genes |
| Proteasome | 9.10 × 10²⁰ | 1.10 × 10¹⁸ | psmc1a, psmc1b, psmc5, psmd6, psmd7, pomp, psma4, psma6a, psmb1, psmb3, psmb4, psmb5, psmb7, shfm1 |
| Ribosome | 1.30 × 10⁸ | 7.50 × 10⁸ | mrpl24, rpl10, rpl22, rpl27, rpl3, rpl5a, rps26, rps27.1, rps3, rpsa |
| Module 1 | |||
|---|---|---|---|
| Term | p-Value | Benjamini | Genes |
| Proteasome | 6.90 × 10⁹ | 3.80 × 10⁷ | psmc1a, psmc1b, psmc5, psmd6, psmd7, pomp, psma4, psma6a, psmb1, psmb3, psmb4, psmb5, psmb7, shfm1 |
| Oxidative phosphorylation | 8.40 × 10⁹ | 3.80 × 10⁷ | atp5f1, atp5h, ndufa10, ndufa6, ndufb5, ndufb10, ndufb8, ndufs1, ndufs4, ndufs5, ndufs7, coxaa, cox7c, sdhc, uqcrb, uqcrc1, uqcrq |
| Protein export | 1.70 × 10⁴ | 5.20 × 10³ | sec11a, spcs1, spcs3, srp54, srp68, srp9, |
| Fatty acid metabolism | 5.60 × 10⁴ | 1.30 × 10² | |
| Fatty acid degradation | 4.20 × 10³ | 7.50 × 10² | acat2, acadm, acox1, aldh9a1b, cpt2, hadh |
| Metabolic pathways | 5.10 × 10³ | 7.70 × 10² | agpat2, hibadhb, abat, alg8, atp5a1, atp5f1, atp5h, atp6v0d1, atp6v1g1, dao.1, ndufa10, ndufa6, ndufb5, ndufb4, ndufb8, ndufs1, ndufs4, ndufs5, ndufs7, acat2, acadm, acox1, ahcy, aldh9a1b, alas1, alg6, cmpk, cyp3a65, cox5aa, cox7c, dpm1, dpm3, gapdh, gatm, hadh, idh1, idh2, lap3, nnt, pla2g12b, pklr, sps2, uqcrb, uqcrc1, uqcrq, urod, |
| PPAR signaling pathway | 6.90 × 10³ | 8.10 × 10² | Acadm, acox1, cpt2, fabp3, fabp7a, fads2, scd, |
| Peroxisome | 7.20 × 10³ | 8.10 × 10² | dao.1, acox1, idh1, idh2, pex19, pex3, sod1, sod2 |
| Valine, leucine and isoleucine degradation | 9.40 × 10³ | 9.40 × 10² | hibadhb abat, acat2, acadm, aldh9a1b, hadh |
| Biosynthesis of unsaturated fatty acids | 2.10 × 10² | 1.90 × 101 | elovl5, acox1, fads2, scd |
| Ribosome | 5.10 × 10² | 4.20 × 101 | mrpl24, rpl10, rpl22, rpl27, rpl3, rpl5a, rps26, rps27.1, rps3, rpsa |
| Biosynthesis of antibiotics | 6.80 × 10² | 5.10 × 101 | dao.1, acat2, acadm, aldh9a1b, fntb, gapdh, hadh, idh1, idh2, pklr, zmpste24, |
| alpha-linolenic acid metabolism | 7.40 × 10² | 5.10 × 101 | acox1, fads2, pla2g12b |
Publisher’s Note: MDPI stays neutral with regard to jurisdictional claims in published maps and institutional affiliations. |
© 2022 by the authors. Licensee MDPI, Basel, Switzerland. This article is an open access article distributed under the terms and conditions of the Creative Commons Attribution (CC BY) license (https://creativecommons.org/licenses/by/4.0/).
Share and Cite
Mortazavi, A.; Ghaderi-Zefrehei, M.; Muhaghegh Dolatabady, M.; Golshan, M.; Nazari, S.; Sadr, A.S.; Kadkhodaei, S.; Imumorin, I.G.; Peters, S.O.; Smith, J. An Integrated Bioinformatics Approach to Identify Network-Derived Hub Genes in Starving Zebrafish. Animals 2022, 12, 2724. https://doi.org/10.3390/ani12192724
Mortazavi A, Ghaderi-Zefrehei M, Muhaghegh Dolatabady M, Golshan M, Nazari S, Sadr AS, Kadkhodaei S, Imumorin IG, Peters SO, Smith J. An Integrated Bioinformatics Approach to Identify Network-Derived Hub Genes in Starving Zebrafish. Animals. 2022; 12(19):2724. https://doi.org/10.3390/ani12192724
Chicago/Turabian StyleMortazavi, Amin, Mostafa Ghaderi-Zefrehei, Mustafa Muhaghegh Dolatabady, Mahdi Golshan, Sajad Nazari, Ayeh Sadat Sadr, Saeid Kadkhodaei, Ikhide G. Imumorin, Sunday O. Peters, and Jacqueline Smith. 2022. "An Integrated Bioinformatics Approach to Identify Network-Derived Hub Genes in Starving Zebrafish" Animals 12, no. 19: 2724. https://doi.org/10.3390/ani12192724