
Physiology and Proteomic Basis of Lung Adaptation to High-Altitude Hypoxia in Tibetan Sheep

 , , , , and
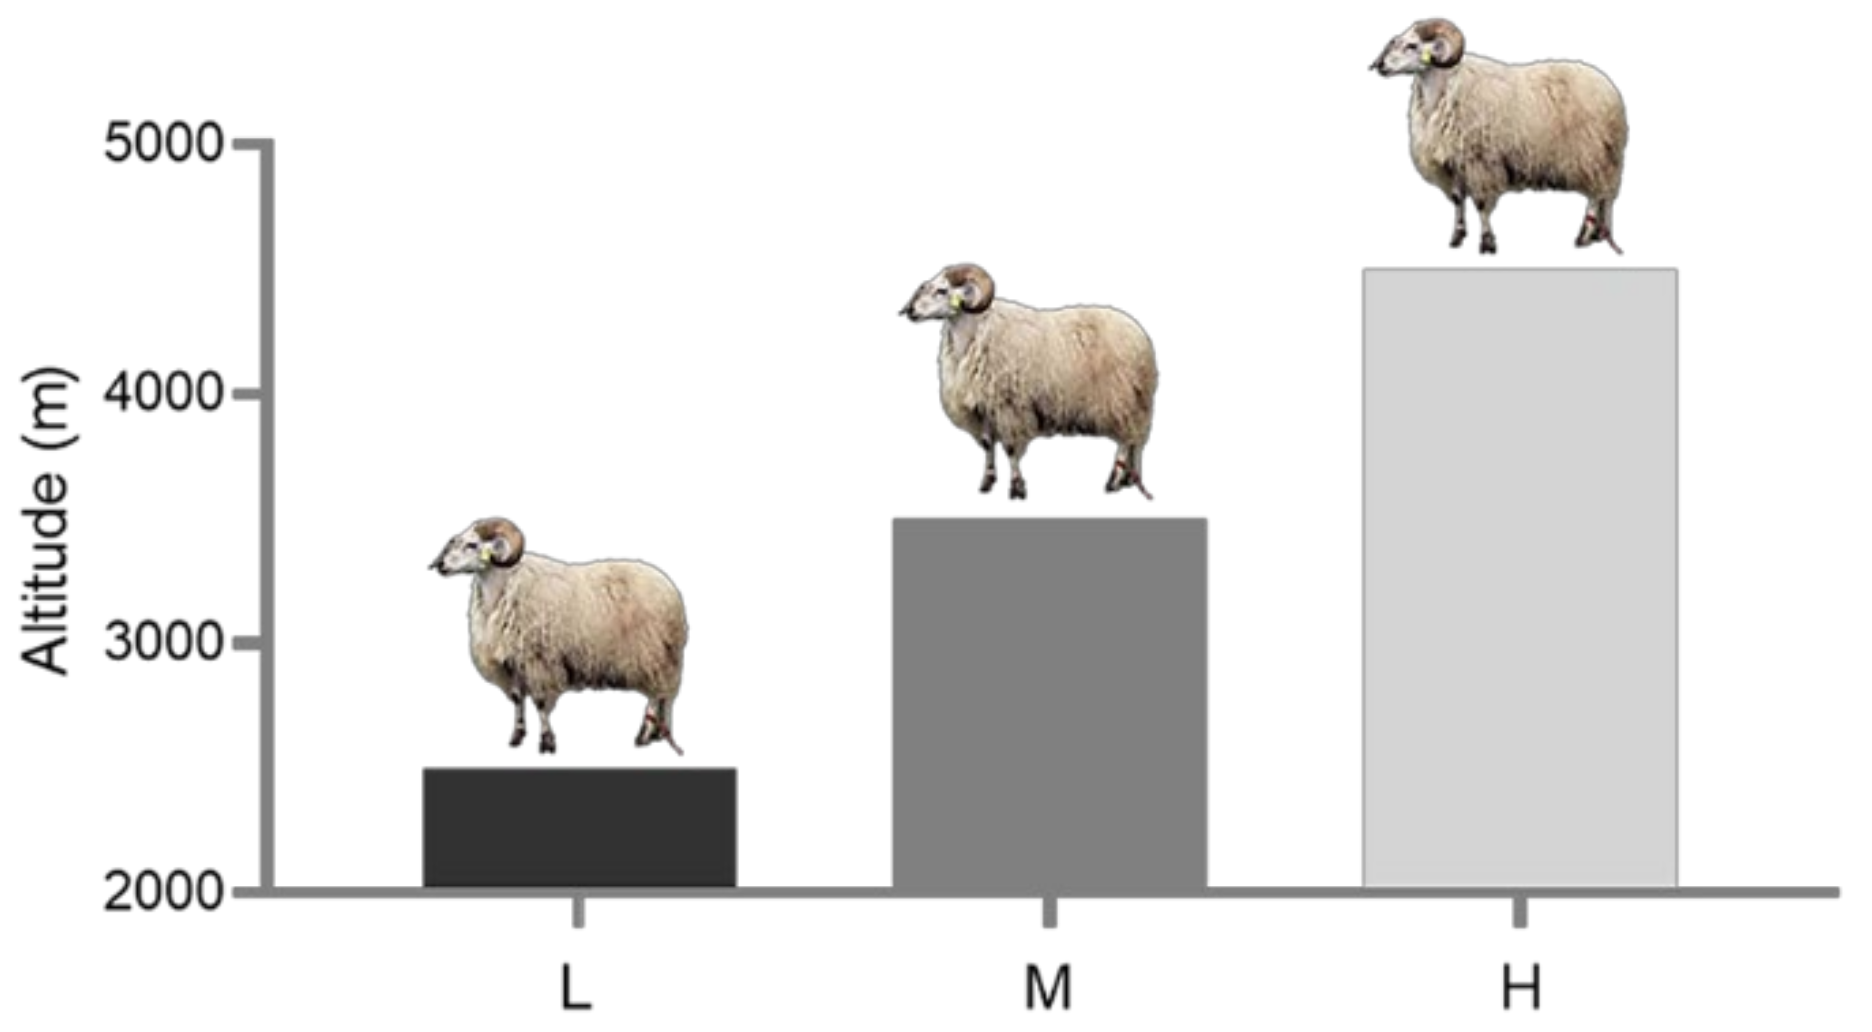
Abstract
:Simple Summary
Abstract
1. Introduction
2. Materials and Methods
2.1. Ethics Statement
2.2. Sample Collection and Blood-Gas Indicators Measure
2.3. Observation of Lung Structure
2.4. Sample Preparation for Mass Spectrometry
2.5. Data-Dependent Acquisition (DDA) Qualitative Database Construction and Spectral Library
2.6. DIA Data Collection and Analysis
2.7. WB and Immunofluorescence
2.8. Statistical Analyses
3. Results
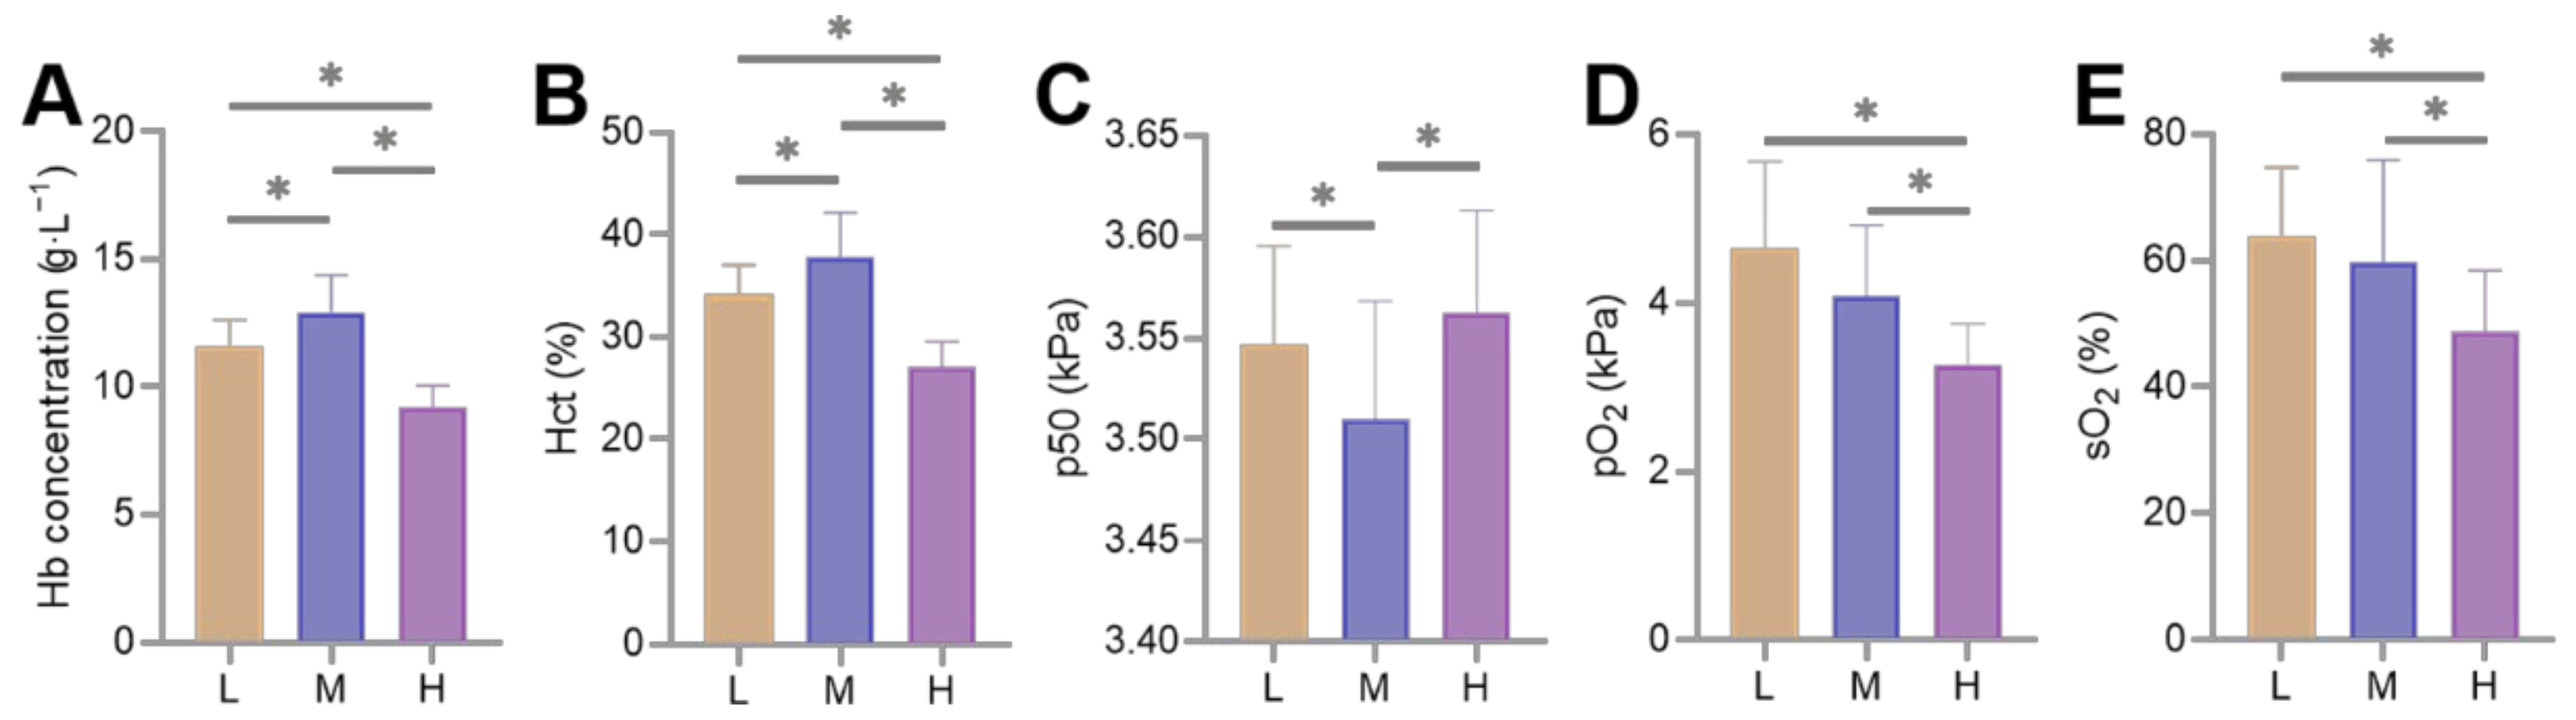
3.1. Differences in Blood-Gas Indicators
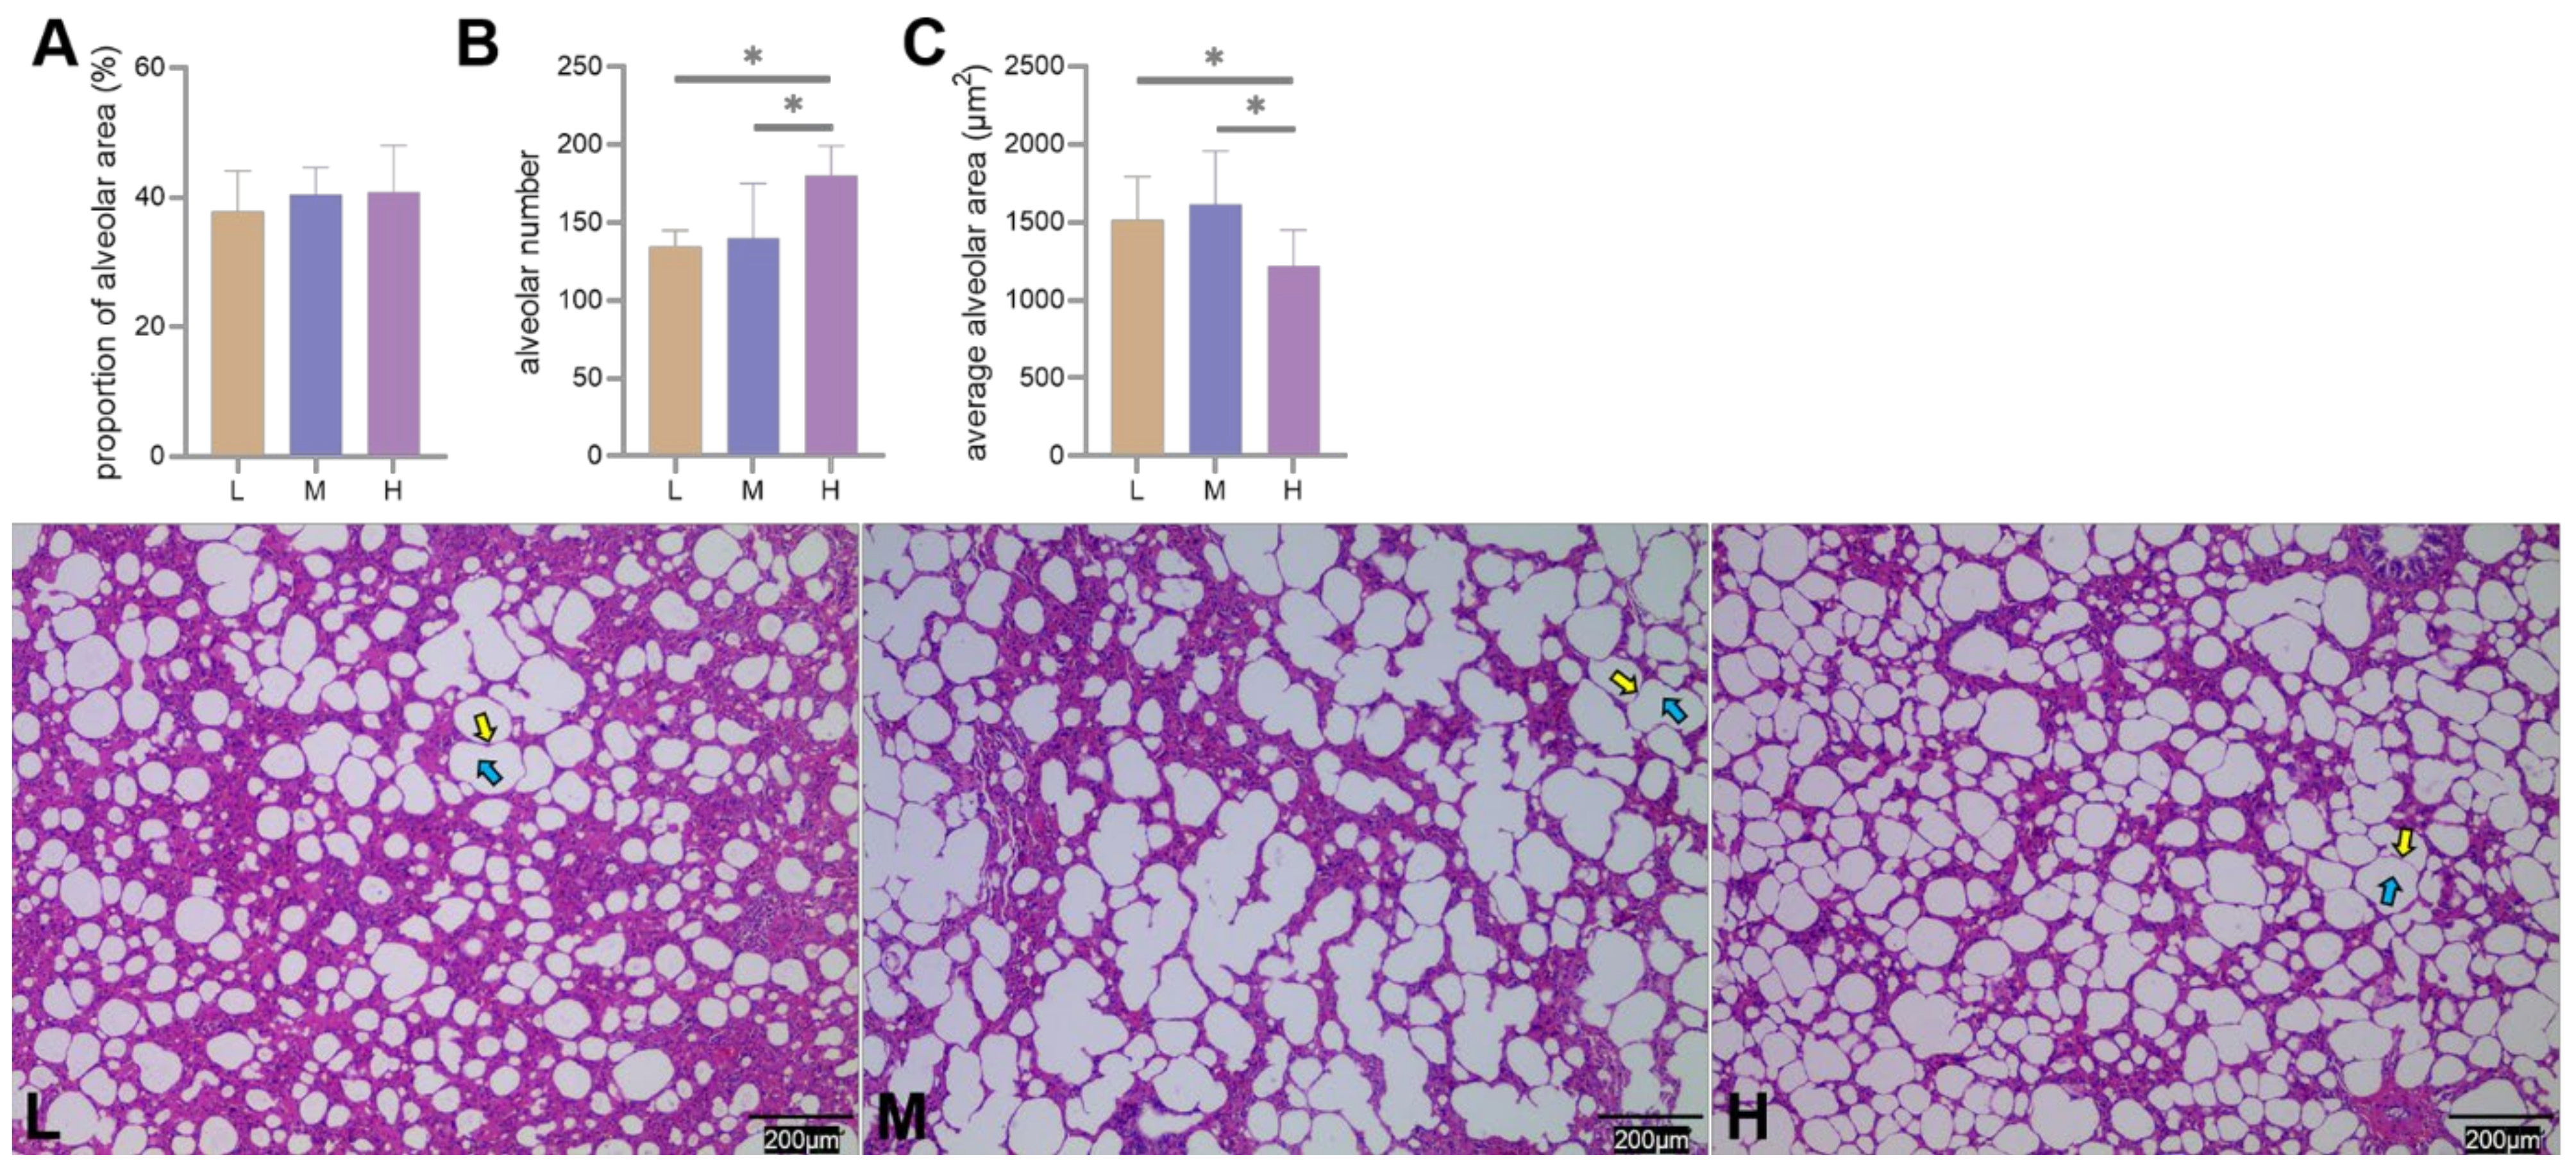
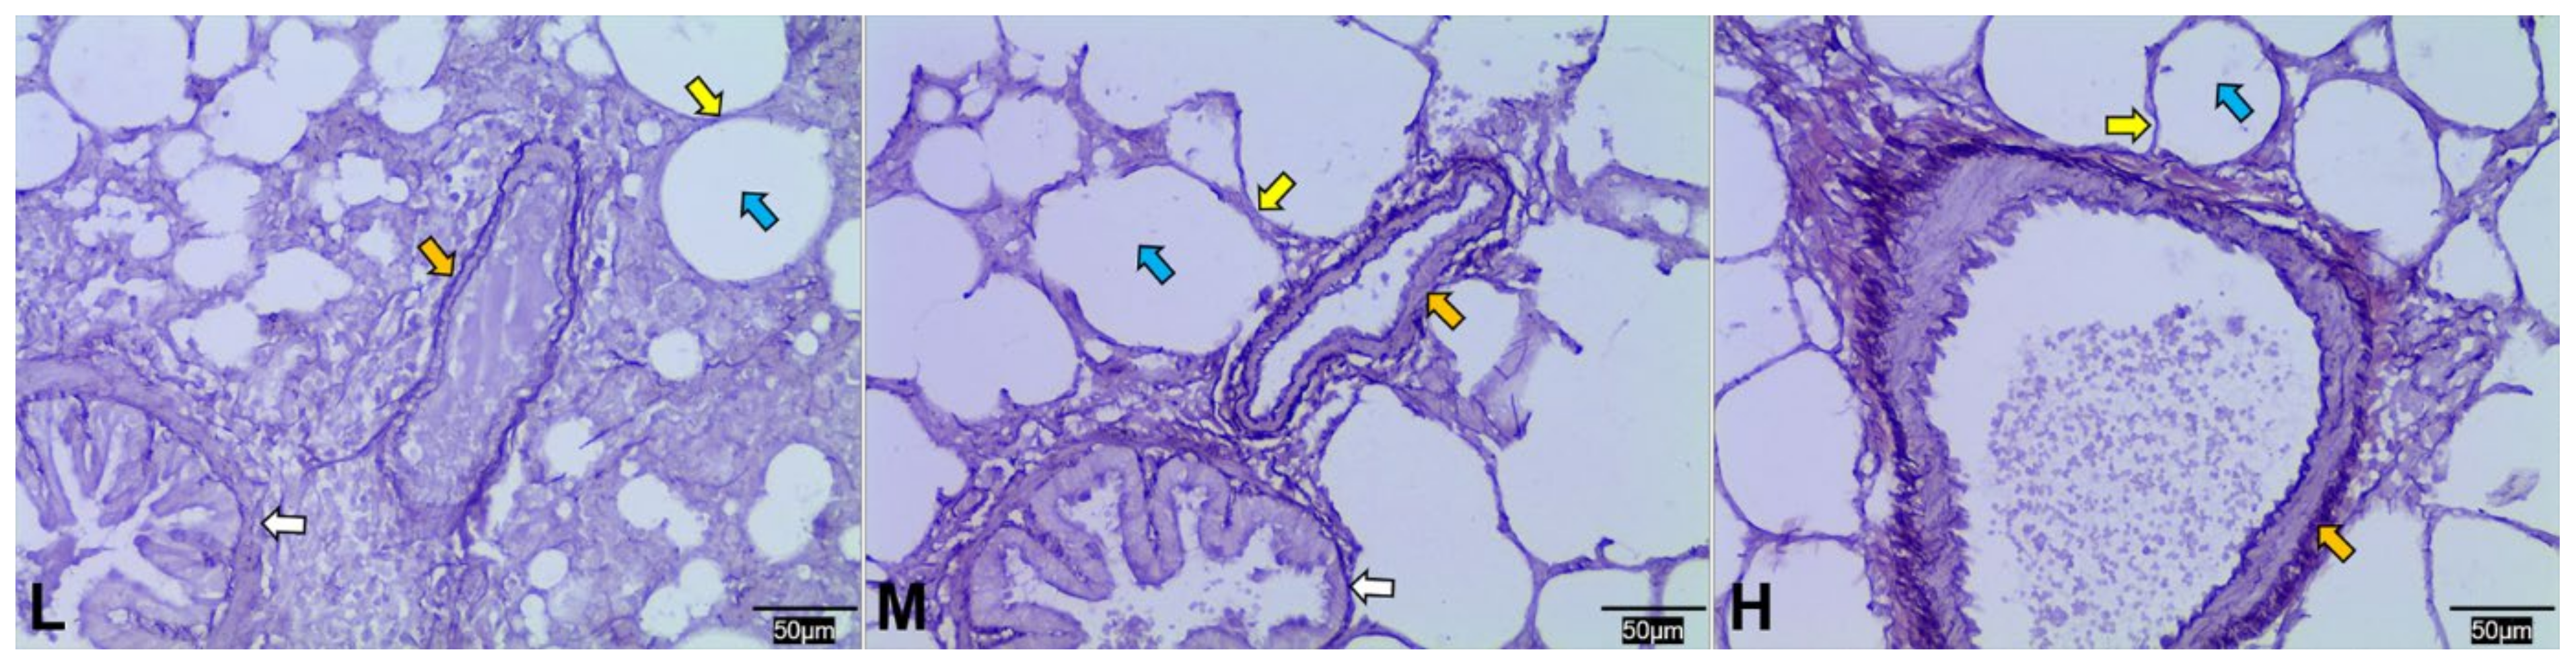
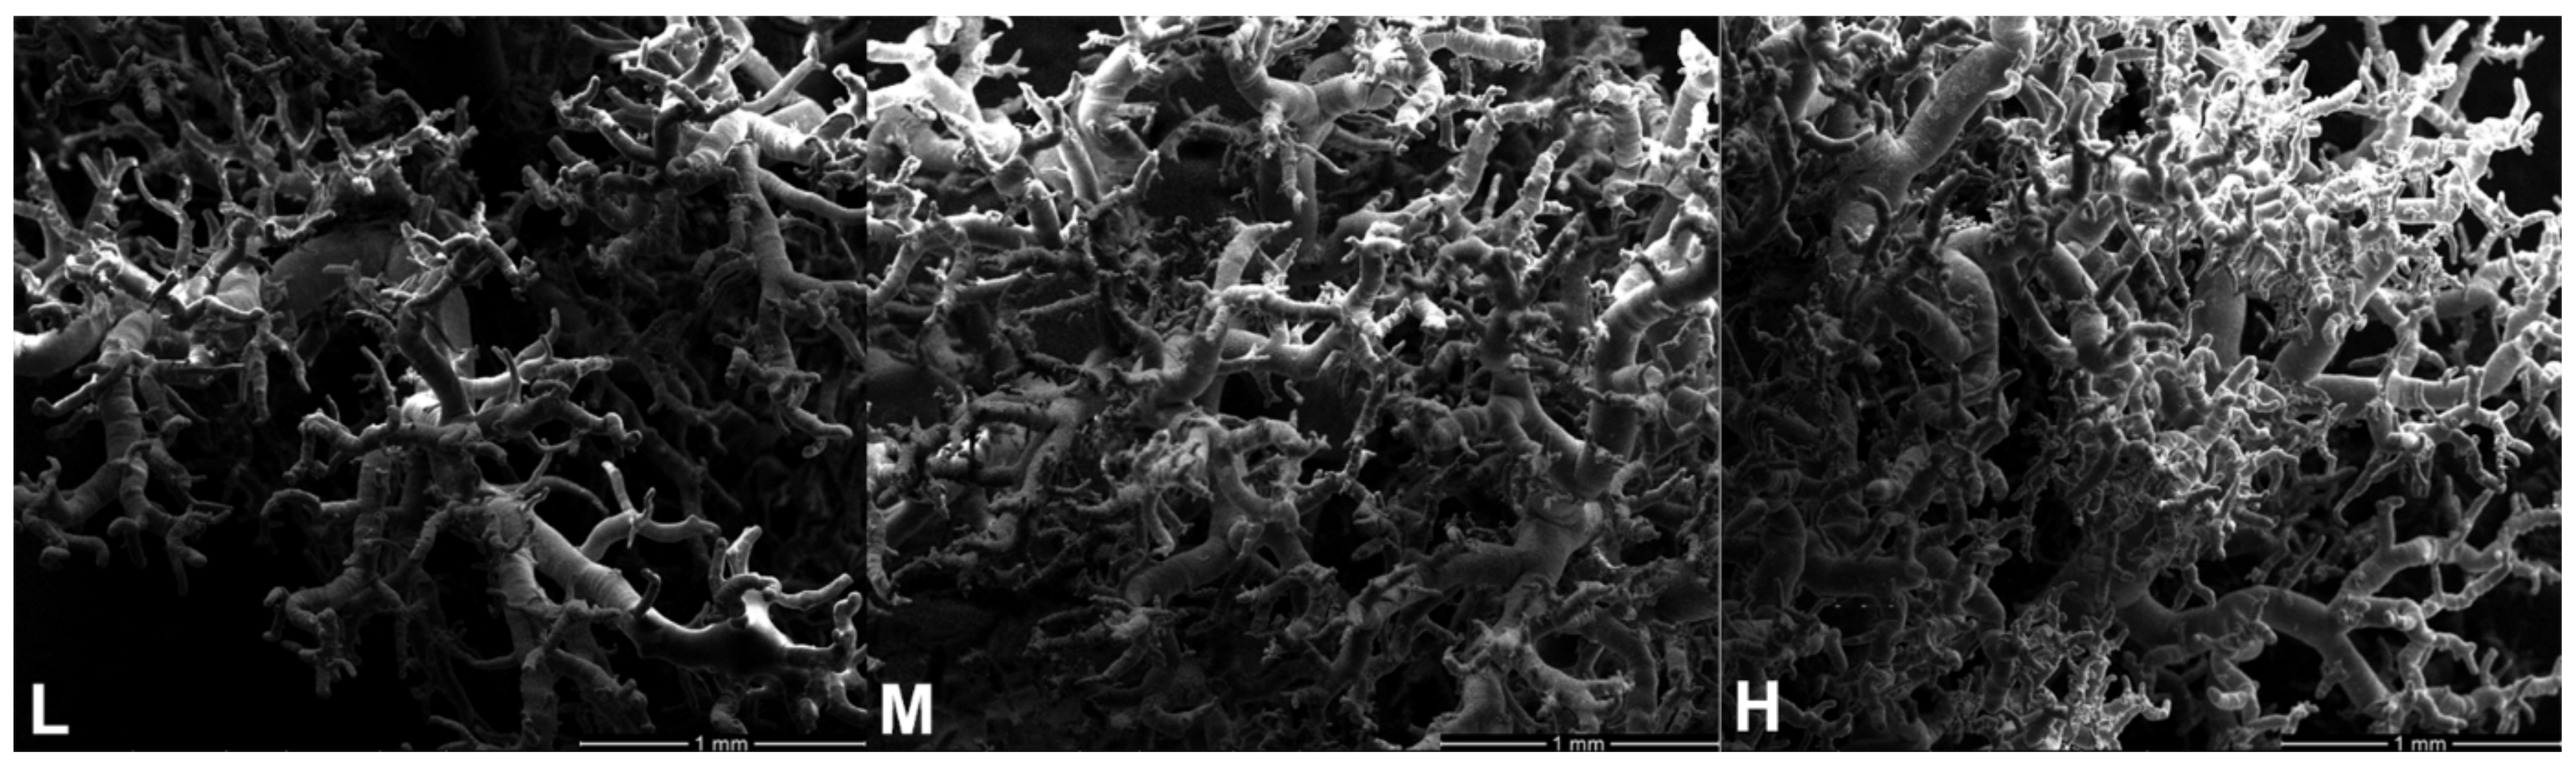
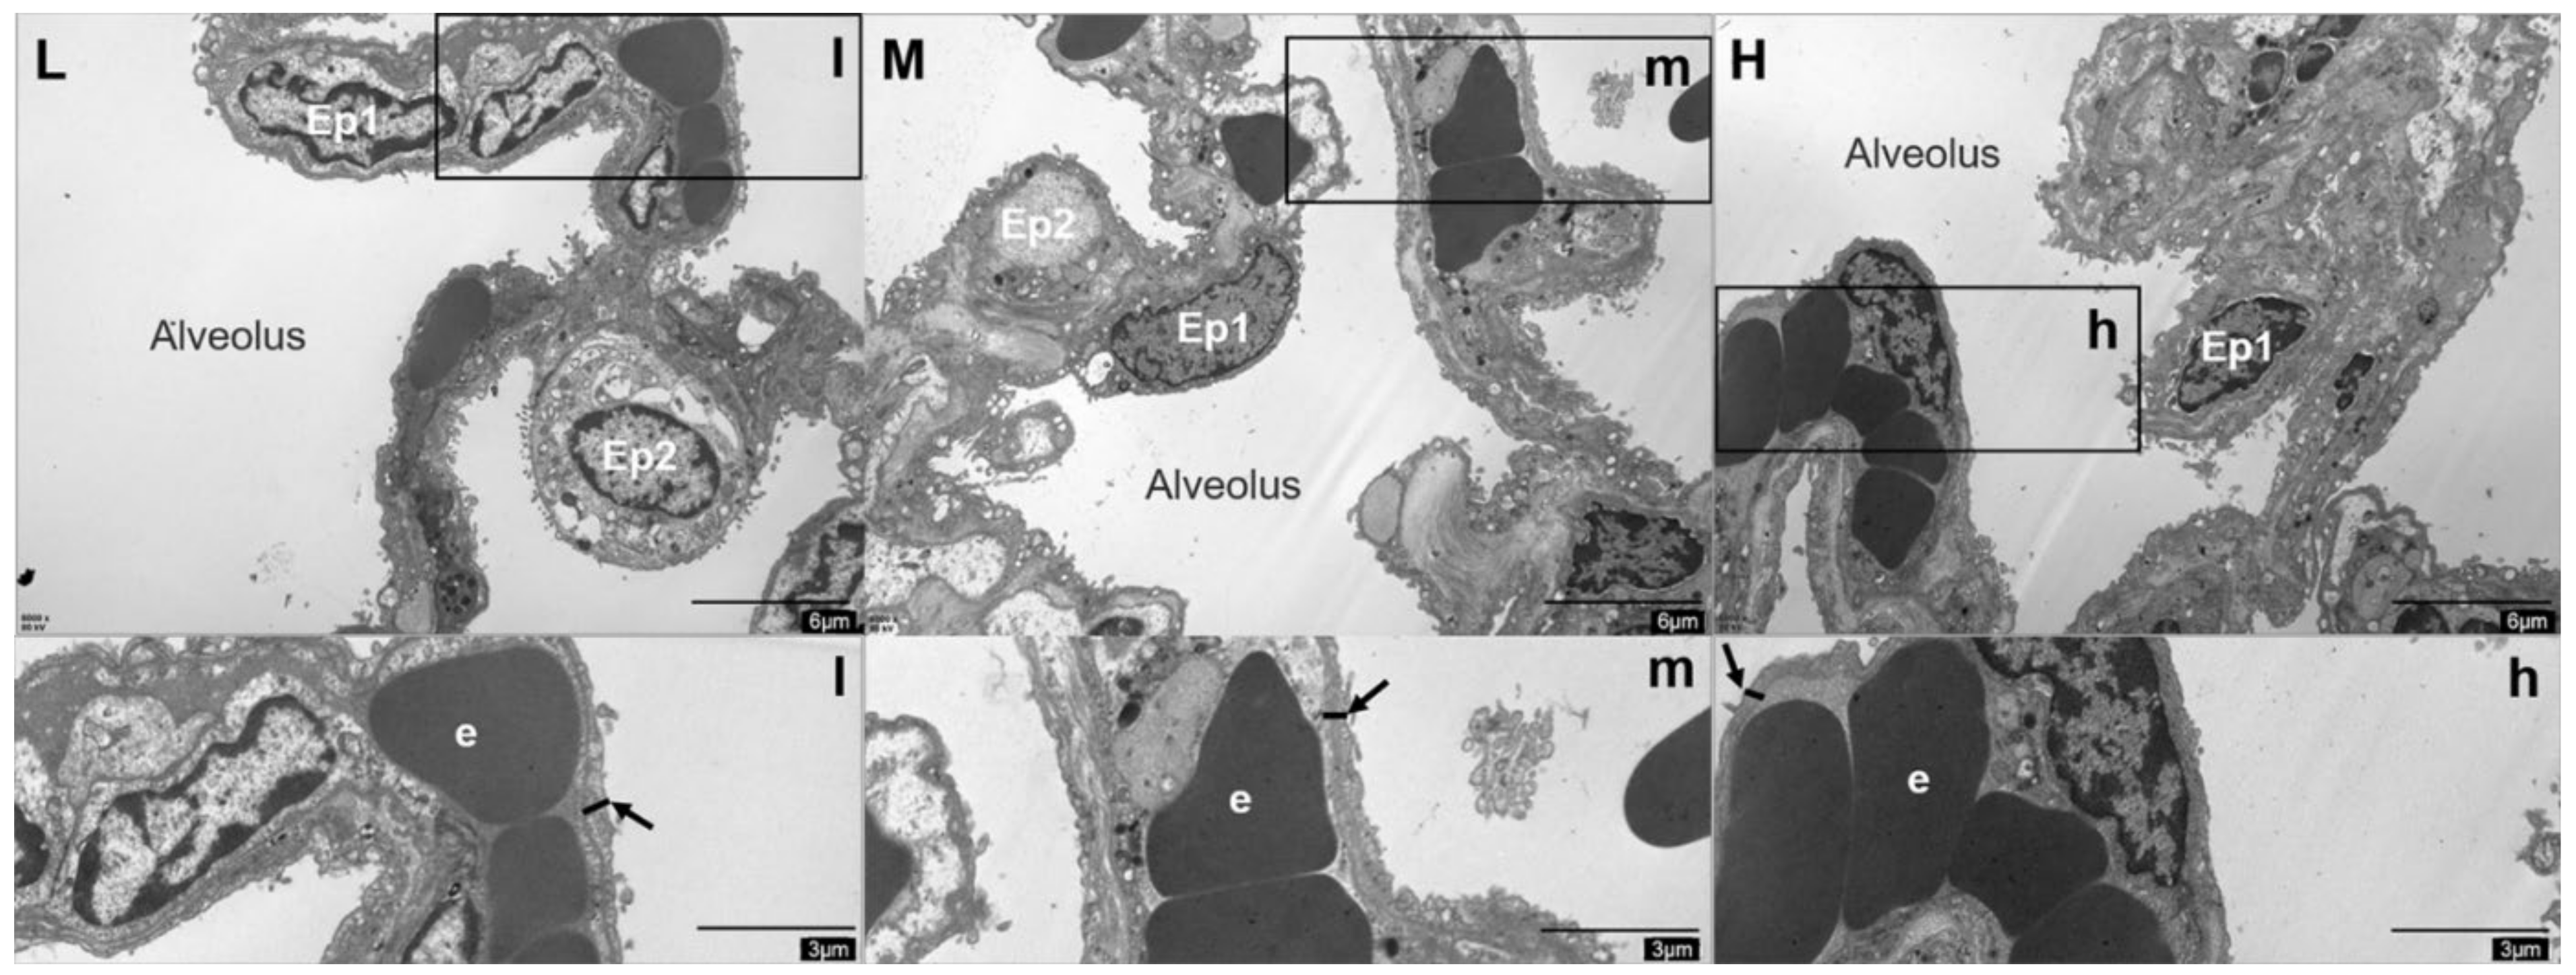
3.2. Structural Differences in the Lungs
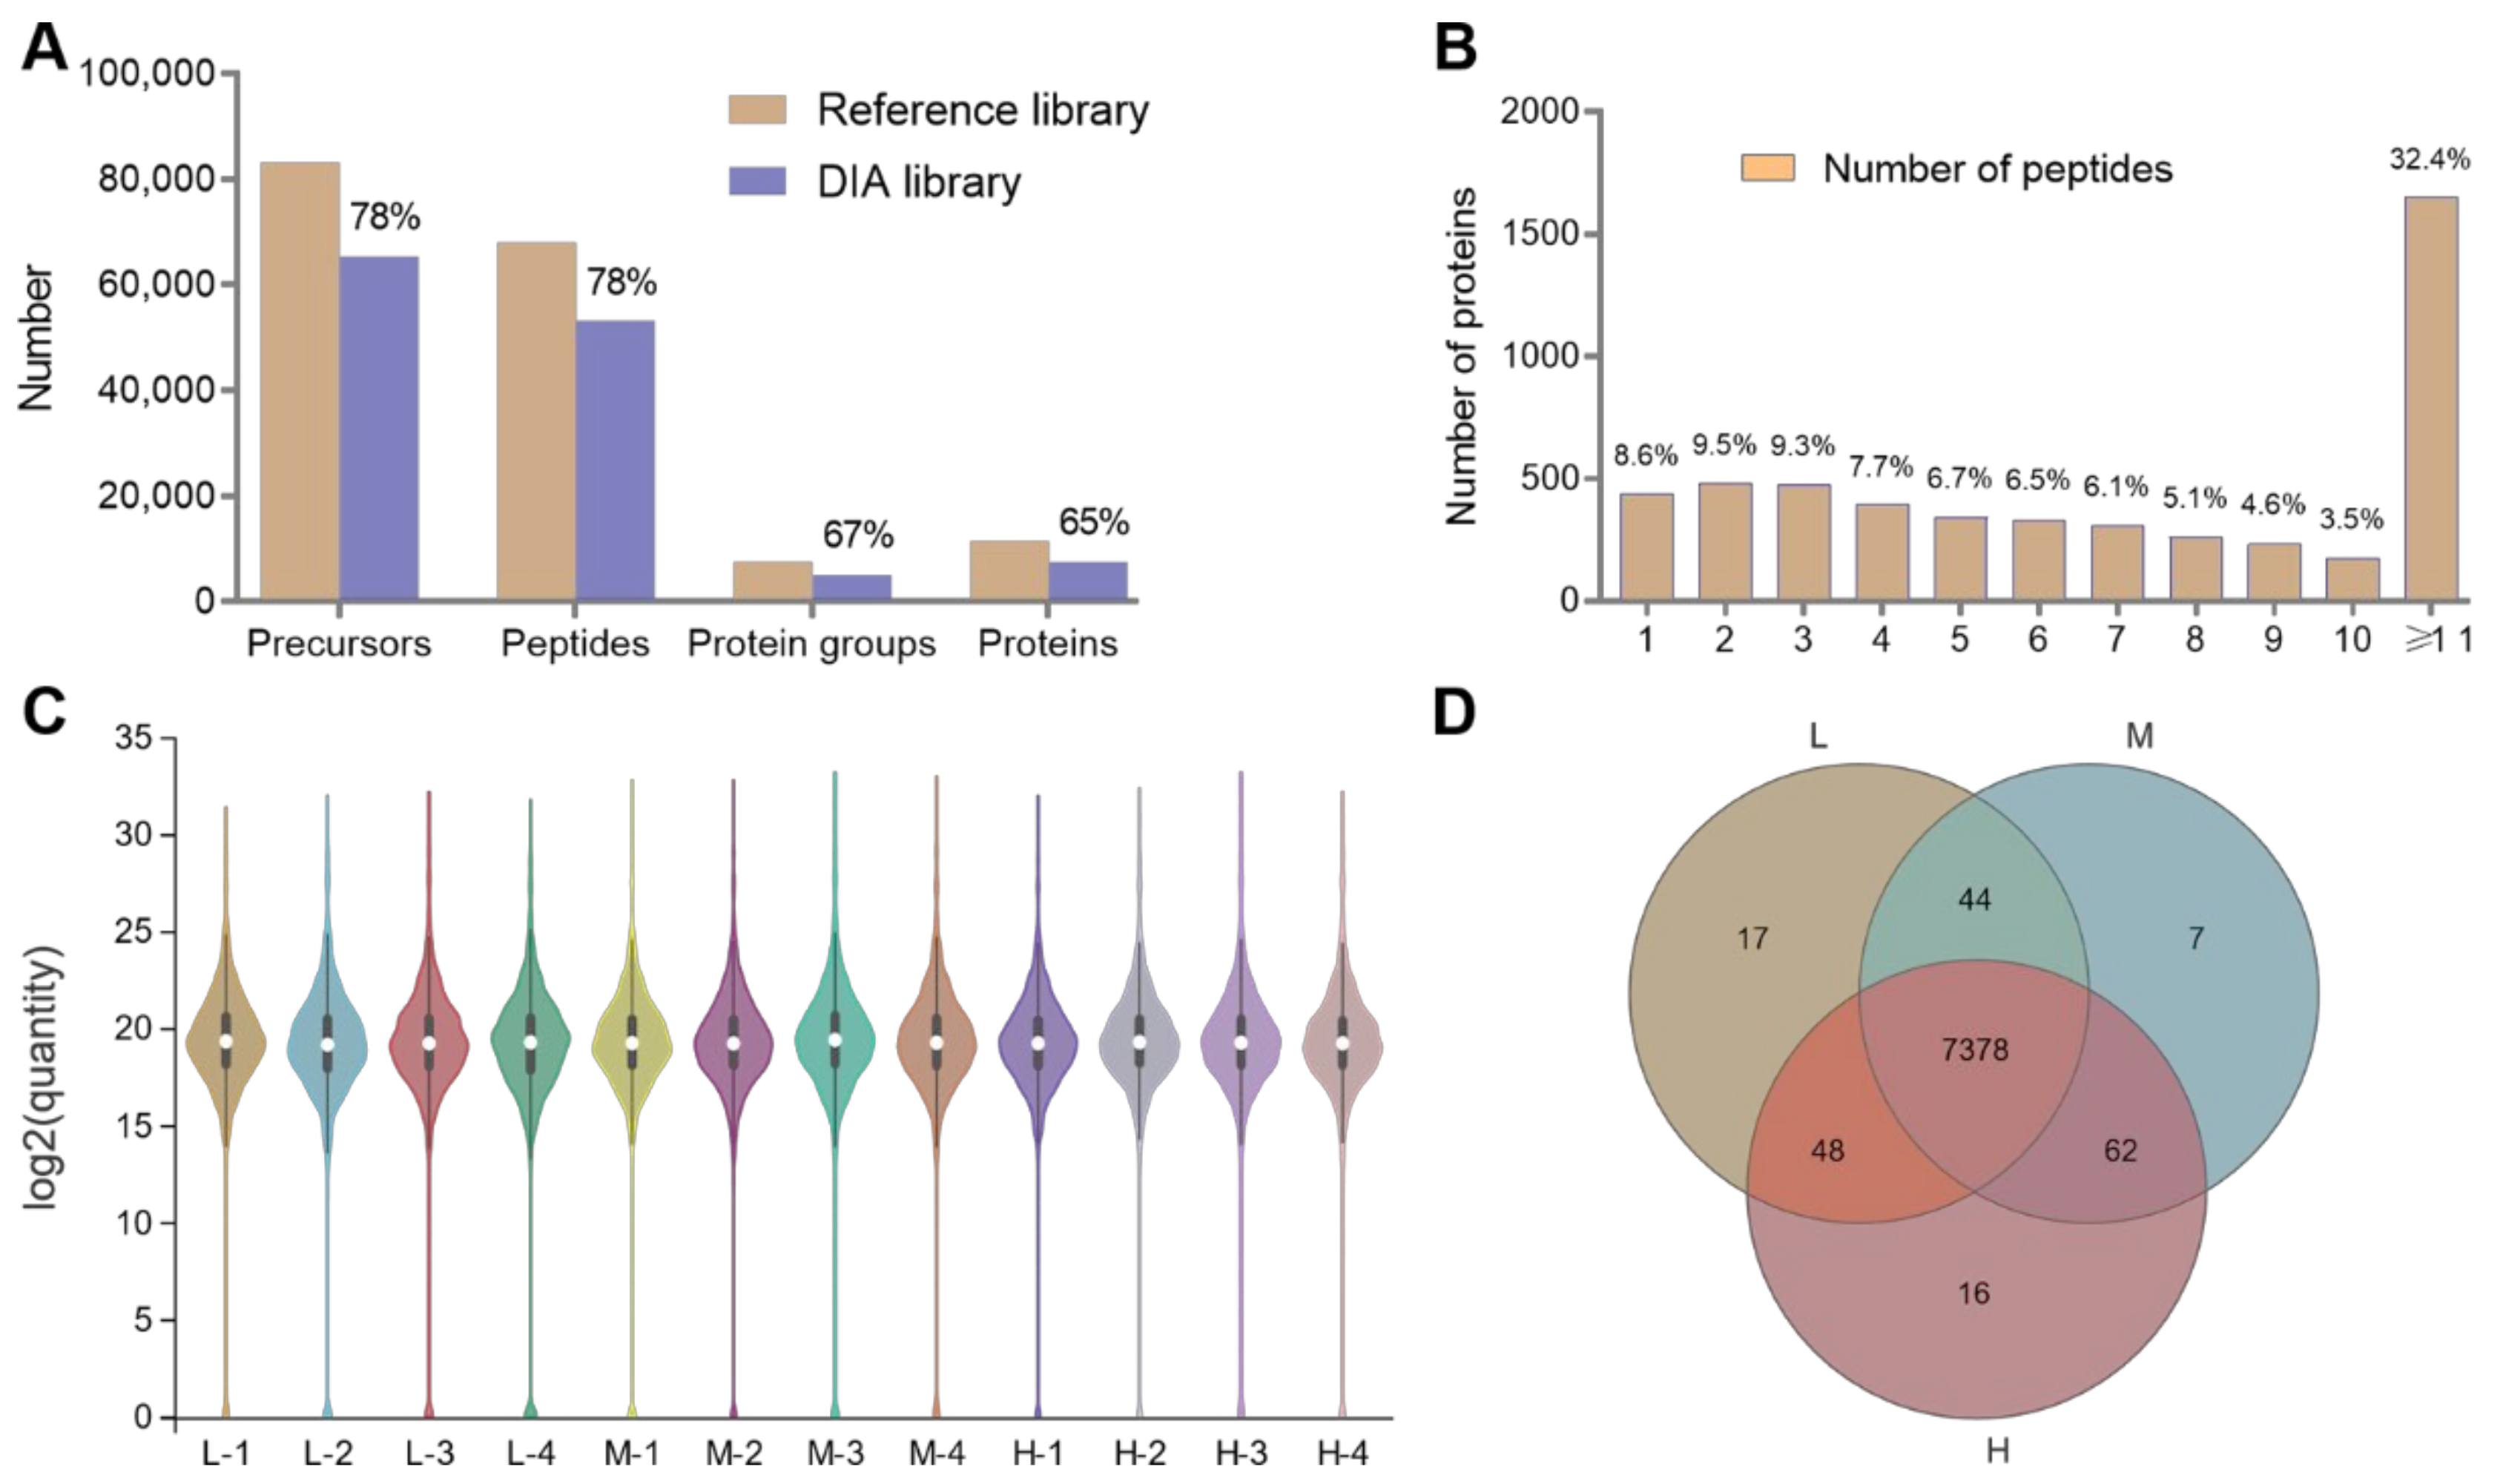
3.3. Summary of the Proteomics Data
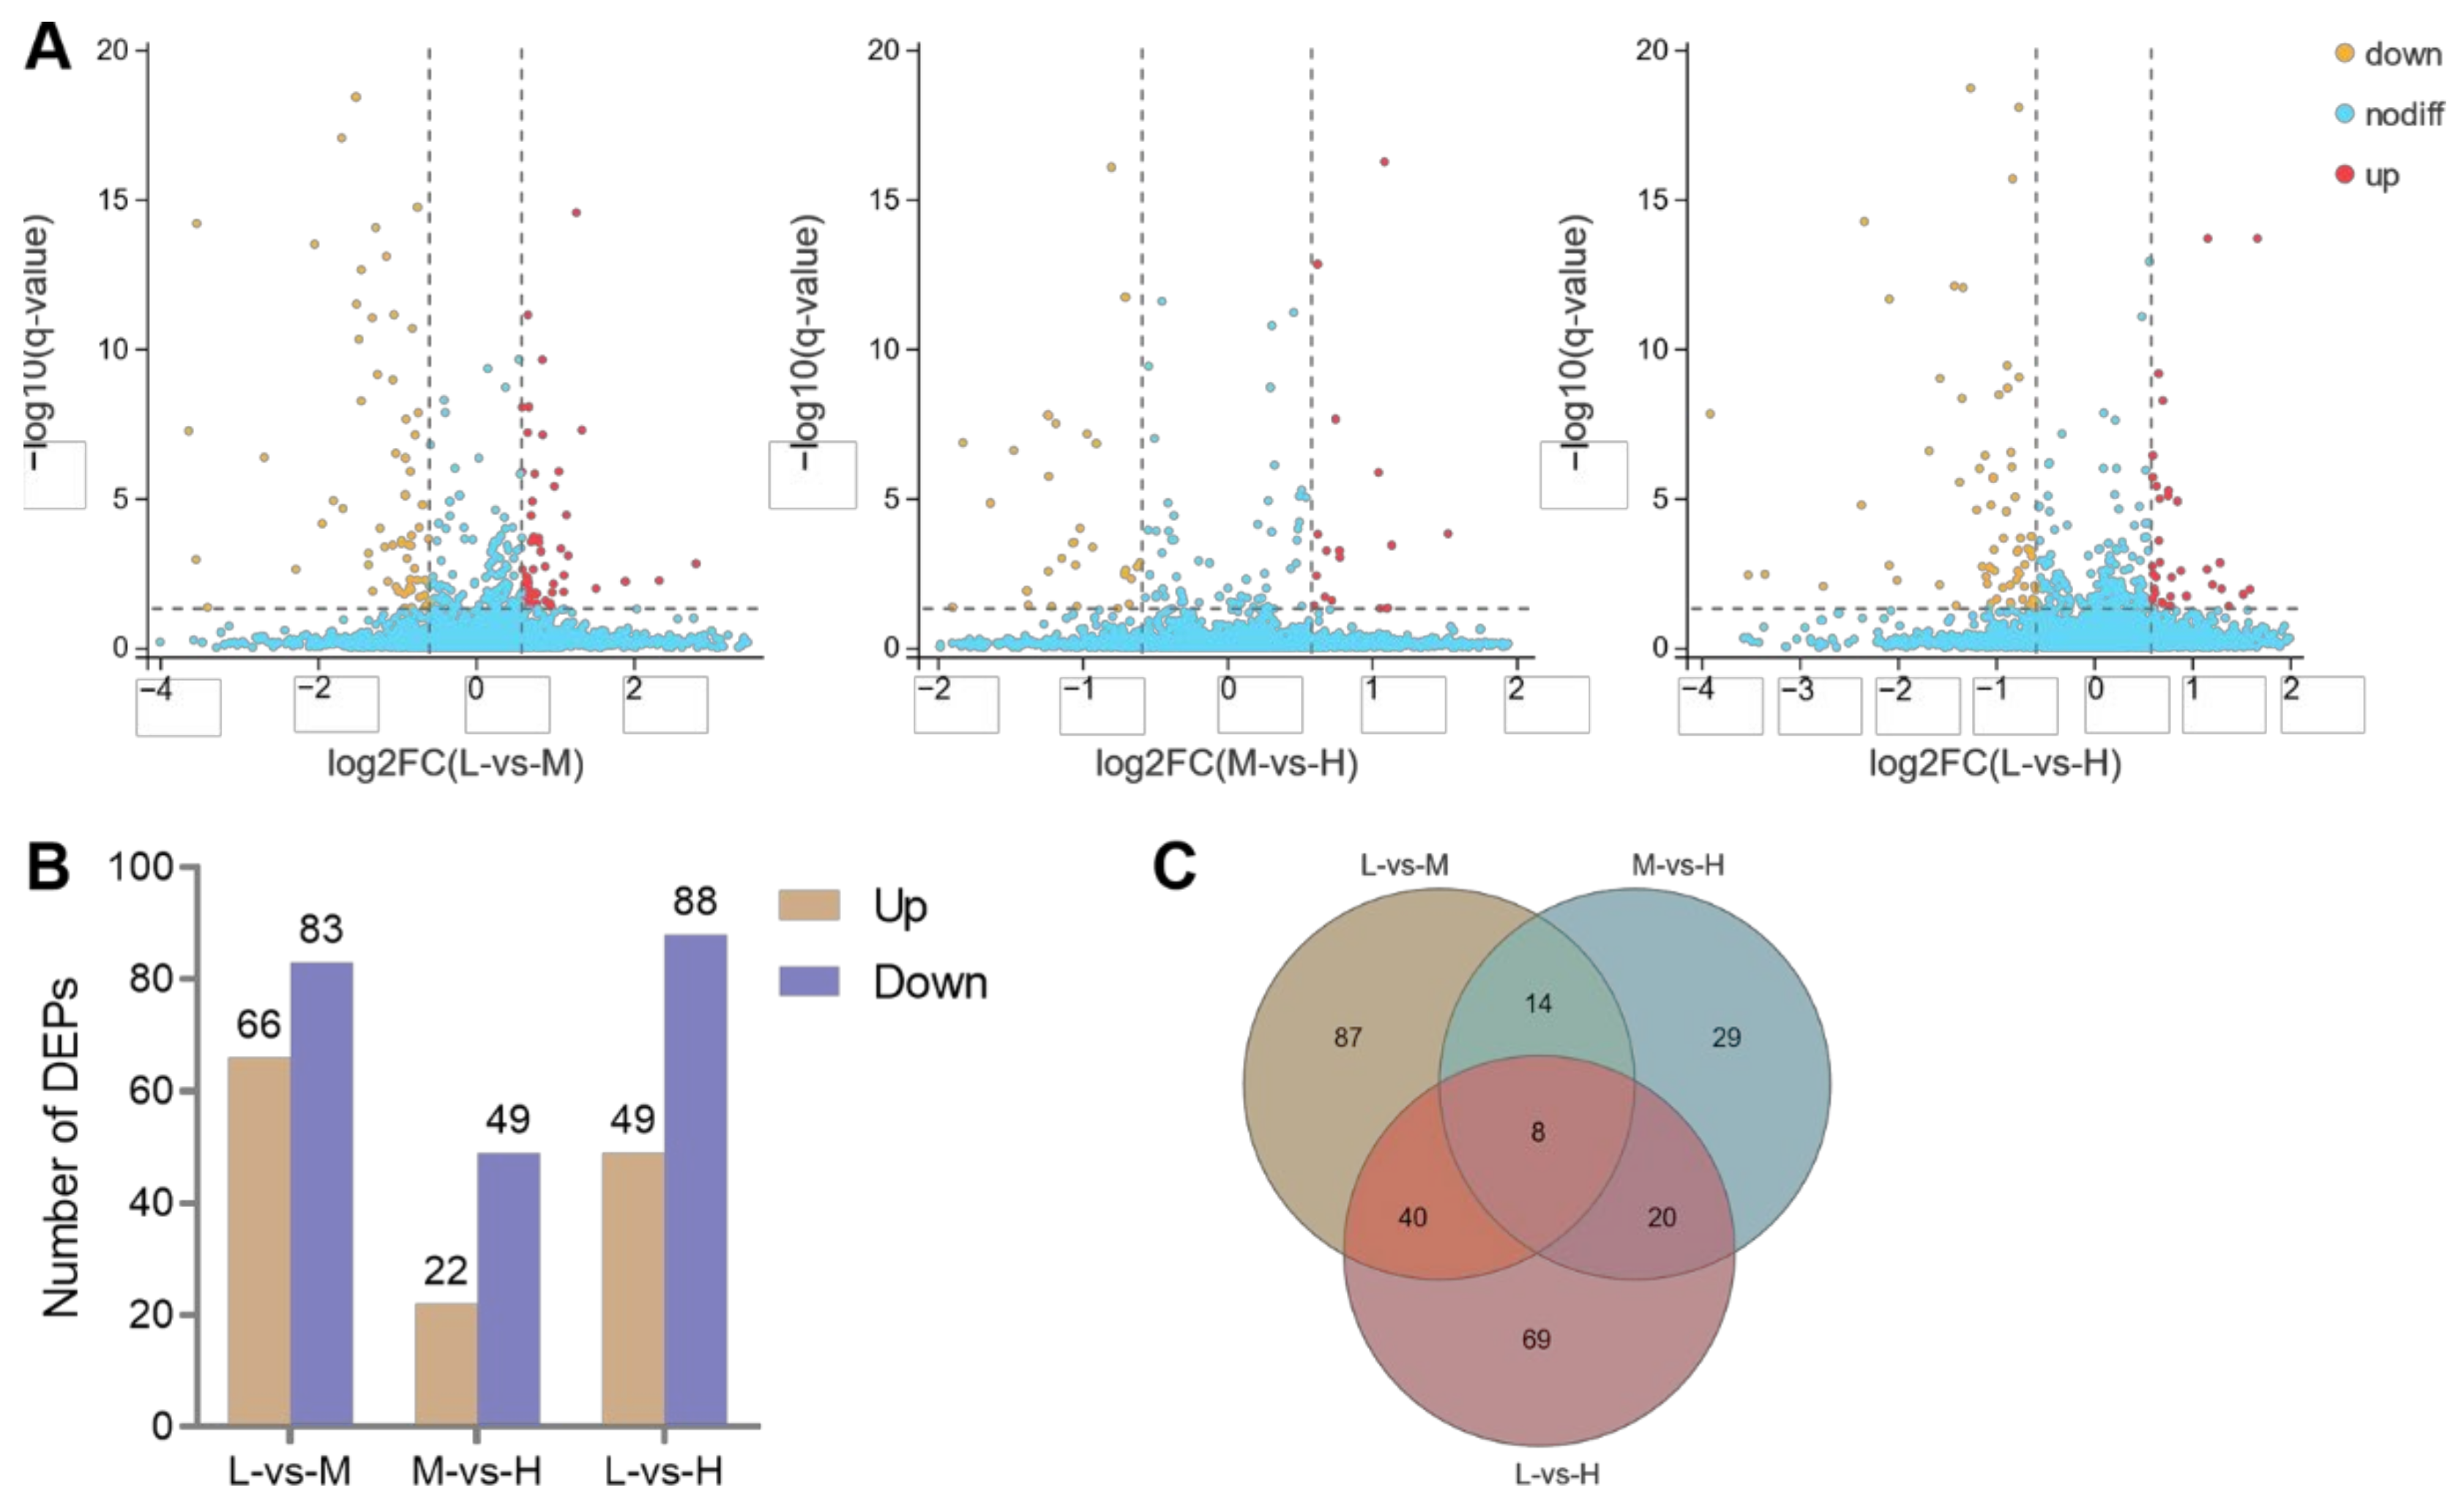
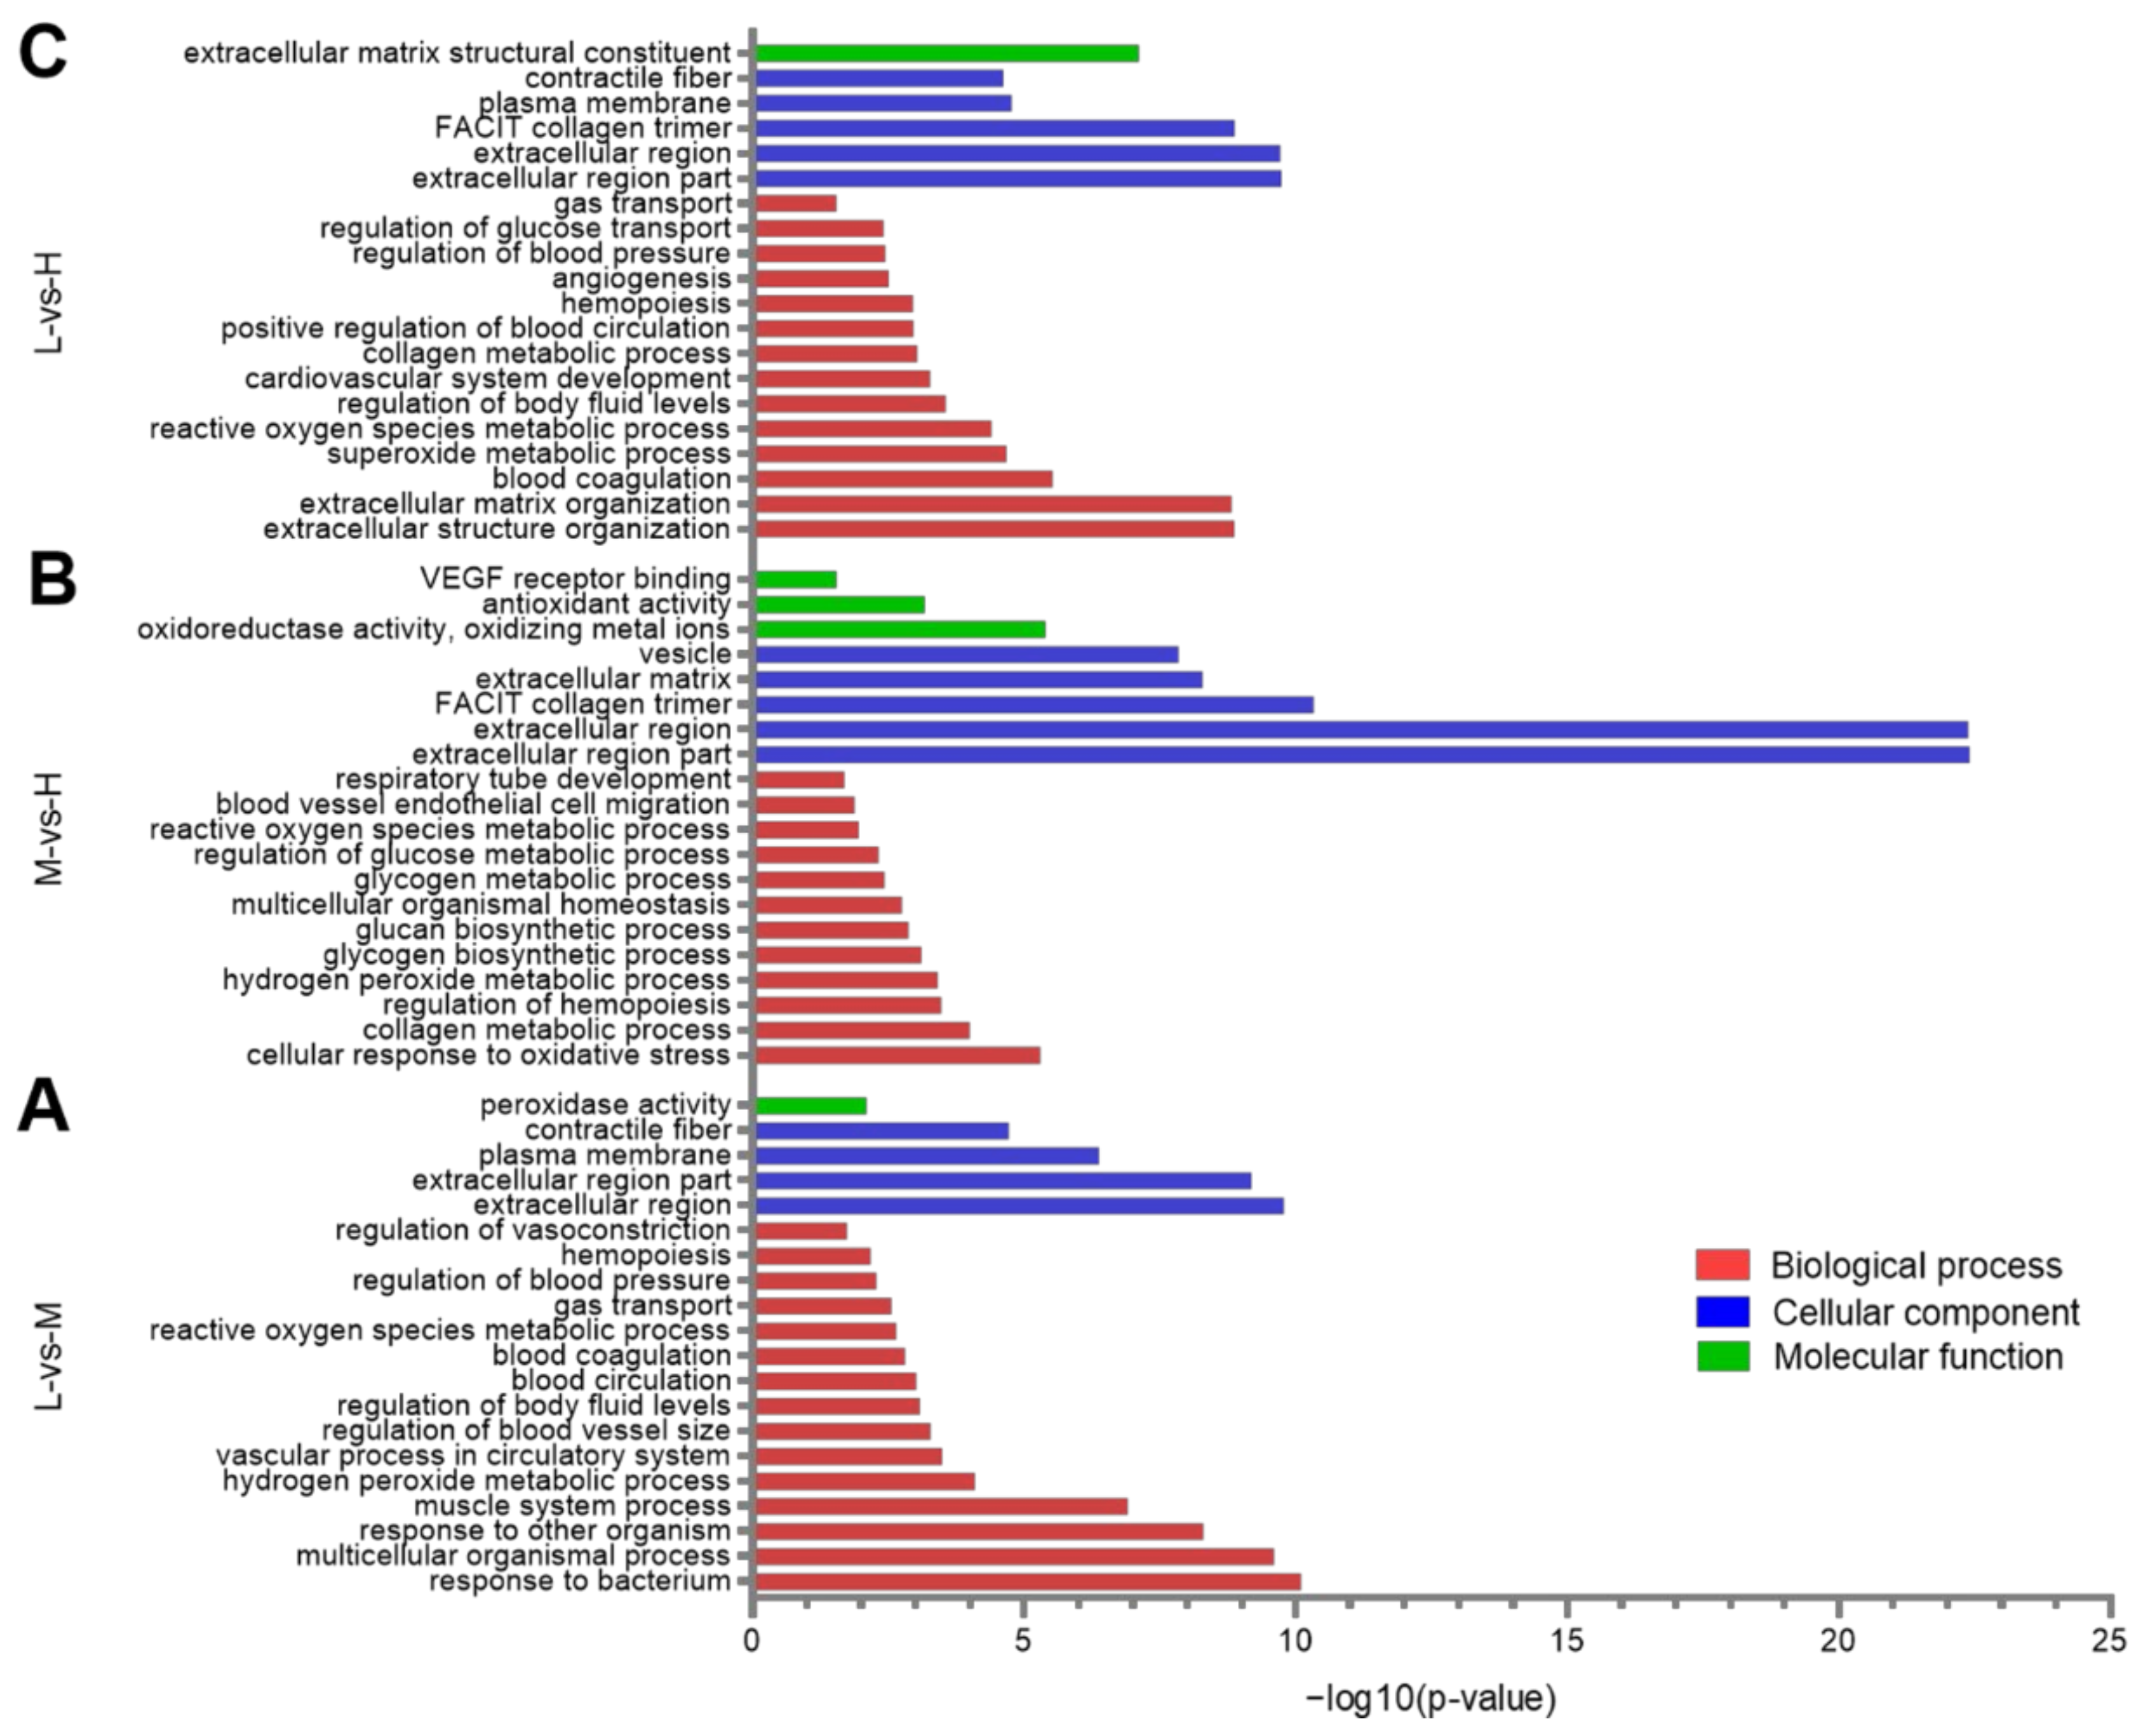
3.4. GO Enrichment Analysis of the DEPs
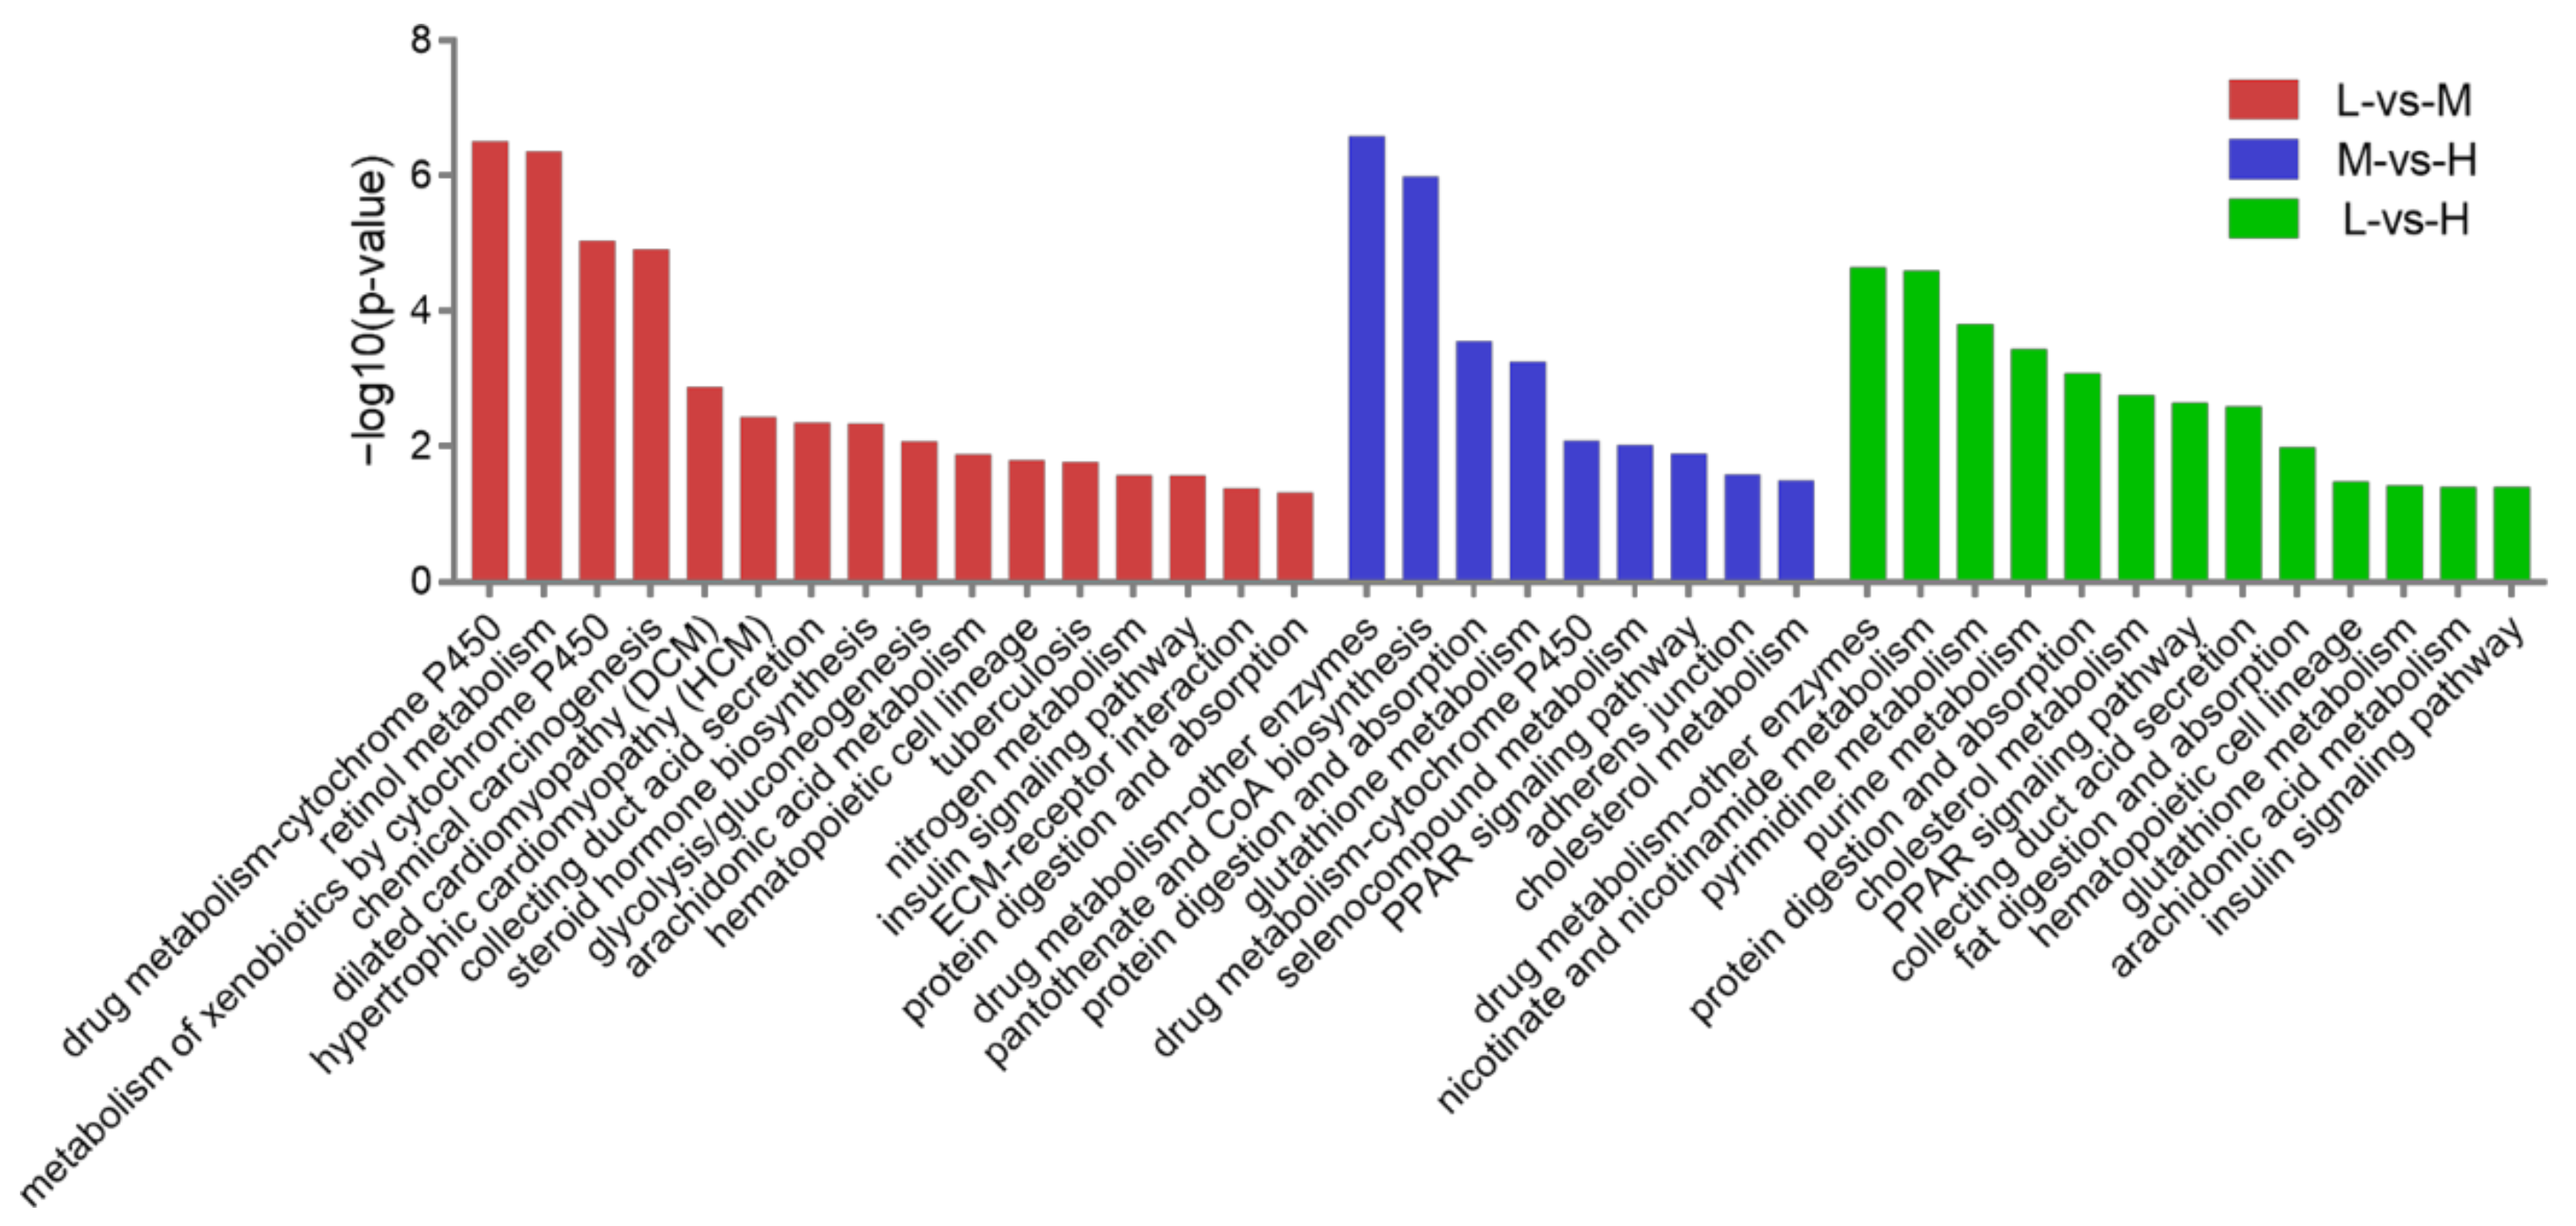
3.5. KEGG Pathway Analysis of the DEPs
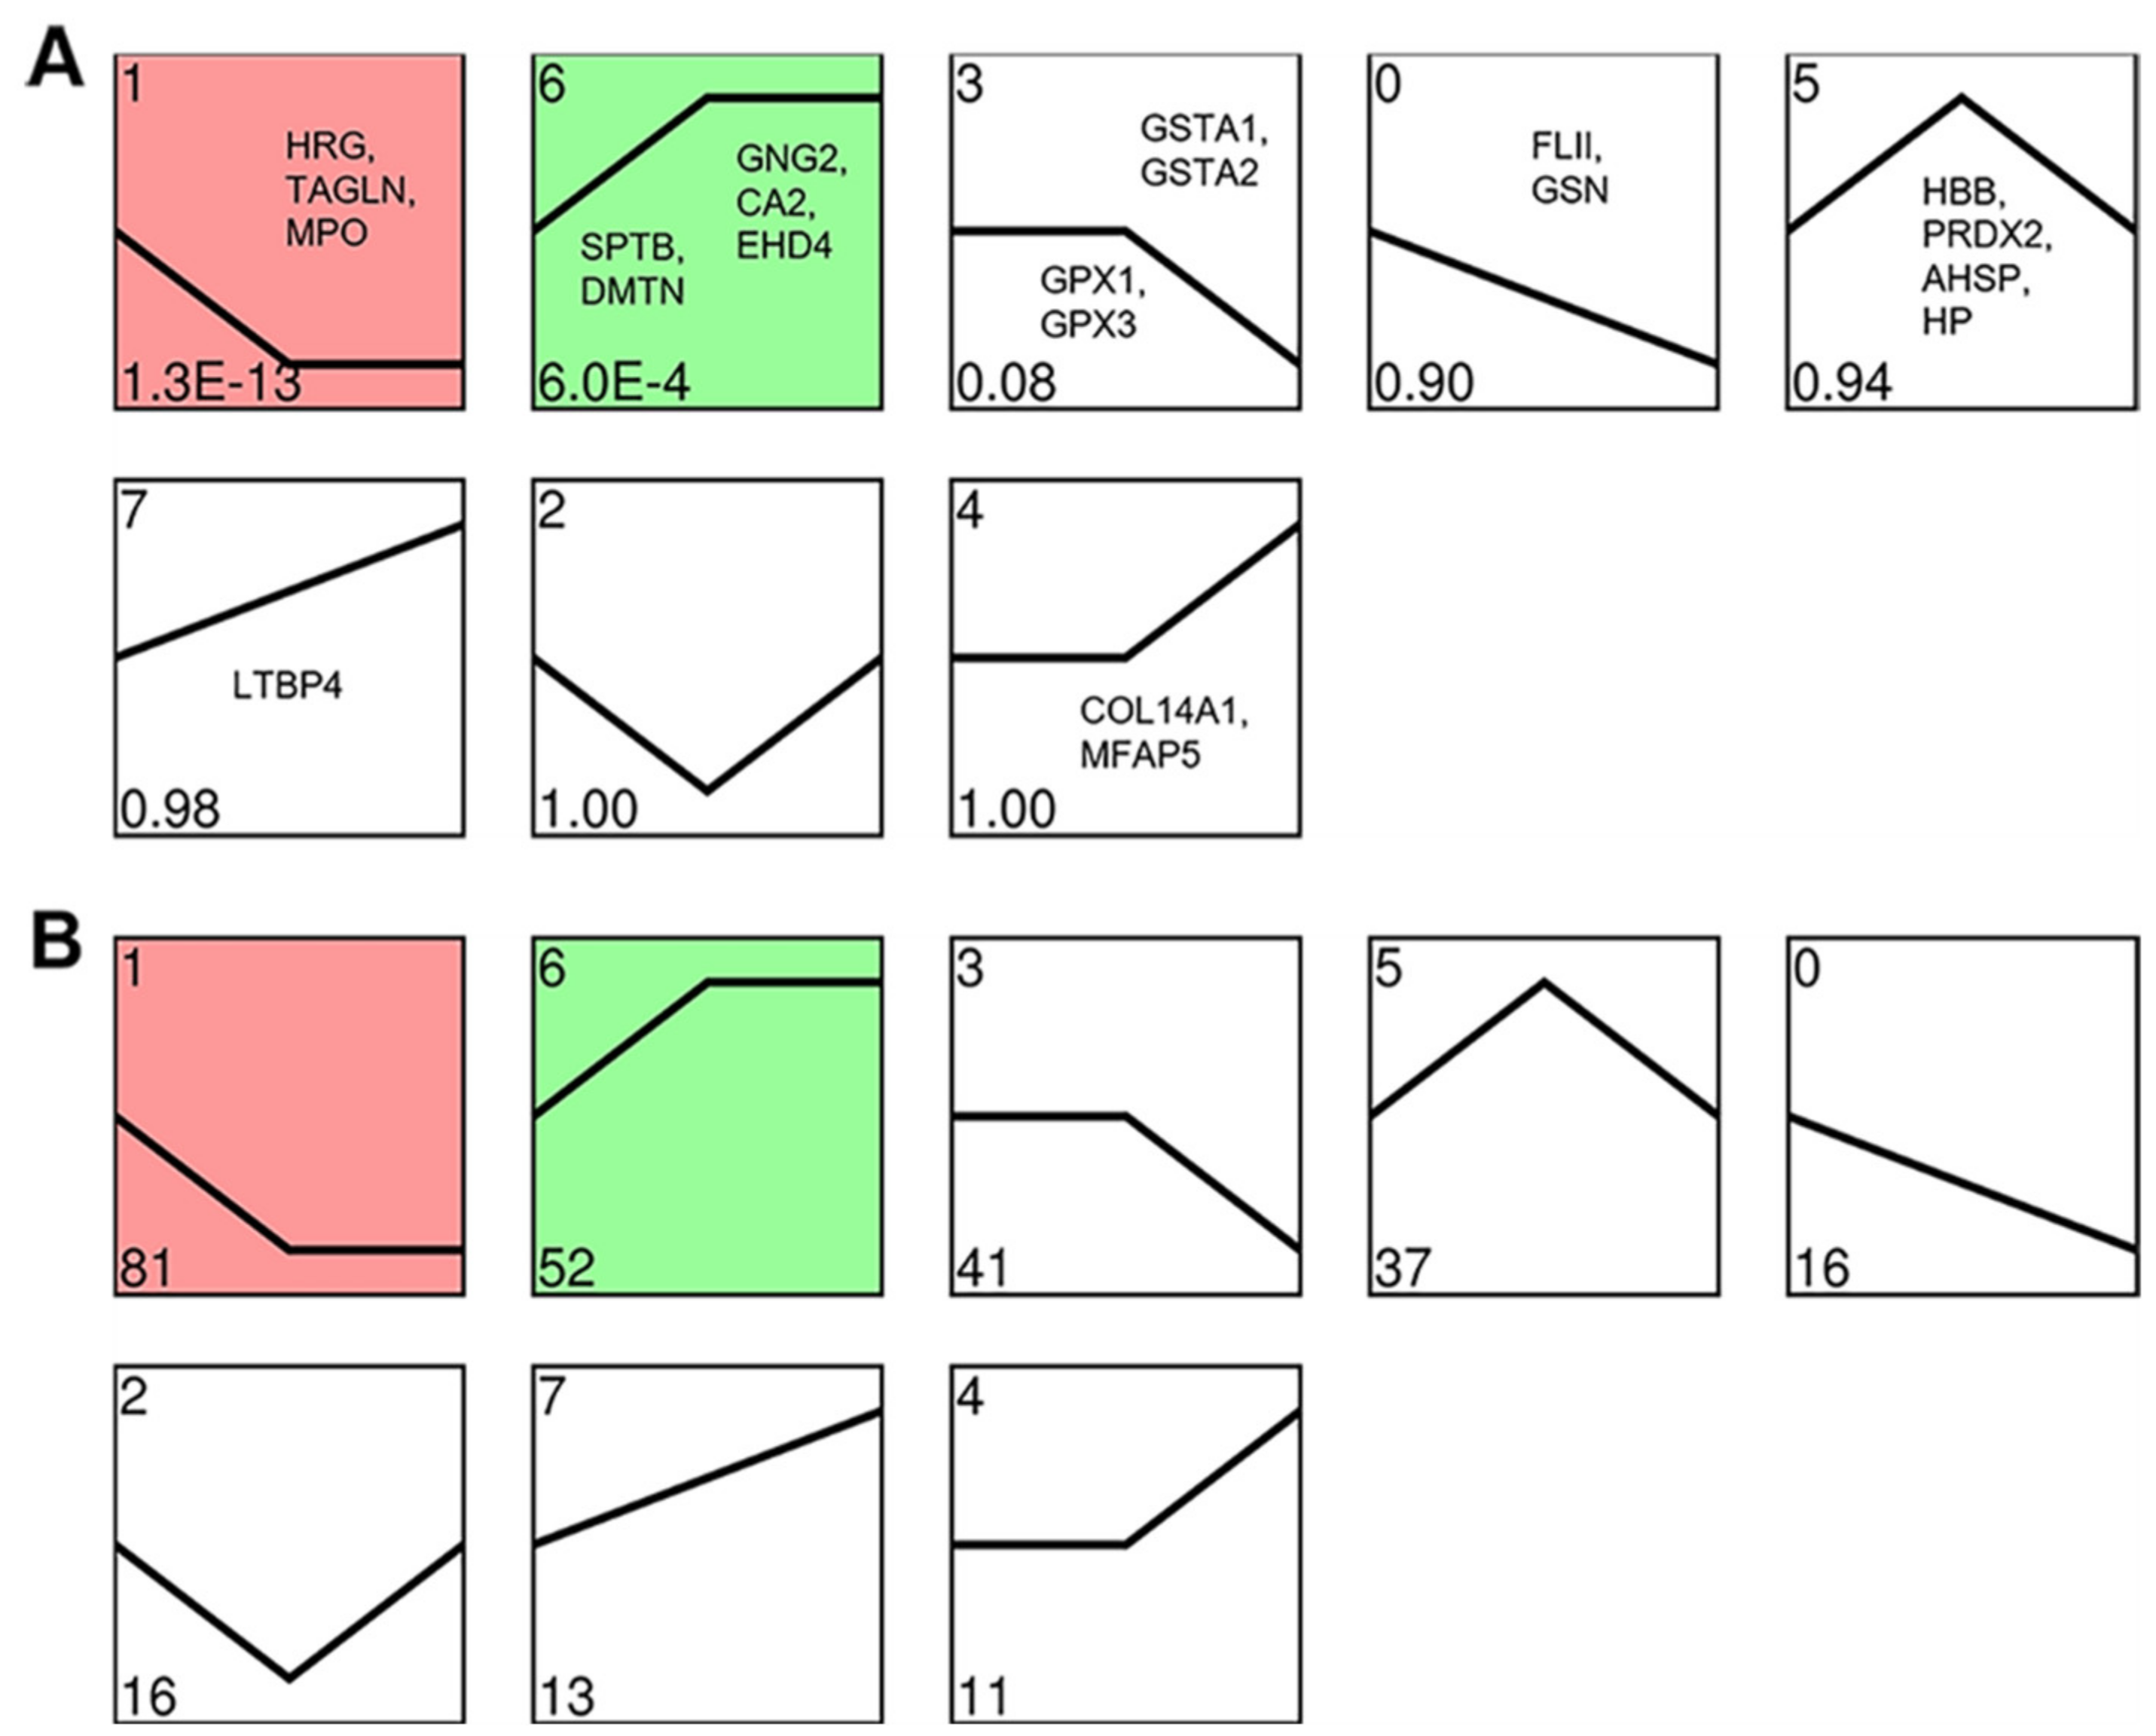
3.6. Cluster Analysis of the DEPs
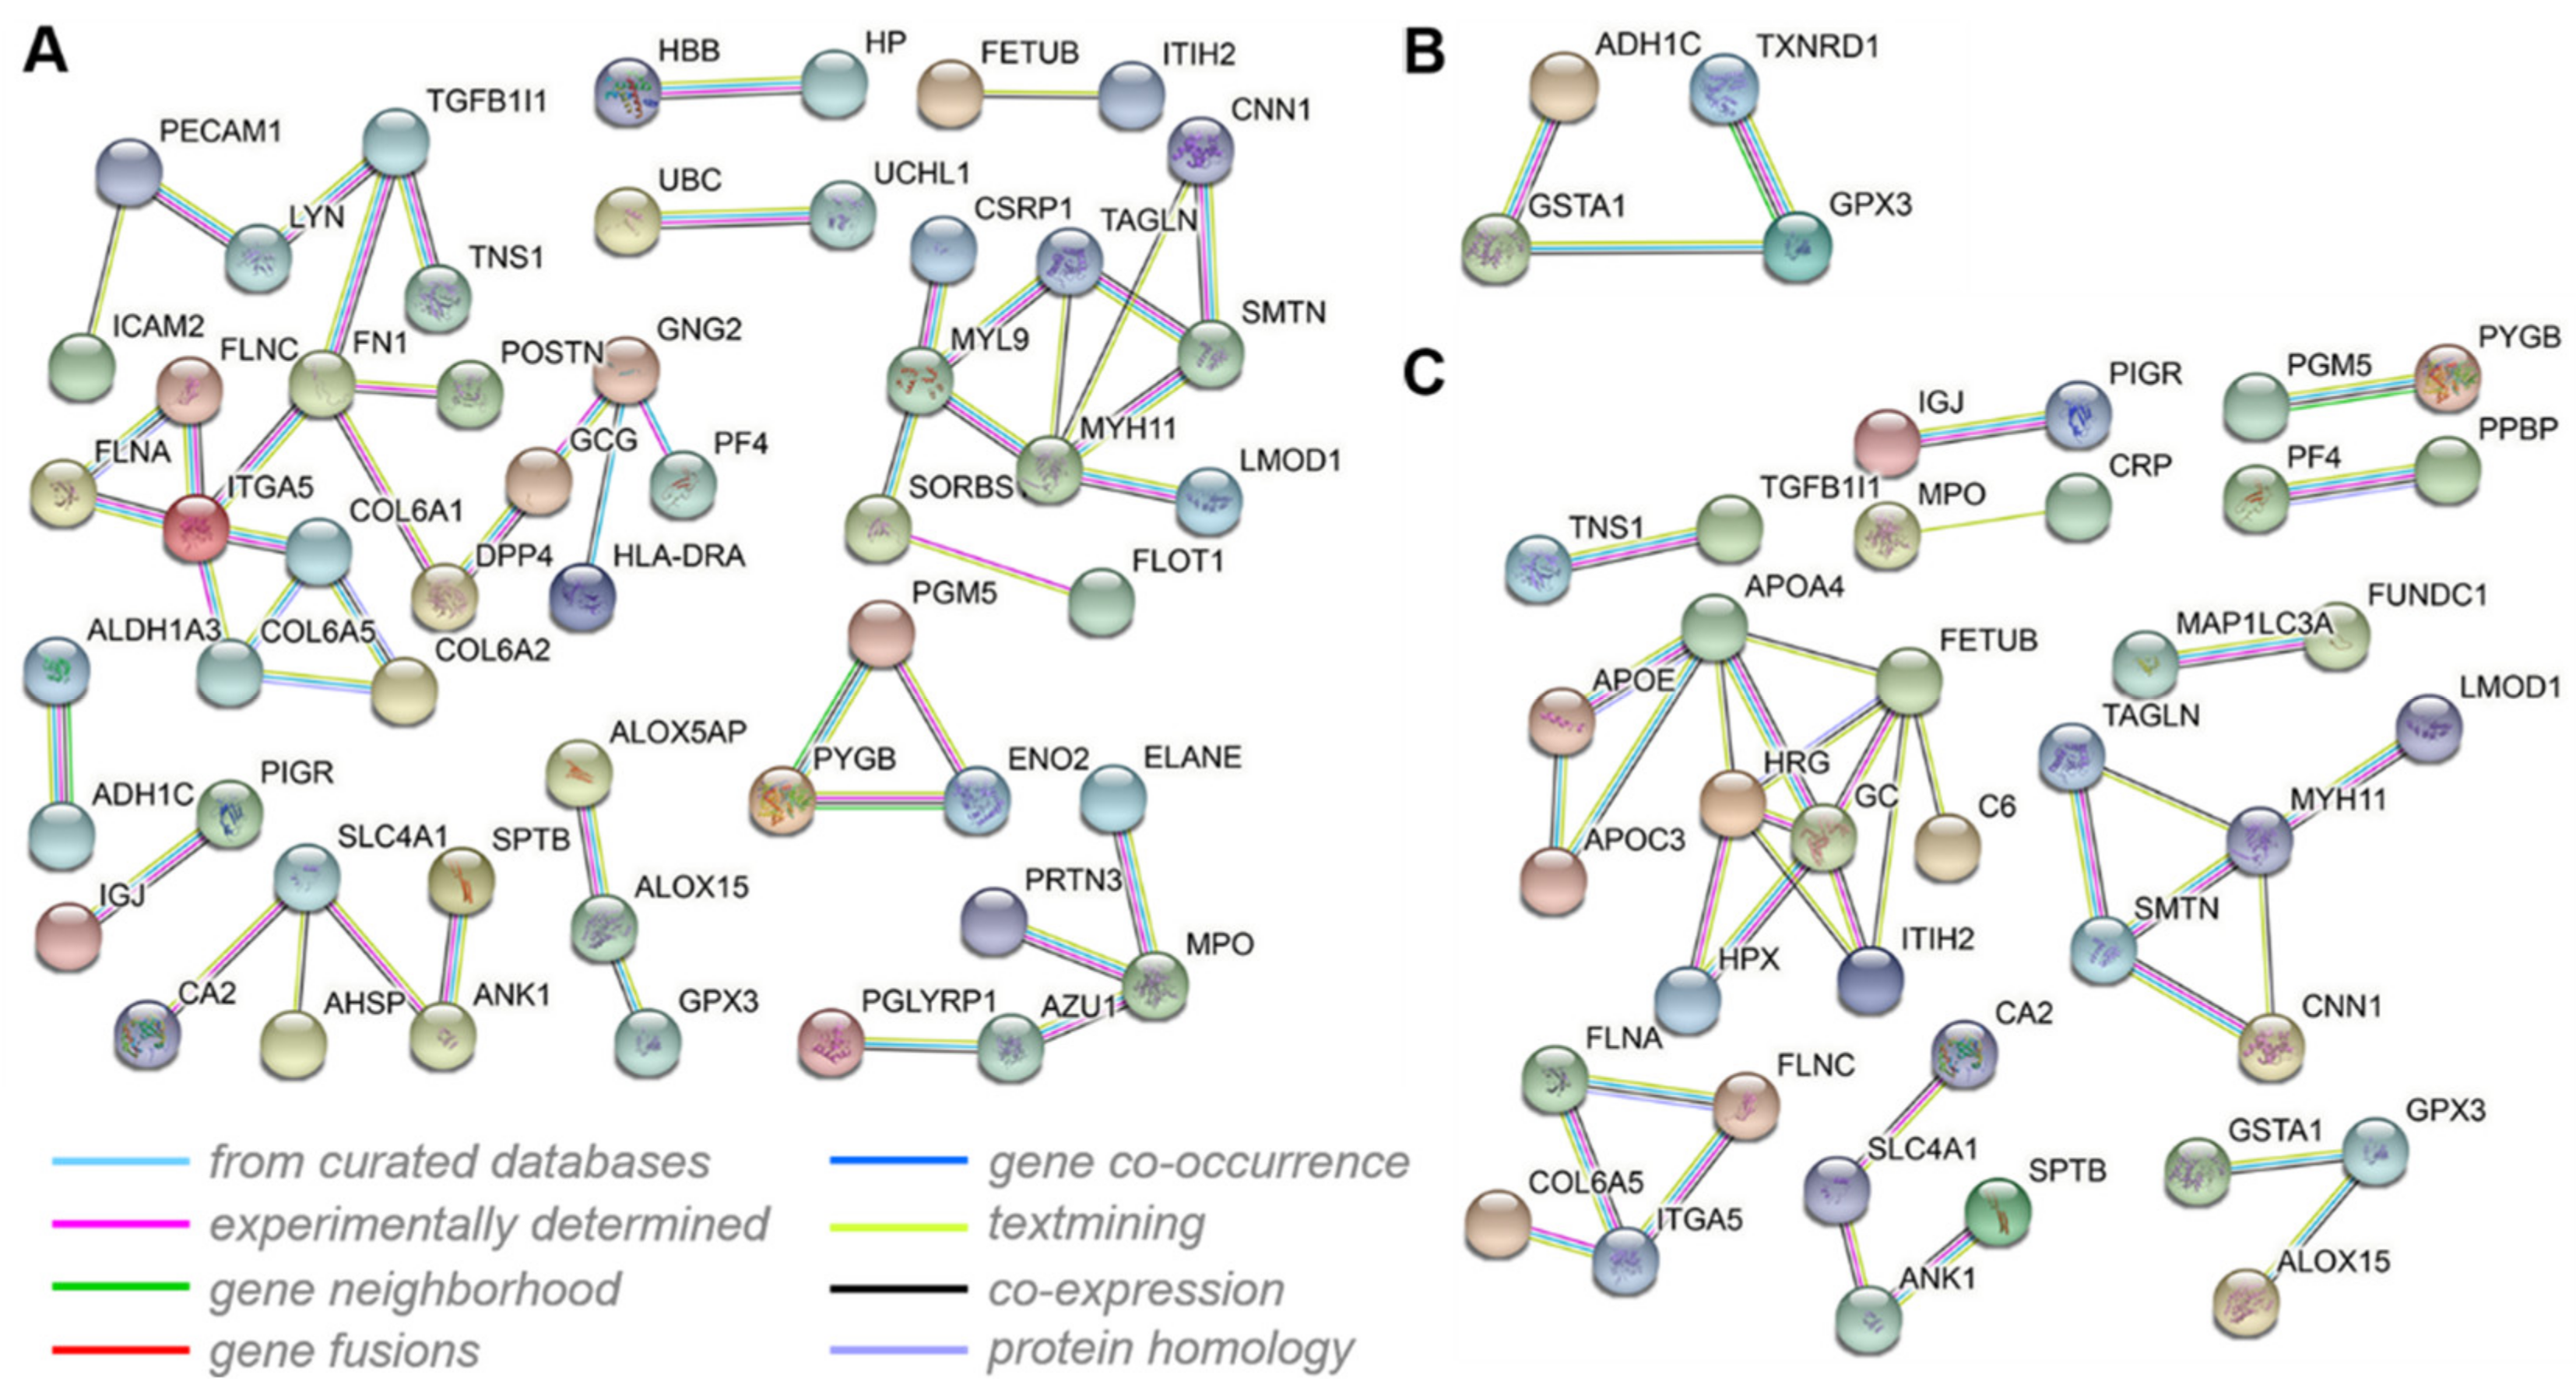
3.7. Interactive Network Analysis of the DEPs
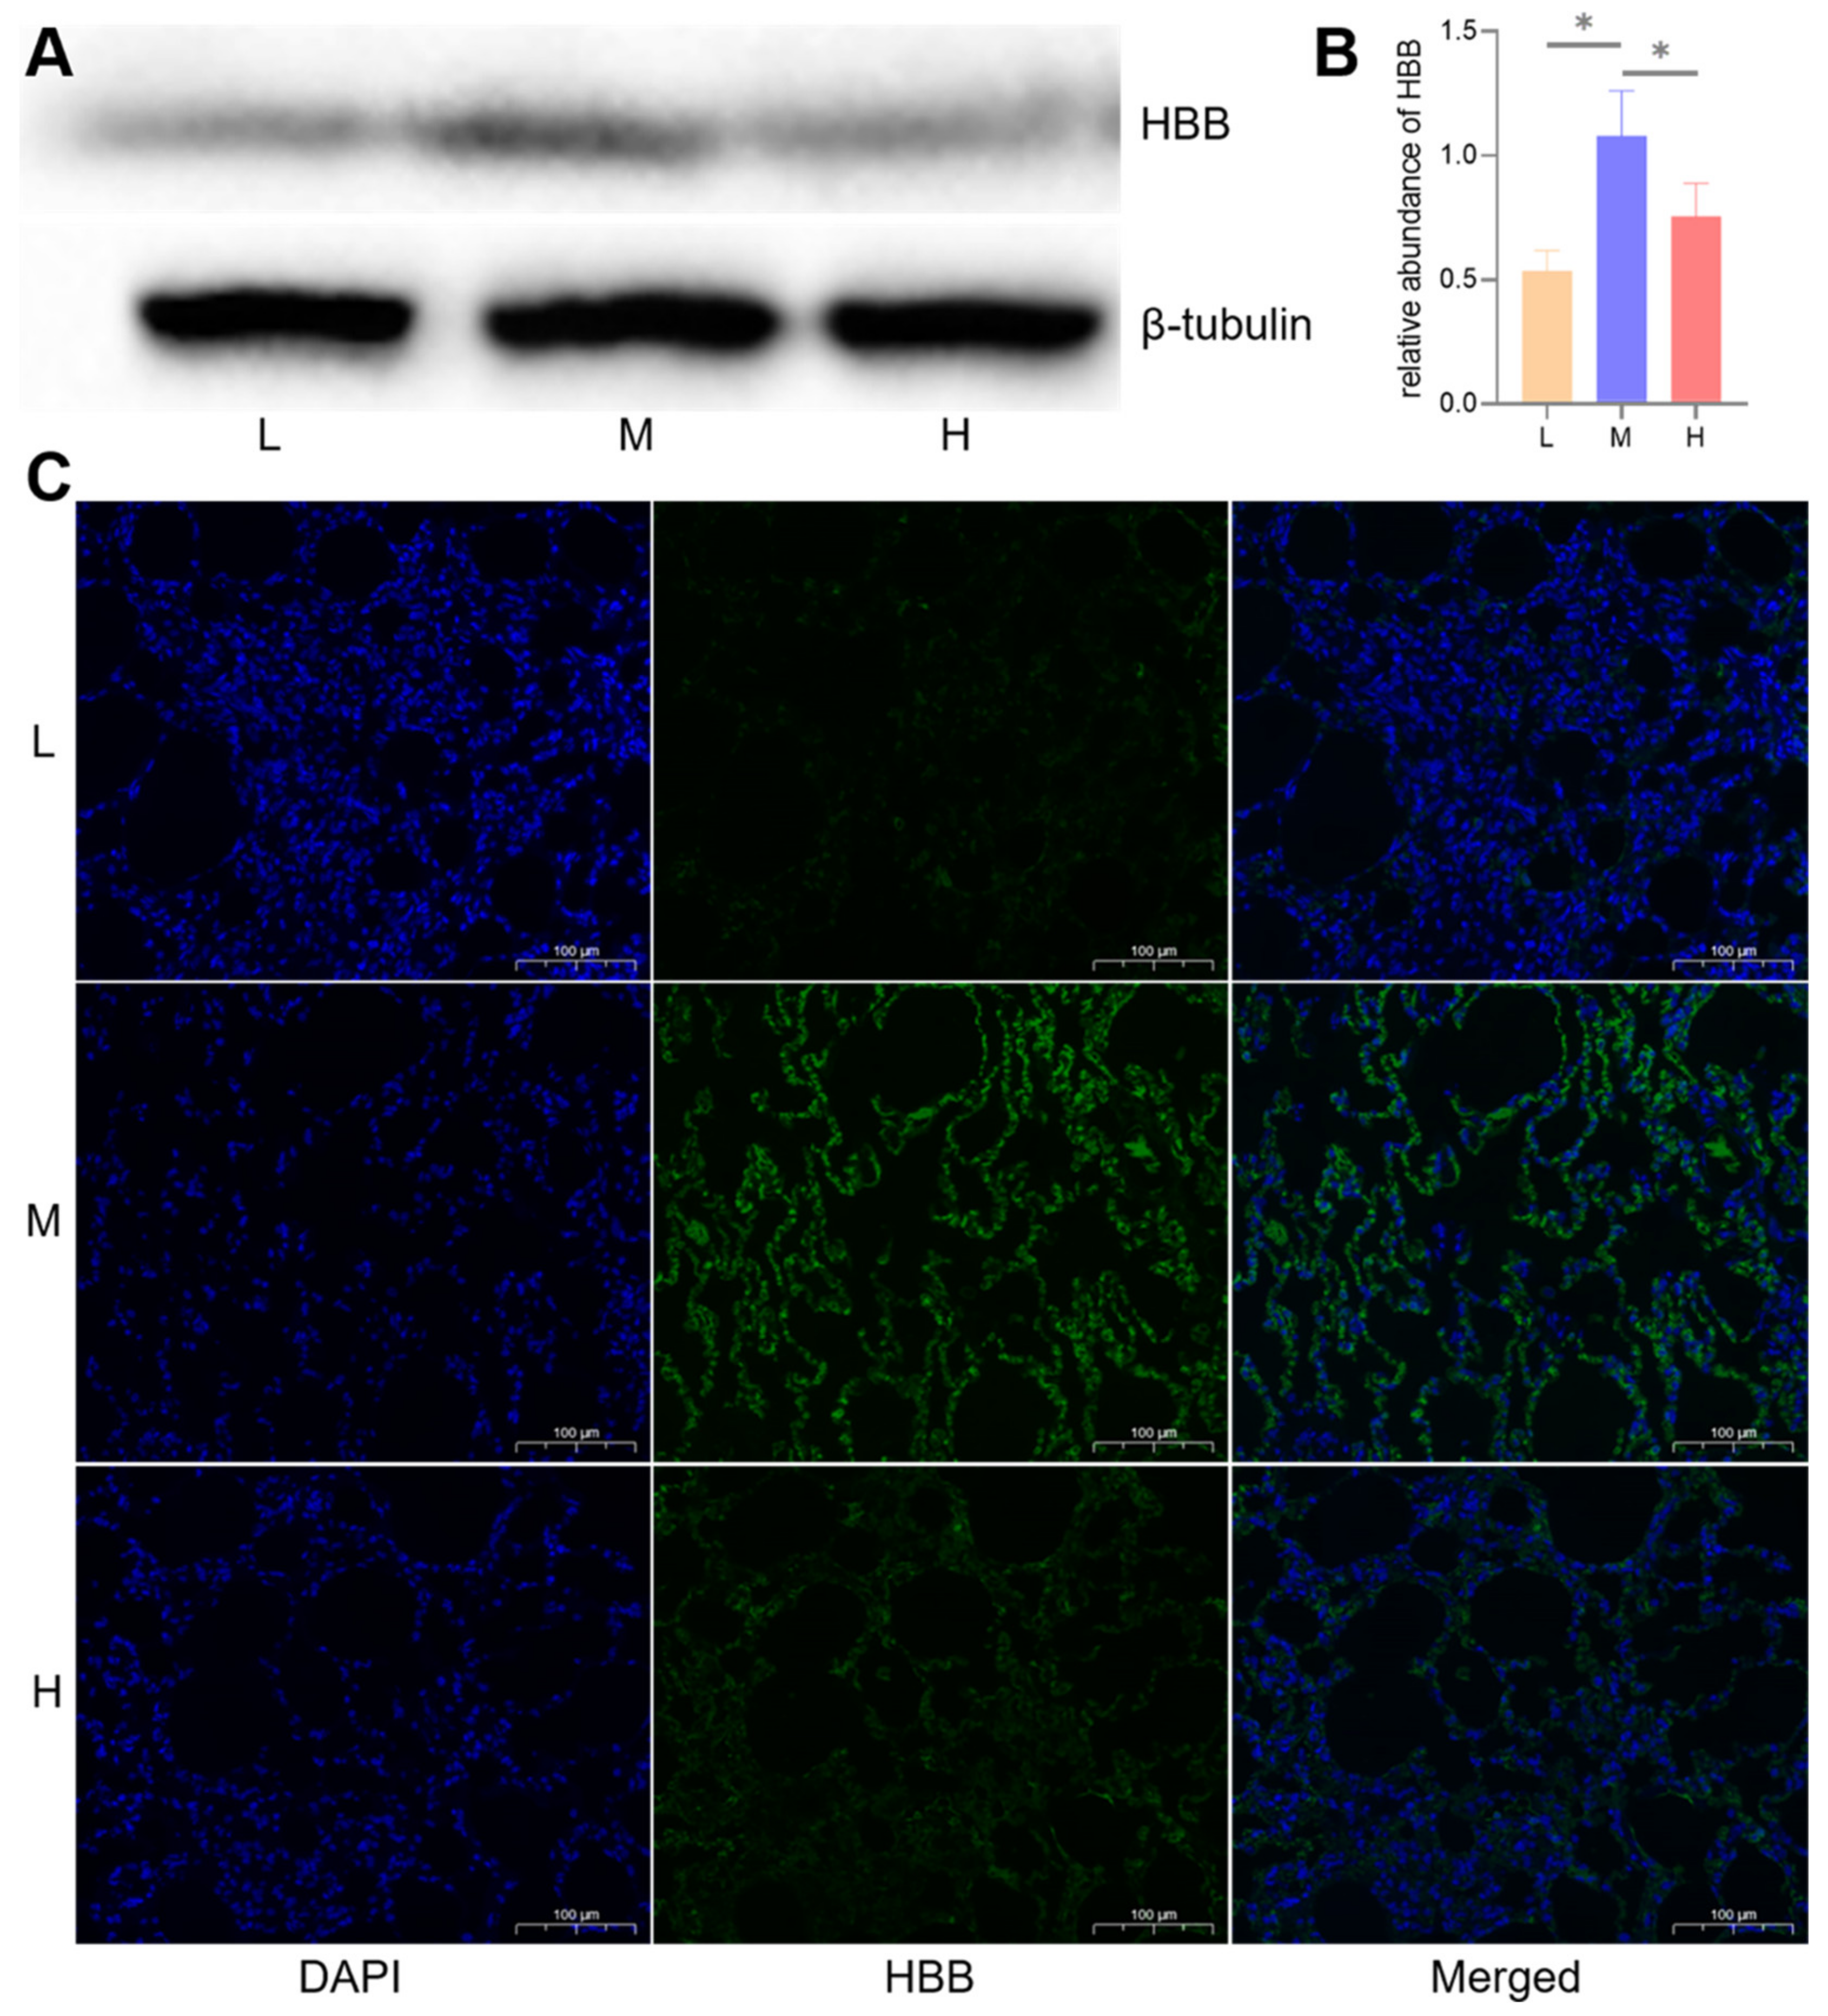
3.8. WB and Immunofluorescence Validation of DIA Data
4. Discussion
5. Conclusions
Author Contributions
Funding
Institutional Review Board Statement
Informed Consent Statement
Data Availability Statement
Acknowledgments
Conflicts of Interest
References
- Wei, Q.; Yu, H. Comparison of histological structure of pulmonary alveoli between 180 days old yak and plain cattle. J. Qinghai Univ. Nat. Sci. 2008, 26, 36–39. [Google Scholar] [CrossRef]
- Ding, X.; Liang, C.; Guo, X.; Wu, X.; Wang, H.; Johnson, K.A.; Yan, P. Physiological insight into the high-altitude adaptations in domesticated yaks (Bos grunniens) along the Qinghai-Tibetan Plateau altitudinal gradient. Livest. Sci. 2014, 162, 233–239. [Google Scholar] [CrossRef]
- Hsia, C.; Carbayo, J.; Yan, X.; Bellotto, D.J. Enhanced alveolar growth and remodeling in Guinea pigs raised at high altitude. Respir. Physiol. Neurobiol. 2005, 147, 105–115. [Google Scholar] [CrossRef] [PubMed]
- Hsia, C.; Johnson, R.L.; Mcdonough, P.; Dane, D.M.; Hurst, M.D.; Fehmel, J.L.; Wagner, H.E.; Wagner, P.D. Residence at 3800-m altitude for 5 mo in growing dogs enhances lung diffusing capacity for oxygen that persists at least 2.5 years. J. Appl. Physiol. 2007, 102, 1448–1455. [Google Scholar] [CrossRef]
- Maina, J.N.; Mccracken, K.G.; Beverly, C.; York, J.M.; Milsom, W.K.; James, W. Morphological and morphometric specializations of the lung of the Andean goose, Chloephaga melanoptera: A lifelong high-altitude resident. PLoS ONE 2017, 12, e174395. [Google Scholar] [CrossRef] [PubMed]
- Wang, G.; He, Y.; Luo, Y. Expression of OPA1 and Mic60 genes and their association with mitochondrial cristae morphology in Tibetan sheep. Cell. Tissue Res. 2019, 376, 273–279. [Google Scholar] [CrossRef]
- Sun, S.; Droma, T.S.; Zhang, J.; Tao, J.; Huang, S.; McCullough, R.G.; McCullough, R.E.; Reeves, C.S.; Reeves, J.T.; Moore, L.G. Greater maximal O2 uptakes and vital capacities in Tibetan than Han residents of Lhasa. Respir. Physiol. 1990, 79, 151–162. [Google Scholar] [CrossRef]
- Kapoor, S.; Kapoor, A.K. Body structure and respiratory efficiency among high altitude Himalayan populations. Coll. Antropol. 2005, 29, 37–43. [Google Scholar] [CrossRef]
- Groves, B.M.; Droma, T.; Sutton, J.R.; Mccullough, R.G.; Mccullough, R.E.; Zhuang, J.; Rapmund, G.; Sun, S.; Janes, C.; Moore, L.G. Minimal hypoxic pulmonary hypertension in normal Tibetans at 3658 m. J. Appl. Physiol. 1993, 74, 312–318. [Google Scholar] [CrossRef]
- Wu, T.; Wang, X.; Wei, C.; Cheng, H.; Wang, X.; Li, Y.; Dong, G.; Zhao, H.; Young, P.; Li, G.; et al. Hemoglobin levels in Qinghai-Tibet: Different effects of gender for Tibetans vs. Han. J. Appl. Physiol. 2005, 98, 598–604. [Google Scholar] [CrossRef]
- Liu, X.; Zhang, Y.; Li, Y.; Pan, J.; Wang, D.; Chen, W.; Zheng, Z.; He, X.; Zhao, Q.; Pu, Y.; et al. EPAS1 gain-of-function mutation contributes to high-altitude adaptation in Tibetan horses. Mol. Biol. Evol. 2019, 36, 2591–2603. [Google Scholar] [CrossRef] [PubMed]
- Gou, X.; Wang, Z.; Li, N.; Qiu, F.; Xu, Z.; Yan, D.; Yang, S.; Jia, J.; Kong, X.; Wei, Z.; et al. Whole-genome sequencing of six dog breeds from continuous altitudes reveals adaptation to high-altitude hypoxia. Genome Res. 2014, 24, 1308–1315. [Google Scholar] [CrossRef] [PubMed]
- Wei, C.; Wang, H.; Liu, G.; Zhao, F.; Kijas, J.W.; Ma, Y.; Lu, J.; Zhang, L.; Cao, J.; Wu, M.; et al. Genome-wide analysis reveals adaptation to high altitudes in Tibetan sheep. Sci. Rep. 2016, 6, 26770. [Google Scholar] [CrossRef] [PubMed]
- Kong, X.; Dong, X.; Yang, S.; Qian, J.; Yang, J.; Jiang, Q.; Li, X.; Wang, B.; Yan, D.; Lu, S.; et al. Natural selection on TMPRSS6 associated with the blunted erythropoiesis and improved blood viscosity in Tibetan pigs. Comp. Biochem. Physiol. B Biochem. Mol. Biol. 2019, 233, 11–22. [Google Scholar] [CrossRef] [PubMed]
- Hu, X.; Yang, J.; Xie, X.; Lv, F.; Cao, Y.; Li, W.; Liu, M.; Wang, Y.; Li, J.; Liu, Y.; et al. The Genome Landscape of Tibetan Sheep Reveals Adaptive Introgression from Argali and the History of Early Human Settlements on the Qinghai-Tibetan Plateau. Mol. Biol. Evol. 2019, 36, 283–303. [Google Scholar] [CrossRef]
- Lichtman, M.A.; Murphy, M.S.; Adamson, J.W. Detection of mutant hemoglobins with altered affinity for oxygen. A simplified technique. Ann. Intern. Med. 1976, 84, 517. [Google Scholar] [CrossRef]
- Benjamini, Y.; Hochberg, Y. Controlling the False Discovery Rate: A Practical and Powerful Approach to Multiple Testing. J. R. Stat. Soc. B 1995, 57, 289–300. [Google Scholar] [CrossRef]
- Huang, D.W.; Sherman, B.T.; Zheng, X.; Yang, J.; Imamichi, T.; Stephens, R.; Lempicki, R.A. Extracting biological meaning from large gene lists with DAVID. Curr. Protoc. Bioinform. 2009, 27, 11. [Google Scholar] [CrossRef]
- Ernst, J.; Bar-Joseph, Z. STEM: A tool for the analysis of short time series gene expression data. BMC Bioinform. 2006, 7, 191–201. [Google Scholar] [CrossRef]
- Szklarczyk, D.; Franceschini, A.; Wyder, S.; Forslund, K.; Heller, D.; Huerta-Cepas, J.; Simonovic, M.; Roth, A.; Santos, A.; Tsafou, K.P.; et al. STRING v10: Protein–protein interaction networks, integrated over the tree of life. Nucleic Acids Res. 2015, 43, 447–452. [Google Scholar] [CrossRef]
- Shannon, P.; Markiel, A.; Ozier, O.; Baliga, N.S.; Wang, J.T.; Ramage, D.; Amin, N.; Schwikowski, B.; Ideker, T. Cytoscape: A Software Environment for Integrated Models of Biomolecular Interaction Networks. Genome Res. 2003, 13, 2498–2504. [Google Scholar] [CrossRef] [PubMed]
- Otten, E.J. High altitude: An exploration of human adaptation. J. Emerg. Med. 2003, 25, 345–346. [Google Scholar] [CrossRef]
- Zhuang, J.; Droma, T.; Sun, S.; Janes, C.; Mccullough, R.E.; Mccullough, R.G.; Cymerman, A.; Huang, S.Y.; Reeves, J.T.; Moore, L.G. Hypoxic ventilatory responsiveness in Tibetan compared with Han residents of 3658 m. J. Appl. Physiol. 1993, 74, 303–311. [Google Scholar] [CrossRef] [PubMed]
- Stembridgea, M.; Williamsb, A.M.; Gashoc, C.; Dawkinsa, T.G.; Dranea, A.; Villafuerted, F.C.; Levinee, B.D.; Shaveb, R.; Ainslieb, P.N. The overlooked significance of plasma volume for successful adaptation to high altitude in Sherpa and Andean natives. Proc. Natl. Acad. Sci. USA 2019, 116, 16177–16179. [Google Scholar] [CrossRef]
- Rao, M.; Li, J.; Qin, J.; Zhang, J.; Gao, X.; Yu, S.; Jie, Y.; Chen, G.; Xu, B.; Li, H.; et al. Left Ventricular Function during Acute High-Altitude Exposure in a Large Group of Healthy Young Chinese Men. PLoS ONE 2015, 10, e116936. [Google Scholar] [CrossRef]
- Maron, B.A.; Oldham, W.M.; Chan, S.Y.; Vargas, S.O.; Arons, E.; Zhang, Y.; Loscalzo, J.; Leopold, J.A. Upregulation of steroidogenic acute regulatory protein by hypoxia stimulates aldosterone synthesis in pulmonary artery endothelial cells to promote pulmonary vascular fibrosis. Circulation 2014, 130, 168–179. [Google Scholar] [CrossRef]
- Lefrancais, E.; Ortiz-Munoz, G.; Caudrillier, A.; Mallavia, B.; Liu, F.; Sayah, D.M.; Thornton, E.E.; Headley, M.B.; David, T.; Coughlin, S.R.; et al. The lung is a site of platelet biogenesis and a reservoir for haematopoietic progenitors. Nature 2017, 544, 105–109. [Google Scholar] [CrossRef]
- Nagababu, E.; Mohanty, J.G.; Friedman, J.S.; Rifkind, J.M. Role of peroxiredoxin-2 in protecting RBCs from hydrogen peroxide-induced oxidative stress. Free Radic. Res. 2013, 47, 164–171. [Google Scholar] [CrossRef]
- Rocha, S.; Gomes, D.; Lima, M.; Bronze-Da-Rocha, E.; Santos-Silva, A. Peroxiredoxin 2, Glutathione Peroxidase and Catalase in the cytosol and membrane of erythrocytes under H2O2-induced oxidative stress. Free Radic. Res. 2015, 49, 990–1003. [Google Scholar] [CrossRef]
- Mollan, T.L.; Banerjee, S.; Wu, G.; Siburt, C.; Tsai, A.L.; Olson, J.S.; Weiss, M.J.; Crumbliss, A.L.; Alayash, A.I. α-Hemoglobin Stabilizing Protein (AHSP) Markedly Decreases the Redox Potential and Reactivity of α-Subunits of Human HbA with Hydrogen Peroxide. J. Biol. Chem. 2012, 288, 4288–4298. [Google Scholar] [CrossRef]
- Kazmi, N.; Koda, Y.; Ndiaye, N.C.; Visvikis-Siest, S.; Morton, M.J.; Gaunt, T.R.; Galea, I. Genetic determinants of circulating haptoglobin concentration. Clin. Chim. Acta 2019, 494, 138–142. [Google Scholar] [CrossRef] [PubMed]
- Niss, O.; Chonat, S.; Dagaonkar, N.; Almansoori, M.O.; Kerr, K.; Rogers, Z.R.; McGann, P.T.; Quarmyne, M.; Risinger, M.; Zhang, K.; et al. Genotype-phenotype correlations in hereditary elliptocytosis and hereditary pyropoikilocytosis. Blood Cells Mol. Dis. 2016, 61, 4–9. [Google Scholar] [CrossRef] [PubMed]
- Lu, Y.; Hanada, T.; Fujiwara, Y.; Nwankwo, J.O.; Wieschhaus, A.J.; Hartwig, J.; Huang, S.; Han, J.; Chishti, A.H. Gene disruption of dematin causes precipitous loss of erythrocyte membrane stability and severe hemolytic anemia. Blood 2016, 128, 93–103. [Google Scholar] [CrossRef]
- Lubos, E.; Loscalzo, J.; Handy, D.E. Glutathione Peroxidase-1 in Health and Disease: From Molecular Mechanisms to Therapeutic Opportunities. Antioxid. Redox Signal. 2010, 15, 1957–1997. [Google Scholar] [CrossRef] [PubMed]
- Ursini, F.; Maiorino, M. Glutathione peroxidases. Biochim. Biophys. Acta BBA Gen. Subj. 2013, 1830, 3289–3303. [Google Scholar] [CrossRef]
- Singhal, S.S.; Singh, S.P.; Singhal, P.; Horne, D.; Singhal, J.; Awasthi, S. Antioxidant Role of Glutathione S-Transferases: 4-Hydroxynonenal, a Key Molecule in Stress-Mediated Signaling. Toxicol. Appl. Pharmacol. 2015, 289, 361–370. [Google Scholar] [CrossRef]
- Alqarni, M.H.; Foudah, A.I.; Muharram, M.M.; Labrou, N.E. The Interaction of Human Glutathione Transferase GSTA1-1 with Reactive Dyes. Molecules 2021, 26, 2399. [Google Scholar] [CrossRef]
- Gaur, P.; Prasad, S.; Kumar, B.; Sharma, S.K.; Vats, P. High-altitude hypoxia induced reactive oxygen species generation, signaling, and mitigation approaches. Int. J. Biometeorol. 2021, 65, 601–615. [Google Scholar] [CrossRef]
- Földes-Papp, Z.; Domej, W.; Demel, U.; Tilz, G.P. Oxidative stress caused by acute and chronic exposition to altitude. Wien. Med. Wochenschr. 2005, 155, 136–142. [Google Scholar] [CrossRef]
- Yasuda, M.; Ohzeki, Y.; Shimizu, S.; Naito, S.; Ohtsuru, A.; Yamamoto, T.; Kuroiwa, Y. Stimulation of in vitro angiogenesis by hydrogen peroxide and the relation with ETS-1 in endothelial cells. Life Sci. 1996, 64, 249–258. [Google Scholar] [CrossRef]
- Yamagishi, S.I.; Amano, S.; Inagaki, Y.; Okamoto, T.; Takeuchi, M.; Inoue, H. Pigment epithelium-derived factor inhibits leptin-induced angiogenesis by suppressing vascular endothelial growth factor gene expression through anti-oxidative properties. Microvasc. Res. 2003, 65, 186–190. [Google Scholar] [CrossRef]
- Kim, Y.W.; Byzova, T.V. Oxidative stress in angiogenesis and vascular disease. Blood 2014, 123, 625–631. [Google Scholar] [CrossRef] [PubMed]
- Ruzehaji, N.; Kopecki, Z.; Melville, E.; Appleby, S.L.; Bonder, C.S.; Arkell, R.M.; Fitridge, R.; Cowin, A.J. Attenuation of flightless I improves wound healing and enhances angiogenesis in a murine model of type 1 diabetes. Diabetologia 2014, 57, 402–412. [Google Scholar] [CrossRef] [PubMed]
- Thomas, H.M.; Ahangar, P.; Hofma, B.R.; Strudwick, X.L.; Fitridge, R.; Mills, S.J.; Cowin, A.J. Attenuation of Flightless I Increases Human Pericyte Proliferation, Migration and Angiogenic Functions and Improves Healing in Murine Diabetic Wounds. Int. J. Mol. Sci. 2020, 21, 5599. [Google Scholar] [CrossRef] [PubMed]
- Thulin, A.; Ringvall, M.; Dimberg, A.; Kårehed, K.; Väisänen, T.; Väisänen, M.; Hamad, O.; Wang, J.; Bjerkvig, R.; Nilsson, B. Activated Platelets Provide a Functional Microenvironment for the Antiangiogenic Fragment of Histidine-Rich Glycoprotein. Mol. Cancer Res. 2009, 7, 1792–1802. [Google Scholar] [CrossRef]
- Tsuji-Tamura, K.; Morino-Koga, S.; Suzuki, S.; Ogawa, M. TAGLN, a canonical marker of smooth muscle cells, is present in endothelial cells and involved in angiogenesis. J. Cell Sci. 2021, 134, jcs254920. [Google Scholar] [CrossRef]
- Xie, X.; Nie, X.; Wu, J.; Zhang, F.; Zhao, L.; Lin, Y.; Yin, Y.; Liu, H.; Shu, Y.; Miao, S. Smooth muscle 22alpha facilitates angiotensin II-induced signaling and vascular contraction. J. Mol. Med. 2015, 93, 547–558. [Google Scholar] [CrossRef]
- Klinke, A.; Berghausen, E.; Friedrichs, K.; Molz, S.; Lau, D.; Remane, L.; Berlin, M.; Kaltwasser, C.; Adam, M.; Mehrkens, D. Myeloperoxidase aggravates pulmonary arterial hypertension by activation of vascular Rho-kinase. JCI Insight 2018, 3, e97530. [Google Scholar] [CrossRef]
- Becker, P.M.; Kazi, A.A.; Wadgaonkar, R.; Pearse, D.B.; Kwiatkowski, D.; Garcia, J.G. Pulmonary vascular permeability and ischemic injury in gelsolin-deficient mice. Am. J. Respir. Cell Mol. Biol. 2003, 28, 478–484. [Google Scholar] [CrossRef]
- Knezevic, N.; Tauseef, M.; Thennes, T.; Mehta, D. The G protein betagamma subunit mediates reannealing of adherens junctions to reverse endothelial permeability increase by thrombin. J. Exp. Med. 2009, 206, 2761–2777. [Google Scholar] [CrossRef]
- Stott, J.B.; Povstyan, O.V.; Carr, G.; Barrese, V.; Greenwood, I.A. G-protein betagamma subunits are positive regulators of Kv7.4 and native vascular Kv7 channel activity. Proc. Natl. Acad. Sci. USA 2015, 112, 6497–6502. [Google Scholar] [CrossRef] [PubMed]
- Hanff, E.; Bohmer, A.; Zinke, M.; Gambaryan, S.; Schwarz, A.; Supuran, C.T.; Tsikas, D. Carbonic anhydrases are producers of S-nitrosothiols from inorganic nitrite and modulators of soluble guanylyl cyclase in human platelets. Amino Acids 2016, 48, 1695–1706. [Google Scholar] [CrossRef] [PubMed]
- Van Doren, S.R. Matrix metalloproteinase interactions with collagen and elastin. Matrix Biol. 2015, 44–46, 224–231. [Google Scholar] [CrossRef] [PubMed]
- Bultmann-Mellin, I.; Dinger, K.; Debuschewitz, C.; Loewe, K.; Melcher, Y.; Plum, M.; Appel, S.; Rappl, G.; Willenborg, S.; Schauss, A.C.; et al. Role of LTBP4 in alveolarization, angiogenesis, and fibrosis in lungs. Am. J. Physiol.-Lung Cell. Mol. Physiol. 2017, 313, L687–L698. [Google Scholar] [CrossRef]
- Tomasovic, A.; Kurrle, N.; Wempe, F.; De-Zolt, S.; Scheibe, S.; Koli, K.; Serchinger, M.; Schnutgen, F.; Surun, D.; Sterner-Kock, A.; et al. Ltbp4 regulates Pdgfrbeta expression via TGFbeta-dependent modulation of Nrf2 transcription factor function. Matrix Biol. 2017, 59, 109–120. [Google Scholar] [CrossRef]
- Albig, A.R.; Becenti, D.J.; Roy, T.G.; Schiemann, W.P. Microfibril-associate glycoprotein-2 (MAGP-2) promotes angiogenic cell sprouting by blocking notch signaling in endothelial cells. Microvasc. Res. 2008, 76, 7–14. [Google Scholar] [CrossRef]
- Malinova, T.S.; Angulo-Urarte, A.; Nuchel, J.; Tauber, M.; van der Stoel, M.M.; Janssen, V.; de Haan, A.; Groenen, A.G.; Tebbens, M.; Graupera, M.; et al. A junctional PACSIN2/EHD4/MICAL-L1 complex coordinates VE-cadherin trafficking for endothelial migration and angiogenesis. Nat. Commun. 2021, 12, 2610. [Google Scholar] [CrossRef]
- Ma, J.; Chen, T.; Wu, S.; Yang, C.; Bai, M.; Shu, K.; Li, K.; Zhang, G.; Jin, Z.; He, F.; et al. iProX: An integrated proteome resource. Nucleic Acids Res. 2019, 47, D1211–D1217. [Google Scholar] [CrossRef]


Publisher’s Note: MDPI stays neutral with regard to jurisdictional claims in published maps and institutional affiliations. |
© 2022 by the authors. Licensee MDPI, Basel, Switzerland. This article is an open access article distributed under the terms and conditions of the Creative Commons Attribution (CC BY) license (https://creativecommons.org/licenses/by/4.0/).
Share and Cite
Zhao, P.; Li, S.; He, Z.; Zhao, F.; Wang, J.; Liu, X.; Li, M.; Hu, J.; Zhao, Z.; Luo, Y. Physiology and Proteomic Basis of Lung Adaptation to High-Altitude Hypoxia in Tibetan Sheep. Animals 2022, 12, 2134. https://doi.org/10.3390/ani12162134
Zhao P, Li S, He Z, Zhao F, Wang J, Liu X, Li M, Hu J, Zhao Z, Luo Y. Physiology and Proteomic Basis of Lung Adaptation to High-Altitude Hypoxia in Tibetan Sheep. Animals. 2022; 12(16):2134. https://doi.org/10.3390/ani12162134
Chicago/Turabian StyleZhao, Pengfei, Shaobin Li, Zhaohua He, Fangfang Zhao, Jiqing Wang, Xiu Liu, Mingna Li, Jiang Hu, Zhidong Zhao, and Yuzhu Luo. 2022. "Physiology and Proteomic Basis of Lung Adaptation to High-Altitude Hypoxia in Tibetan Sheep" Animals 12, no. 16: 2134. https://doi.org/10.3390/ani12162134