Article

Effects of Fly Maggot Protein Replacement of Fish Meal on Growth Performance, Immune Level, Antioxidant Level, and Fecal Flora of Blue Foxes at Weaning Stage

1
College of Animal Sciences and Technology, Northeast Agricultural University, Harbin 150030, China
2
Branch of Animal Husbandry and Veterinary of Heilongjiang Academy of Agricultural Sciences, Qiqihar 161005, China
*
Authors to whom correspondence should be addressed.
These authors contributed equally to this work.
Animals 2022, 12(12), 1480; https://doi.org/10.3390/ani12121480
Submission received: 28 April 2022 / Revised: 31 May 2022 / Accepted: 6 June 2022 / Published: 7 June 2022
(This article belongs to the Special Issue Environmental Impact of Feed Technologies in Animal Production)

Abstract

:

Simple Summary

Given the shortage of fish meal, other animal protein replacements are actively being researched. One such alternative is fly maggot protein—a highly nutritious insect protein containing chitin, lysozyme, and other biologically active substances. The purpose of this study was to examine how the replacement of fish meal with fly maggot protein affects growth, immune indexes, antioxidant levels, and fecal microflora in blue foxes (Alopex lagopus) during weaning. The results showed that fly maggot protein replacement had no adverse effects on the growth, immune indexes, and antioxidant levels of blue foxes at weaning. Further, it could modulate the fecal microflora. This indicates that fly maggot protein can serve as a novel animal protein alternative to fish meal for feeding blue foxes.

Abstract

Dietary protein is a key nutritional parameter and warrants special attention in animal husbandry. This study aimed to evaluate the effect of replacing fish meal (F) with fly maggot protein (M) on the growth performance, antioxidant levels, immune indexes, and fecal microflora in weaned blue foxes (Alopex lagopus). Twenty weaned blue foxes were randomly assigned to the control (F diet; 6% of F) or experimental (M diet; F substituted by M) group (10 blue foxes per group). The duration of the trial was 28 days. The results showed that there was no significant difference in average daily gain between group M and group F during the experiment (p = 0.473). Moreover, the diarrhea index was similar between group M and group F during the entire experimental period (p = 0.112). At the end of the experiment, the levels of IL-6 and IgG in group M at 28 d were significantly higher than that in group F (p = 0.004, p = 0.025, respectively), but not IL-1β, IL-2, SIgA, IgM, and TNF-α. The levels of SOD in group M at 28 d were significantly higher than those in group F (p = 0.001), and no difference of MDA and T-AOC was found between group F and M (p = 0.073, p = 0.196, respectively). In both groups, the diversity of fecal microbes first increased and then decreased with the progress of the experimental period. Initially, there were differences in the composition of microbial communities between the two groups. However, this difference was attenuated at later stages of the experimental period. In conclusion, fly maggot protein can replace fish meal as a source of animal protein in feed material for blue foxes during the weaning period.

1. Introduction

The cost of fish meal has increased in recent years. Therefore, the need for alternative protein sources has increased, prompting research into non-conventional feed ingredients. So far, insect protein has shown great promise as an alternative protein source [1,2]. Insects require less space for breeding, have short reproduction cycles, consume a wide range of food, and exhibit high conversion rates. Further, the negative environmental impact of insect breeding is much smaller than that of livestock breeding [3]. Moreover, insect protein has a high nutritional value [4]. Therefore, insect protein has gradually become a research hotspot for protein alternatives in animal feed [5]. A variety of insects have been used to derive feed ingredients, with Hermetia illucens [6], Tenebrio molitor [7,8], and Musca domestica [9] showing the highest potential.
Fly maggot protein comes from maggots cultured in a medium composed of microorganisms, milk powder, bean products, brown sugar, and starch. Fly maggot protein feed is affordable and costs less than fish meal, which is becoming increasingly more expensive. It contains a variety of amino acids, including essential amino acids required for animal growth [10]. Similar to fish meal, fly maggot protein is a high-quality animal protein source [11]. Compared to the broiler (Gallus gallus) fed the basal diet, feeding diets containing 10–15% fly maggots can improve the carcass quality and growth performance of broiler chickens [12]. Song et al. found that a feeding diet with 4.7–6.4% of fly maggot powder significantly improved the growth performance, immune indexes, and antioxidant enzyme activity in broiler chickens [13]. In Wang’s study, a dietary maggot meal was also proved to be positively influential in flesh quality, and replacing 270 g∙kg−1 fish meal did not have an impact on the growth performance and ingredient utilization of tilapia (Oreochromis niloticus) [14].
The scale of blue fox (Alopex lagopus) breeding is increasing steadily. Blue foxes are carnivorous canines; hence, in captivity, most of the animal protein in their diet comes from fish meal. Accordingly, there is a high demand for fish meal in the blue fox breeding industry [15,16]. However, there are little data on the use of insect protein sources as a feed alternative for the blue fox diet. Studies examining the effects of insect protein on growth and plasma parameters have only been conducted on dogs [17]. Furthermore, information on the microbiome of this species is very limited, although studies indicate that insect meal can positively influence the microbiota composition and improve the gastrointestinal health in these animals [18,19].
Accordingly, this study aimed to evaluate the effect of replacing fish meal with fly maggot protein feed on growth, the blood immune indexes, and the intestinal microbiota in weaned blue foxes. The results of the present study could contribute to explain the value of fly maggot protein as a substitute for fish meal in weaned blue fox diets.

2. Materials and Methods

Our research was conducted in accordance with the guidelines of the Animal Welfare and Ethics Committee of Northeast Agricultural University. All the protocols were approved by the Northeast Agricultural University Animal Care and Use Committee.

2.1. Animal Diets, Management, and Experimental Design

2.1.1. Animal Diets

Fish meal, expanded corn, rice bran meal, soybean meal, expanded soybean, corn gluten meal, Distillers Dried Grains with Solubles (DDGS), meat and bone meal, feather meal, poultry fat, limestone, sodium chloride, lysine, methionine, and premix were purchased from commercial animal feed retailers. Fly maggot protein was purchased from Guangdong xintai biotechnology Co., Ltd. (Jiangmen, China), and the content of crude protein was 54.75%. The fish meal (F) diet and fly maggot protein (M) diet were made into a powdered diet according to Table 1 by Shenyang Shuangliang Feed Co., Ltd. (Shenyang, China). Before feeding, powdered diet was mixed with an appropriate amount of water into paste.

2.1.2. Animal Management and Experimental Design

The experiment was conducted in the arctic blue fox breeding base of Tuqiang Forestry Bureau in Mohe city, Daxing’anling region. Twenty weaned blue foxes (45 days of age, average body weight of 2.06 ± 0.30 kg) were assigned to a normal fish meal (F) diet group or a fly maggot protein (M) diet group, a single-factor randomized design (10 foxes per group). In the M diet group, fish meal was replaced with fly maggot protein (Table 1). Each group consisted of ten replicates, and the trial lasted for 4 weeks (1 week = 1 trial phase). In order to exclude the influence of uneven sunshine on the experiment, all experimental animals were moved to single cages on the south side. The animals were fed twice a day, once at 08:30 and once at 18:30, and had free access to water. The entire experiment was managed by fixed trained personnel.

2.2. Sample Collection

On days 0, 7, 14, 21, and 28 of the experimental period, body weight (BW) was measured in the morning before feeding to calculate the average daily gain (ADG), and stool samples were also collected with sterile cotton swab from rectum and stored at −80 °C. Finally, blood samples were collected through hindlimb venipuncture and centrifuged at 3500 rpm for 10 min. The serum was separated and added to 1.5 mL centrifuge tubes and stored at −20 °C until further analysis. Biochemical indexes—including immunoglobulin-G (IgG), immunoglobulin-M (IgM), tumor necrosis factor-α (TNF-α), interleukin-1β (IL-1β), interleukin-2 (IL-2), Interleukin-6 (IL-6), malondialdehyde (MDA), superoxide dismutase (SOD), total antioxidant capacity (T-AOC), and secreted immunoglobulin-A (SIgA)—were evaluated using commercial kits according to the manufacturers’ instructions (Nanjing Jiancheng ELISA kit). Meanwhile, the stool samples were sent for Illumina sequencing. Instances of diarrhea (i.e., loose stools or fecal adhesions around the anus) were independently observed by two observers at 08:30 and 18:30 daily (Table 2). The incidence of diarrhea and the diarrhea index in each group were calculated using statistical scores.

2.3. DNA Extraction and 16S rRNA High-Throughput Amplicon Target Sequencing

2.3.1. DNA Extraction and PCR Amplification

Steps of DNA extraction: (1) Added 0.25–0.5 g of sample to a 2 mL centrifuge tube. Subsequently, added 500 µL Buffer SA, 100 µL Buffer SC, and 0.25 g grinding beads. Shook and mixed the solution with a tissue homogenizer and heated it at 70 °C for 15 min to improved lysis efficiency. Centrifuged the mixture at 12,000 rpm for 1 min, and then transferred the supernatant (about 500 µL) to a new 2 mL centrifuge tube. (2) Added 200 µL of buffer SH and mix, vortexed for 5 s, and placed at 4 °C for 10 min. (3) Centrifuged at 12,000 rpm for 3 min. Then, transferred the supernatant to a new 2 mL centrifuge tube, added 500 µL buffer GFA, inverted and mixed. (4) Added 10 µL Magnetic Bead Suspension G, shook and mixed for 5 min. (5) Placed the centrifuge tube on the magnetic stand for 30 s. After the magnetic beads were completely adsorbed, carefully removed the liquid. (6) Removed the centrifuge tube from the magnetic stand, added 700 µL of protein removal solution RD, and shook and mixed for 5 min. (7) Placed the centrifuge tube on the magnetic stand for 30 s. After the magnetic beads were completely absorbed, carefully removed the liquid. (8) Removed the centrifuge tube from the magnetic stand, added 700 µL of rinse solution PWD, and shook and mixed for 3 min. (9) Placed the centrifuge tube on the magnetic stand for 30 s. After the magnetic beads were completely adsorbed, carefully removed the liquid. (10) Repeated steps 8 and 9 once again. (11) Placed the centrifuge tube on a magnetic stand and dried at room temperature for 5–10 min. (12) Removed the centrifuge tube from the magnetic stand, added 50–100 µL of elution buffer TB, shook and mixed. Placed the tube at 56 °C, incubated for 5 min. During this period, shook and mixed the tube thrice (3–5 times each time). (13) Placed the centrifuge tube on a magnetic stand for 2 min. After the magnetic beads were completely adsorbed, carefully transferred the DNA solution to a new centrifuge tube and stored it under appropriate conditions.
PCR (polymerase chain reaction) amplification: Universal primers (338F 5′-ACTCCTACGGGAGGCAGCA-3′; 806R 5′-GGACTACHVGGGTWTCT)-3′ were used to amplify the 16S rDNA fragment V3 and V4 regions. Each specimen was amplified using specific primers marked with a barcode. To ensure the accuracy and reliability of subsequent data analysis, two conditions had to be met: ① low cycle number amplification and ② equal number of amplification cycles for each sample. Representative samples for pre-experimentation were randomly chosen to ensure that the majority of samples could be amplified using the appropriate product concentration and the minimum number of cycles. PCR amplification of the V3–V4 variable regions was performed using TransStart FastPfu Fly DNA Polymerase with a 10 µL reaction system. The reaction program was as follows: pre-denaturation at 95 °C for 5 min; 25 cycles of denaturation at 95 °C for 30 s, annealing at 50 °C for 30 s, and extension at 72 °C for 40 s; and a final extension at 72 °C for 7 min.
The PCR products were recovered with 1.8% agarose, purified with the AxyPrep DNA Gel Extraction Kit, eluted with Tris-HCl, and detected by 1.8% agarose electrophoresis. Detection and quantification were performed using QuantiFluorTM-ST.

2.3.2. Illumina MiSeq

A PE 2*300 library was constructed using purified amplified fragments according to the standard operating procedures of the Illumina MiSeq platform. MiSeq library construction: (1) Connect “Y”-shaped adapters. (2) Use magnetic bead screening to remove adapter self-ligating fragments. (3) Use PCR amplification to enrich library templates. (4) Perform sodium hydroxide denaturation to generate single-stranded DNA fragments. Miseq sequencing: (1) One end of the DNA fragment is complementary to the primer base and fixed on the chip. (2) The DNA fragment is used as the template, and the base sequence fixed on the chip is used as the primer for PCR synthesis. The target is synthesized on the chip. During the procedure, DNA fragments are detected. (3) After denaturation and annealing, the other end of the DNA fragment on the chip is randomly complementary to another nearby primer, and is also fixed to form a “bridge”. (4) Perform PCR amplification to generate DNA. (5) DNA amplicons are linearized into single strands. (6) Add modified DNA polymerase and dNTPs with 4 fluorescent labels with only one base being synthesized per cycle. (7) Using laser scanning read the nucleotide species polymerized in the first round of the reaction for each template sequence. (8) Chemically cut the “fluorophore” and “termination group” to restore the viscosity of the 3′ end, and continue the polymerization for the first step. (9) Count the fluorescence signal results collected in each round to determine the sequence of the template DNA fragment.

2.3.3. Processing of Sequencing Data

The sequence data were obtained after the library was built according to the relevant process of the Illumina Miseq platform and sequenced on the machine. Valid sequences were obtained by distinguishing between samples based on the barcodes and primer sequences at both ends of the sequence. Subsequently, sequence direction was corrected, that is, the optimized data were sequenced on the platform to obtain the original off-machine data. Next, before biological analysis, in order to ensure the reliability of the analysis results and ensure the quality of the sequence, further data removal was conducted. The specific requirements were as follows: ① Filtered the bases with a quality value of less than 20 in the tail of the reads, and set a window of 50 bp. If the average quality value in the window was lower than 20, we truncated the back-end bases from the window, filter reads below 50 bp after quality control, and removed reads containing N bases. ② According to the overlapping relationship between reads, we spliced reads into one sequence (minimum overlap length is 10 bp). ③ The maximum mismatch ratio allowed in the overlap region of the spliced sequence is 0.2, and the non-conforming sequences are screened. ④ We distinguished between samples based on the barcodes and primers at the beginning and end of the sequence samples, and adjusted the sequence orientation; the barcode does not allow mismatches. Through clustering, the sequences were divided into many groups based on sequence similarity; these groups were called operational taxonomic units (OTUs).

2.4. Statistical Analysis

The original data were preliminarily processed by Excel. The average daily weight gain, the diarrhea rate, and the diarrhea index were calculated according to the following formula:
Average daily gain (ADG) (g/day) = (final weight-initial weight) (g)/feed days (day)
The diarrhea rate = number of blue foxes with diarrhea/total number of test blue foxes × 100%
Diarrhea   index = diarrhea   scoring / total   number   of   test   blue   foxes
ADG, diarrhea rate, and diarrhea index were tested for normal distribution. The T-test program in SPSS 23.0 statistical software was used for analysis of ADG, diarrhea rate, diarrhea index, immune indexes, and serum antioxidant indexes, and the results are expressed as mean ± standard deviation. Significance was set at p < 0.05.
All sequences could be divided into OTUs according to different similarity levels. Usearch (version 10.0) was used to cluster the sequences at a similarity level of 97% (default). By default, 0.005% of the number of sequenced sequences was used as the threshold to filter OTUs. The RDP classifier (http://rdp.cme.msu.edu/) (accessing on 20 November 2021) was used to perform species annotation for each sequence based on comparisons with the Silva (Release128 http://www.arb-silva.de) (accessing on 20 November 2021) database. The alignment threshold was set to 70%. QIIME2 (https://qiime2.org/) (accessing on 20 November 2021) was used for alpha index analysis, including rarefaction curve, Shannon curves, ACE richness estimator, Chao1 richness estimator, Simpson diversity index, Shannon diversity index, and Rank abundance curve. Principal component analysis (PCA) was used to sort through a series of eigenvalues and eigenvectors and was performed based on R language platform. Lefse was performed based on online platform (http://huttenhower.sph.harvard.edu/lefse/). (accessing on 20 November 2021). The threshold for statistical significance was p < 0.05.

3. Results

3.1. Effects of Fly Maggot Protein Replacing Fish Meal on Growth Performance of Weaned Blue Foxes

As shown in Table 3, the average daily weight gain in group F was significantly higher than that of in group M at 0–7 d (p = 0.001). However, there was no significant difference in the average daily weight gain between the groups at 8–14 d and 22–28 d (p = 0.276; p = 0.894, respectively). Between 15 and 21 d, the average daily weight gain in group M was significantly higher than that in group F (p = 0.002). During the whole experimental period, there was no significant difference between the body weight and the average daily gain between the two groups (p > 0.05).
During the whole experimental period, the diarrhea rate in group M was significantly higher than that in group F (p = 0.047), but the diarrhea index was not significantly different between the two groups (p = 0.109). In group M, the diarrhea rate decreased gradually as the experiment progressed (Table 3).

3.2. Effects on Immune Indexes

The effects of replacing fish meal with fly maggot protein feed on immune parameters in weaned blue foxes are illustrated in Table 4. IL-1β levels in group M were significantly higher than those in group F at 21 d (p = 0.013), but there was no significant difference between these groups at 28 d (p = 0.074). At 0 and 7 d, the levels of IL-2 in group M were significantly higher than those in group F (p = 0.002 and p = 0.005, respectively). At 21 d, the levels of IL-2 in group M were significantly higher than those in group F (p = 0.022). At 21 and 28 d, the levels of IL-6 in group M were significantly higher than those in group F (p = 0.004 and p = 0.049, respectively). On day 7, the IgM level in group M was significantly higher than that in group F (p < 0.001), but there was no significant difference between the two groups at the other timepoints (p > 0.05). The levels of TNF-α, IgG, and SIgA were similar between the two groups throughout the experiment (p > 0.05).

3.3. Effects on Serum Antioxidant Indexes

The effect of replacing fish meal with fly maggot protein feed on serum antioxidant indexes in weaned blue foxes is illustrated in Table 5. No significant differences in MDA levels were observed between the two groups throughout the whole experimental period (p > 0.05). However, the SOD levels in group F were significantly higher than those of group M (p < 0.01), but at 14 d, this value was significantly higher than in group F (p < 0.05). The concentration of T-AOC in group F was significantly higher than that in group M at 0, 7, 14, and 21 d (p < 0.05, p < 0.01, p < 0.05, and p < 0.01, respectively). However, there was no significant difference in this index between the two groups at 28 d (p > 0.05).

3.4. Effects of Fly Maggot Protein Substitute for Fish Meal on Fecal Flora of Blue Foxes in Weaning Period

Based on a 97% sequence similarity, the identified sequences were clustered into OTUs [20]. Figure 1 shows the number of OTUs in each sample obtained after clustering. The number above the column represents the number of OTUs in the corresponding sample.
To determine whether the sample sequencing depth was sufficient for subsequent analysis, rarefaction and Shannon curves were plotted (Figure 1). The rarefaction curve did not reach a plateau, indicating that new species could be discovered if the sequencing volume was increased. However, the Shannon curve showed that all samples had entered the plateau phase. Hence, at the current sequencing depth, this study captured the vast majority of species in the samples. Therefore, the data quality was sufficient for subsequent analysis.

3.4.1. Sample Diversity Analysis

The Shannon index, Simpson index, Chao1, and ACE were used to evaluate the Alpha diversity of fecal samples from weaned foxes reared on different protein sources (Table 6). Protein replacement with fly maggot feed led to significantly lower Shannon index values at 0 d (p < 0.05) and 14 d (p < 0.01). The Chao1, Simpson, and ACE indexes also tended to be lower.

3.4.2. Venn Diagram Analysis Based on OTUs

Venn diagrams can more intuitively reflect the similarity and overlap of sample OTU composition. Overall, 434, 472, 461, 457, and 424 OTUs were identified in the two groups of foxes at 0 d, 7 d, 14 d, 21 d, and 28 d, respectively. The number of OTUs shared by the two groups first increased with the experimental period and then decreased. The number of unique OTUs in groups F and M was 39 and 38, respectively, at 0 d. This number was 31 and 27, respectively, at 7 d; 31 and 26, respectively, at d 14; 49 and 25, respectively, at d 21; and 38 and 34, respectively, at d 28. In both groups, the diversity of fecal microbes first increased and then decreased with the progress of the experimental period, consistent with the results of alpha diversity analysis (Figure 2).

3.4.3. Multi-Sample Comparative Analysis

Based on abundance information and the species annotation of all sample OTUs, principal component analysis (PCA) was performed to analyze the fecal samples of the two groups of weaned foxes at five time points (Figure 3). The contributions of the first and second principal components to the sample differences were 50.42% and 12.26%, respectively. Although some samples were scattered on the score map, the distribution of most samples was more concentrated. This indicates that there were no obvious structural differences between the microbes in the fecal samples collected from the two groups at different time points.

3.4.4. Structural Analysis of Fecal Flora

We studied the microbial community structure in the collected fecal samples. Five dominant bacterial phyla (mean relative abundance > 1%) were identified (Figure 4a): Firmicutes, Bacteroidetes, Actinobacteria, Proteobacteria, and Fusobacteria. The abundance of Bacteroidetes in group F was significantly higher than that in group M on day 0 (p < 0.01). With age, the abundance of Bacteroidetes in group M increased, and eventually, there was no significant difference in this value between the two groups. However, the overall abundance of Bacteroidetes in group F was higher than that in group M (p > 0.05). After day 0, the relative abundance of Actinobacteria in the two groups remained low, but the relative abundance in group M was still higher than that in group F (p > 0.05).
In total, 18 families with a mean relative abundance > 1% were identified. These 18 families accounted for 97.06% of all microbes identified (Figure 4b). Prevotellaceae (25.02%), Leuconostocaceae (11.19%), Ruminococcaceae (9.55%), Lachnospiraceae (8.70%), and Erysipelotrichaceae (7.10%) were the most abundant families across all samples, accounting for 61.56% of all sequences. In group M, the abundance of Prevotellaceae at 0 d was significantly lower than that in group F (p < 0.01). There was no significant difference in the relative abundance of Prevotellaceae between group F and group M at the further time points. The relative abundance of Lachnospiraceae in group F at 14 d was significantly higher than that in group M (p < 0.01). Although the abundance of these bacteria tended to be higher in group F at all other time points as well, the difference was not significant.
In total, 25 genera with a mean relative abundance > 1% were identified. These 25 genera accounted for 86.22% of all sequences (Figure 4c). Prevotella_9 (12.49%), Weissella (10.99%), and Alloprevotella (9.81%) were the most abundant genera across all samples, accounting for 33.29% of all sequences. The relative abundance of Faecalibacterium in group F was higher than that in group M; this difference became significant at d 14 (p < 0.05). The relative abundance of uncultured_bacterium_f_Lachnospiraceae in group F was significantly higher than that in group M (p < 0.01), but there was no significant difference at other time points. The relative abundance of Oribacterium in group F was significantly higher than that in group M at 21 d and 28 d (p < 0.05). However, the other genera showed no significant difference between the two groups during the entire experimental period (p > 0.05).

3.4.5. LEfSe Species Difference Analysis

Comparisons between groups F and M were made at different time intervals during the intervention period. To identify the differentially abundant taxa, the LDA of the effect size was performed based on a threshold score of 4.0. Bacterial clades were identified at five different time points (Figure 5). At 0 d, the relative abundance of 10 bacterial clades was significantly different between the two groups; 7 of these were enriched in group F, whereas 3 were enriched in group M. At 7 d, the relative abundance of eight bacterial clades was significantly different between the two groups; four of these were enriched in group F, and four were enriched in group M. At other time points, there were no bacterial clades that significantly distinguished group M from group F. The results indicated that initially, there were differences in the composition of microbial communities between the two groups. However, this difference was attenuated at later stages of the experimental period.

4. Discussion

Fly maggots contain 59–65% crude protein [21] and are a high-quality source of animal protein, comparable to fish meal [22]. Fly maggot protein is known to improve growth in weaned piglets (Sus scrofa), reducing the cost of growth and making pig breeding more economic [23]. A study showed that when Chinese soft-shelled turtles (Pelodiscus sinensis) were fed an appropriate amount of fly maggot protein, their feed coefficient effectively reduced, while their growth, immune indexes, and survival rates improved [24,25,26]. Replacing fish meal with fly maggot meal not only improves growth and survival rates in tilapia but also increases their immunity and crude protein content [5,27]. These studies together indicate that the use of fly maggot protein as a feed supplement or animal protein alternative has no negative effect on growth and improves production efficiency.
In this study, the replacement of fish meal with fly maggot protein had a significant effect on the average daily weight gain of weaned foxes at various time points. However, when the entire experimental period was considered, no significant difference in this value was observed. The body weight of group M was higher than that of group F at 7 d and 14 d but lower at 21 d and 28 d, although the differences were not significant. Therefore, when weaned blue foxes grow to a certain stage, replacing fish meal with fly maggot protein may provide a better feeding effect and improve their growth. The experimental results suggest that fly maggot protein can replace fish meal for blue foxes at the weaning stage and reduce the cost of breeding.
In addition, although the incidence of diarrhea in group M was significantly higher than that in group F, there was no significant difference in the diarrhea index. The reasons for the high incidence of diarrhea may be as follows: (1) Monogastric animals may find it difficult to digest the chitin in insect proteins. Chitin has an anti-nutritional effect and can reduce protein utilization to a certain extent [28,29]. (2) The ratio of fish meal replacement is not optimal, and excessive addition of insect protein may have negative effects on animals [30]. (3) The experiments were conducted on weaned foxes, who may have digestive organs that are not completely developed. Although the change in feed ingredients does not affect palatability, it may affect digestion in young blue foxes. (4) The stress of weaning and separation from companions may lead to disordered bodily functions in young blue foxes. However, our findings indicated that fly maggot protein can reduce the incidence of diarrhea in blue foxes at the middle and late stages. Therefore, further research is needed to determine the proportion of fish meal replacement with insect protein and the optimal feeding time to maximize the benefits of protein replacement.
IgG, IgA, and IgM are the main effector molecules mediating humoral immunity and reflect the immune status of the body [31]. IgG has antiviral and antitoxin activities in vivo and is the most important immunoglobulin in humoral immunity [32]. IgM is involved in intestinal immunity. The IgM levels in group M were always higher than those in group F, even at the early stages of the experiment. This may be because the fly maggot protein improved the immune status of young blue foxes during the pre-feeding period. Therefore, the IgM content on d 0 was already higher than that in group F, and this difference was maintained during the subsequent test period. IgA represents an important line of defense against the adhesion and colonization of pathogens in the intestinal mucosa, and it is also the most common and most secreted immunoglobulin in the body [33]. In this study, there was no significant difference in IgA levels between group M and group F. This indicated that the replacement of fish meal with fly maggot protein did not create any immune stress in blue foxes during the weaning period.
Weaned blue foxes are prone to immune stress for the following reasons: discontinuation of breast milk, immature immune system, presence of protein antigens in the feed, and environmental changes. During conditions of immune stress, the levels of IL-1β, IL-6, and TNF-α increase. Instead of being used to maintain growth, the nutrients in the body are used to mount an immune response, inhibiting growth and metabolism. IL-1 is an important cytokine secreted by macrophages. Its excessive secretion can stimulate a variety of immune cells and inflammatory cells, thereby leading to the productions of cytokines, such as IL-6 and TNF-α, that induce inflammatory responses and cell damage. IL-2, an important factor in the series of lymphokines released during an immune response, is considered a marker of T cell activation. Our study found that the level of IL-2 was significantly higher in the fly maggot protein group than in the control group, while no significant difference in TNF-α was observed.
Therefore, the results of this study indicate that feed protein may cause stress responses in young foxes. The effects of fly protein feed were clearly more positive than those of fish meal. This is consistent with findings from studies on weaned piglets, loaches, and poultry [23,29,34]. Fly maggot protein contains bioactive substances, such as fly maggot chitosan, fly maggot peptide, and lectin, which may improve immune function in young blue foxes.
Redox reactions are normal physiological and biochemical reactions and can lead to the generation of free radicals. MDA is an important product of lipid peroxidation and indicates the rate and intensity of lipid peroxidation. Thus, it can be used to indirectly estimate oxidative damage [35]. T-AOC reflects the overall activity of enzymatic and non-enzymatic antioxidant systems [36]. It is usually used to directly examine the activity of antioxidant enzymes in the body. SOD and CAT are the most important antioxidant enzymes and serve as a defense system against O2− radicals. SOD can prevent excessive O2− invasion and its activity is an indirect indicator of oxidative damage.
Antioxidant systems of organisms are affected differently by feeding insect proteins. Studies have shown that 4.7–6.4% of fly maggot protein in feed can positively influence immunity and antioxidant capacity in broiler chickens [11]. However, other studies have found different results. The CAT levels in Nile tilapia were not significantly affected after feeding with fly maggot protein [37]. Hence, the response to different protein sources can vary from species to species, and the defense strategies may also vary. In this experiment, the levels of SOD and T-AOC in group M had no significant difference in the later stage of the experiment. MDA levels did not show significant between-group differences throughout the experimental period. These findings suggest that feeding fly maggot protein to weaned blue foxes has no negative effect on their antioxidant capacity.
Microbes play an important role in the development of the intestinal mucosal system and tissues [38]. Microbial colonization is a complex process. Each host develops a unique bacterial community structure through long-term evolution, which is maintained in a state of equilibrium via interaction with environmental factors. Moreover, there are significant differences in the microbiota between species. Various factors, such as maternal microflora composition, age, dietary changes, and antibiotics, all influence gut microflora composition [39]. In this experiment, the Shannon index of group M was significantly lower than that of group F on day 0. However, no significant difference in ACE, Chao1, Simpson, and Shannon index values of the fecal microflora was observed between the two groups at 28 d. Hence, after feeding with fly maggot protein, the richness of the microbial community in weaned foxes could be increased, although the diversity remains unaffected.
The genus Prevotella contains highly active bacteria that decompose hemicellulose [40]. As part of the intestinal microflora, these bacteria play an important role in the degradation of hemicellulose and promote the degradation of non-structural carbohydrates [41,42], improving digestion and absorption. Hence, they have a positive impact on health. Prevotella spp. play a key role in the utilization of starch, xylan, and pectin during digestion in cattle and sheep [43,44,45]. In addition, Prevotella can degrade plant cell walls [42]. The abundance of Prevotella in the rumen is associated with fiber digestibility [46], and these bacteria also secrete proteases [47]. Although Prevotella is abundant in blue fox feces, the exact role of these bacteria in blue foxes remains to be determined. Blue foxes show a high utilization rate of protein- and fat-rich animal feed [48]. However, whether and how their intestinal bacteria participate in the metabolism of nutrients, such as protein and fat, is still unclear.
Lactic acid bacteria produce a large amount of lactic acid, which can reduce the pH of the intestinal tract. These bacteria can also produce bacteriostatic metabolites and thereby, inhibit the reproduction and invasion of pathogenic bacteria. Therefore, lactic acid bacteria have a positive impact on immunity and intestinal health [49]. Weissella spp. are present in most fermentation products [50,51]. In the early stage of fermentation, Weisseria can even dominate in numbers. At this stage, many species of Weisseria have been found to have the advantages of probiotics, with various probiotic properties, including: the production of bacteriocins, which have been found to inhibit pathogenic bacteria [52]; prevent it from adhering to cells [53]; produce exopolysaccharides, such as glucan, etc. [54,55,56]; generate digestive enzymes [57]; and have antioxidant capacity [52,58,59,60].
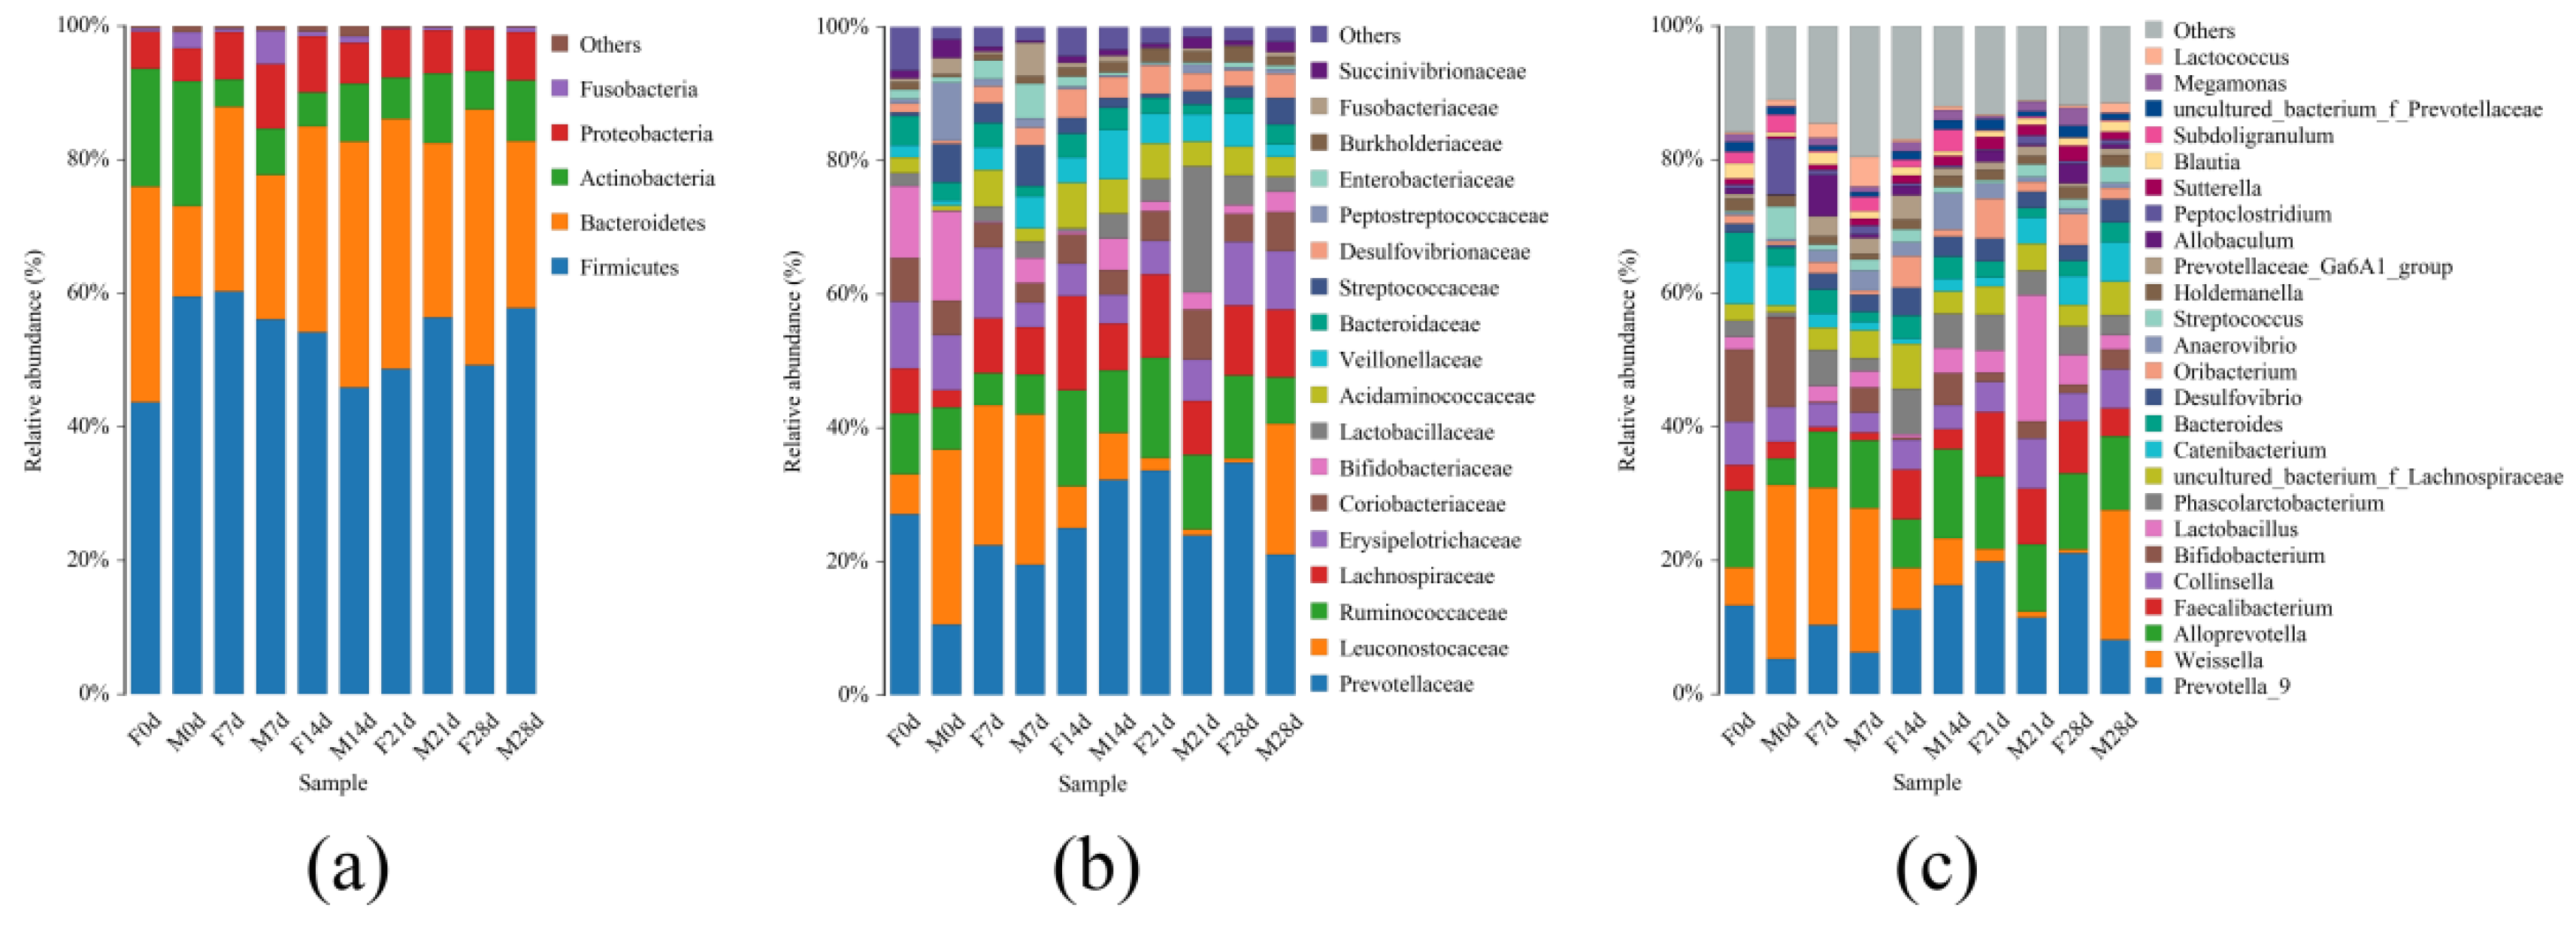
Consistent with Chen’s findings, this study showed that the fecal flora in weaned foxes mainly consists of Firmicutes, Bacteroidetes, Actinobacteria, Proteobacteria, and Fusobacteria. Together, these bacteria account for 97% of the microbiota [61]. At the family level, Prevotellaceae was the dominant bacterial group. No significant difference in the relative abundance of Prevotellaceae was observed between groups M and F overall, although this value was higher in group F on day 0. At the genus level, Weissella and Prevotella_9 made up the dominant flora. The presence of fly maggot protein in feed increased the relative abundance of Weissella in weaned blue foxes, although the difference was not significant. In contrast, blue foxes consuming fish meal had a significantly higher relative abundance of Prevotella_9. The effect of fly maggot protein on the relative abundance of other fecal microbes was not significant. However, the abundance of each group showed different trends of change over time. This suggests that when fly maggot protein was used to replace fish meal, there was no adverse effect on the structure of the fecal flora. Hence, fly maggot protein could replace fish meal in the diet of blue foxes during the weaning period.

5. Conclusions

The replacement of fish meal feed with fly maggot protein can affect some indicators (such as antioxidant levels and immunity) in blue foxes at the weaning stage. However, over time, growth, immunity, and antioxidant levels tend to stabilize and become similar to those in blue foxes receiving fish meal. Moreover, fly maggot protein does not significantly alter the fecal microbial community. Moreover, the effects of fly maggot protein replacement improve with time. Therefore, fly maggot protein can be used as an alternative protein source for blue foxes, instead of expensive fish meal, during the weaning period.
There are some limitations to this study. The effect of fly maggot protein on blue foxes was examined during the weaning period. However, the optimal age or period for fly maggot protein replacement could not be determined. Future studies should explore this aspect to maximize the production efficiency of blue foxes and reduce costs.

Author Contributions

Conceptualization, Y.X. and H.S.; methodology, Y.X. and H.S.; software, J.L. (Jing Lv) and T.L.; validation, Y.X. and H.S.; formal analysis, H.S.; investigation, J.L. (Jing Lv); resources, X.B.; data curation, H.S.; writing—original draft preparation, Y.X., H.S. and T.L.; writing—review and editing, J.L. (Jiayu Liu) and J.L. (Jing Lv); visualization, Y.X.; supervision, J.L. (Jiayu Liu) and X.B.; project administration, Y.X. and X.B.; funding acquisition, X.B. All authors have read and agreed to the published version of the manuscript.

Funding

This research was funded by the Heilongjiang Postdoctoral Fund and China Postdoctoral Science Foundation, grant number LBH-Z20113 and 2021M690577.

Institutional Review Board Statement

Our research was conducted in accordance with the guidelines of the Animal Welfare and Ethics Committee of Northeast Agricultural University. All the protocols were approved by Northeast Agricultural University Animal Care and Use Committee.

Informed Consent Statement

Informed consent was obtained from all subjects involved in the study.

Data Availability Statement

The data presented in this study are available on request. These data are not publicly available to preserve the data privacy of the commercial farm.

Acknowledgments

The authors state that all ethical regulations and considerations concerning the treatment of captured animals comply with the animal welfare and ethical review of Northeast Agricultural University. This work was funded by the China Postdoctoral Science Foundation (No. 2021M690577) and the Heilongjiang Postdoctoral Fund (No. LBH-Z20113).

Conflicts of Interest

The authors declare no conflict of interest.

References

  1. Chia, S.Y.; Tanga, C.M.; Osuga, I.M.; Alaru, A.O.; Dicke, M. Effect of dietary replacement of fishmeal by insect meal on growth performance, blood profiles and economics of growing pigs in Kenya. Animals 2019, 9, 705. [Google Scholar] [CrossRef] [PubMed] [Green Version]
  2. Onsongo, V.O.; Osuga, I.M.; Gachuiri, C.K.; Wachira, A.M.; Miano, D.M. Insects for income generation through animal feed: Effect of dietary replacement of soybean and fish meal with black soldier fly meal on broiler growth and economic performance. J. Econ. Entomol. 2018, 111, 1966–1973. [Google Scholar] [CrossRef] [PubMed] [Green Version]
  3. Oonincx, D.G.A.B.; Van Itterbeeck, J.; Heetkamp, M.J.W.; Van Den Brand, H.; Van Loon, J.J.; Van Huis, A. An exploration on greenhouse gas and ammonia production by insect species suitable for animal or human consumption. PLoS ONE 2010, 5, e14445. [Google Scholar] [CrossRef] [PubMed] [Green Version]
  4. Gasco, L.B.I.; Dabbou, S.; Schiavone, A.; Gai, F. Animals fed insect-based diets: State-of-the-art on digestibility, performance and product quality. Animals 2019, 9, 170. [Google Scholar] [CrossRef] [Green Version]
  5. Ogunji, J.O.; Nimptsch, J.; Wiegand, C.; Schulz, C. Evaluation of the influence of housefly maggot meal (magmeal) diets on catalase, glutathione S-transferase and glycogen concentration in the liver of Oreochromis niloticus fingerling. Comp. Biochem. Physiol. Part A Mol. Integr. Physiol. 2007, 147, 942–947. [Google Scholar] [CrossRef]
  6. Schiavone, A.; De Marco, M.; Martinez, S.; Dabbou, S.; Renna, M.; Madrid, J.; Hernandez, F.; Rotolo, L.; Costa, P.; Gai, F.; et al. Nutritional value of a partially defatted and a highly defatted black soldier fly larvae (Hermetia illucens L.) meal for broiler chickens: Apparent nutrient digestibility, apparent metabolizable energy and apparent ileal amino acid digestibility. J. Anim. Sci. Biotechnol. 2017, 8, 1–9. [Google Scholar] [CrossRef]
  7. Iaconisi, V.; Marono, S.; Parisi, G.; Gasco, L.; Genovese, L.; Maricchiolo, G.; Bovera, F.; Piccolo, G. Dietary inclusion of Tenebrio molitor larvae meal: Effects on growth performance and final quality treats of blackspot sea bream (Pagellus bogaraveo). Aquaculture 2017, 476, 49–58. [Google Scholar] [CrossRef]
  8. Loponte, R.; Bovera, F.; Piccolo, G.; Gasco, L.; Secci, G.; Iaconisi, V.; Parisi, G. Fatty acid profile of lipids and caeca volatile fatty acid production of broilers fed a full fat meal from Tenebrio molitor larvae. Ital. J. Anim. Sci. 2019, 18, 168–173. [Google Scholar] [CrossRef] [Green Version]
  9. Allegretti, G.; Talamini, E.; Schmidt, V.; Bogorni, P.C.; Ortega, E. Insect as feed: An emergy assessment of insect meal as a sustainable protein source for the Brazilian poultry industry. J. Clean. Prod. 2018, 171, 403–412. [Google Scholar] [CrossRef]
  10. Odesanya, B.O.; Ajayi, S.O.; Agbaogun, B.; Okuneye, B. Comparative Evaluation of Nutritive Value of maggots. Int. J. Sci. Eng. Res. 2013, 2, 1–5. [Google Scholar]
  11. Mbiba, H.; Etchu, K.; Ndamukong, K. Carcass characteristics, haematology, serum chemistry and enzymes in broiler chickens fed maggot meal as a protein substitute for fishmeal. Glob. J. Med. Res. 2019, 19, 7–13. [Google Scholar]
  12. Hwangbo, J.; Hong, E.C.; Jang, A.; Kang, H.K.; Oh, J.S.; Kim, B.W.; Park, B.S. Utilization of house fly-maggots, a feed supplement in the production of broiler chickens. J. Environ. Biol. 2009, 30, 609–614. [Google Scholar] [PubMed]
  13. Song, Y.K.; Ying, S.S.; He, J.; Fan, P.P.; Zhao, Y.; Li, R. Effects of maggots on growth performance, immune function and antioxidant indexes of broilers. J. Econ. Anim. 2021, 25, 7–13. [Google Scholar]
  14. Wang, L.; Li, J.; Jin, J.N.; Zhu, F.; Roffeis, M.; Zhang, X.Z. A comprehensive evaluation of replacing fishmeal with housefly (Musca domestica) maggot meal in the diet of Nile tilapia (Oreochromis niloticus): Growth performance, flesh quality, innate immunity and water environment. Aquac. Nutr. 2017, 23, 983–993. [Google Scholar] [CrossRef]
  15. National Research Council. Nutrient Requirements of Mink and Foxes; National Academies Press: Washington, DC, USA, 1982. [Google Scholar]
  16. Ylinen, V.; Pylkkö, P.; Peura, J.; Tuomola, E.; Valaja, J. Performance in blue fox (Vulpes lagopus) fed low-protein diets supplemented with DL-methionine and L-histidine. Agric. Food Sci. 2018, 27, 168–178. [Google Scholar] [CrossRef]
  17. Areerat, S.; Chundang, P.; Lekcharoensuk, C.; Kovitvadhi, A. Possibility of using house cricket (Acheta domesticus) or mulberry silkworm (Bombyx mori) pupae meal to replace poultry meal in canine diets based on health and nutrient digestibility. Animals 2021, 11, 2680. [Google Scholar] [CrossRef]
  18. Józefiak, A.; Nogales-Mérida, S.; Mikołajczak, Z.; Rawski, M.; Kierończyk, B.; Mazurkiewicz, J. The utilization of full-fat insect meal in rainbow trout (Oncorhynchus mykiss) nutrition: The effects on growth performance, intestinal microbiota and gastrointestinal tract histomorphology. Ann. Anim. Sci. 2019, 19, 747–765. [Google Scholar] [CrossRef] [Green Version]
  19. Gasco, L.; Finke, M.; Van Huis, A. Can diets containing insects promote animal health? J. Insects Food Feed. 2018, 4, 1–4. [Google Scholar] [CrossRef]
  20. Edgar, R.C. UPARSE: Highly accurate OTU sequences from microbial amplicon reads. Nat. Methods 2013, 10, 996–998. [Google Scholar] [CrossRef]
  21. Song, Y.K.; He, J. Nutritional characteristics of four animal protein feeds and their application in livestock and poultry breeding. Chin. J. Anim. Nutr. 2019, 31, 109–118. [Google Scholar]
  22. Shen, H. Study on Nutrition Value Assessment and Exploitation of Utilization of Tenebrio molitor L. Master’s Thesis, Shihezi University, Shihezi, Xinjiang, China, 2005. [Google Scholar]
  23. Guo, R.P.; Li, C.; Cheng, X.J.; Li, C.; Tian, H.L.; Yang, J.F.; Zhang, X.G. Effects of fishmeal replaced by house-fly-larvace-meal on growth performance, immunity and economic benefit in weaned piglets. China Feed 2014, 7, 22–24, 28. [Google Scholar]
  24. Cheng, Y.M.; Hang, Q.C.; Wang, F.H.; Li, G.H. Effects of dietary housefly maggot protein on serum biochemical indexes and nonspecific immunity in Soft Shelled Turtle Trionyx sinensis. Fish. Sci. 2017, 36, 768–772. [Google Scholar]
  25. Cheng, Y.M.; Hang, Q.C.; Wang, F.H.; Li, G.H. Effects of dietary housefly protein on growthperformance and nutritional quality of Soft Shelled Turtle Trionyx sinensis. Fish. Sci. 2018, 37, 51–58. [Google Scholar]
  26. Zhang, H.Q.; Zhou, F.; Wang, W.P.; Xu, X.J.; Zhang, J.R.; He, Z.Y. Effects of housefly maggot meal instead of fish meal on growth performance, textural mechanical properties, serum parameters in Pelodiscus sinensis Japanese strain. Acta Agric. Zhejiangensis 2013, 25, 225–229. [Google Scholar]
  27. Kurniawan, D.R.; Arief, M.; Agustono; Lamid, M. Effect of maggot (Hermetia illucens) flour in commercial feed on protein retention, energy retention, protein content, and fat content in tilapia (Oreochromis niloticus). IOP Conf. Ser. Earth Environ. Sci. 2018, 137, 012030. [Google Scholar] [CrossRef]
  28. Sanchez-Muros, M.J.; Barroso, F.G.; Manzano-Agugliaro, F. Insect meal as renewable source of food for animal feeding: A review. J. Clean. Prod. 2014, 65, 16–27. [Google Scholar] [CrossRef]
  29. Zhang, H.T.; Gao, F.; Li, Y.L.; Gu, K.L. Effects of fish meal replaced by maggot meal in dietary supplementing chitinase on growth performance and non-speicfic immunity of loach (Misgurnus anguillicaudatus). China Feed 2017, 11, 39–43. [Google Scholar]
  30. Wu, D.; Liu, H.S.; Long, S.F.; Pu, X.S. Sources, Nutrients and Special Functions of Insect Protein and Its Application Effects in Pig and Chicken Diets. Chin. J. Anim. Nutr. 2020, 32, 2491–2499. [Google Scholar]
  31. Wang, C.; Wang, M.Q.; Ye, S.S.; Tao, W.J.; Du, Y.J. Effects of copper-loaded chitosan nanoparticles on growth and immunity in broilers. Poult. Sci. 2011, 90, 2223–2228. [Google Scholar] [CrossRef]
  32. Horton, R.E.; Vidarsson, G. Antibodies and their receptors: Different potential roles mucosal defense. Front. Immunol. 2013, 4, 200. [Google Scholar] [CrossRef] [Green Version]
  33. Honda, K.; Littman, D.R. The microbiota in adaptive immune homeostasis and disease. Nature 2016, 535, 75–84. [Google Scholar] [CrossRef] [PubMed]
  34. Li, G.H.; Li, Y.W.; He, M.R.; Pang, Y. Effect of housefly maggot proteins on the growth, meat quality and disease resistance of Qingyuan partridge chickens. China Poult. 2012, 34, 35–39. [Google Scholar]
  35. Zhao, H.Y.; Mao, X.B.; Yu, B.; He, J.; Zheng, P.; Yu, J.; Luo, J.Q.; Wang, Q.Y.; Chen, D.W. Excess of dietary montmorillonite impairs growth performance, liver function, and antioxidant capacity in starter pigs. J. Anim. Sci. 2017, 95, 2943–2951. [Google Scholar] [CrossRef]
  36. Wei, R. Effects of Changes in Salinity on the Nonspecific Immune Factors of Japanese Flounder and Antioxidant Enzymes Activities in Amphioxus. Master’s Thesis, Ocean University of China, Qingdao, Shandong, China, 2004. [Google Scholar]
  37. Ogunji, J.O.; Kloas, W.; Wirth, M.; Neumann, N.; Pietsch, C. Effect of housefly maggot meal (magmeal) diets on the performance, concentration of plasma glucose, cortisol and blood characteristics of Oreochromis niloticus fingerlings. J. Anim. Physiol. Anim. Nutr. 2008, 92, 511–518. [Google Scholar] [CrossRef] [PubMed]
  38. Castro, J.J.; Gomez, A.; White, B.; Loften, J.R.; Drackley, J.K. Changes in the intestinal bacterial community, short-chain fatty acid profile, and intestinal development of preweaned Holstein calves. 2. Effects of gastrointestinal site and age. J. Dairy Sci. 2016, 99, 9703–9715. [Google Scholar] [CrossRef] [PubMed]
  39. Edrington, T.S.; Dowd, S.E.; Farrow, R.F.; Hagevoort, G.R.; Callaway, T.R.; Anderson, R.C.; Nisbet, D.J. Development of colonic microflora as assessed by pyrosequencing in dairy calves fed waste milk. J. Dairy Sci. 2012, 95, 4519–4525. [Google Scholar] [CrossRef]
  40. Kamra, D.N. Rumen microbial ecosystem. Curr. Sci. 2005, 89, 124–135. [Google Scholar]
  41. Purushe, J.; Fouts, D.E.; Morrison, M.; White, B.A.; Mackie, R.I.; Coutinho, P.M.; Henrissat, B.; Nelson, K.E. Comparative genome analysis of Prevotella ruminicola and Prevotella bryantii: Insights into their environmental niche. Microb. Ecol. 2010, 60, 721–729. [Google Scholar] [CrossRef]
  42. Bekele, A.Z.; Koike, S.; Kobayashi, Y. Genetic diversity and diet specificity of ruminal Prevotella revealed by 16S rRNA gene-based analysis. FEMS Microbiol. Lett. 2010, 305, 49–57. [Google Scholar] [CrossRef]
  43. Schofield, B.J.; Lachner, N.; Le, O.T.; McNeill, D.N.; Dart, P.; Ouwerkerk, D.; Hugenholtz, P.; Klieve, A.V. Beneficial changes in rumen bacterial community profile in sheep and dairy calves as a result of feeding the probiotic Bacillus amyloliquefaciens H57. J. Appl. Microbiol. 2018, 124, 855–866. [Google Scholar] [CrossRef]
  44. Mcgregor, N.; Morar, M.; Fenger, T.H.; Stogios, P.; Lenfant, N.; Yin, V.; Xu, X.H.; Evdokimova, E.; Cui, H.; Henrissat, B.; et al. Structure-function analysis of a mixed-linkage β-Glucanase/Xyloglucanase from the key ruminal bacteroidetes Prevotella bryantii B14. J. Biol. Chem. 2016, 291, 1175–1197. [Google Scholar] [CrossRef] [PubMed] [Green Version]
  45. Matsui, H.; Ogata, K.; Tajima, K.; Nakamura, M.; Nagamine, T.; Aminov, R.I.; Benno, Y. Phenotypic characterization of polysaccharidases produced by four Prevotella type strains. Curr. Microbiol. 2000, 41, 45–49. [Google Scholar] [CrossRef] [PubMed]
  46. Zhou, M.L. Assessment of Fiber Digestibility and Energy Metabolizability of Boer Goats’ Diet and Research on the Relationships among Structure of the Rumen Microorganism from Boer Goats and Them. Master’s Thesis, Sichuan Agricultural, Yaan, Sichuan, China, 2016. [Google Scholar]
  47. Rosenberg, E. The Family Prevotellaceae; Springer: Berlin/Heidelberg, Germany, 2014; pp. 825–827. [Google Scholar]
  48. Guo, J.G.; Zhang, T.T.; Wu, X.S.; Liu, Z.; Gao, X.H.; Yang, F.H.; Xing, X.M.; Yue, Z.G. Effects of dietary methionine level on reproductive performance of blue foxes (Alopex lagopus) in reproductive period. Chin. J. Anim. Nutr. 2015, 27, 165–170. [Google Scholar]
  49. Makras, L.; Triantafyllou, V.; Fayol-Messaoudi, D.; Adriany, T.; Zoumpopoulou, G.; Tsakalidou, E.; Servin, A.; De Vuyst, L. Kinetic analysis of the antibacterial activity of probiotic lactobacilli towards Salmonella enterica serovar Typhimurium reveals a role for lactic acid and other inhibitory compounds. Res. Microbiol. 2006, 157, 241–247. [Google Scholar] [CrossRef] [PubMed]
  50. Zuo, Q.; Huang, Y. Evaluation of bacterial diversity during fermentation process: A comparison between handmade and machine-made high-temperature Daqu of Maotai-flavor liquor. Ann. Microbiol. 2020, 70, 1–10. [Google Scholar] [CrossRef]
  51. Zhang, Y.; Chen, Z.; Wang, X.; Li, Q.; Gao, X.; Yi, X.; Ma, Y. High-throughput sequencing method to study the dynamic changes of microbial communities in second-generation fermented lettuce. In IOP Conference Series: Earth and Environmental Science; IOP Publishing: Harbin, China, 2021; Volume 680, p. 012064. [Google Scholar]
  52. Wang, L.; Zhang, H.; Tong, X.L.; Li, J.K. Antibacterial activity of Weissella cibaria strains isolated from Tibetan chickens. Anim. Husb. Vet. Med. 2017, 49, 55–59. [Google Scholar]
  53. Nam, H.; Ha, M.; Bae, O.; Lee, Y. Effect of Weissella confusa Strain PL9001 on the adherence and growth of Helicobacter pylori. Appl. Environ. Microbiol. 2002, 68, 4642–4645. [Google Scholar] [CrossRef] [Green Version]
  54. Kavitake, D.; Devi, P.B.; Singh, S.P.; Shetty, P.H. Characterization of a novel galactan produced by Weissella confusa KR780676 from an acidic fermented food. Int. J. Biol. Macromol. 2016, 86, 681–689. [Google Scholar] [CrossRef]
  55. Maina, N.H.; Tenkanen, M.; Maaheimo, H.; Juvonen, R.; Virkki, L. NMR spectroscopic analysis of exopolysaccharides produced by Leuconostoc citreum and Weissella confusa. Carbohydr. Res. 2008, 343, 1446–1455. [Google Scholar] [CrossRef]
  56. Devi, P.B.; Kavitake, D.; Shetty, P.H. Physico-chemical characterization of galactan exopolysaccharide produced by Weissella confusa KR780676. J. Biol. Macromol. 2016, 93, 822–828. [Google Scholar] [CrossRef]
  57. Falck, P.; Linares-Pastén, J.A.; Adlercreutz, P.; Karlsson, E.N. Characterization of a family 43 beta-xylosidase from the xylooligosaccharide utilizing putative probiotic Weissella sp. strain 92. Glycobiology 2016, 26, 193–202. [Google Scholar] [CrossRef] [PubMed] [Green Version]
  58. Li, M.; Wang, L.Y.; Zhao, D.B.; Liu, X.J. Optimization of fermentation conditions for producing antioxidant ingredient of Weissella hellenica isolated from dry cure beef. Meat Ind. 2016, 1, 19–23. [Google Scholar]
  59. Liu, C.J.; Liu, Q.; Jiang, B.; Yan, J.F.; Qi, X.H. Antioxidative and cholesterol-rducing Ability of Weissella viridescens ORC4 from dry fermented sausages. J. Food Sci. Biotechnol. 2015, 34, 512–516. [Google Scholar]
  60. Li, Q.Y.; Chen, J.; Zeng, W.Z.; Fang, F. Isolation and characterization of Weissella strains from soy sauce moromi mash. Microbiol. China 2018, 45, 2449–2462. [Google Scholar]
  61. Chen, S.S. Analysis of Gut Microbiota Diversity in Blue Fox and Comparative Study on Its Enrichment Methods In Vitro. Master’s Thesis, Chinese Academy of Agricultural Sciences, Beijing, China, 2019. [Google Scholar]
Figure 1. All samples Shannon index curve and Rarefaction curve. (a): Shannon curves of the multi samples; (b): Rarefaction curve of the multi samples.
Animals 12 01480 g001
Figure 2. OTU-based Venn diagram analysis: the effect of different protein sources for fish meal substitution on the fecal flora of blue foxes. (a): Venn diagrams of the fecal flora between M0-vs-F0; (b): Venn diagrams of the fecal flora between M7-vs-F7; (c): Venn diagrams of the fecal flora between M14-vs-F14; (d): Venn diagrams of the fecal flora between M21-vs-F21; (e): Venn diagrams of the fecal flora between M28-vs-F28.
Animals 12 01480 g002
Figure 3. Similarity of fecal microbiota composition between weaned foxes reared on fish meal or a fly maggot protein replacement at different stages during the experimental period.
Animals 12 01480 g003
Figure 4. Relative abundance of microorganisms in fecal samples from blue foxes reared on different protein sources at the phylum (a), family (b), and genus (c) levels.
Animals 12 01480 g004
Figure 5. LDA analysis of fecal flora of two groups of blue foxes on 0 d (a), 7 d (b), 14 d (c), 21 d (d), and 28 d (e) of the experimental period.
Animals 12 01480 g005
Table 1. Feed formula and nutritional composition.
Ingredient (DM%)Groups
Fish MealFly Maggot Protein
Expanded corn36.9836.97
Rice bran meal2.700.50
Soybean meal19.9919.98
Expanded soybean3.003.00
Corn gluten meal5.006.50
Distillers Dried Grains with Solubles10.009.99
Fish meal6.00-
Fly maggot complex protein -6.00
Meat and bone meal6.006.00
Feather meal5.005.00
Poultry fat4.004.00
Limestone0.000.40
Sodium chloride0.050.16
Lysine0.000.16
Methionine0.300.35
Premix 11.001.00
Total100.00100.00
Nutrient levels 2 (DM%)
Crude protein29.9029.92
Crude fat8.478.36
Ash6.155.99
Total phosphorus0.890.72
Available phosphorous0.640.51
Ca1.070.99
Lysine1.421.40
Methionine0.790.79
Salt0.430.45
1 Premix per kg of diet: iron, 80 mg; zinc, 60 mg; manganese, 15 mg; copper, 10 mg; iodine, 0.50 mg; selenium, 0.20 mg; cobalt, 0.30 mg; vitamin A, 10,000 IU; vitamin B1, 20 mg; vitamin B2, 10 mg; Vitamin B6, 10 mg; Vitamin B12, 0.10 mg; VC, 120 mg; Vitamin E, 60 mg; Vitamin K3, 1.60 mg. 2 Metabolizable energy is the calculated value, the rest is the measured value.
Table 2. Diarrhea scoring criteria.
ScoreDiarrheaFecal State
0NormalStools come in streaks or pellets
1MildForming, soft stools
2ModerateNo separation of feces and water, thick and loose stools
3SevereFeces are liquid, formless, the feces are separated from water
Table 3. Effects of different protein sources replacing fish meal on the growth performance of weaned blue foxes.
ItemsGroupst-Valuep-Value
Fish MealFly Maggot Protein
Day 0 BW/kg1.96 ± 0.242.04 ± 0.28−0.7300.475
Day 7 BW/kg2.47 ± 0.202.33 ± 0.221.4880.154
Day 14 BW/kg2.92 ± 0.172.74 ± 0.291.7880.091
Day 21 BW/kg3.42 ± 0.223.45 ± 0.30−0.2540.802
Day 28 BW/kg4.05 ± 0.204.08 ± 0.34−0.1990.845
Days 1 to 7
Average daily gain/g74.29 ± 11.27 A42.14 ± 22.20 B4.0820.001
Diarrhea%10.71 ± 7.72 B20.00 ± 10.54 A−2.2480.037
Diarrhea index0.63 ± 0.180.81 ± 0.21−2.0510.055
Days 8 to 14
Average daily gain/g64.29 ± 17.8257.14 ± 18.750.8730.394
Diarrhea%14.29 ± 13.4720.71 ± 10.88−1.1740.256
Diarrhea index0.64 ± 0.340.74 ± 0.12−0.9400.367
Days 15 to 21
Average daily gain/g70.71 ± 18.58 B102.14 ± 19.65 A−3.6750.002
Diarrhea%15.00 ± 10.3515.71 ± 7.38−0.1780.861
Diarrhea index0.66 ± 0.220.62 ± 0.170.4040.691
Days 22 to 28
Average daily gain/g90.00 ± 13.5589.29 ± 9.670.1360.894
Diarrhea%11.43 ± 9.0413.57 ± 5.27−0.6480.525
Diarrhea index0.65 ± 0.270.83 ± 0.37−1.2380.232
Days 0 to 28
Average daily gain/g74.82 ± 4.9472.68 ± 7.810.7330.473
Diarrhea%12.86 ± 5.24 b17.50 ± 4.44 a−2.1370.047
Diarrhea index0.64 ± 0.170.75 ± 0.11−1.6870.112
a,b Values within a row with different superscripts differ significantly at p < 0.05. A,B Values within a row with different superscripts differ significantly at p < 0.01.
Table 4. Effects of different protein sources in place of fish meal on immune indexes of weaned blue foxes.
ItemsGroupst-Valuep-Value
Fish MealFly Maggot Protein
IL-1β (ng/L)
0 d173.06 ± 21.31183.55 ± 6.67−0.1830.462
7 d233.96 ± 13.09223.88 ± 17.840.7890.474
14 d204.12 ± 10.91210.97 ± 13.09−0.6970.524
21 d182.74 ± 12.59 b227.10 ± 12.94 a−4.2560.013
28 d186.37 ± 17.71211.78 ± 4.58−2.4050.074
IL-2 (pg/mL)
0 d563.02 ± 38.41 B800.10 ± 41.94 A−7.2200.002
7 d681.56 ± 53.80 B877.93 ± 28.06 A−5.6050.005
14 d719.88 ± 40.48733.05 ± 16.20−0.5230.628
21 d606.13 ± 30.97 b736.64 ± 54.04 a−3.6290.022
28 d698.32 ± 12.95739.03 ± 45.63−1.4870.211
IL-6 (ng/L)
0 d51.80 ± 18.5176.42 ± 37.43−1.0210.365
7 d58.00 ± 20.6063.26 ± 7.88−0.4130.701
14 d63.55 ± 25.1263.80 ± 11.32−0.0160.988
21 d45.19 ± 24.46 b93.12 ± 16.85 a−2.7950.049
28 d40.26 ± 7.60 B93.15 ± 13.09 A−6.0540.004
SIgA (µg/mL)
0 d29.44 ± 1.0829.94 ± 1.60−0.4540.673
7 d28.56 ± 1.8530.64 ± 0.58−1.8620.136
14 d27.17 ± 0.4929.67 ± 1.64−2.5230.065
21 d31.15 ± 1.0629.95 ± 1.002.0520.227
28 d32.90 ± 1.6030.05 ± 1.406.3890.233
IgG (µg/mL)
0 d713.46 ± 32.37 b796.70 ± 36.09 a−2.9740.041
7 d715.84 ± 21.70730.11 ± 29.20−0.6790.534
14 d720.59 ± 13.51 B739.57 ± 20.90 A−4.8000.009
21 d677.78 ± 44.32 B721.13 ± 44.32 A−5.6190.005
28 d665.89 ± 46.38 b739.35 ± 21.41 a−3.5080.025
IgM (µg/mL)
0 d29.35 ± 2.3733.50 ± 0.31−3.0100.091
7 d32.90 ± 1.03 B38.59 ± 0.74 A−7.7870.001
14 d30.06 ± 2.4233.50 ± 0.99−2.2770.085
21 d33.73 ± 2.5235.27 ± 1.58−0.8970.421
28 d33.91 ± 2.0833.02 ± 1.040.6610.545
TNF-α (ng/L)
0 d174.74 ± 4.19155.13 ± 33.231.0140.415
7 d167.83 ± 31.07145.64 ± 84.190.4280.690
14 d175.74 ± 23.98123.28 ± 14.01−1.4060.233
21 d181.11 ± 34.10151.22 ± 7.881.4790.213
28 d192.54 ± 24.15201.22 ± 17.79−0.5020.642
a,b Values within a row with different superscripts differ significantly at p < 0.05. A,B Values within a row with different superscripts differ significantly at p < 0.01.
Table 5. Effects of different protein sources in place of fish meal on serum antioxidant indexes of weaned blue foxes.
ItemsGroupst-Valuep-Value
Fish MealFly Maggot Protein
MDA (nmol/mL)
0 d103.14 ± 1.86100.40 ± 2.801.4130.230
7 d103.05 ± 0.59102.20 ± 2.800.5150.654
14 d107.86 ± 2.09104.65 ± 2.161.8490.138
21 d106.64 ± 1.71104.75 ± 2.800.9990.374
28 d111.55 ± 3.61104.56 ± 0.753.2830.073
SOD (U/mL)
0 d932.31 ± 17.40 A668.37 ± 14.37 B20.257<0.001
7 d876.39 ± 4.73 A724.30 ± 2.05 B51.160<0.001
14 d879.11 ± 23.54 A775.45 ± 23.06 B5.4490.006
21 d927.54 ± 21.88 A737.25 ± 27.25 B9.4320.001
28 d886.62 ± 16.41 A741.38 ± 27.78 B10.1050.001
T-AOC (U/mL)
0 d171.02 ± 5.27 a154.58 ± 5.54 b3.7210.020
7 d169.24 ± 3.53 A150.12 ± 4.78 B5.5710.005
14 d166.44 ± 3.91 a152.04 ± 4.05 b4.4320.011
21 d165.42 ± 3.34 A152.99 ± 2.13 B9.8080.001
28 d165.29 ± 2.49160.57 ± 4.651.5480.196
a,b Values within a row with different superscripts differ significantly at p < 0.05. A,B Values within a row with different superscripts differ significantly at p < 0.01.
Table 6. Effects of different protein sources on the Alpha diversity of feces of weaned blue foxes.
ItemsACEChao1SimpsonShannon
0 d
F1386.14 ± 23.59397.32 ± 35.010.90 ± 0.084.82 ± 0.92 a
M1374.10 ± 20.09376.29 ± 18.380.76 ± 0.143.53 ± 0.76 b
7 d
F7430.59 ± 23.38427.58 ± 21.400.88 ± 0.135.04 ± 1.22
M7412.34 ± 13.68413.90 ± 15.850.88 ± 0.114.67 ± 0.98
14 d
F14436.65 ± 10.72437.48 ± 9.970.95 ± 0.015.53 ± 0.19 A
M14427.35 ± 36.86419.26 ± 21.120.92 ± 0.024.95 ± 0.31 B
21 d
F21436.19 ± 11.90436.76 ± 10.330.94 ± 0.025.31 ± 0.39
M21391.90 ± 46.89387.47 ± 59.510.87 ± 0.124.49 ± 1.14
28 d
F28392.65 ± 11.82406.49 ± 23.060.93 ± 0.025.29 ± 0.29
M28359.04 ± 45.55363.32 ± 48.990.83 ± 0.244.58 ± 1.55
a,b Values within a row with different superscripts differ significantly at p < 0.05. A,B Values within a row with different superscripts differ significantly at p < 0.01.
Publisher’s Note: MDPI stays neutral with regard to jurisdictional claims in published maps and institutional affiliations.

