Article

Goji Berry (Lycium barbarum) Supplementation during Pregnancy Influences Insulin Sensitivity in Rabbit Does but Not in Their Offspring

1
Department of Veterinary Medicine, University of Milano, Via dell’Università 6, 26900 Lodi, Italy
2
Faculty of Veterinary Medicine, Agricultural University of Albania, Rr Paisi Vodica, Koder, 1029 Kamez, Albania
3
Department of Veterinary Medicine, University of Perugia, Via San Costanzo 4, 06121 Perugia, Italy
4
Department of Veterinary Medicine, University of Camerino Via Circonvallazione 93/95, 62024 Matelica, Italy
5
Department of Pharmaceutical Sciences, University of Perugia, Via Fabretti, 48, 06123 Perugia, Italy
6
Department of Agricultural and Food Sciences, University of Bologna, Viale G. Fanin 44, 40137 Bologna, Italy
*
Author to whom correspondence should be addressed.
These authors contribute equally to this work.
Animals 2022, 12(1), 39; https://doi.org/10.3390/ani12010039
Submission received: 6 November 2021 / Revised: 22 December 2021 / Accepted: 23 December 2021 / Published: 25 December 2021

Abstract

:

Simple Summary

Diabetes mellitus is a disorder affecting millions of people worldwide. History of gestational diabetes is a proven risk factor, while diet may be a strategy for its prevention. Goji berry is the fruit of Lycium barbarum and a traditional medicinal herb with potential antidiabetic and hypoglycemic effects. This study evaluated the effect of two doses of Goji berry dietary supplementations on insulin sensitivity in rabbit does during pregnancy by using fasting and intravenous glucose tolerance test-derived indices. A long-term effect on the offspring was also hypothesised. The rabbit was a good experimental model for this study of insulin sensitivity as the tolerance test was feasible and sensitive to dietary modifications. The higher dose of Goji berry supplementation reduced the maximum glucose concentration after bolus administration, suggesting an improvement in the insulin response. Conversely, the present study could not support the effect of maternal diet on the adult offspring’s insulin sensitivity. The use of nutraceuticals as well as the hypothesis of foetal programming of metabolic diseases deserve further study.

Abstract

This study investigated the effects of Goji berry (Lycium barbarum) dietary supplementation during pregnancy on insulin sensitivity of rabbit does and their offspring. Starting from two months before the artificial insemination, 75 New Zealand White does were fed only commercial standard diet (C) or supplemented with 1% (G1) and 3% (G3) of Goji berries. Their offspring received a standard diet but kept the nomenclature of the mother’s group. Fasting and intravenous glucose tolerance test-derived indices were estimated at 21 days of pregnancy on rabbit does and at 90 days of age on the offspring. No difference was found in the fasting indices, while the diet modulated the response to glucose load of rabbit does. In particular, G3 group had the lowest glucose concentrations 5 min after the bolus administration (p < 0.05) and, as a result, differed in the parameters calculated during the elimination phase such as the elimination rate constant (Kel), the half-life of the exogenous glucose load (t1/2), and apparent volume of distribution (Vd; for all, p < 0.05). The high dose of Goji supplementation could thus enhance the first-phase glucose-induced insulin secretion. Findings on the offspring were inconsistent and therefore a long-term effect of Goji supplementation during pregnancy could not be demonstrated. Further study on the effect of Goji on the secretory pathway of insulin could clarify its hypoglycaemic action, while different protocols are needed to investigate its potential effects on foetal programming.

1. Introduction

Diabetes mellitus is a chronic multifactorial metabolic disorder characterised by an excess of glucose in the blood, known as hyperglycaemia. The incidence of this disease is rapidly and continuously growing worldwide, and it is reported that around 578 million people, corresponding approximately to 10.2% of the world’s population, will be affected by diabetes in 2030 [1]. Hyperglycaemia can be caused by insufficient insulin production due to a loss of the physical or functional β-cell mass (diabetes of type 1, T1D) or insulin resistance, i.e., reduced response to the insulin in the peripheral target tissues (liver, muscles, and adipose tissue; diabetes of type 2, T2D) [2]. Ethnicity, age, overweight, and history of gestational diabetes (GDM) are some proven risk factors for T2D [1,2]. Importantly, offspring born to mothers with diabetes also have an elevated risk to develop T2D, and thus maternal nutrition could play a key role in the development of diabetes [3,4]. This theory, referred to as foetal metabolic programming and Developmental Origins of Health and Disease (DOHaD) [4,5,6], came from the epidemiological studies of Barker et al. which first linked metabolic syndromes to low birth weight [7]. The theory proposed by these authors was then expanded, and studies on DOHaD today are not only about under- or overnourishment but also focus on the presence or deficiency of specific nutritional components during pregnancy and lactation. Patients with diabetes present hyperglycaemia, impaired glucose tolerance, dyslipidaemia, hyperinsulinemia, and/or persistent insulin deficiency [2]. There are many oral drugs available for T2D, although they show several limitations and drawbacks, such as deficiency in multiple dosage regimen, high-cost, adverse side effects, and toxicity [8], while it is now commonly accepted that lifestyle changes in diet and exercise are important strategies for its prevention and control [2,8]. In this context, it is an urgent requirement to explore new strategies to find natural, safer, and more effective hypoglycaemic compounds for the treatment of T2D.
Recently, isolating and researching new ingredients from natural resources with biological activity and beneficial effects on health have attracted a lot of attention. Goji berry, or wolfberry, is the fruit of Lycium barbarum, consumed by Tibetans and Chinese over the centuries as a traditional medicinal herb and food supplement [9,10]. Over the last decades, Goji berry has also captured the interest of the Western countries for its numerous potential beneficial effects both on the general well-being of the individual and on the prevention and treatment of several pathologies, including diabetes [9,10]. The berries contain many substances with biological activity in large concentrations such as carotenoids, vitamins (riboflavin, thiamin, and ascorbic acid), flavonoids, and amino acids, with proline as the major constituent [10,11]. However, it seems that polysaccharides (Lycium barbarum polysaccharides, LBPs), of which the fruit is particularly rich, are the primary bioactive components to determine the beneficial pharmacological effects of the berry [11,12,13,14,15]. Previous studies have shown that Goji berries have antioxidant, anti-aging [12], antitumoral [16], anti-inflammatory [17,18], immunomodulatory [19], gastrointestinal-protective [20], cardioprotective [13], retinoprotective [14], and neuroprotective properties [21] as well as beneficial effects on several aspects of the reproductive sphere [22,23]. Last but not least, an increasing number of studies are showing the influence of Goji berries on blood glucose level homeostasis, suggesting antidiabetic [15,24,25,26,27] and hypolipidemic effects [26,28,29]. For a review, see Kwok et al. [10] and Masci et al. [11]. These studies were performed both in vivo and in vitro, although the exact mechanisms by which Goji berries induce hypoglycemic effects still need to be elucidated.
Moreover, in these studies, the most commonly used animal models are rodents, while the effects on the rabbit are still little explored [22,30,31]. The rabbit, however, is mainly a livestock species, and it is also a pet as well as an animal model used in experiments and studies regarding insulin resistance [32,33,34], effects of nutraceutical products on glucose homeostasis [35,36,37], pregnancy physiology [38,39,40,41], and foetal metabolic programming [42]. Most importantly, the hormonal profile of the pregnant doe is comparable to that of women, including the condition of insulin resistance [43,44,45]. Menchetti et al. [46] have recently evaluated the effect of Goji berries on the concentration of several hormones of rabbits but samples through pregnancy were not collected, and only simple indices of insulin resistance were used (i.e., fasting plasma glucose and insulin concentrations; Homeostatic Model Assessment for insulin resistance, HOMA). Furthermore, according to the theory of DOHaD, the mother’s nutrition could have long-term effects on the offspring metabolism [3,5]; however, only the short-term effects on rabbit does were investigated by these authors. The present study, on the other hand, hypothesises that supplementation with Goji berries could influence insulin sensitivity of rabbit does not only during pregnancy but also in the adult life of their offspring. Moreover, for the first time, both simple and glucose tolerance test-derived indices were measured in pregnant rabbits and their litters.
Therefore, the aim of this study was to evaluate the effects of a dietary supplementation with two different concentrations of Goji berries, 1% and 3%, during pregnancy on the insulin sensitivity of pregnant rabbit does and their offspring by using simple and intravenous glucose tolerance test-derived indices.

2. Materials and Methods

The experiment was conducted at the farm of the Agricultural University of Tirana, Faculty of Veterinary Medicine, Albania. The animals were maintained in accordance with Legislative Decree No. 146, implementing Directive 98/58/EC regarding the protection of animals that were kept for farming purposes, and were daily checked by the responsible veterinarian of the farm. All efforts were made to minimise animal distress and to use only the number of animals necessary to produce reliable results.

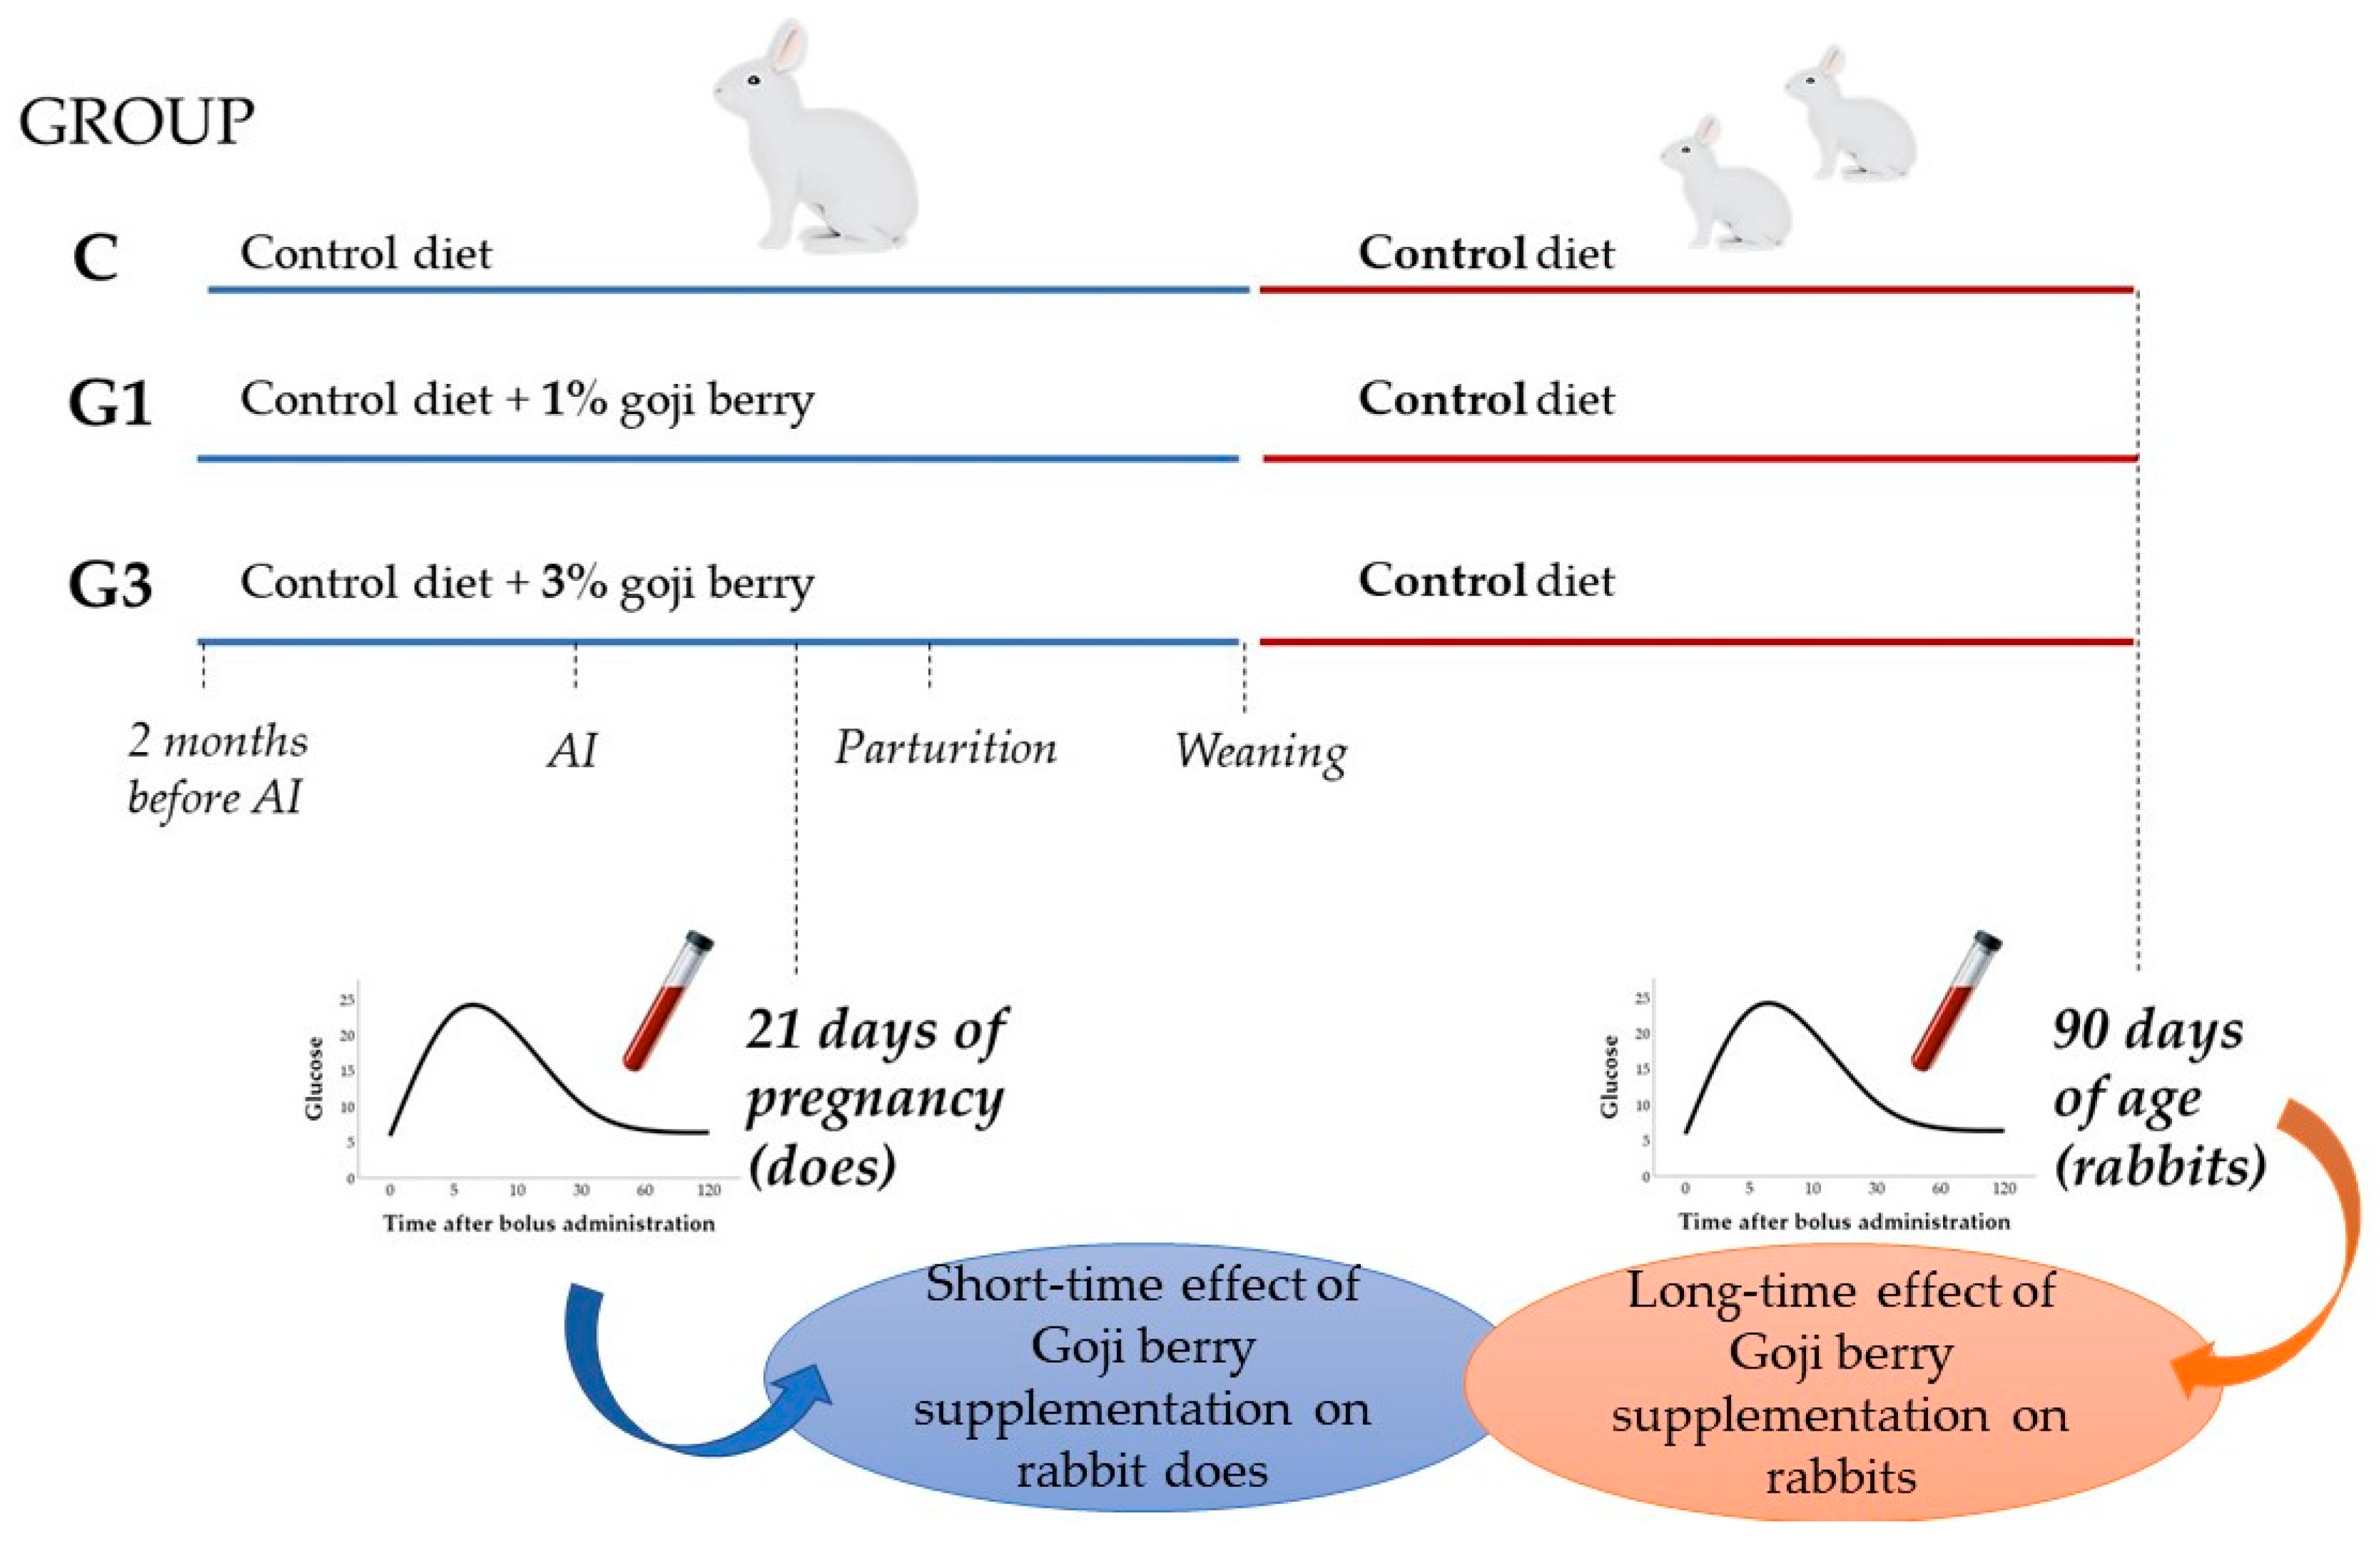
2.1. Animals and Experimental Design

Nulliparous New Zealand White rabbits (n = 75) were individually housed in controlled environmental conditions: temperature ranged from +18 to +23 °C, relative humidity ranged from 60% to 75%, and the lighting schedule was 16 L/8 D. Two months before the artificial insemination (AI), the rabbit does were randomly assigned to three dietary groups (n = 25 rabbits/group): control group (C) was fed with commercial standard diet, while G1 and G3 groups with the same feed supplemented with 1% and 3% of Goji berries, respectively. The diets supplied to the does (Table 1) were isoenergetic, iso-nitrogenous, formulated according to current dietary recommendations for the rabbit [47]. These diets have been already used in previous studies [30,46,48,49]. During the adaptation period, the does were provided 150 g/d of the different feed, while the pregnant does were fed ad libitum. Water was always provided ad libitum.
Ovulation was induced by injecting 0.8 μg of synthetic GnRH (Receptal, Hoechst-Roussel Vet, Milan, Italy) just before AI [51]. Artificial insemination was performed with 0.5 mL of diluted fresh semen. Pregnancy was diagnosed by manual palpation 12 days after AI, and non-pregnant does were excluded from the trial (number of rabbits excluded as non-pregnant = 7, 5, and 8 rabbits in C, G1, and G3 groups, respectively). Fertility rates were 0.72, 0.80, and 0.68, whereas litter sizes at birth were 8, 7, and 7 rabbits (standard error = 1 for all) for C, G1, and G3 groups, respectively. Lactation was controlled until day 20 post-partum by opening the nest once a day for 5–10 min. After the 20th day of lactation, the nest was opened, and the young rabbits had free access to the mother’s diets. At weaning (day 35 post-partum), they were moved to individual cages and fed a control diet. The nomenclature of the offspring groups was maintained in accordance with the nutritional treatment of the mothers (C, G1, and G3 groups). Indices of insulin resistance were estimated at 21 days of pregnancy on rabbit does to evaluate the effect of Goji supplementation during pregnancy, as well as at 90 days of age on rabbits to assess whether the mother’s nutrition could have long-term effects on the offspring (Figure 1).
During the trial, feed intake of does and their offspring was recorded daily, while body weight (BW) was measured weekly, between 8:00 and 10:00 a.m.

2.2. Indices of Insulin Resistance

The insulin resistance assessment methods adopted in this study were classified into simple indices that require a single blood sampling performed with the fasting animal and does not require administration of exogenous glucose, as well as dynamic tests where samples are collected in series after glucose administration [52].

2.2.1. Simple Insulin Resistance Indices with Fasting Sampling

Blood samples (about 1 mL) were collected from the marginal ear vein into tubes containing EDTA at day 21 of pregnancy in rabbit does (n = 13/group randomly selected) and at day 90 of age in the offspring (n = 13/group randomly selected female rabbits born to the does evaluated during pregnancy) between 8:00 and 10:00 a.m, after fasting for at least 16 h [45]. Animals were selected using the RANDBETWEEN function of Excel. Samples were immediately centrifuged at 3000 × g for 15 min, and plasma was stored frozen until assayed for glucose and insulin. Plasma insulin concentrations were determined using RIA procedures as previously described [43,53]. Briefly, plasma insulin was determined by the double antibody/PEG technique using a porcine insulin RIA kit (Linco Research Inc. St Charles, MO, USA). The antiserum was guinea pig anti-porcine insulin, while both labelled and standard antigen used purified recombinant human insulin. The limit of sensitivity was 2 μU/mL, and intra- and inter-assay coefficients of variations were 6.8% and 9.2%, respectively. The glucose concentrations were analysed according to García-García et al. [54] using the glucose oxidase method by the Glucose Infinity kit from Sigma (Sigma Diagnostic Inc., St. Louis, MO, USA).
Glucose and insulin concentration were used to calculate the following indices: fasting plasma glucose (in mmol/L) and insulin (in µU/mL) concentrations; glucose/insulin ratio (G/I); Homeostatic Model Assessment (HOMA) for insulin resistance index was calculated as [insulin concentration × (glucose concentration ⁄18)] ⁄22.5 [43,45]. Lower HOMA-IR values indicate a relatively greater insulin sensitivity.

2.2.2. Intravenous Glucose Tolerance Test and Determination of Kinetic Parameters of Glucose

Intravenous glucose tolerance tests (IVGTT) were performed on 7 randomly selected animals/group of each category (pregnant does 21 days after AI and 90-day-old rabbits) between 8:00 and 10:00 a.m, after fasting for at least 16 h, as previously reported [45]. Animals were selected using the RANDBETWEEN function of Excel among those already chosen for the fasting test. Moreover, the 90 day selection, was restricted to females born to the rabbit does evaluated during pregnancy. A single bolus of glucose (0.6 g/kg of body weight) was rapidly infused into the ear marginal vein through an 18G catheter. A small drop of capillary blood was collected by puncturing the ear just before glucose administration and subsequently after 5, 10, 30, 60, and 120 min. Blood glucose (mmol/L) was measured with a calibrated glucometer (OneTouch®UltraEasy, LifeScan Europe, Johnson and Johnson, Zug, Switzerland), using test strips from the same supplier. The inter-assay coefficient of variation for glucose was <5%. The glucose concentrations at these time points were used to calculate kinetic parameters using an open mono-compartmental model as previously reported [45]. The elimination rate constant (Kel) was calculated as the slope of the semi-logarithmic curve of the glucose concentration with respect to time during the elimination phase. The half-life (t½) of the exogenous glucose load was obtained as (ln 2/elimination rate constant), the apparent volume of distribution (Vd) was obtained as a ratio between the dose and the glucose concentrations after administration of the bolus, while clearance (CL) was obtained as the volume of distribution X the rate of elimination constant. The area under the concentration-time curve (AUC) was calculated using the linear trapezoidal method using GraphPad Prism software version 5.01 (GraphPad Software, San Diego, CA, USA).

2.3. Statistical Analysis

Assumptions and outliers were checked using diagnostic graphs and Levene’s test. Glucose-to-Insulin Ratio was log-transformed to improve data distribution. Differences between groups (3 levels: C, G1, and G3) in mean BW and indices of insulin sensitivity were assessed using the one-way analysis of the variance (ANOVA). Sidak correction was used for multiple comparisons. ANOVA with the Welch statistic and Games-Howell for multiple comparisons were used to analyse G/I and Vd as Levene’s tests indicated unequal variances among groups. Dynamic changes in glucose levels after bolus administration included repeated measurements and were thus investigated using linear mixed models. These models evaluated the effect of the animal’s category (2 levels: pregnant does and 90-day-old rabbits), time (6 levels: from 0 to 120 min after bolus administration), group (3 levels: C, G1, and G3), and their interaction. In these models, the animals were treated as a subjects variable while the time was treated as a repeated factor. Sidak adjustment was used for multiple comparisons. Finally, Pearson correlation coefficient was used to assess whether BW was associated with insulin resistance indices in rabbit does and 90-day-old rabbits, regardless of nutritional treatment. The correlation was considered poor if r < 0.3, medium if 0.3 ≤ r < 0.5, and large if r ≥ 0.5 [55]. Statistical analyses were performed with SPSS Statistics version 25 (IBM, SPSS Inc., Chicago, IL, USA). A result with p ≤ 0.05 was defined as significant, with p between 0.1 and 0.5 it was defined as a trend.

3. Results

3.1. Body Weight

Nutritional treatment did not affect the BW of pregnant rabbits (p = 0.201), while differences were found in 90-day-old rabbits (p < 0.001). In particular, rabbits of the G1 group had the highest BW (p < 0.01).

3.2. Fasting Blood Sample-Based Indices

Table 2 shows simple indices of insulin resistance in pregnant does and 90-day-old rabbits according to the nutritional group. Fasting plasma glucose concentration ranged from 5.11 to 27.78 mmol/L in pregnant does, and from 5.44 to 23.06 mmol/L in 90-day-old rabbits, while insulin concentrations ranged from 2.08 to 14.24 μU/mL in rabbit does, and from 4.6 to 12.10 μU/mL in rabbits. Greater variability was also found in pregnant animals for the G/I values, ranging from 0.41 to 3.21 in does, and from 0.61 to 1.33 in 90-day-old rabbits. Differences between groups in mean values of these parameters could not be found in any category of animal; however, the HOMA index of 90-day-old rabbits was higher in G3 than C group (p < 0.05).

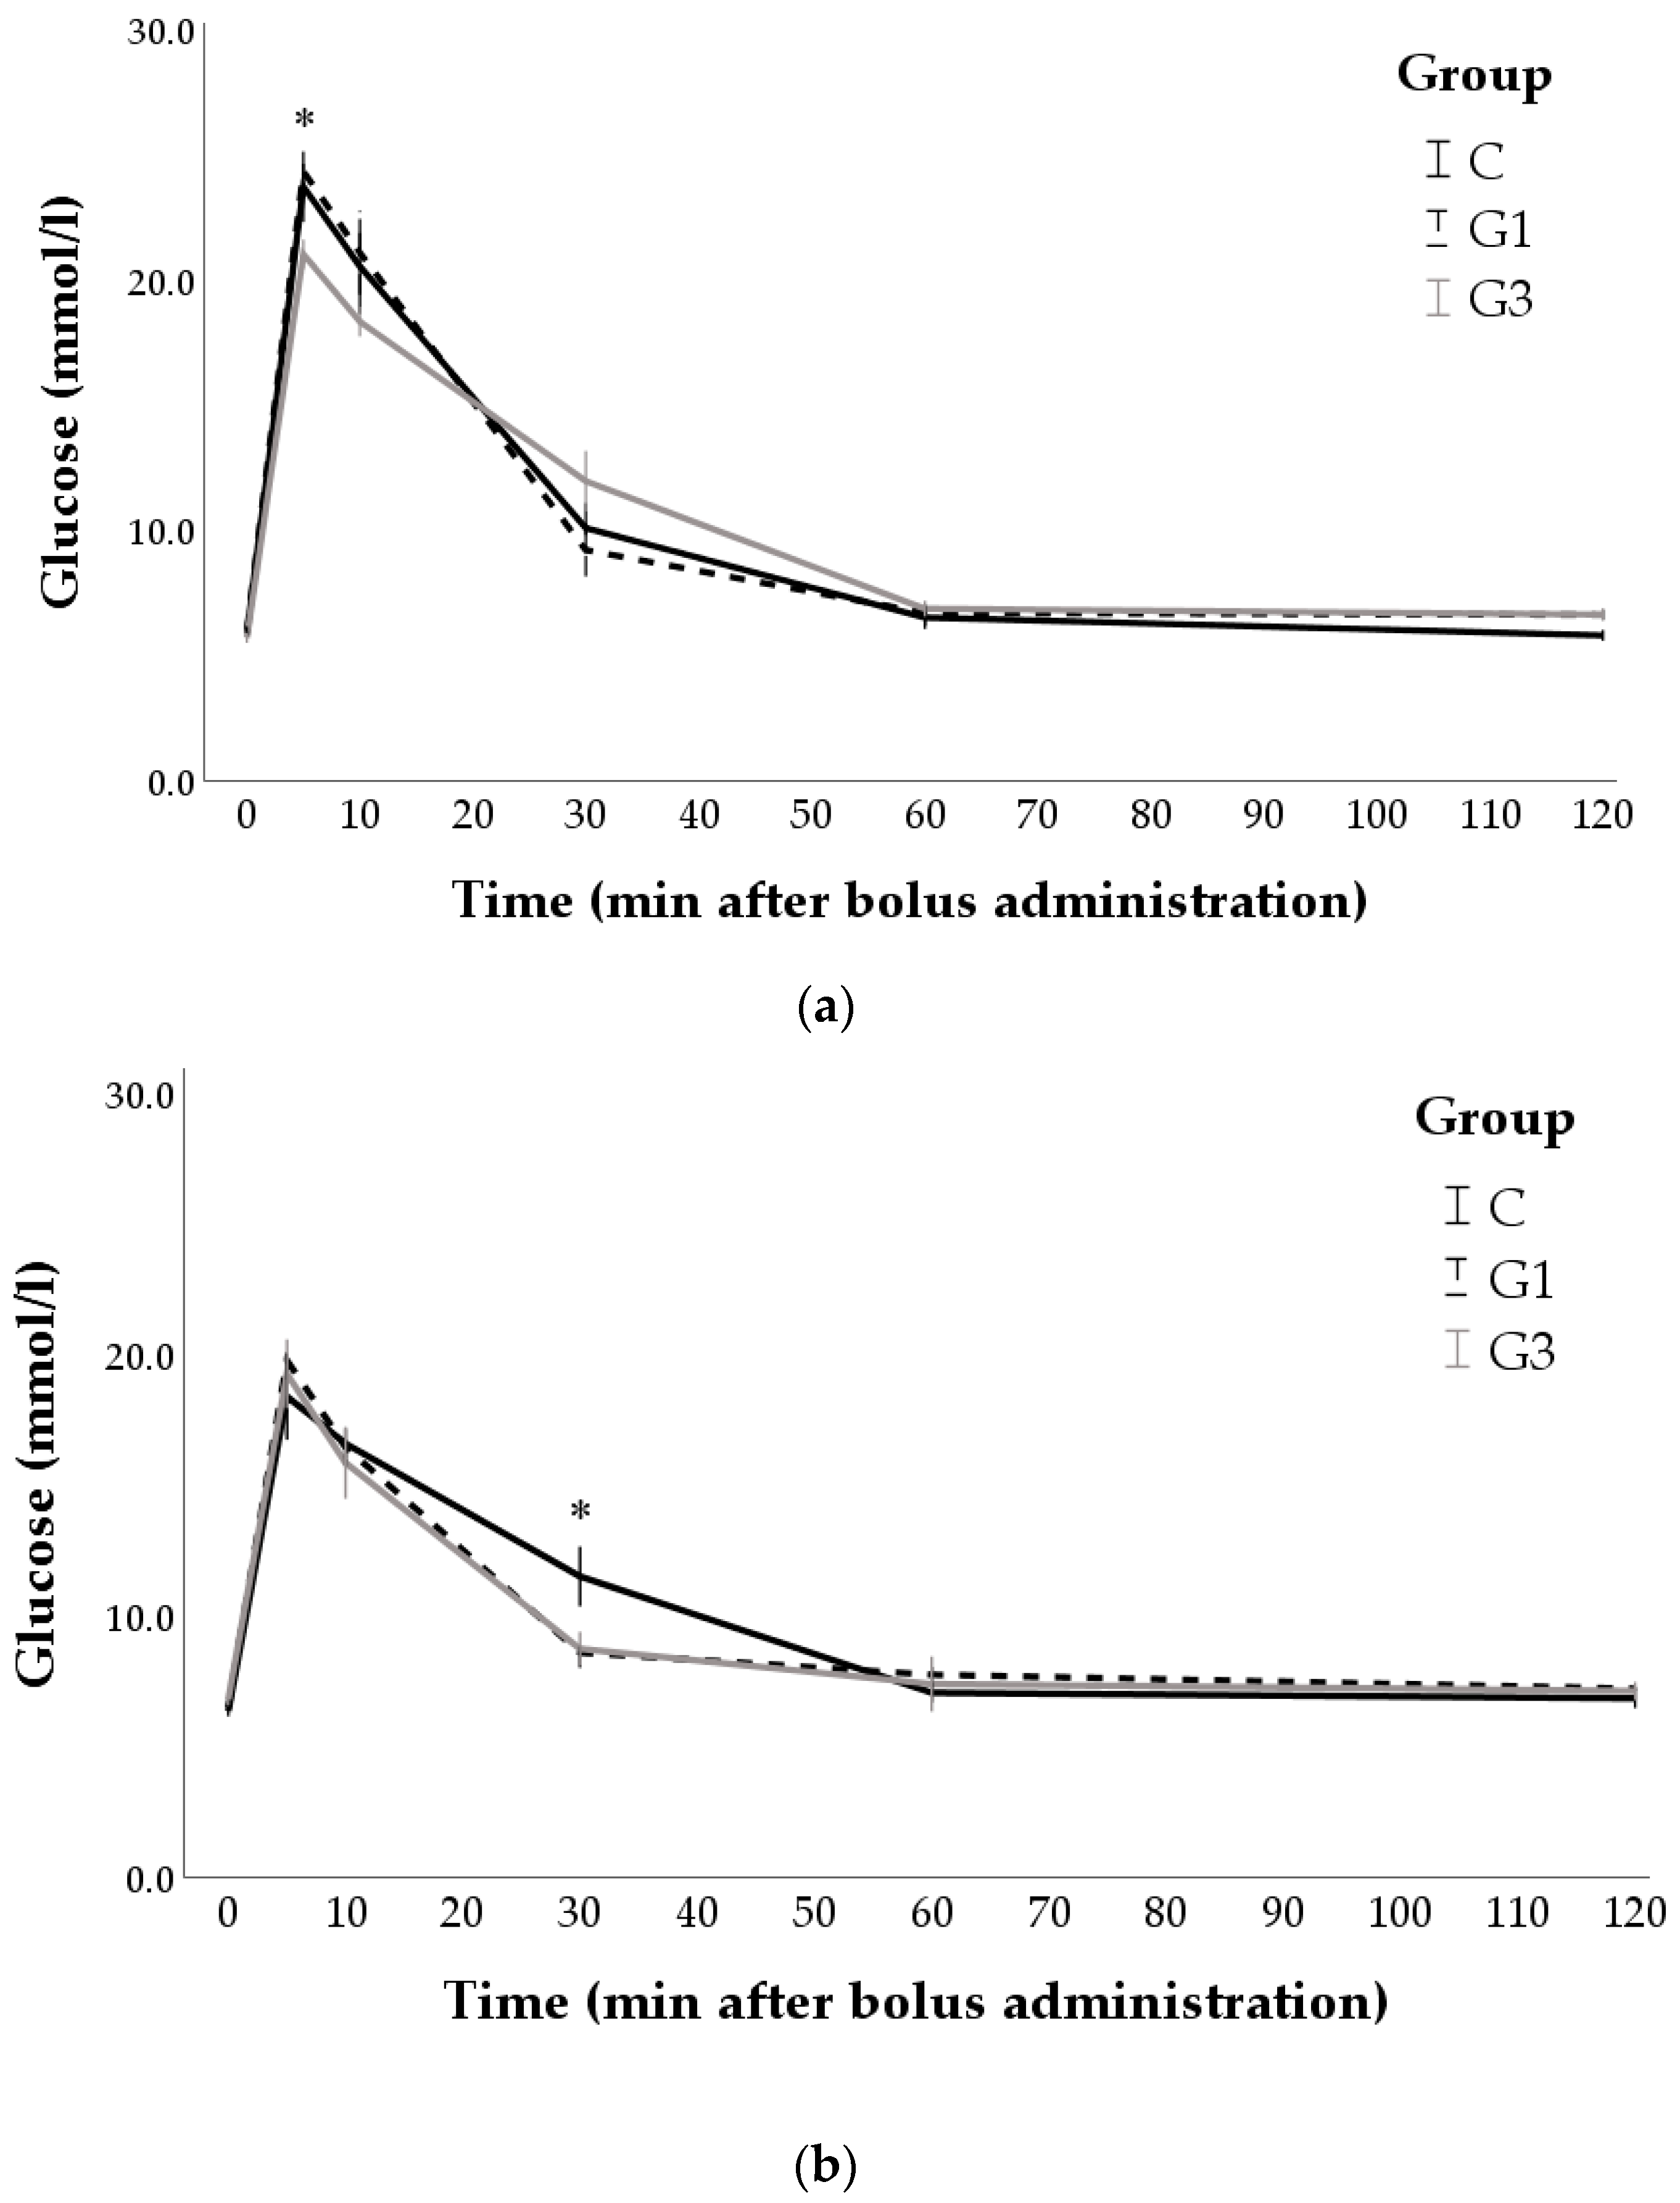
3.3. Changes after Bolus Administration and IVGTT Derived Indices

Figure 2 shows the profiles for glucose disappearance following glucose administration in pregnant does and 90-day-old rabbits. Glucose levels were influenced by the category of animals as the marginal means were higher in pregnant does than in 90-day-old rabbits (11.95 ± 0.20 and 11.13 ± 0.19 mmol/L in does and 90d rabbits, respectively; p = 0.003). Regardless of nutritional treatment, glucose levels peaked as early as 5 min after bolus administration and returned to baseline after 60 min in both pregnant females and 90-day-old rabbits (p < 0.01). Multiple comparisons showed that pregnant does belonging to G3 group had the lowest values in early sampling (i.e., 5 min after injection; p < 0.05). When compared with G1 group, G3 group also had lower concentrations at 10 min (p < 0.05) and higher at 30 min (p < 0.05) after bolus administration. Regarding 90-day-old rabbits, differences were found at 30 min, when C group showed higher values compared to the two groups receiving Goji supplementation (p < 0.05).
Regarding glucose tolerance test-derived indices (Table 3), several differences between groups were found in pregnant does, which mainly involved the G3 group. Indeed, it showed lower mean values of Cmax (p < 0.05) and Kel (p < 0.05) but higher Vd (p < 0.05) than G1 group. The t1/2 tended to be higher in G3 than C and G1 groups (p < 0.1). Conversely, no significant differences were found in the glucose tolerance test-derived indices of 90-day-old rabbits.

3.4. Correlations between Body Weight and Indices of Insulin Resistance

The Pearson coefficient showed a significant correlation only between BW and AUC in pregnant rabbits (p < 0.05; Table 4).

4. Discussion

To the best of our knowledge, this is the first study to estimate the effects of Goji berries on insulin resistance during pregnancy as well as to investigate the possible effects of maternal Goji berry intake on the adult offspring. The rabbit was used as an experimental model, and both simple (i.e., fasting glycemia, insulinemia, and HOMA-IR levels) and glucose tolerance tests indices were determined. In the present study, Goji berries modulated the response to glucose load of pregnant females, while long-term effects on the offspring were not found.
Lycium barbarum is also well known in traditional Chinese herbal medicine for its beneficial effects on glucose metabolism. Few scientific studies, however, have investigated this, and most of them used rodents with induced diabetes as an experimental model [25,27,56,57]. To our knowledge, only one study has used the rabbit [26], while the effects of Goji berries during pregnancy and on the adult offspring have never been explored. Thus, although our hypotheses were only partially confirmed, the present study maintains the innovative aspects due to the experimental model. Compared to rodents, the rabbit was suitable to verify our hypotheses because its dimensions facilitated the execution of the IVGTT. The IVGTT is a very accurate test which is able to detect abnormalities prior to diabetes onset [58] and is considered a reference technique for epidemiological and physiological studies [52], although it is more time and resource-consuming than fasting sampling. On the other hand, fasting-derived indices were simple and practical. They are the most commonly used indices of insulin resistance although they can mainly indicate hepatic insulin resistance [52], i.e., impaired suppression of glucose production by insulin in hepatocytes [59]. Our results did not show alterations or differences between groups in the values of the fasting indices, suggesting that no nutritional treatment induced pathological conditions of hepatic insulin resistance. Conversely, several differences were found in response to IVGTT. This finding could indicate that a single fasting sample may not be sensitive enough to capture differences in healthy rabbits, while IVGTT had a higher sensitivity to changes in the diet. In agreement with our findings, it has been shown in humans that abnormalities of the IVGTT are more sensitive risk factors for T1D than HOMA [58]. In particular, the first-phase glucose-induced insulin secretion appears to be an important determinant of glucose tolerance [58,60]. The response to an IVGTT is, in fact, biphasic: an early peak of insulin, detectable after 5 min, derives from the reserves already stored in the β-cells, while the second peak, after 20–30 min, is due to the de novo synthesis of insulin by the β-cells [61]. This bimodal curve has not been clearly demonstrated in the rabbit, although it is likely that in healthy animals, the sequence is similar as the insulin concentration peaks after 5 min and appears also high 30 min after the glucose injection [33,34].
The main results of this study seem indeed to be related to the first-phase glucose-induced insulin secretion. An effect of Goji berry supplementation was found on pregnant rabbits, and it was mainly linked to the glucose dynamics of the first minutes after the administration of the bolus. Does supplemented with the highest concentration of Goji berries (G3 group) had the lowest glucose concentrations 5 min after the injection. In particular, maximum glucose concentration of G3 was reduced by 12.3% compared to the control group, and by 17.1% compared to G1 group. Therefore, a high dose of Goji supplementation seemed to enhance the early insulin release from the β-cells. This finding suggested that Goji berry could act on mechanisms that regulate the secretory pathways of the insulin stored in the β-granules already docked at the plasma membrane of the β-cell or in the number of mature insulin granules. Thus, further studies which also determine the dynamic changes in insulin or focus on β-cell insulin stores could clarify the mechanisms involved in the hypoglycaemic action of Goji berry. As mentioned previously, this first phase of insulin secretion appears to play an important role in the diagnosis of insulin resistance. In humans, the enhancement of the early phase of insulin secretion improves glucose tolerance [60]. Conversely, the first-phase glucose-induced insulin secretion is reduced in individuals prior to the development of diabetes [58], and it is more or less absent in those with full-blown disease [60]. The profiles for glucose disappearance following the first peak seems to suggest that the supplementation did not influence the second phase of insulin secretion in pregnant does. After 60 min from the administration of the bolus, in fact, the values returned to baseline in all rabbits. Moreover, differences in the kinetic parameters such as Kel and t1/2 could only be a consequence of the maximum concentrations reached by the three groups. These parameters were obtained from regression analyses during the glucose elimination phase. Thus, it was logical to expect a lower elimination rate and a longer half-life in the G3 group because its glucose concentrations started from a lower peak and arrived at the same final value as the other rabbits. However, it is interesting to note that the maximum glucose concentrations as well as kinetic parameters of low-dose group (G1 group) did not differ from the control group, indicating a dose-dependent effect of Goji berry supplementation.
To date, only a clinical study would prove the efficacy of Goji berry supplementation in T2D patients [24], although several experimental studies have yielded encouraging results. The hypoglycaemic effect of Goji berries was indeed found in rodents in the following studies: fed with a high-fat diet [29], streptozotocin-induced diabetes [25], alloxan [27], and genetic mutations [15]. The rabbit was adopted as an experimental model only by Luo et al. [26] using alloxan-induced diabetic and hyperlipidaemic animals. To our knowledge, Goji berry supplementation during pregnancy has never been investigated in any animal model. Therefore, our idea was to use not only a poorly investigated animal model but also a condition of insulin resistance not yet explored. Over the course of normal pregnancy in women, insulin sensitivity physiologically decreases to limit maternal glucose utilisation and divert glucose toward the growing foetus [4,46]. However, when β-cells of the pregnant woman are unable to produce an adequate amount of insulin to face this increased demand, the physiological reduction in insulin sensitivity becomes a pathological condition, i.e., the gestational diabetes mellitus (GDM). The GDM prevalence has increased worldwide and its associations with subsequent T2D and other diseases have been demonstrated [3,62]. In addition to the Goji berries as a nutraceutical to improve post-prandial glucose, the present study proposed the rabbit doe as a model to study physiological and pathological insulin resistance changes during pregnancy. Two results support this choice. First, pregnant rabbits had mean values of glucose during IVGTT higher than those of the 90-day-old rabbits. This result may indicate that insulin sensitivity decreases during pregnancy in rabbits (as in women). It confirms previous studies [43,44,45], although the different ages of the two animals’ categories could represent a bias. Second, the body weight of the does was positively correlated with the glucose AUC, indicating that insulin resistance enhances as the weight of pregnant rabbits increases. This finding confirms that being overweight worsens insulin sensitivity during pregnancy, as widely demonstrated in women [4,62]. Thus, further studies could confirm the hypoglycaemic effect of Goji berries in rabbit does with the prospect of their use during human pregnancy, especially for women predisposed to GDM.
Another main hypothesis of this study was that maternal supplementation with Goji berries could influence insulin sensitivity later in life. To verify this, we fed all the litters a control diet after weaning, and no intervention was applied. They only kept the nomenclature in accordance with the nutritional treatment of their mothers. Thus, any differences between groups in insulin resistance indices of the offspring could be attributed to early life experiences, which only differed in Goji supplementation. Goji berries are rich in carbohydrates, amino acids, vitamins, and polyphenols, and it has recently been shown that these components could play a key role on foetal metabolic programming [6]. The maternal diet seems to program the predisposition to metabolic syndrome, including insulin resistance and glucose intolerance, mainly through epigenetic alterations as they are sensitive to environmental factors such as nutrition, particularly during early life [3,5,6]. In the present study, however, the differences in insulin resistance indices found in the offspring were too weak to support our hypothesis. Further studies could increase the sample size and evaluate the effects of a higher dose of Goji berries in the maternal diet, the inclusion of the berries in the diet also after weaning, or the longer-term consequences.

5. Conclusions

Our study confirmed the validity of the rabbit as an animal model for insulin resistance studies because the intravenous glucose tolerance test resulted feasible and sensitive to nutritional treatment. Moreover, for the first time, this test was performed during rabbit pregnancy, a condition of low insulin sensitivity that is physiological and not drug-induced. Goji berry supplementation modulated the response to glucose load in rabbit does, mainly influencing the early phase of insulin secretion. Investigations focused on the secretion of the insulin already docked at the plasma membrane of the β-cell could therefore clarify the mechanisms of the hypoglycaemic action of Goji berry. This effect was dose-dependent, as only the 3% of Goji inclusion could reduce glucose concentration after bolus administration. No effect of maternal diet was instead found in the offspring. Thus, our study did not support a long-term effect of the maternal supplementation in the offspring, although foetal programming deserves further study by using different diets and experimental protocols.

Author Contributions

Conceptualisation, G.B., G.C., and L.M.; data curation, O.B., S.A., A.Q., and L.M.; formal analysis, O.B., A.M., and L.M.; funding acquisition, G.B., A.P., and D.V.; investigation, M.S., O.B., C.C., A.T., A.M., A.P., S.A., M.R.C., and S.D.; methodology, G.B., M.S., A.M., and D.V.; project administration, G.B., M.S., A.M., and L.M.; resources, G.B., A.M., and D.V.; software, S.A., S.D., and L.M.; supervision, G.B., M.S., G.C., and L.M.; validation, O.B., M.R.C., and L.M.; visualisation, M.S., C.C., and S.D.; writing—original draft, G.B., M.S., G.C., and L.M.; writing—review and editing, G.B., M.S., G.C., A.T., S.A., A.Q., and L.M. All authors have read and agreed to the published version of the manuscript.

Funding

This research received no external funding.

Institutional Review Board Statement

The study was conducted in accordance with the Declaration of Helsinki, and approved by the Ministry of Agriculture and Rural Development, National Authority of Veterinary and Plants protection (protocol N° 824, 18 May 2021) of Albania.

Informed Consent Statement

Not applicable.

Data Availability Statement

The data presented in this study are available in the article. Further information is available upon request from the corresponding author.

Acknowledgments

The authors gratefully acknowledge the work in the rabbit farm by Sig. Giovanni Migni.

Conflicts of Interest

The authors declare no conflict of interest.

References

  1. Saeedi, P.; Petersohn, I.; Salpea, P.; Malanda, B.; Karuranga, S.; Unwin, N.; Colagiuri, S.; Guariguata, L.; Motala, A.A.; Ogurtsova, K.; et al. Global and regional diabetes prevalence estimates for 2019 and projections for 2030 and 2045: Results from the International Diabetes Federation Diabetes Atlas, 9th edition. Diabetes Res. Clin. Pract. 2019, 157, 107843. [Google Scholar] [CrossRef] [PubMed] [Green Version]
  2. American College of Physicians. In the clinic. Type 2 Diabetes. Ann. Intern. Med. 2010, 152, ITC31-15. [Google Scholar] [CrossRef]
  3. Franzago, M.; Fraticelli, F.; Stuppia, L.; Vitacolonna, E. Nutrigenetics, epigenetics and gestational diabetes: Consequences in mother and child. Epigenetics 2019, 14, 215–235. [Google Scholar] [CrossRef] [Green Version]
  4. Kampmann, U.; Knorr, S.; Fuglsang, J.; Ovesen, P. Determinants of Maternal Insulin Resistance during Pregnancy: An Updated Overview. J. Diabetes Res. 2019, 2019, 5320156. [Google Scholar] [CrossRef] [Green Version]
  5. Innis, S.M. Metabolic programming of long-term outcomes due to fatty acid nutrition in early life. Matern. Child Nutr. 2011, 7, 112–123. [Google Scholar] [CrossRef]
  6. Meruvu, S.; Schutz, L.F.; Choudhury, M. Nutritional influence on miRNA epigenetic regulation. In Molecular Nutrition: Mother and Infant; Academic Press: Cambridge, MA, USA, 2021; pp. 401–420. [Google Scholar]
  7. Barker, D.J.P.; Eriksson, J.G.; Forsén, T.; Osmond, C. Fetal origins of adult disease: Strength of effects and biological basis. Int. J. Epidemiol. 2002, 31, 1235–1239. [Google Scholar] [CrossRef] [Green Version]
  8. Ganesan, K.; Rana, M.B.M.; Sultan, S. Oral Hypoglycemic Medications. In StatPearls; StatPearls Publishing: Treasure Island, FL, USA, 2021. [Google Scholar]
  9. Potterat, O. Goji (Lycium barbarum and L. chinense): Phytochemistry, pharmacology and safety in the perspective of traditional uses and recent popularity. Planta Med. 2010, 76, 7–19. [Google Scholar] [CrossRef] [PubMed] [Green Version]
  10. Kwok, S.S.; Bu, Y.; Lo, A.C.Y.; Chan, T.C.Y.; So, K.F.; Lai, J.S.M.; Shih, K.C. A Systematic Review of Potential Therapeutic Use of Lycium barbarum Polysaccharides in Disease. BioMed Res. Int. 2019, 2019, 4615745. [Google Scholar] [CrossRef]
  11. Masci, A.; Carradori, S.; Casadei, M.A.; Paolicelli, P.; Petralito, S.; Ragno, R.; Cesa, S. Lycium barbarum polysaccharides: Extraction, purification, structural characterisation and evidence about hypoglycaemic and hypolipidaemic effects. A review. Food Chem. 2018, 254, 377–389. [Google Scholar] [CrossRef] [PubMed]
  12. Gao, Y.; Wei, Y.; Wang, Y.; Gao, F.; Chen, Z. Lycium barbarum: A traditional Chinese herb and a promising anti-aging agent. Aging Dis. 2017, 8, 778–791. [Google Scholar] [CrossRef] [PubMed] [Green Version]
  13. Pop, C.; Berce, C.; Ghibu, S.; Scurtu, I.; Soritău, O.; Login, C.; Kiss, B.; Stefan, M.G.; Fizesan, I.; Silaghi, H.; et al. Effects of Lycium barbarum L. Polysaccharides on inflammation and oxidative stress markers in a pressure overload-induced heart failure rat model. Molecules 2020, 25, 466. [Google Scholar] [CrossRef] [Green Version]
  14. Wang, K.; Xiao, J.; Peng, B.; Xing, F.; So, K.-F.; Tipoe, G.L.; Lin, B. Retinal structure and function preservation by polysaccharides of wolfberry in a mouse model of retinal degeneration. Sci. Rep. 2014, 4, 7601. [Google Scholar] [CrossRef] [PubMed] [Green Version]
  15. Zhao, R.; Qiu, B.; Li, Q.; Zhang, T.; Zhao, H.; Chen, Z.; Cai, Y.; Ruan, H.; Ge, W.; Zheng, X. LBP-4a improves insulin resistance via translocation and activation of GLUT4 in OLETF rats. Food Funct. 2014, 5, 811–820. [Google Scholar] [CrossRef]
  16. Ceccarini, M.R.; Vannini, S.; Cataldi, S.; Moretti, M.; Villarini, M.; Fioretti, B.; Albi, E.; Beccari, T.; Codini, M. Effect of Lycium barbarum berries cultivated in Umbria (Italy) on human hepatocellular carcinoma cells. J. Biotechnol. 2016, 231, S26–S27. [Google Scholar] [CrossRef]
  17. Nardi, G.M.; Januário, A.G.F.; Freire, C.G.; Megiolaro, F.; Schneider, K.; Perazzoli, M.R.A.; Do Nascimento, S.R.; Gon, A.C.; Mariano, L.N.B.; Wagner, G.; et al. Anti-inflammatory activity of berry fruits in mice model of inflammation is based on oxidative stress modulation. Pharmacogn. Res. 2016, 8, 42–49. [Google Scholar]
  18. Lee, S.R.; Hwang, H.J.; Yoon, J.G.; Bae, E.Y.; Goo, K.S.; Cho, S.J.; Cho, J.A. Anti-inflammatory effect of Lycium barbarum on polarized human intestinal epithelial cells. Nutr. Res. Pract. 2019, 13, 95–104. [Google Scholar] [CrossRef]
  19. You, J.; Chang, Y.; Zhao, D.; Zhuang, J.; Zhuang, W. A mixture of functional complex extracts from Lycium barbarum and grape seed enhances immunity synergistically in vitro and in vivo. J. Food Sci. 2019, 84, 1577–1585. [Google Scholar] [CrossRef]
  20. Kang, Y.; Xue, Y.; Du, M.; Zhu, M.J. Preventive effects of Goji berry on dextran-sulfate-sodium-induced colitis in mice. J. Nutr. Biochem. 2017, 40, 70–76. [Google Scholar] [CrossRef]
  21. Ruíz-Salinas, A.K.; Vázquez-Roque, R.A.; Díaz, A.; Pulido, G.; Treviño, S.; Floran, B.; Flores, G. The treatment of Goji berry (Lycium barbarum) improves the neuroplasticity of the prefrontal cortex and hippocampus in aged rats. J. Nutr. Biochem. 2020, 83, 108416. [Google Scholar] [CrossRef] [PubMed]
  22. Menchetti, L.; Vecchione, L.; Filipescu, I.; Petrescu, V.F.; Fioretti, B.; Beccari, T.; Ceccarini, M.R.; Codini, M.; Quattrone, A.; Trabalza-Marinucci, M.; et al. Effects of Goji berries supplementation on the productive performance of rabbit. Livest. Sci. 2019, 220, 123–128. [Google Scholar] [CrossRef]
  23. Lei, X.; Huo, P.; Wang, Y.; Xie, Y.; Shi, Q.; Tu, H.; Yao, J.; Mo, Z.; Zhang, S. Lycium barbarum Polysaccharides Improve Testicular Spermatogenic Function in Streptozotocin-Induced Diabetic Rats. Front. Endocrinol. 2020, 11, 164. [Google Scholar] [CrossRef]
  24. Cai, H.; Liu, F.; Zuo, P.; Huang, G.; Song, Z.; Wang, T.; Lu, H.; Guo, F.; Han, C.; Sun, G. Practical application of antidiabetic efficacy of Lycium barbarum polysaccharide in patients with type 2 diabetes. Med. Chem. 2015, 11, 383–390. [Google Scholar] [CrossRef] [Green Version]
  25. Du, M.; Hu, X.; Kou, L.; Zhang, B.; Zhang, C. Lycium barbarum Polysaccharide Mediated the Antidiabetic and Antinephritic Effects in Diet-Streptozotocin-Induced Diabetic Sprague Dawley Rats via Regulation of NF-κB. BioMed Res. Int. 2016, 2016, 3140290. [Google Scholar] [CrossRef] [Green Version]
  26. Luo, Q.; Cai, Y.; Yan, J.; Sun, M.; Corke, H. Hypoglycemic and hypolipidemic effects and antioxidant activity of fruit extracts from Lycium barbarum. Life Sci. 2004, 76, 137–149. [Google Scholar] [CrossRef]
  27. Jing, L.; Cui, G.; Feng, Q.; Xiao, Y. Evaluation of hypoglycemic activity of the polysaccharides extracted from Lycium barbarum. Afr. J. Tradit. Complement. Altern. Med. 2009, 6, 579–584. [Google Scholar] [CrossRef] [PubMed] [Green Version]
  28. Lin, D.; He, H.; Ji, H.; Willis, J.; Willard, L.; Jiang, Y.; Medeiros, D.M.; Wark, L.; Han, J.; Liu, Y.; et al. Wolfberries potentiate mitophagy and enhance mitochondrial biogenesis leading to prevention of hepatic steatosis in obese mice: The role of AMP-activated protein kinase α2 subunit. Mol. Nutr. Food Res. 2014, 58, 1005–1015. [Google Scholar] [CrossRef]
  29. Ming, M.; Guanhua, L.; Zhanhai, Y.; Guang, C.; Xuan, Z. Effect of the Lycium barbarum polysaccharides administration on blood lipid metabolism and oxidative stress of mice fed high-fat diet in vivo. Food Chem. 2009, 113, 872–877. [Google Scholar] [CrossRef]
  30. Menchetti, L.; Brecchia, G.; Branciari, R.; Barbato, O.; Fioretti, B.; Codini, M.; Bellezza, E.; Trabalza-Marinucci, M.; Miraglia, D. The effect of Goji berries (Lycium barbarum) dietary supplementation on rabbit meat quality. Meat Sci. 2020, 161, 108018. [Google Scholar] [CrossRef]
  31. Zhao, Q.; Li, J.; Yan, J.; Liu, S.; Guo, Y.; Chen, D.; Luo, Q. Lycium barbarum polysaccharides ameliorates renal injury and inflammatory reaction in alloxan-induced diabetic nephropathy rabbits. Life Sci. 2016, 157, 82–90. [Google Scholar] [CrossRef] [PubMed]
  32. Kitajima, S.; Morimoto, M.; Liu, E.; Koike, T.; Higaki, Y.; Taura, Y.; Mamba, K.; Itamoto, K.; Watanabe, T.; Tsutsumi, K.; et al. Overexpression of lipoprotein lipases improves insulin resistance induced by a high-fat diet in transgenic rabbits. Diabetologia 2004, 47, 1202–1209. [Google Scholar] [CrossRef] [PubMed] [Green Version]
  33. Ning, B.; Wang, X.; Yu, Y.; Waqar, A.B.; Yu, Q.; Koike, T.; Shiomi, M.; Liu, E.; Wang, Y.; Fan, J. High-fructose and high-fat diet-induced insulin resistance enhances atherosclerosis in Watanabe heritable hyperlipidemic rabbits. Nutr. Metab. 2015, 12, 30. [Google Scholar] [CrossRef] [Green Version]
  34. Kawai, T.; Ito, T.; Ohwada, K.; Mera, Y.; Matsushita, M.; Tomoike, H. Hereditary postprandial hypertriglyceridemic rabbit exhibits insulin resistance and central obesity: A novel model of metabolic syndrome. Arterioscler. Thromb. Vasc. Biol. 2006, 26, 2752–2757. [Google Scholar] [CrossRef] [PubMed] [Green Version]
  35. Sharma, S.B.; Nasir, A.; Prabhu, K.M.; Murthy, P.S.; Dev, G. Hypoglycaemic and hypolipidemic effect of ethanolic extract of seeds of Eugenia jambolana in alloxan-induced diabetic rabbits. J. Ethnopharmacol. 2003, 85, 201–206. [Google Scholar] [CrossRef]
  36. Dastmalchi, S.; Garjani, A.; Maleki, N.; Sheikhee, G.; Baghchevan, V.; Jafari-Azad, P.; Valizadeh, H.; Barzegar-Jalali, M. Enhancing dissolution, serum concentrations and hypoglycemic effect of glibenclamide using solvent deposition technique. J. Pharm. Pharm. Sci. 2005, 8, 175–181. [Google Scholar]
  37. Martínez-Paredes, E.; Ródenas, L.; Martínez-Vallespín, B.; Cervera, C.; Blas, E.; Brecchia, G.; Boiti, C.; Pascual, J.J. Effects of feeding programme on the performance and energy balance of nulliparous rabbit does. Animal 2012, 6, 1086–1095. [Google Scholar] [CrossRef] [Green Version]
  38. Menchetti, L.; Brecchia, G.; Cardinali, R.; Polisca, A.; Boiti, C. Feed restriction during pregnancy: Effects on body condition and productive performance of primiparous rabbit does. World Rabbit Sci. 2015, 23, 1–8. [Google Scholar] [CrossRef] [Green Version]
  39. Boiti, C.; Guelfi, G.; Zerani, M.; Zampini, D.; Brecchia, G.; Gobbetti, A. Expression patterns of cytokines, p53 and nitric oxide synthase isoenzymes in corpora lutea of pseudopregnant rabbits during spontaneous luteolysis. Reproduction 2004, 127, 229–238. [Google Scholar] [CrossRef] [Green Version]
  40. Menchetti, L.; Barbato, O.; Filipescu, I.E.; Traina, G.; Leonardi, L.; Polisca, A.; Troisi, A.; Guelfi, G.; Piro, F.; Brecchia, G. Effects of local lipopolysaccharide administration on the expression of Toll-like receptor 4 and pro-inflammatory cytokines in uterus and oviduct of rabbit does. Theriogenology 2018, 107, 162–174. [Google Scholar] [CrossRef]
  41. Brecchia, G.; Menchetti, L.; Cardinali, R.; Castellini, C.; Polisca, A.; Zerani, M.; Maranesi, M.; Boiti, C. Effects of a bacterial lipopolysaccharide on the reproductive functions of rabbit does. Anim. Reprod. Sci. 2014, 147, 128–134. [Google Scholar] [CrossRef]
  42. Denton, K.M.; Flower, R.L.; Stevenson, K.M.; Anderson, W.P. Adult rabbit offspring of mothers with secondary hypertension have increased blood pressure. Hypertension 2003, 41, 634–639. [Google Scholar] [CrossRef] [PubMed] [Green Version]
  43. Menchetti, L.; Brecchia, G.; Canali, C.; Cardinali, R.; Polisca, A.; Zerani, M.; Boiti, C. Food restriction during pregnancy in rabbits: Effects on hormones and metabolites involved in energy homeostasis and metabolic programming. Res. Vet. Sci. 2015, 98, 7–12. [Google Scholar] [CrossRef]
  44. Menchetti, L.; Andoni, E.; Barbato, O.; Canali, C.; Quattrone, A.; Vigo, D.; Codini, M.; Curone, G.; Brecchia, G. Energy homeostasis in rabbit does during pregnancy and pseudopregnancy. Anim. Reprod. Sci. 2020, 218, 106505. [Google Scholar] [CrossRef] [PubMed]
  45. Menchetti, L.; Canali, C.; Castellini, C.; Boiti, C.; Brecchia, G. The different effects of linseed and fish oil supplemented diets on insulin sensitivity of rabbit does during pregnancy. Res. Vet. Sci. 2018, 118, 126–133. [Google Scholar] [CrossRef]
  46. Menchetti, L.; Curone, G.; Andoni, E.; Barbato, O.; Troisi, A.; Fioretti, B.; Polisca, A.; Codini, M.; Canali, C.; Vigo, D.; et al. Impact of goji berries (Lycium barbarum) supplementation on the energy homeostasis of rabbit does: Uni- and multivariate approach. Animals 2020, 10, 2000. [Google Scholar] [CrossRef] [PubMed]
  47. De Blas, C.; Mateos, G. Nutrition of the Rabbit; De Blas, C., Wiseman, J., Eds.; CABI: Oxon, UK, 1998; ISBN 9781845936693. [Google Scholar]
  48. Andoni, E.; Curone, G.; Agradi, S.; Barbato, O.; Menchetti, L.; Vigo, D.; Zelli, R.; Cotozzolo, E.; Ceccarini, M.R.; Faustini, M.; et al. Effect of Goji Berry (Lycium barbarum) Supplementation on Reproductive Performance of Rabbit Does. Animals 2021, 11, 1672. [Google Scholar] [CrossRef]
  49. Castrica, M.; Menchetti, L.; Balzaretti, C.C.M.; Branciari, R.; Ranucci, D.; Cotozzolo, E.; Vigo, D.; Curone, G.; Brecchia, G.; Miraglia, D. Impact of dietary supplementation with goji berries (Lycium barbarum) on microbiological quality, physico-chemical, and sensory characteristics of rabbit meat. Foods 2020, 9, 148. [Google Scholar] [CrossRef]
  50. Maertens, L.; Moermans, R.; De Groote, G. Prediction of the apparent digestible energy content of commercial pelleted feeds for rabbits. J. Appl. Rabbit Res. 1988, 11, 60–67. [Google Scholar]
  51. Brecchia, G.; Bonanno, A.; Galeati, G.; Federici, C.; Maranesi, M.; Gobbetti, A.; Zerani, M.; Boiti, C. Hormonal and metabolic adaptation to fasting: Effects on the hypothalamic-pituitary-ovarian axis and reproductive performance of rabbit does. Domest. Anim. Endocrinol. 2006, 31, 105–122. [Google Scholar] [CrossRef] [PubMed]
  52. Borai, A.; Livingstone, C.; Kaddam, I.; Ferns, G. Selection of the appropriate method for the assessment of insulin resistance. BMC Med. Res. Methodol. 2011, 11, 158. [Google Scholar] [CrossRef] [Green Version]
  53. Rommers, J.M.; Boiti, C.; Brecchia, G.; Meijerhof, R.; Noordhuizen, J.P.T.M.; Decuypere, E.; Kemp, B. Metabolic adaptation and hormonal regulation in young rabbit does during long-term caloric restriction and subsequent compensatory growth. Anim. Sci. 2004, 79, 255–264. [Google Scholar] [CrossRef] [Green Version]
  54. García-García, R.M.; Rebollar, P.G.; Arias-Álvarez, M.; Sakr, O.G.; Bermejo-Álvarez, P.; Brecchia, G.; Gutierrez-Adan, A.; Zerani, M.; Boiti, C.; Lorenzo, P.L. Acute fasting before conception affects metabolic and endocrine status without impacting follicle and oocyte development and embryo gene expression in the rabbit. Reprod. Fertil. Dev. 2011, 23, 759–768. [Google Scholar] [CrossRef]
  55. Field, A. Discovering Statistics Using SPSS, 3rd ed.; SAGE Publications Ltd.: London, UK, 2009; Volume 81, ISBN 9781847879066. [Google Scholar]
  56. Yang, Y.; Li, W.; Li, Y.; Wang, Q.; Gao, L.; Zhao, J. Dietary Lycium barbarum polysaccharide induces Nrf2/ARE pathway and ameliorates insulin resistance induced by high-fat via activation of PI3K/AKT signaling. Oxid. Med. Cell. Longev. 2014, 2014, 145641. [Google Scholar] [CrossRef] [Green Version]
  57. Xia, H.; Tang, H.; Wang, F.; Yang, X.; Wang, Z.; Liu, H.; Pan, D.; Yang, C.; Wang, S.; Sun, G. An untargeted metabolomics approach reveals further insights of Lycium barbarum polysaccharides in high fat diet and streptozotocin-induced diabetic rats. Food Res. Int. 2019, 116, 20–29. [Google Scholar] [CrossRef]
  58. Barker, J.M.; McFann, K.; Harrison, L.C.; Fourlanos, S.; Krischer, J.; Cuthbertson, D.; Chase, H.P.; Eisenbarth, G.S. Pre-Type 1 Diabetes Dysmetabolism: Maximal Sensitivity Achieved with Both Oral and Intravenous Glucose Tolerance Testing. J. Pediatr. 2007, 150, 31–36.e6. [Google Scholar] [CrossRef] [PubMed] [Green Version]
  59. Meshkani, R.; Adeli, K. Hepatic insulin resistance, metabolic syndrome and cardiovascular disease. Clin. Biochem. 2009, 42, 1331–1346. [Google Scholar] [CrossRef] [PubMed]
  60. Kahn, S.E.; Montgomery, B.; Howell, W.; Ligueros-Saylan, M.; Hsu, C.; Devineni, D.; McLeod, J.; Horowitz, A.; Foley, J. Importance of Early Phase Insulin Secretion to Intravenous Glucose Tolerance in Subjects with Type 2 Diabetes Mellitus. J. Clin. Endocrinol. Metab. 2001, 86, 5824–5829. [Google Scholar] [CrossRef] [PubMed]
  61. Kaneko, J.J. Carbohydrate Metabolism and Its Diseases. In Clinical Biochemistry of Domestic Animals; Academic Press: Cambridge, MA, USA, 1997; pp. 45–81. [Google Scholar]
  62. Lacroix, M.; Kina, E.; Hivert, M.F. Maternal/fetal determinants of insulin resistance in women during pregnancy and in offspring over life. Curr. Diabetes Rep. 2013, 13, 238–244. [Google Scholar] [CrossRef]
Figure 1. Graphic representation of the experimental protocol. From two months before artificial insemination (AI) until weaning of the litters, rabbit does of groups C, G1, and G3 were fed a standard diet (C group), standard diet supplemented with 1% Goji berry (G1 group), and 3% Goji berry (G3 group), respectively (n = 75). After weaning, rabbits in all groups received the standard diet. Simple and intravenous glucose tolerance test-derived indices were estimated at 21 days of pregnancy on rabbit does to evaluate the short-time effect during pregnancy, and at 90 days of age on rabbits to evaluate the long-term effects on the offspring. The blue and red lines indicate the maternal and offspring feeding, respectively.
Animals 12 00039 g001
Figure 2. Changes in blood glucose levels after bolus administration in pregnant does (a) and 90-day-old rabbits (b) of control group (C, n = 7/category) and groups with 1% (G1, n = 7/category) or 3% (G3, n = 7/category) of Goji berry. * p < 0.05: G3 vs. C group.
Animals 12 00039 g002
Table 1. Formulation and chemical composition (as fed) of control (C) and experimental diets supplemented with 1% (G1) and 3% (G3) Goji berries.
Diet
CG1G3
Ingredients 1
Wheat bran30.029.529.0
Dehydrated alfalfa meal42.041.541.0
Barley9.59.59.0
Sunflower meal4.54.54.2
Rice bran4.04.03.9
Soybean meal4.04.03.9
Calcium carbonate2.22.22.2
Cane molasses2.02.02.0
Dicalcium phosphate0.70.70.7
Vitamin–mineral premix 20.40.40.4
Soybean oil0.40.40.4
Salt0.30.30.3
Goji berries-1.03.0
Analytical data 1
Crude protein15.7415.6415.66
Ether extract2.252.232.47
Ash9.289.369.25
Starch16.8617.0716.99
NDF38.0538.5537.49
ADF19.5419.6019.01
ADL4.014.313.98
Digestible Energy 3246424632459
1 as percentage (%). 2 Per kg diet: vitamin A 11,000 IU; vitamin D3 2000 IU; vitamin B1 2.5 mg; vitamin B2 4 mg; vitamin B6 1.25 mg; vitamin B12 0.01 mg; alpha-tocopherol acetate 50 mg; biotine 0.06 mg; vitamin K 2.5 mg; niacin 15 mg; folic acid 0.30 mg; D-pantothenic acid 10 mg; choline 600 mg; Mn 60 mg; Fe 50 mg; Zn 15 mg; I 0.5 mg; Co 0.5 mg. 3 as Kcal/kg. Estimated by Maertens et al. [50].
Table 2. Fasting derived indices of insulin resistance in pregnant does and 90-day-old rabbits of control group (C, n = 13/category) and groups with 1% (G1, n = 13/category) and 3% (G3, n = 13/category) of Goji berry.
Animal CategoryParameter Group RMSEp-Value
C G1G3
Pregnant doesFasting glucose (mmol/L)5.886.015.730.480.457
Fasting insulin (μU/mL)7.326.505.863.300.648
Glucose-to-insulin ratio *0.961.251.300.670.632
HOMA-IR *0.110.090.090.010.567
90-day-old rabbitsFasting glucose (mmol/L)6.366.506.800.610.271
Fasting insulin (μU/mL)7.478.039.321.860.094
Glucose-to-insulin ratio *0.920.860.730.210.594
HOMA-IR *0.12 b0.13 a,b0.16 a0.010.037
* log transformed. HOMA-IR: Homeostatic Model Assessment for insulin resistance. RMSE: root mean square error. Significant p-values are in bold (F test, p < 0.05). a, b: Means sharing the same superscript are not significantly different from each other for p < 0.05 (Sidak correction).
Table 3. Intravenous glucose tolerance test-derived indices obtained in pregnant does and 90-day-old rabbits of control group (C, n = 7/category) and groups with 1% (G1, n = 7/category) and 3% (G3, n = 7/category) of Goji berry.
Animal CategoryParameter Group RMSEp-Value
C G1G3
Pregnant doesCmax (mmol/L)23.80 a24.91 a20.84 b2.210.019
Glucose 60 min (mmol/L)6.536.726.890.960.862
AUC ((mmol/L) × min)1111.931133.501158.60115.840.802
Kel (%/min)1.03 a1.05 a0.86 b0.100.018
t1/2 (min)68.52 B66.85 B79.11 A7.750.047
Vd (dl/kg)1.46 a,b1.37 b1.59 a0.140.023
CL (dl/min/kg)1.451.431.390.180.837
90-day-old rabbitsCmax (mmol/L)18.8118.5119.262.920.904
Glucose 60 min (mmol/L)7.067.767.401.590.794
AUC ((mmol/L) × min)1126.281101.671076.77110.700.745
Kel (%/min)0.750.740.760.150.959
t1/2 (min)93.7397.1385.1013.000.326
Vd (dl/kg)1.911.711.710.310.681
CL (dl/min/kg)1.411.251.310.320.732
Cmax: maximum concentration of glucose (5 min after bolus administration); AUC: area under the concentration–time curve; Kel: elimination rate constant; t1/2: half-life of the exogenous glucose load; Vd: apparent volume of distribution; CL: clearance; RMSE: root mean square error. Significant p-values are in bold (F test, p < 0.05). a, b: Means sharing the same superscript are not significantly different from each other for p < 0.05 (Sidak correction, Games-Howell for Vd). A, B: Means sharing the same superscript are not significantly different from each other for p < 0.1 (Sidak correction).
Table 4. Pearson coefficient showing correlations between BW and indices of insulin resistance in pregnant rabbit does and 90-day-old rabbits, regardless of group.
ParameterAnimal Category
Pregnant Does90-Day-Old Rabbits
Fasting glucose0.0220.281
Fasting insulin−0.137−0.054
Glucose–insulin ratio #0.1090.166
HOMA−0.1050.024
Cmax0.1530.060
Glucose 60 min0.1580.165
AUC0.539 *0.248
Kel−0.1160.071
t1/2−0.0330.254
Vd #−0.266−0.290
CL−0.202−0.119
# after log-transformation. * Correlation is significant at the 0.05 level (two-tailed), in bold. Cmax: maximum concentration of glucose (5 min after bolus administration); AUC: area under the concentration-time curve; Kel: t1/2: Vd: apparent volume of distribution; CL: clearance
Publisher’s Note: MDPI stays neutral with regard to jurisdictional claims in published maps and institutional affiliations.

