
Effects of Apple (Malus pomila) Pomace-Derived Pectin on the Innate Immune Responses, Expressions of Key Immune-Related Genes, Growth Performance, and Digestive Enzyme Activity of Rainbow Trout (Oncorhynchus mykiss)

 , , , , and
Abstract
:Simple Summary
Abstract
1. Introduction
2. Materials and Methods
2.1. Pectin Extraction Procedure
2.2. Formulation and Preparation of the Experimental Diets
2.3. Experimental Design and Fish Husbandry
Sampling
2.4. Growth Parameters
2.5. Digestive Enzymes Activity
2.5.1. Amylase Activity
2.5.2. Lipase Activity
2.5.3. Total Protease Activity
2.5.4. Measurement of Soluble Protein Concentration
2.6. Serum Immunological Parameters
2.6.1. Total Serum Immunoglobulin (Total Ig)
2.6.2. Serum Lysozyme Activity
2.6.3. Serum Complement Activity (ACH50)
2.6.4. Total Serum Protein
2.7. Gene Expression
2.8. Statistical Analysis
3. Results
3.1. Growth Performance
3.2. Body Composition
3.3. Digestive Enzymes
3.4. Immunological Parameters
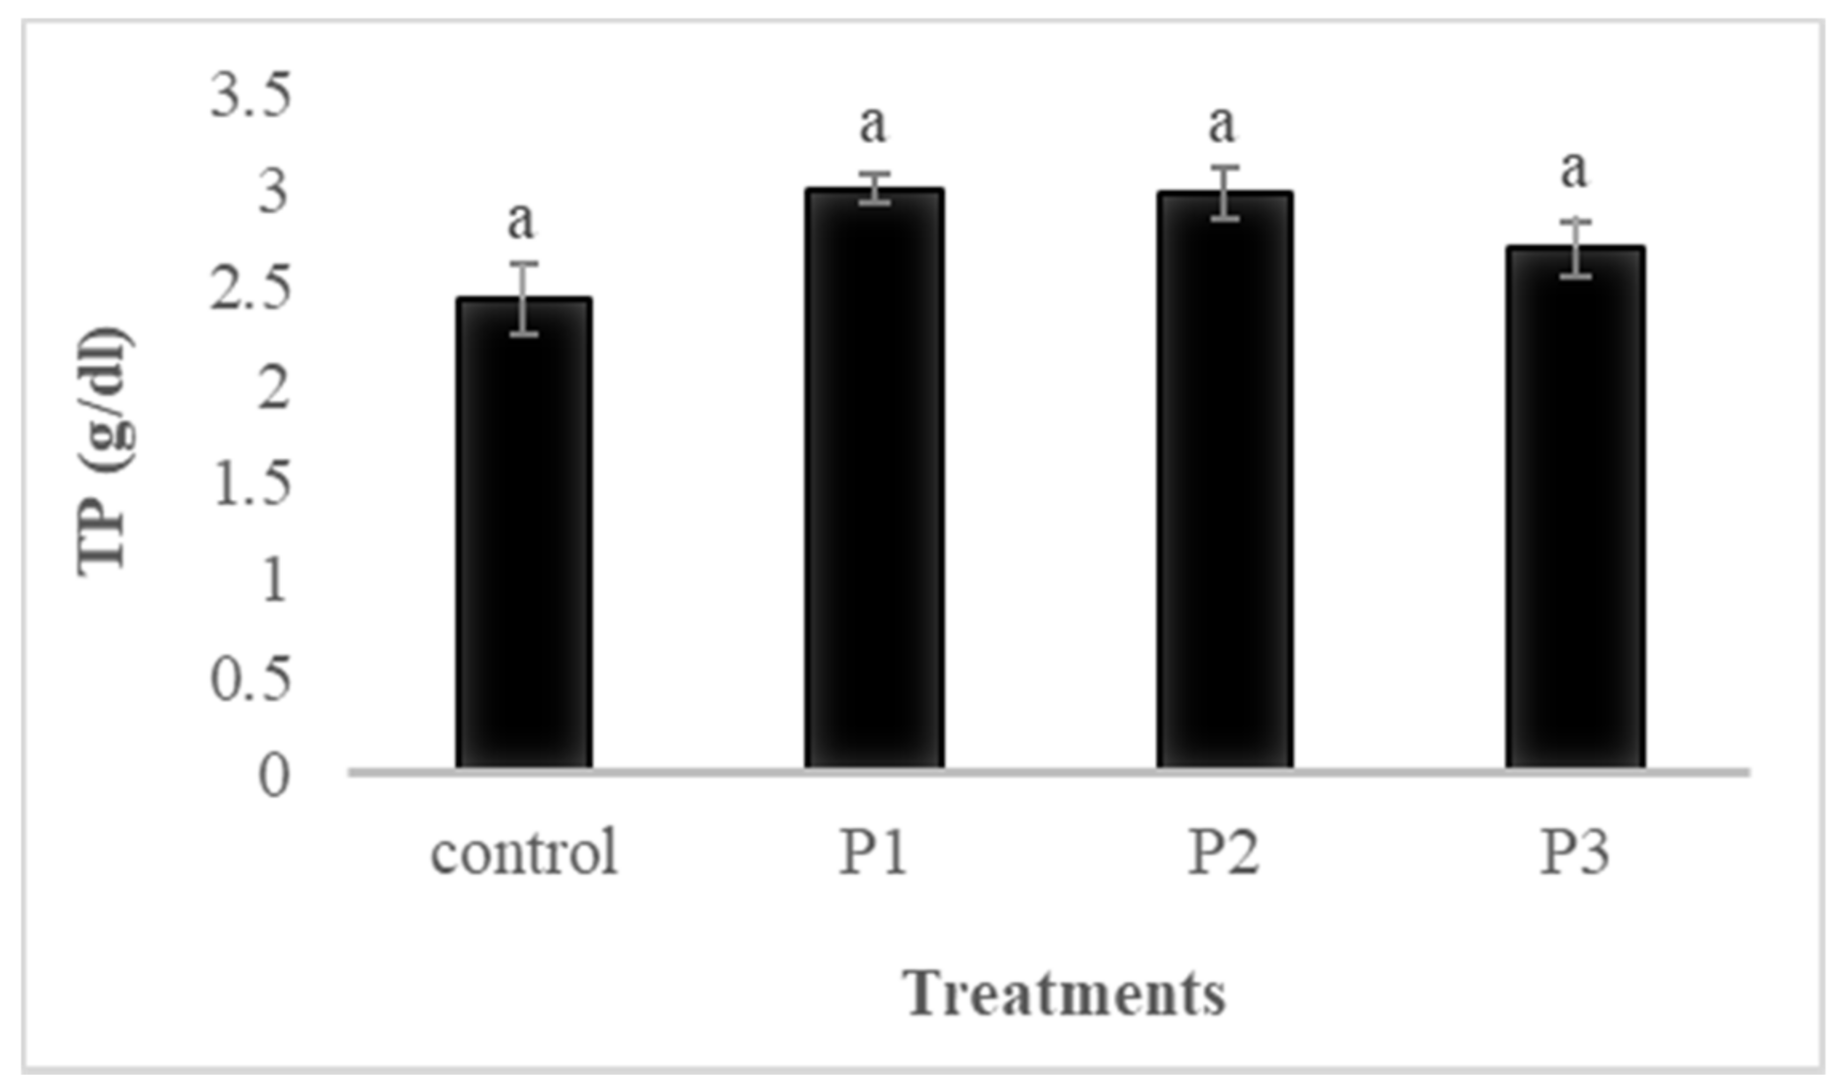
3.4.1. Total Protein (TP)
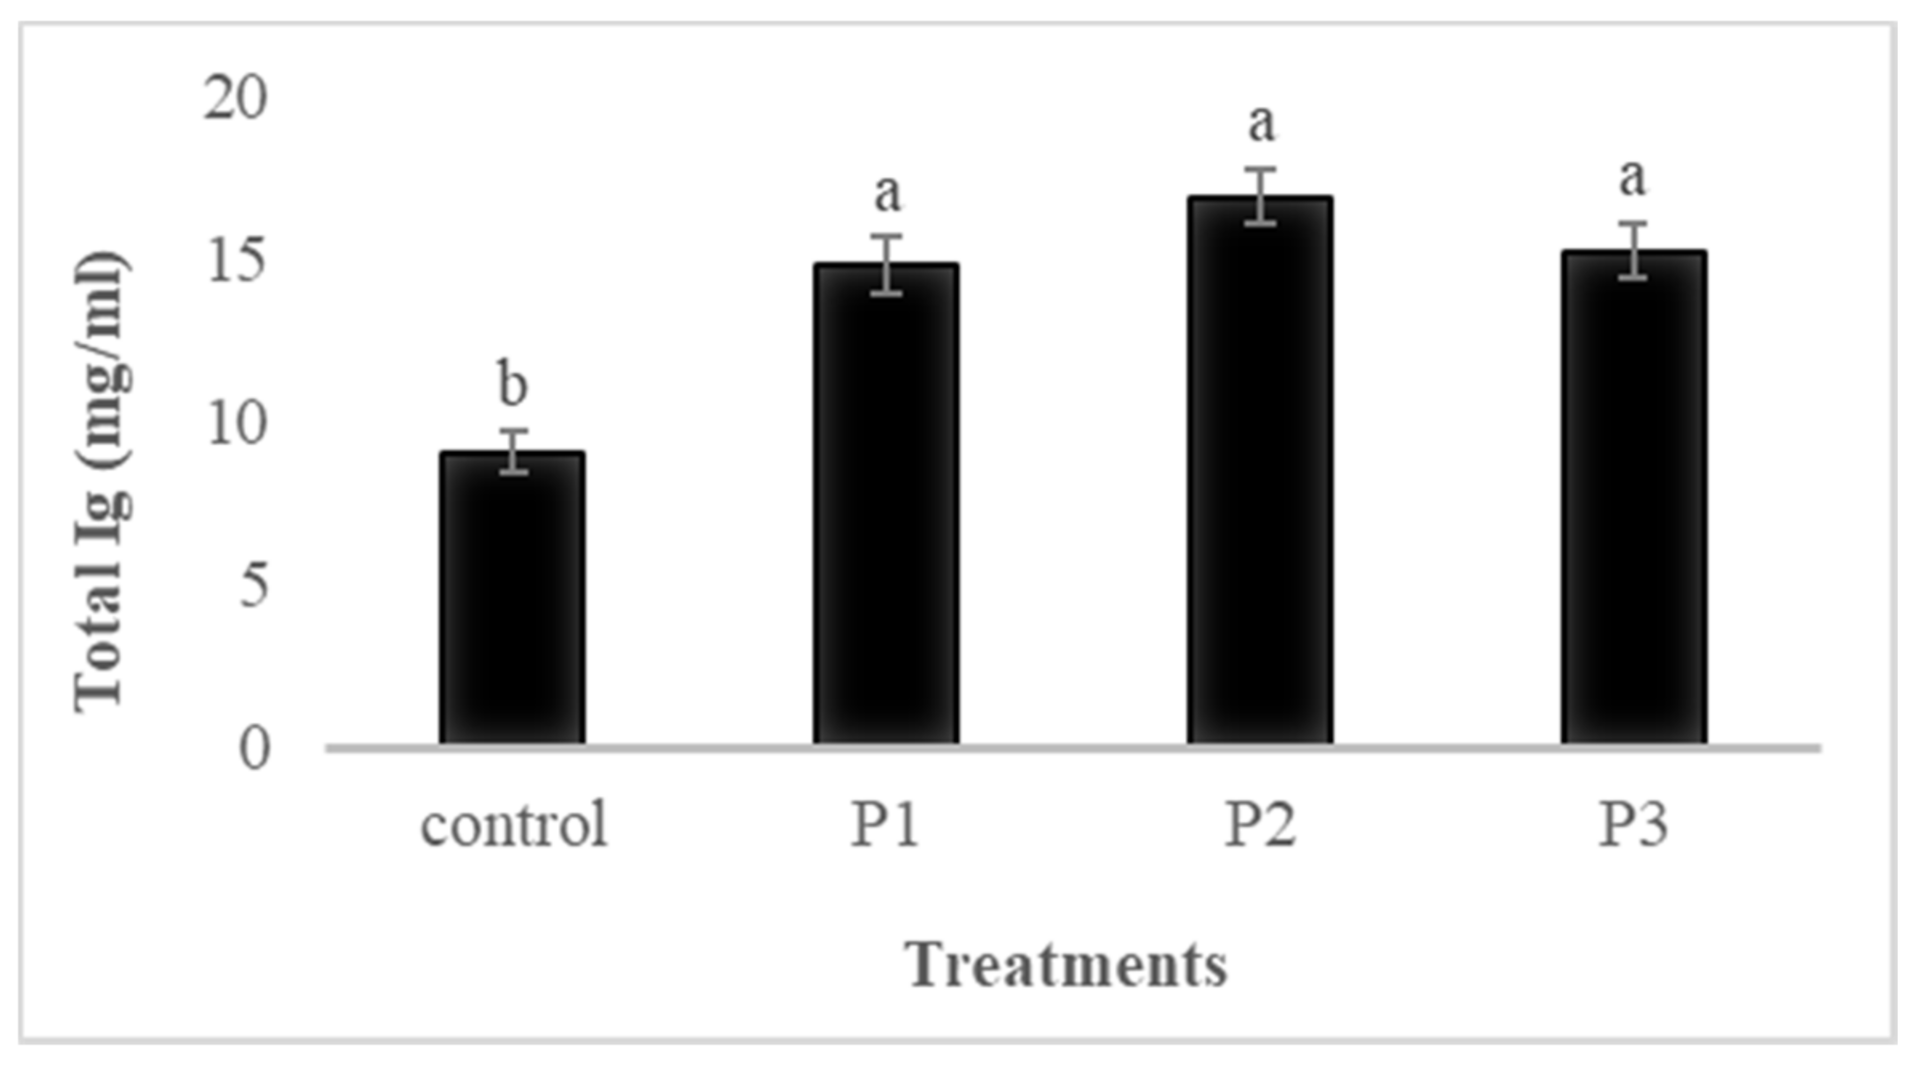
3.4.2. Total Ig
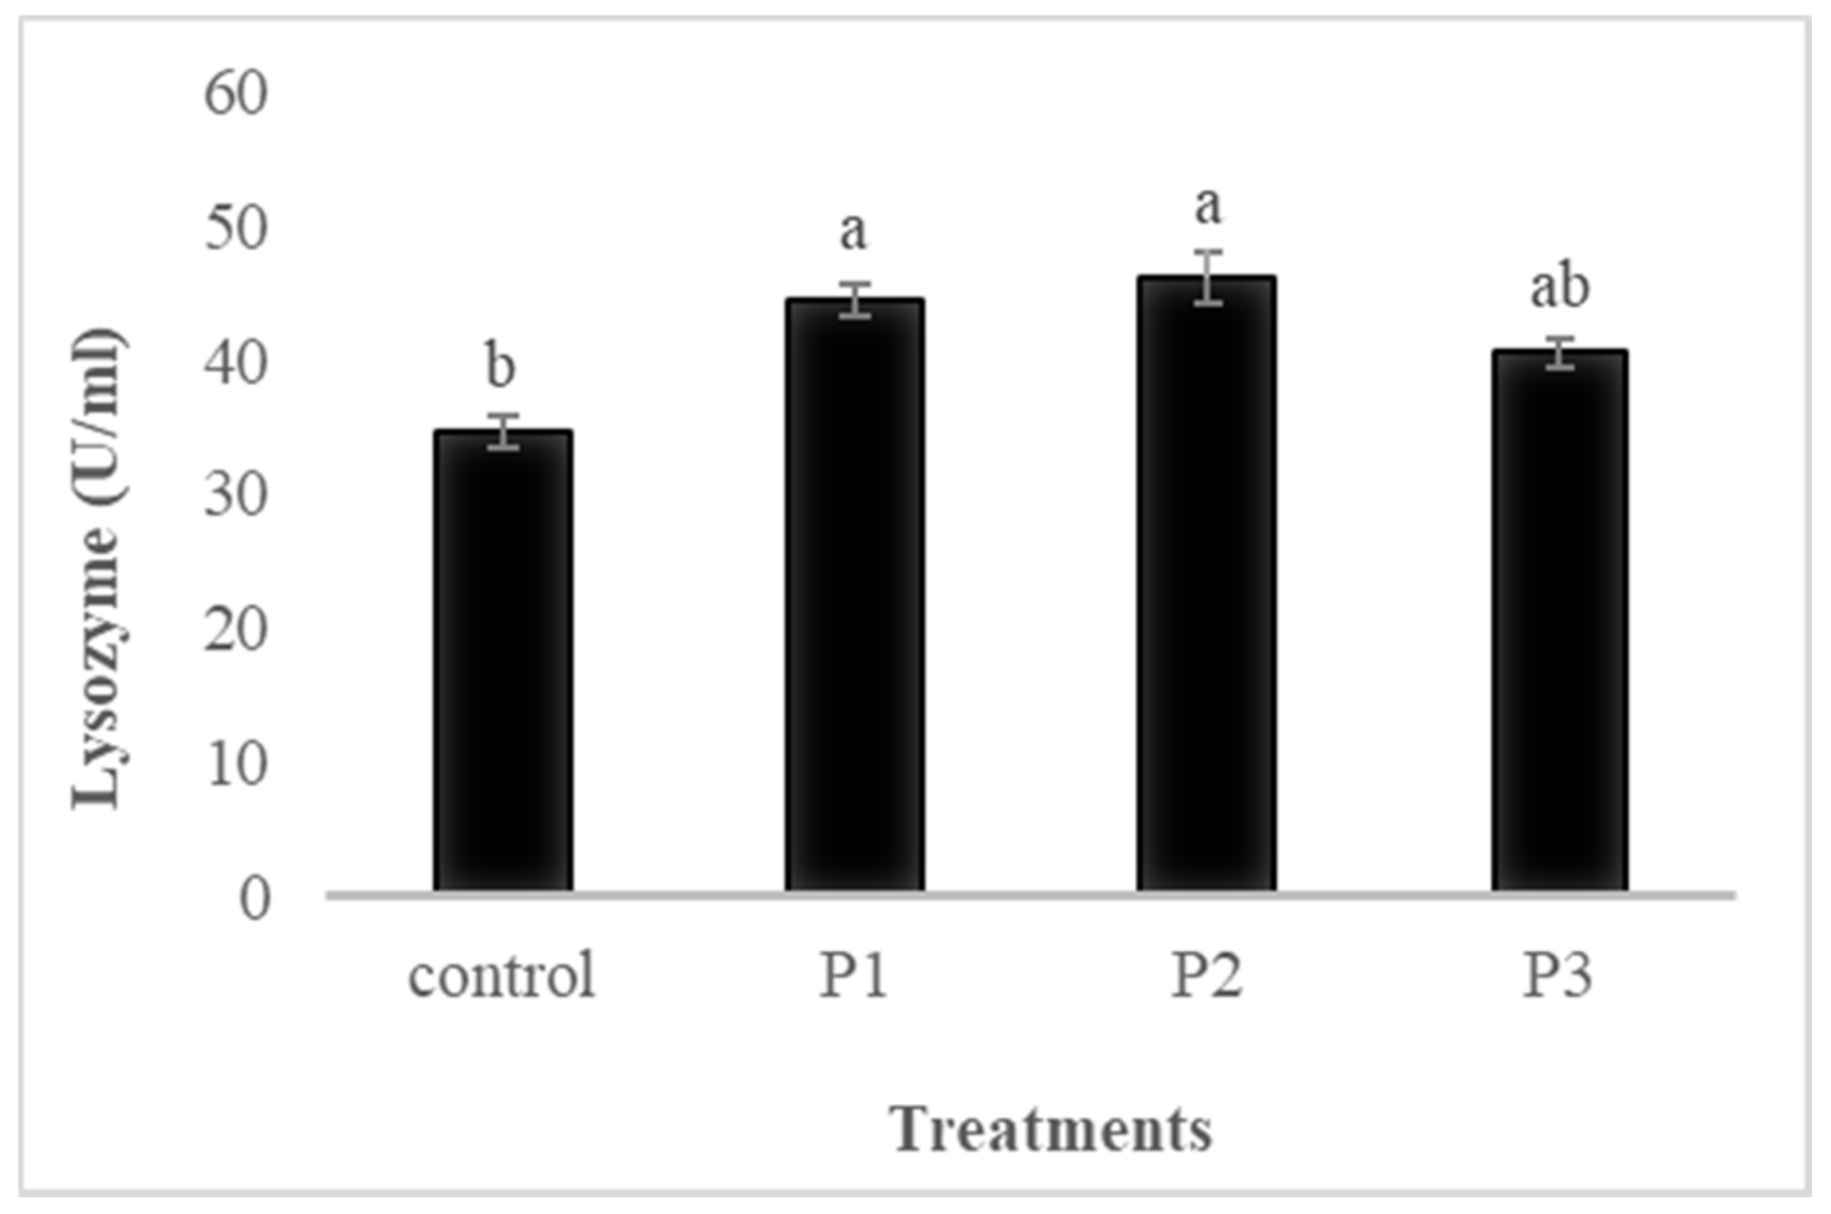
3.4.3. Lysozyme
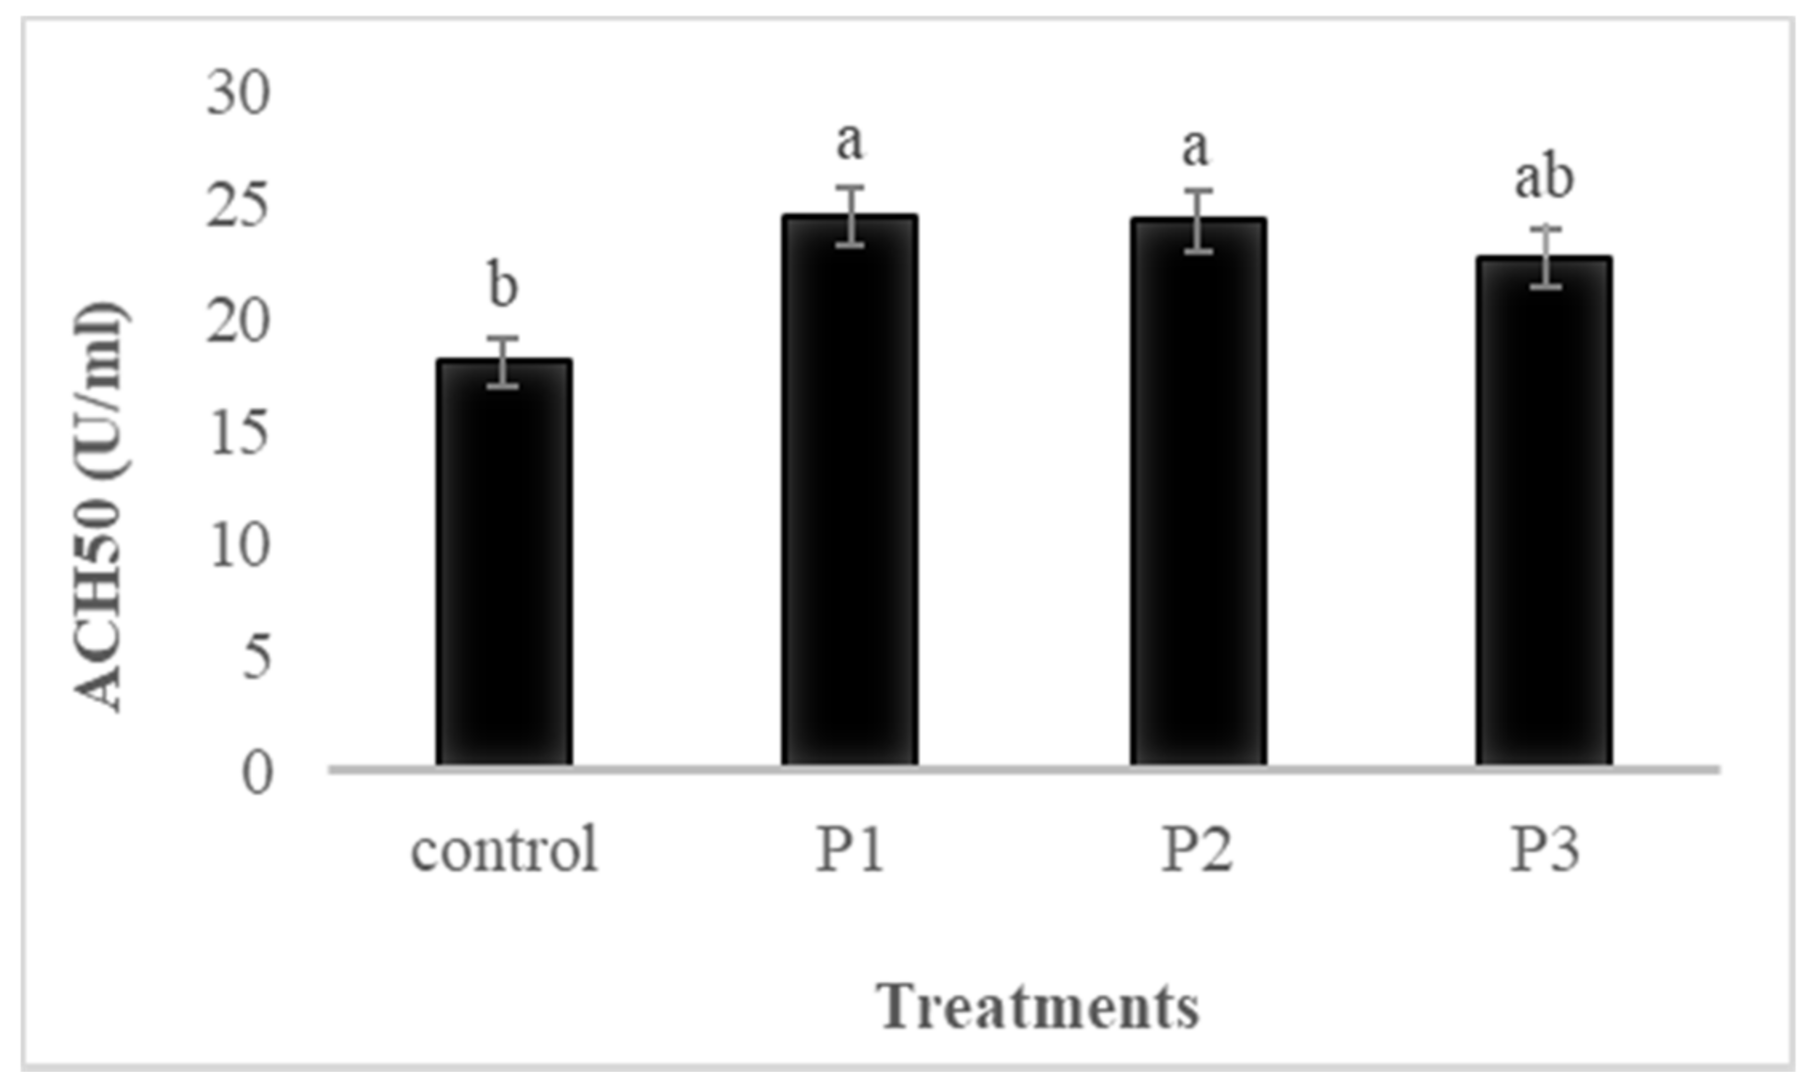
3.4.4. ACH50
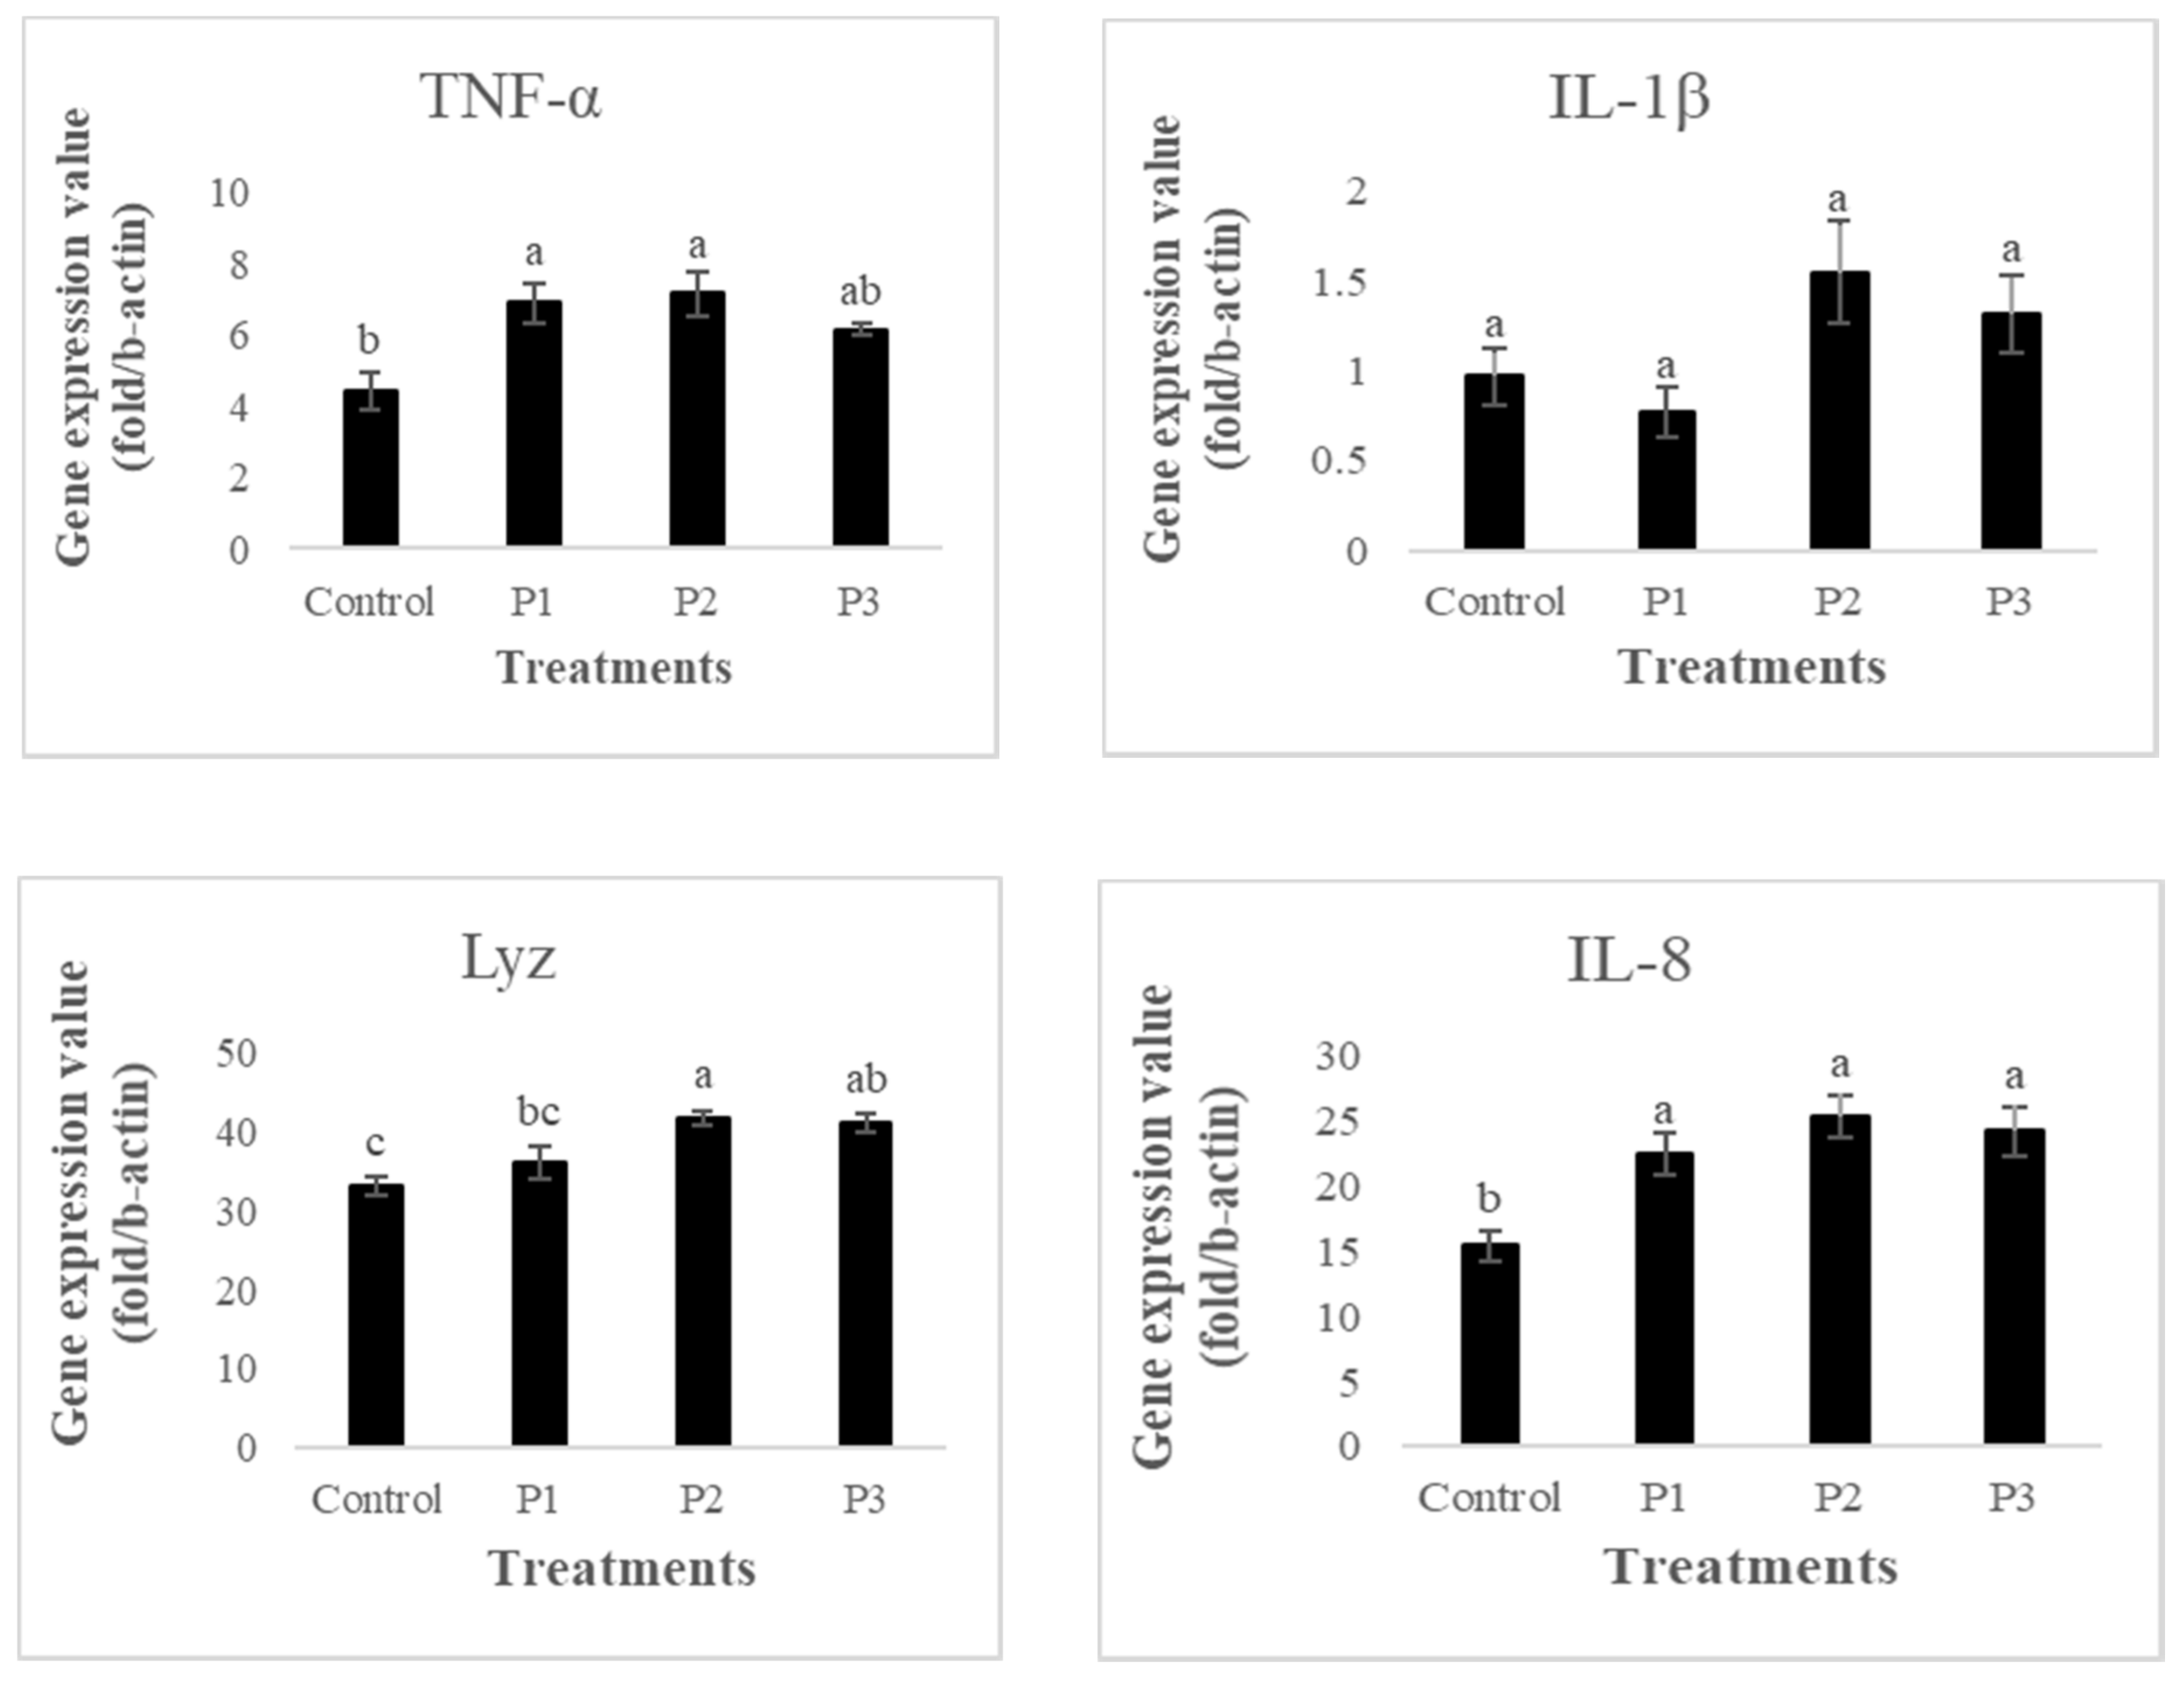
3.5. Gene Expression
4. Discussion
5. Conclusions
Author Contributions
Funding
Institutional Review Board Statement
Data Availability Statement
Acknowledgments
Conflicts of Interest
References
- Food and Agriculture Organization. Sustainability in action. In State World Fisheries and Aquaculture; Food and Agriculture Organization of the United Nations: Rome, Italy, 2020; 244p. [Google Scholar] [CrossRef]
- Gatlin, D.M., III. Nutrition and fish health. In Fish Nutrition; Academic Press: Cambridge, MA, USA, 2003; pp. 671–702. [Google Scholar]
- Chakraborty, S.B.; Hancz, C. Application of phytochemicals as immunostimulant, antipathogenic and antistress agents in finfish culture. Rev. Aquac. 2011, 3, 103–119. [Google Scholar] [CrossRef]
- Vaseeharan, B.; Thaya, R. Medicinal plant derivatives as immunostimulants: An alternative to chemotherapeutics and antibiotics in aquaculture. Aquac. Int. 2014, 22, 1079–1091. [Google Scholar] [CrossRef]
- Song, S.K.; Beck, B.R.; Kim, D.; Park, J.; Kim, J.; Kim, H.D.; Ringø, E. Prebiotics as immunostimulants in aquaculture: A review. Fish Shellfish Immunol. 2014, 40, 40–48. [Google Scholar] [CrossRef]
- Elumalai, P.; Kurian, A.; Lakshmi, S.; Faggio, C.; Esteban, M.A.; Ringø, E. Herbal immunomodulators in aquaculture. Rev. Fish. Sci. Aquac. 2020, 1–25. [Google Scholar] [CrossRef]
- Hoseinifar, S.H.; Esteban, M.Á.; Cuesta, A.; Sun, Y.Z. Prebiotics and fish immune response: A review of current knowledge and future perspectives. Rev. Fish. Sci. Aquac. 2015, 23, 315–328. [Google Scholar] [CrossRef]
- Abdel-Tawwab, M.; Razek, N.A.; Abdel-Rahman, A.M. Immunostimulatory effect of dietary chitosan nanoparticles on the performance of Nile tilapia, Oreochromis niloticus (L.). Fish Shellfish Immunol. 2019, 88, 254–258. [Google Scholar] [CrossRef]
- Hoseinifar, S.H.; Sun, Y.Z.; Wang, A.; Zhou, Z. Probiotics as means of diseases control in aquaculture, a review of current knowledge and future perspectives. Front. Microbiol. 2018, 9, 2429. [Google Scholar] [CrossRef] [Green Version]
- Wang, S.H.; Chen, J.C. The protective effect of chitin and chitosan against Vibrio alginolyticus in white shrimp Litopenaeus vannamei. Fish Shellfish Immunol. 2005, 19, 191–204. [Google Scholar] [CrossRef]
- Samarakoon, K.W.; Cha, S.H.; Lee, J.H.; Jeon, Y.J. The growth, innate immunity and protection against H2O2-induced oxidative damage of a chitosan-coated diet in the olive flounder Paralichthys olivaceus. Fish. Aquat. Sci. 2013, 16, 149–158. [Google Scholar] [CrossRef] [Green Version]
- No, H.K.; Park, N.Y.; Lee, S.H.; Meyers, S.P. Antibacterial activity of chitosans and chitosan oligomers with different molecular weights. Int. J. Food Microbiol. 2002, 74, 65–72. [Google Scholar] [CrossRef]
- Makki, K.; Deehan, E.C.; Walter, J.; Bäckhed, F. The impact of dietary fiber on gut microbiota in host health and disease. Cell Host Microbe 2018, 23, 705–715. [Google Scholar] [CrossRef] [Green Version]
- Guerreiro, I.; Enes, P.; Oliva-Teles, A. Effects of short-chain fructooligosaccharides (scFOS) and rearing temperature on growth performance and hepatic intermediary metabolism in gilthead sea bream (Sparus aurata) juveniles. Fish Physiol. Biochem. 2015, 41, 1333–1344. [Google Scholar] [CrossRef]
- Zhou, Q.C.; Buentello, J.A.; Gatlin, D.M., III. Effects of dietary prebiotics on growth performance, immune response and intestinal morphology of red drum (Sciaenops ocellatus). Aquaculture 2010, 309, 253–257. [Google Scholar] [CrossRef]
- Burr, G.; Gatlin, D., III; Ricke, S. Microbial ecology of the gastrointestinal tract of fish and the potential application of prebiotics and probiotics in finfish aquaculture. J. World Aquac. Soc. 2005, 36, 425–436. [Google Scholar] [CrossRef]
- Guerreiro, I.; Couto, A.; Machado, M.; Castro, C.; Pousão-Ferreira, P.; Oliva-Teles, A.; Enes, P. Prebiotics effect on immune and hepatic oxidative status and gut morphology of white sea bream (Diplodus sargus). Fish Shellfish Immunol. 2016, 50, 168–174. [Google Scholar] [CrossRef]
- Reda, R.M.; Ibrahim, R.E.; Ahmed, E.N.G.; El-Bouhy, Z.M. Effect of oxytetracycline and florfenicol as growth promoters on the health status of cultured Oreochromis niloticus. Egypt. J. Aquat. Res. 2013, 39, 241–248. [Google Scholar] [CrossRef] [Green Version]
- Ganguly, S.; Dora, K.C.; Sarkar, S.; Chowdhury, S. Supplementation of prebiotics in fish feed: A review. Rev. Fish Biol. Fish. 2013, 23, 195–199. [Google Scholar] [CrossRef]
- Ibrahem, M.D.; Fathi, M.; Mesalhy, S.; Abd El-Aty, A.M. Effect of dietary supplementation of inulin and vitamin C on the growth, hematology, innate immunity, and resistance of Nile tilapia (Oreochromis niloticus). Fish Shellfish Immunol. 2010, 29, 241–246. [Google Scholar] [CrossRef]
- Ringø, E.; Olsen, R.E.; Gifstad, T.Ø.; Dalmo, R.A.; Amlund, H.; Hemre, G.I.; Bakke, A.M. Prebiotics in aquaculture: A review. Aquac. Nutr. 2010, 16, 117–136. [Google Scholar] [CrossRef]
- Hosseini, S.M.; Hoseinifar, S.H.; Mazandarani, M.; Paknejad, H.; Van Doan, H.; El-Haroun, E.R. The potential benefits of orange peels derived pectin on serum and skin mucus immune parameters, antioxidant defence and growth performance in common carp (Cyprinus carpio). Fish Shellfish Immunol. 2020, 103, 17–22. [Google Scholar] [CrossRef]
- Goulart, F.R.; Da Silva, L.P.; Loureiro, B.B.; Adorian, T.J.; Mombach, P.I.; Petkowicz, C.L.O. Effects of dietary fibre concentrates on growth performance and digestive enzyme activities of jundiá (Rhamdia quelen). Aquac. Nutr. 2017, 23, 358–366. [Google Scholar] [CrossRef]
- Van Doan, H.; Hoseinifar, S.H.; Naraballobh, W.; Jaturasitha, S.; Tongsiri, S.; Chitmanat, C.; Ringø, E. Dietary inclusion of Orange peels derived pectin and Lactobacillus plantarum for Nile tilapia (Oreochromis niloticus) cultured under indoor biofloc systems. Aquaculture 2019, 508, 98–105. [Google Scholar] [CrossRef]
- Van Doan, H.; Hoseinifar, S.H.; Elumalai, P.; Tongsiri, S.; Chitmanat, C.; Jaturasitha, S.; Doolgindachbaporn, S. Effects of orange peels derived pectin on innate immune response, disease resistance and growth performance of Nile tilapia (Oreochromis niloticus) cultured under indoor biofloc system. Fish Shellfish Immunol. 2018, 80, 56–62. [Google Scholar] [CrossRef]
- Jackson, C.L.; Dreaden, T.M.; Theobald, L.K.; Tran, N.M.; Beal, T.L.; Eid, M.; Mohnen, D. Pectin induces apoptosis in human prostate cancer cells: Correlation of apoptotic function with pectin structure. Glycobiology 2007, 17, 805–819. [Google Scholar] [CrossRef]
- Inngjerdingen, K.T.; Patel, T.R.; Chen, X.; Kenne, L.; Allen, S.; Morris, G.A.; Paulsen, B.S. Immunological and structural properties of a pectic polymer from Glinus oppositifolius. Glycobiology 2007, 17, 1299–1310. [Google Scholar] [CrossRef] [Green Version]
- Chong, A.S.; Hashim, R.; Chow-Yang, L.; Ali, A.B. Partial characterization and activities of proteases from the digestive tract of discus fish (Symphysodon aequifasciata). Aquaculture 2002, 203, 321–333. [Google Scholar] [CrossRef]
- Bradford, M.M. A rapid and sensitive method for the quantitation of microgram quantities of protein utilizing the principle of protein-dye binding. Anal. Biochem. 1976, 72, 248–254. [Google Scholar] [CrossRef]
- Siwicki, A.K.; Anderson, D.P. Immunoglobulin levels in fish sera measured by polyethylene glycol and spectrophotometric methods in microtiter plates. In Techniques in Fish Immunology III; Stolen, J.S., Fletcher, T.C., Anderson, D.P., Kaattari, S.L., Rowley, A.F., Eds.; SOS Publications: Fair Haven, NJ, USA, 1994. [Google Scholar]
- Ellis, A.E. Lysozyme assays. Tech. Fish Immunol. 1990, 1, 101–103. [Google Scholar]
- Ortuno, J.; Esteban, M.A.; Meseguer, J. Effects of short-term crowding stress on the gilthead seabream (Sparus aurata L.) innate immune response. Fish Shellfish Immunol. 2001, 11, 187–197. [Google Scholar] [CrossRef]
- Yousefi, S.; Hoseinifar, S.H.; Paknejad, H.; Hajimoradloo, A. The effects of dietary supplement of galactooligosaccharide on innate immunity, immune related genes expression and growth performance in zebrafish (Danio rerio). Fish Shellfish Immunol. 2018, 73, 192–196. [Google Scholar] [CrossRef]
- Safari, R.; Hoseinifar, S.H.; Nejadmoghadam, S.; Khalili, M. Non-specific immune parameters, immune, antioxidant and growth-related genes expression of common carp (Cyprinus carpio L.) fed sodium propionate. Aquaculture Res. 2017, 48. [Google Scholar] [CrossRef]
- Pérez-Sánchez, T.; Balcázar, J.L.; Merrifield, D.L.; Carnevali, O.; Gioacchini, G.; de Blas, I.; Ruiz-Zarzuela, I. Expression of immune-related genes in rainbow trout (Oncorhynchus mykiss) induced by probiotic bacteria during Lactococcus garvieae infection. Fish Shellfish Immunol. 2011, 31, 196–201. [Google Scholar] [CrossRef]
- Nootash, S.; Sheikhzadeh, N.; Baradaran, B.; Oushani, A.K.; Moghadam, M.R.M.; Nofouzi, K.; Shabanzadeh, S. Green tea (Camellia sinensis) administration induces expression of immune relevant genes and biochemical parameters in rainbow trout (Oncorhynchus mykiss). Fish Shellfish Immunol. 2013, 35, 1916–1923. [Google Scholar] [CrossRef]
- Mirghaed, A.T.; Yarahmadi, P.; Soltani, M.; Paknejad, H.; Hoseini, S.M. Dietary sodium butyrate (Butirex® C4) supplementation modulates intestinal transcriptomic responses and augments disease resistance of rainbow trout (Oncorhynchus mykiss). Fish Shellfish Immunol. 2019, 92, 621–628. [Google Scholar] [CrossRef]
- Livak, K.J.; Schmittgen, T.D. Analysis of relative gene expression data using real-time quantitative PCR and the 2−ΔΔCT method. Methods 2001, 25, 402–408. [Google Scholar] [CrossRef]
- Genc, M.; Yilmaz, E.; Genç, E.; Aktaş, M. Effects of dietary mannan oligosaccharides (MOS) on growth, body composition, and intestine and liver histology of the hybrid Tilapia (Oreochromis niloticus × O-aureus). Isr. J. Aquac. Bamidgeh 2007, 59, 10–16. [Google Scholar]
- Yilmaz, E.; Genc, M.; Genç, E. Effects of dietary mannan oligosaccharides on growth, body composition, and intestine and liver histology of rainbow trout, Oncorhynchus mykiss. Isr. J. Aquac. Bamidgeh 2007, 59, 182–188. [Google Scholar]
- Eshaghzadeh, H.; Hoseinifar, S.H.; Vahabzadeh, H.; Ringø, E. The effects of dietary inulin on growth performances, survival and digestive enzyme activities of common carp (Cyprinus carpio) fry. Aquac. Nutr. 2015, 21, 242–247. [Google Scholar] [CrossRef]
- Ye, J.D.; Wang, K.; Li, F.D.; Sun, Y.Z. Single or combined effects of fructo-and mannan oligosaccharide supplements and Bacillus clausii on the growth, feed utilization, body composition, digestive enzyme activity, innate immune response and lipid metabolism of the Japanese flounder Paralichthys olivaceus. Aquac. Nutr. 2011, 17, e902–e911. [Google Scholar] [CrossRef]
- Dimitroglou, A.; Merrifield, D.L.; Spring, P.; Sweetman, J.; Moate, R.; Davies, S.J. Effects of mannan oligosaccharide (MOS) supplementation on growth performance, feed utilisation, intestinal histology and gut microbiota of gilthead sea bream (Sparus aurata). Aquaculture 2010, 300, 182–188. [Google Scholar] [CrossRef]
- Khodadadi, M.; Abbasi, N.; Adorian, T.J.; Farsani, H.G.; Hedayati, A.; Hoseini, S.M. Growth performance, survival, body composition, hematological parameters, intestinal histomorphology, and digestive enzymes’ activity in juvenile rainbow trout (Oncorhynchus mykiss) fed dietary Immunogen®. J. Appl. Aquac. 2018, 30, 174–186. [Google Scholar] [CrossRef]
- Hoseinifar, S.H.; Ahmadi, A.; Raeisi, M.; Hoseini, S.M.; Khalili, M.; Behnampour, N. Comparative study on immunomodulatory and growth enhancing effects of three prebiotics (galactooligosaccharide, fructooligosaccharide and inulin) in common carp (Cyprinus carpio). Aquac. Res. 2017, 48, 3298–3307. [Google Scholar] [CrossRef]
- Jiang, T.; Gao, X.; Wu, C.; Tian, F.; Lei, Q.; Bi, J.; Wang, X. Apple-derived pectin modulates gut microbiota, improves gut barrier function, and attenuates metabolic endotoxemia in rats with diet-induced obesity. Nutrients 2016, 8, 126. [Google Scholar] [CrossRef] [Green Version]
- Salem, M.; Gaber, M.M.; Zaki, M.A.D.; Nour, A.A. Effects of dietary mannan oligosaccharides on growth, body composition and intestine of the sea bass (Dicentrarchus labrax L.). Aquac. Res. 2016, 47, 3516–3525. [Google Scholar] [CrossRef]
- Salem, M.; Abdel-Ghany, H.M. Effects of dietary orange peel on growth performance of Nile tilapia (Oreochromis niloticus) fingerlings. Aquac. Stud. 2018, 18, 127–134. [Google Scholar] [CrossRef]
- Grisdale-Helland, B.; Helland, S.J.; Gatlin, D.M., III. The effects of dietary supplementation with mannanoligosaccharide, fructooligosaccharide or galactooligosaccharide on the growth and feed utilization of Atlantic salmon (Salmo salar). Aquaculture 2008, 283, 163–167. [Google Scholar] [CrossRef]
- Bernard, H.; Desseyn, J.L.; Bartke, N.; Kleinjans, L.; Stahl, B.; Belzer, C.; Husson, M.O. Dietary Pectin–Derived Acidic Oligosaccharides Improve the Pulmonary Bacterial Clearance of Pseudomonas aeruginosa Lung Infection in Mice by Modulating Intestinal Microbiota and Immunity. J. Infect. Dis. 2015, 211, 156–165. [Google Scholar] [CrossRef] [Green Version]
- Dawood, M.A.; Koshio, S.; Ishikawa, M.; El-Sabagh, M.; Esteban, M.A.; Zaineldin, A.I. Probiotics as an environment-friendly approach to enhance red sea bream, Pagrus major growth, immune response and oxidative status. Fish Shellfish Immunol. 2016, 57, 170–178. [Google Scholar] [CrossRef]
- Hoseinifar, S.H.; Ringø, E.; Shenavar Masouleh, A.; Esteban, M.Á. Probiotic, prebiotic and synbiotic supplements in sturgeon aquaculture: A review. Rev. Aquac. 2016, 8, 89–102. [Google Scholar] [CrossRef]
- Holst, B.; Williamson, G. Nutrients and phytochemicals: From bioavailability to bioefficacy beyond antioxidants. Curr. Opin. Biotechnol. 2008, 19, 73–82. [Google Scholar] [CrossRef] [PubMed]
- Hernández, A.; Tort, L. Annual variation of complement, lysozyme and haemagglutinin levels in serum of the gilthead sea bream Sparus aurata. Fish Shellfish Immunol. 2003, 15, 479–481. [Google Scholar] [CrossRef]
- Vogt, L.M.; Sahasrabudhe, N.M.; Ramasamy, U.; Meyer, D.; Pullens, G.; Faas, M.M.; de Vos, P. The impact of lemon pectin characteristics on TLR activation and T84 intestinal epithelial cell barrier function. J. Funct. Foods 2016, 22, 398–407. [Google Scholar] [CrossRef]
- Caipang, C.M.A.; Lazado, C.C. Nutritional impacts on fish mucosa: Immunostimulants, pre-and probiotics. In Mucosal Health in Aquaculture; Academic Press: Cambridge, MA, USA, 2015; pp. 211–272. [Google Scholar]
- Khramova, D.S.; Popov, S.V.; Golovchenko, V.V.; Vityazev, F.V.; Paderin, N.M.; Ovodov, Y.S. Abrogation of the oral tolerance to ovalbumin in mice by citrus pectin. Nutrition 2009, 25, 226–232. [Google Scholar] [CrossRef]
- Hoseinifar, S.H.; Jahazi, M.A.; Mohseni, R.; Yousefi, M.; Bayani, M.; Mazandarani, M.; Van Doan, H.; El-Haroun, E.R. Dietary apple peel-derived pectin improved growth performance, antioxidant enzymes and immune response in common carp, Cyprinus carpio (Linnaeus, 1758). Aquaculture 2021, 535, 736311. [Google Scholar] [CrossRef]
- Moscatiello, R.; Mariani, P.; Sanders, D.; Maathuis, F.J. Transcriptional analysis of calcium-dependent and calcium-independent signalling pathways induced by oligogalacturonides. J. Exp. Bot. 2006, 57, 2847–2865. [Google Scholar] [CrossRef] [PubMed]
- Velazquez-Carriles, C.; Macias-Rodríguez, M.E.; Carbajal-Arizaga, G.G.; Silva-Jara, J.; Angulo, C.; Reyes-Becerril, M. Immobilizing yeast β-glucan on zinc-layered hydroxide nanoparticle improves innate immune response in fish leukocytes. Fish Shellfish Immunol. 2018, 82, 504–513. [Google Scholar] [CrossRef]


| Diet Ingredients | Amount (g kg−1) | |||
|---|---|---|---|---|
| Control | P1 | P2 | P3 | |
| Fish meal 1 | 530 | 530 | 530 | 530 |
| Corn flour 2 | 170 | 170 | 170 | 170 |
| Soybean meal 2 | 107 | 107 | 107 | 107 |
| Fish oil 2 | 105 | 105 | 105 | 105 |
| Corn gluten 3 | 14 | 14 | 14 | 14 |
| Mineral premix 4 | 10 | 10 | 10 | 10 |
| Vitamin premix 5 | 10 | 10 | 10 | 10 |
| Vitamin C 6 | 1 | 1 | 1 | 1 |
| Binder 7 | 20 | 20 | 20 | 20 |
| Choline chloride 8 | 7 | 7 | 7 | 7 |
| Cellulose 9 | 20 | 15 | 10 | 0 |
| Pectin | 0 | 5 | 10 | 20 |
| Proximate Composition of Diets (%) | ||||
| Crude protein | 43.41 | 44 | 45.31 | 44.2 |
| Crude lipid | 11.1 | 10.88 | 10.65 | 11.05 |
| NFE 10 | 16.2 | 17.65 | 18.37 | 18.88 |
| Ash | 11.1 | 11.25 | 11.15 | 11.35 |
| Moisture | 10.4 | 9.95 | 10.61 | 10.5 |
| Gross energy (MJ.kg−1) 11 | 1437.522 | 1455.09 | 1481.337 | 1475.678 |
| Gene | Primers | Tissue | Access Number | Reference(s) |
|---|---|---|---|---|
| β-actin | Forward: AAAAAGCGCCAAAATAACAGAA | Reference Gene | AJ438158 | Pérez-Sánchez et al. 2011 |
| Reverse: TCCGACGGTAAACATCCTTC | ||||
| IL-1β | Forward: ACATTGCCAACCTCATCATCG | Kidney | AJ223954 | Pérez-Sánchez et al. 2011 |
| Reverse: TTGAGCAGGTCCTTGTCCTTG | ||||
| IL-8 | Forward: AGAATGTCAGCCAGCCTTGT | Kidney | AJ279069 | Pérez-Sánchez et al. 2011 |
| Reverse: TCTCAGACTCATCCCCTCAGT | ||||
| TNF-α | Forward: GGGGACAAACTGTGGACTGA | Kidney | AJ277604 | Pérez-Sánchez et al. 2011 |
| Reverse: GAAGTTCTTGCCCTGCTCTG | ||||
| Lyz | Forward: ACAGCCGCTACTGGTGTGACG | Kidney | X59491.1 | Taheri Mirghaed et al., 2019 |
| Reverse: GCTGCTGCCGCACATAGAC |
| Parameters | Control | P1 | P2 | P3 |
|---|---|---|---|---|
| IW (g) | 3.58 ± 0.01 | 3.57 ± 0.02 | 3.55 ± 0.01 | 3.53 ± 0.01 |
| FW (g) | 14.16 ± 0.02 c | 18.11 ± 0.05 a | 18.22 ± 0.04 a | 17.87 ± 0.07 b |
| WG (g) | 10.58 ± 0.03 c | 14.54 ± 0.05 ab | 14.67 ± 0.02 a | 14.33 ± 0.07 b |
| SGR (%/d−1) | 3.27 ± 0.01 b | 3.86 ± 0.01 a | 3.89 ± 0.01 a | 3.85 ± 0.01 a |
| FCR | 1.49 ± 0.005 a | 1.08 ± 0.002 c | 1.07 ± 0.001 d | 1.10 ± 0.005 b |
| HSI (%) | 2.21 ± 0.06 a | 1.28 ± 0.04 c | 0.96 ± 0.05 d | 1.58 ± 0.05 b |
| VSI (%) | 9.98 ± 0.09 a | 6.73 ± 0.04 c | 5.99 ± 0.03 d | 7.16 ± 0.11 b |
| Parameters (%) | Control | P1 | P2 | P3 |
|---|---|---|---|---|
| Moisture | 69.62 ± 1.20 | 70.49 ± 1.18 | 71.04 ± 1.40 | 70.63 ± 0.74 |
| Crude protein | 15.15 ± 0.93 | 16.41 ± 1.17 | 16.97 ± 1.32 | 16.73 ± 0.80 |
| Crude lipid | 4.33 ± 0.14 | 4.19 ± 0.04 | 4.09 ± 0.03 | 4.37 ± 0.10 |
| Ash | 3.19 ± 0.12 | 3.38 ± 0.17 | 3.24 ± 0.15 | 3.41 ± 0.15 |
| Parameters | Control | P1 | P2 | P3 |
|---|---|---|---|---|
| Protease (U/mg pro) | 1.21 ± 0.03 b | 1.34 ± 0.02 a | 1.44 ± 0.03 a | 1.38 ± 0.02 a |
| Amylase (U/mg pro) | 0.58 ± 0.03 b | 0.72 ± 0.02 a | 0.82 ± 0.03 a | 0.74 ± 0.02 a |
| Lipase (U/mg pro) | 0.31 ± 0.03 | 0.27 ± 0.02 | 0.26 ± 0.02 | 0.33 ± 0.02 |
Publisher’s Note: MDPI stays neutral with regard to jurisdictional claims in published maps and institutional affiliations. |
© 2021 by the authors. Licensee MDPI, Basel, Switzerland. This article is an open access article distributed under the terms and conditions of the Creative Commons Attribution (CC BY) license (https://creativecommons.org/licenses/by/4.0/).
Share and Cite
Hoseinifar, S.H.; Rashidian, G.; Ghafarifarsani, H.; Jahazi, M.A.; Soltani, M.; Doan, H.V.; El-Haroun, E.; Paolucci, M. Effects of Apple (Malus pomila) Pomace-Derived Pectin on the Innate Immune Responses, Expressions of Key Immune-Related Genes, Growth Performance, and Digestive Enzyme Activity of Rainbow Trout (Oncorhynchus mykiss). Animals 2021, 11, 2117. https://doi.org/10.3390/ani11072117
Hoseinifar SH, Rashidian G, Ghafarifarsani H, Jahazi MA, Soltani M, Doan HV, El-Haroun E, Paolucci M. Effects of Apple (Malus pomila) Pomace-Derived Pectin on the Innate Immune Responses, Expressions of Key Immune-Related Genes, Growth Performance, and Digestive Enzyme Activity of Rainbow Trout (Oncorhynchus mykiss). Animals. 2021; 11(7):2117. https://doi.org/10.3390/ani11072117
Chicago/Turabian StyleHoseinifar, Seyed Hossein, Ghasem Rashidian, Hamed Ghafarifarsani, Mohammad Amin Jahazi, Mehdi Soltani, Hien Van Doan, Ehab El-Haroun, and Marina Paolucci. 2021. "Effects of Apple (Malus pomila) Pomace-Derived Pectin on the Innate Immune Responses, Expressions of Key Immune-Related Genes, Growth Performance, and Digestive Enzyme Activity of Rainbow Trout (Oncorhynchus mykiss)" Animals 11, no. 7: 2117. https://doi.org/10.3390/ani11072117