
Prevalence of Worldwide Neonatal Calf Diarrhoea Caused by Bovine Rotavirus in Combination with Bovine Coronavirus, Escherichia coli K99 and Cryptosporidium spp.: A Meta-Analysis


Abstract
:Simple Summary
Abstract
1. Introduction
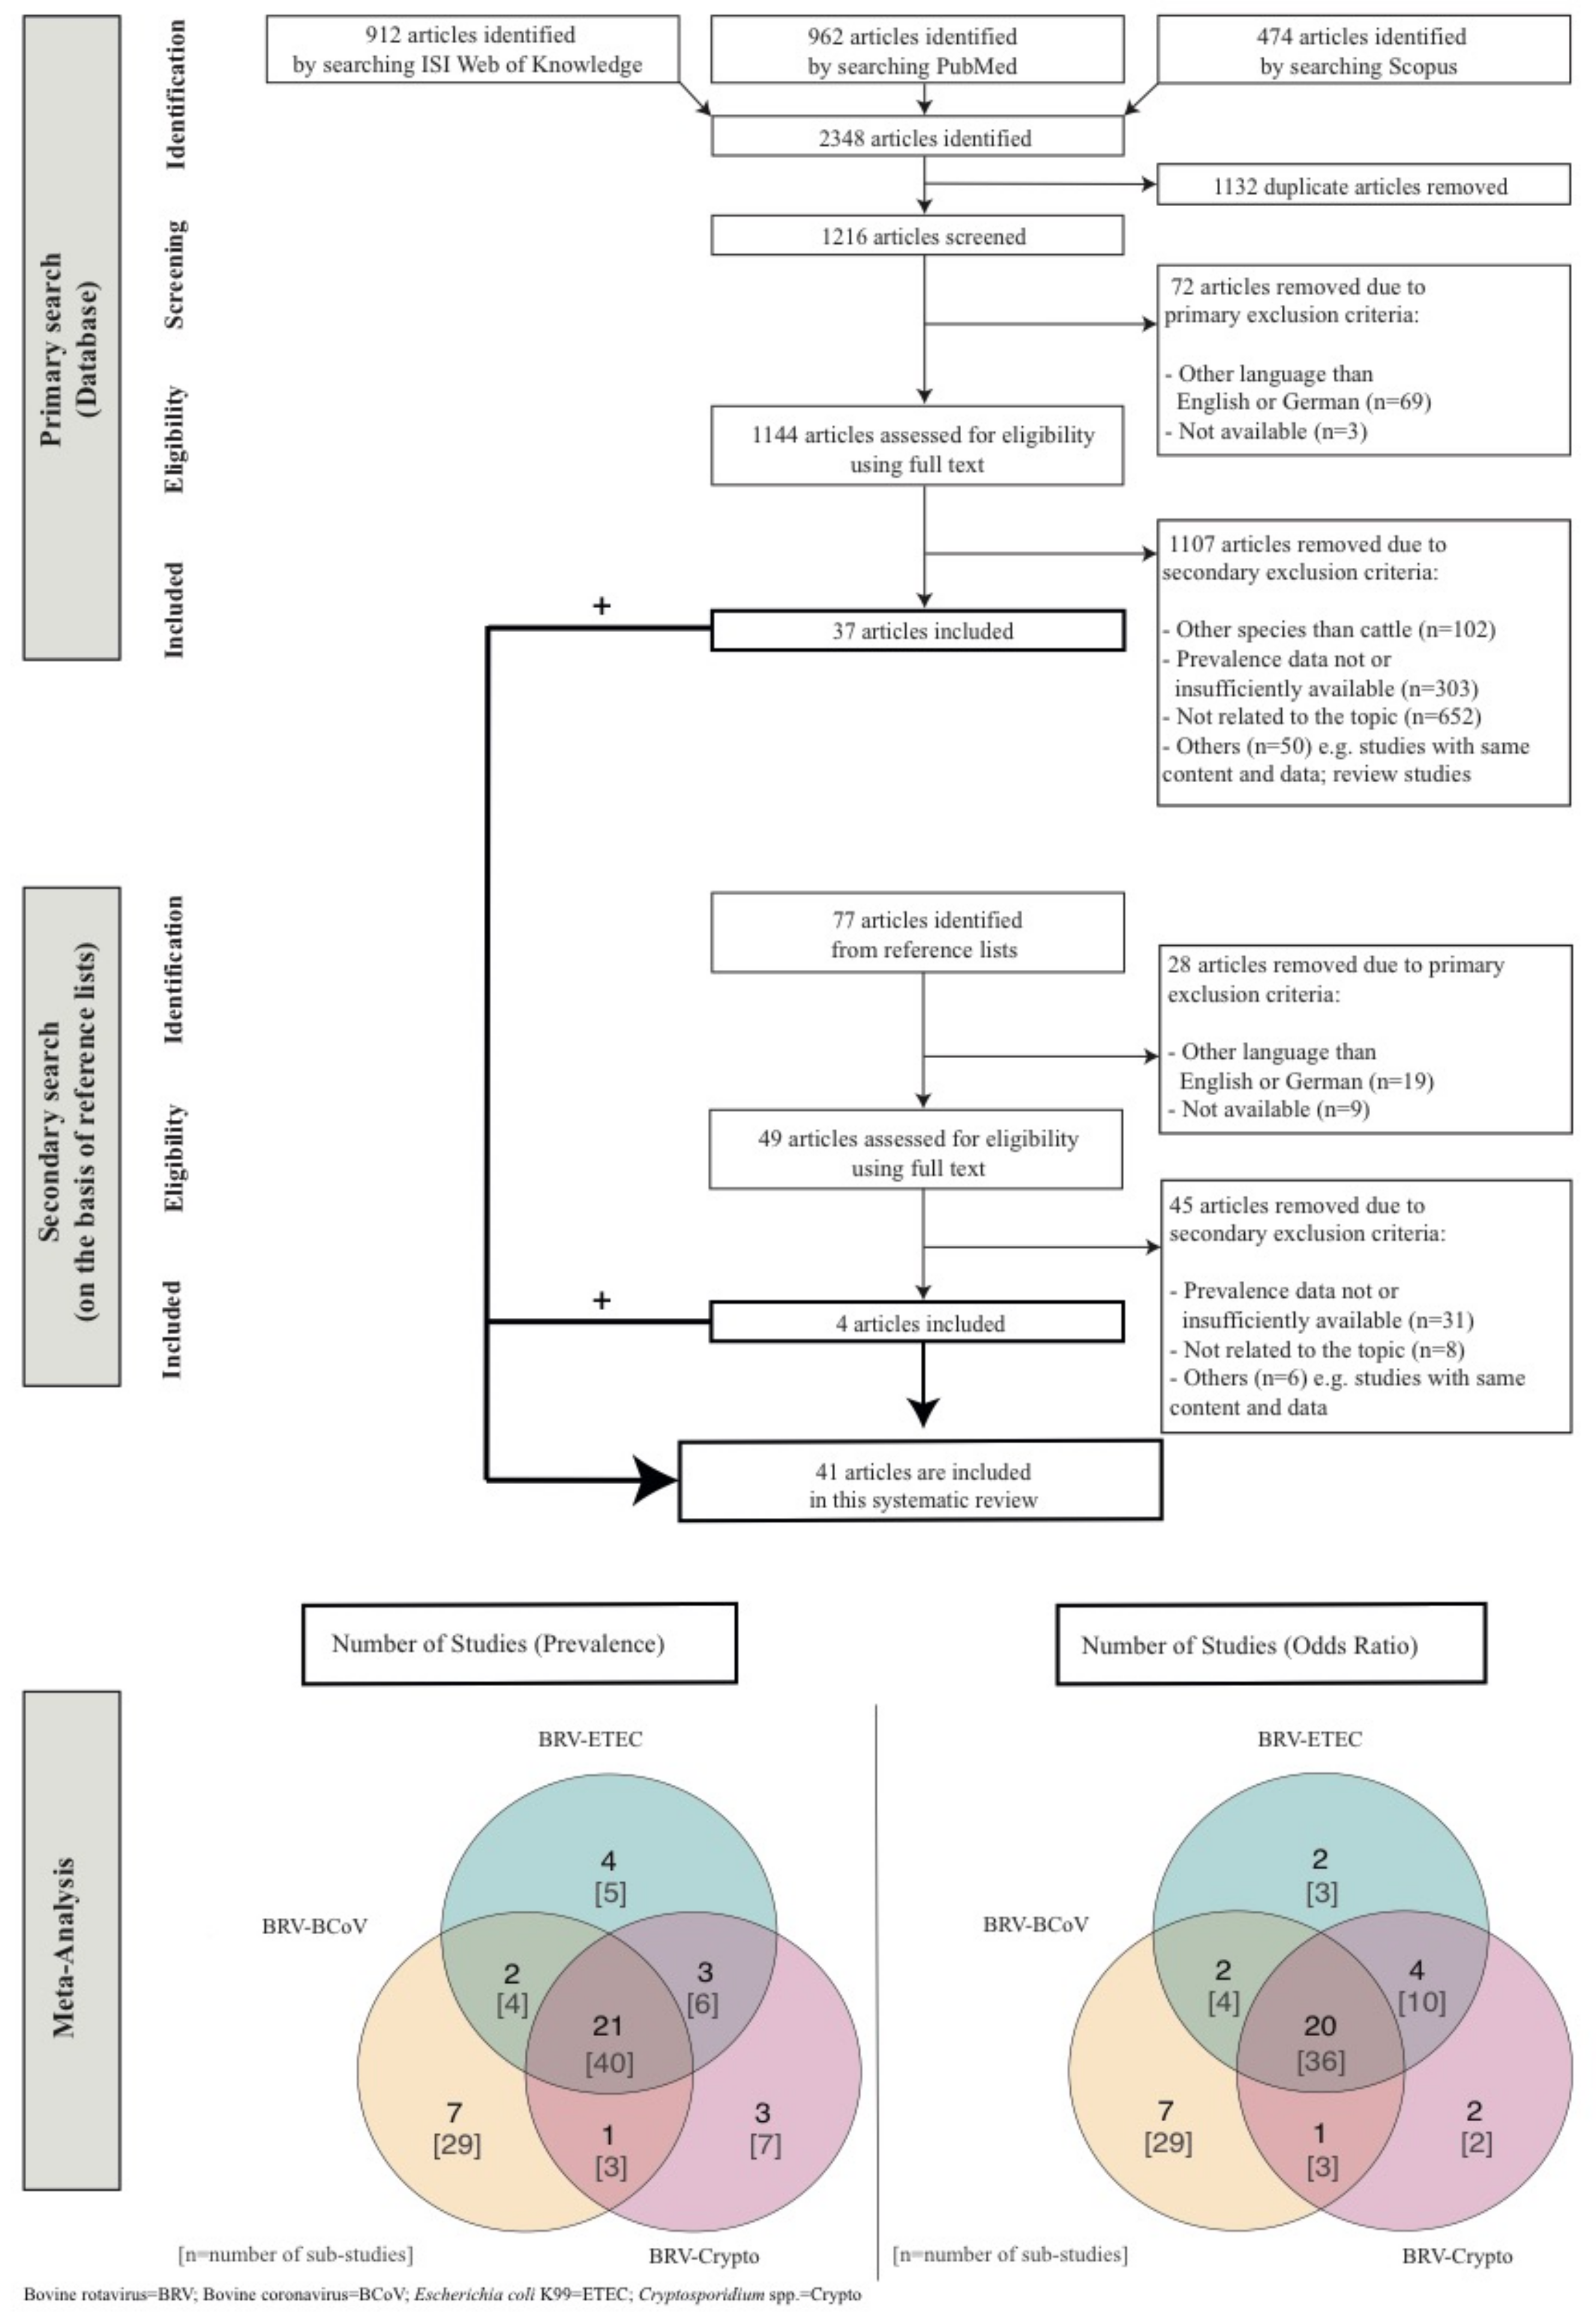
2. Materials and Methods
3. Results
4. Discussion
5. Conclusions
Supplementary Materials
Author Contributions
Funding
Institutional Review Board Statement
Informed Consent Statement
Data Availability Statement
Acknowledgments
Conflicts of Interest
References
- Cho, Y.-I.I.; Yoon, K.-J.J. An overview of calf diarrhea—Infectious etiology, diagnosis, and intervention. J. Vet. Sci. 2014, 15, 1–17. [Google Scholar] [CrossRef] [PubMed] [Green Version]
- Østerås, O.; Gjestvang, M.S.; Vatn, S.; Sølverød, L. Perinatal death in production animals in the Nordic countries—Incidence and costs. Acta Vet. Scand. 2007, 49, 1–4. [Google Scholar] [CrossRef] [Green Version]
- Donovan, G.A.; Dohoo, I.R.; Montgomery, D.M.; Bennett, F.L. Calf and disease factors affecting growth in female Holstein calves in Florida, USA. Prev. Vet. Med. 1998, 33, 1–10. [Google Scholar] [CrossRef]
- Waltner-Toews, D.; Martin, S.W.; Meek, A.H. The effect of early calfhood health status on survivorship and age at first calving. Can. J. Vet. Res. 1986, 50, 314–317. [Google Scholar]
- Pinior, B.; Firth, C.L.; Richter, V.; Lebl, K.; Trauffler, M.; Dzieciol, M.; Hutter, S.E.; Burgstaller, J.; Obritzhauser, W.; Winter, P.; et al. A systematic review of financial and economic assessments of bovine viral diarrhea virus (BVDV) prevention and mitigation activities worldwide. Prev. Vet. Med. 2017, 137, 77–92. [Google Scholar] [CrossRef]
- Richter, V.; Lebl, K.; Baumgartner, W.; Obritzhauser, W.; Käsbohrer, A.; Pinior, B. A systematic worldwide review of the direct monetary losses in cattle due to bovine viral diarrhoea virus infection. Vet. J. 2017, 220, 80–87. [Google Scholar] [CrossRef]
- Marschik, T.; Obritzhauser, W.; Wagner, P.; Richter, V.; Mayerhofer, M.; Egger-Danner, C.; Käsbohrer, A.; Pinior, B. A cost-benefit analysis and the potential trade effects of the bovine viral diarrhoea eradication programme in Styria, Austria. Vet. J. 2018, 231, 19–29. [Google Scholar] [CrossRef]
- Richter, V.; Kattwinkel, E.; Firth, C.L.; Marschik, T.; Dangelmaier, M.; Trauffler, M.; Obritzhauser, W.; Baumgartner, W.; Käsbohrer, A.; Pinior, B. Mapping the global prevalence of bovine viral diarrhoea virus infection and its associated mitigation programmes. Vet. Rec. 2019, 184, 711. [Google Scholar] [CrossRef] [Green Version]
- Burgstaller, J.; Obritzhauser, W.; Kuchling, S.; Kopacka, I.; Pinior, B.; Köfer, J. The effect of bovine viral diarrhoea virus on fertility in dairy cows: Two case-control studies in the province of Styria, Austria. Berl. Munch. Tierarztl. Wochenschr. 2015, 129, 103–110. [Google Scholar] [CrossRef]
- Windeyer, M.C.; Leslie, K.E.; Godden, S.M.; Hodgins, D.C.; Lissemore, K.D.; LeBlanc, S.J. Factors associated with morbidity, mortality, and growth of dairy heifer calves up to 3 months of age. Prev. Vet. Med. 2014, 113, 231–240. [Google Scholar] [CrossRef]
- Svensson, C.; Linder, A.; Olsson, S. Mortality in Swedish Dairy Calves and Replacement Heifers. J. Dairy Sci. 2006, 89, 4769–4777. [Google Scholar] [CrossRef] [Green Version]
- Foster, D.M.; Smith, G.W. Pathophysiology of diarrhea in calves. Vet. Clin. North Am. Food Anim. Pract. 2009, 25, 13–36. [Google Scholar] [CrossRef]
- Scharnböck, B.; Roch, F.-F.; Richter, V.; Funke, C.; Firth, C.L.; Obritzhauser, W.; Baumgartner, W.; Käsbohrer, A.; Pinior, B. A meta-analysis of bovine viral diarrhoea virus (BVDV) prevalences in the global cattle population. Sci. Rep. 2018, 8, 14420. [Google Scholar] [CrossRef] [Green Version]
- Gillhuber, J.; Rügamer, D.; Pfister, K.; Scheuerle, M.C. Giardiosis and other enteropathogenic infections: A study on diarrhoeic calves in Southern Germany. BMC Res. Notes 2014, 7, 1–9. [Google Scholar] [CrossRef] [Green Version]
- Acres, S.D. Enterotoxigenic Escherichia coli infections in newborn calves: A review. J. Dairy Sci. 1985, 68, 229–256. [Google Scholar] [CrossRef]
- Tzipori, S. The relative importance of enteric pathogens affecting neonates of domestic animals. Adv. Vet. Sci. Comp. Med. 1985, 29, 103–206. [Google Scholar]
- Snodgrass, D.R.R.; Terzolo, H.R.; Sherwood, D.; Campbell, I.; Menzies, J.D.; Synge, B.A. Aetiology of diarrhoea in young calves. Vet. Rec. 1986, 119, 31–34. [Google Scholar] [CrossRef]
- Krogh, H.V.; Henriksen, S.A. Bovine cryptosporidiosis in Denmark. 2. Cryptosporidia associated with neonatal calf diarrhea. Nord. Vet. Med. 1985, 37, 42–47. [Google Scholar]
- Lanz Uhde, F.; Kaufmann, T.; Sager, H.; Albini, S.; Zanoni, R.; Schelling, E.; Meylan, M. Prevalence of four enteropathogens in the faeces of young diarrhoeic dairy calves in Switzerland. Vet. Rec. 2008, 163, 362–366. [Google Scholar] [CrossRef]
- Al Mawly, J.; Grinberg, A.; Prattley, D.; Moffat, J.; French, N. Prevalence of endemic enteropathogens of calves in New Zealand dairy farms. N. Z. Vet. J. 2015, 63, 147–152. [Google Scholar] [CrossRef]
- Krogh, H.V. Occurrence of enterotoxigenic Escherichia coli in calves with acute neonatal diarrhoea. Nord. Vet. Med. 1983, 35, 346–352. [Google Scholar]
- Torres-Medina, A.; Schlafer, D.H.; Mebus, C.A. Rotaviral and coronaviral diarrhea. Vet. Clin. North Am. Food Anim. Pract. 1985, 1, 471–493. [Google Scholar] [CrossRef]
- Santín, M.; Trout, J.M.; Fayer, R. A longitudinal study of cryptosporidiosis in dairy cattle from birth to 2 years of age. Vet. Parasitol. 2008, 155, 15–23. [Google Scholar] [CrossRef]
- Sherwood, D.; Snodgrass, D.R.; Lawson, G.H. Prevalence of enterotoxigenic Escherichia coli in calves in Scotland and northern England. Vet. Rec. 1983, 113, 208–212. [Google Scholar] [CrossRef]
- Reynolds, D.J.; Morgan, J.H.; Chanter, N.; Jones, P.W.; Bridger, J.C.; Debney, T.G.; Bunch, K.J. Microbiology of calf diarrhoea in southern Britain. Vet. Rec. 1986, 119, 34–39. [Google Scholar] [CrossRef]
- Mohammed, H.O.; Wade, S.E.; Schaaf, S. Risk factors associated with Cryptosporidium parvum infection in dairy cattle in southeastern New York State. Vet. Parasitol. 1999, 83, 1–13. [Google Scholar] [CrossRef]
- Klein-Jöbstl, D.; Arnholdt, T.; Sturmlechner, F.; Iwersen, M.; Drillich, M. Results of an online questionnaire to survey calf management practices on dairy cattle breeding farms in Austria and to estimate differences in disease incidences depending on farm structure and management practices. Acta Vet. Scand. 2015, 57, 1–10. [Google Scholar] [CrossRef] [PubMed] [Green Version]
- Silverlås, C.; Emanuelson, U.; de Verdier, K.; Björkman, C. Prevalence and associated management factors of Cryptosporidium shedding in 50 Swedish dairy herds. Prev. Vet. Med. 2009, 90, 242–253. [Google Scholar] [CrossRef] [PubMed]
- Gulliksen, S.M.; Jor, E.; Lie, K.I.; Hamnes, I.S.; Løken, T.; Akerstedt, J.; Osterås, O.; Åkerstedt, J.; Østerås, O. Enteropathogens and risk factors for diarrhea in Norwegian dairy calves. J. Dairy Sci. 2009, 92, 5057–5066. [Google Scholar] [CrossRef] [PubMed]
- Kohara, J.; Hirai, T.; Mori, K.; Ishizaki, H.; Tsunemitsu, H. Enhancement of passive immunity with maternal vaccine against newborn calf diarrhea. J. Vet. Med. Sci. 1997, 59, 1023–1025. [Google Scholar] [CrossRef] [PubMed] [Green Version]
- OIE. Cryptosporidiosis. In Terrestrial Manual, 8th ed.; OIE: Paris, France, 2018; pp. 1678–1692. [Google Scholar]
- Paule, R.C.; Mandel, J. Consensus values, regressions, and weighting factors. J. Res. Natl. Inst. Stand. Technol. 1989, 94, 197–203. [Google Scholar] [CrossRef]
- Veroniki, A.A.; Jackson, D.; Viechtbauer, W.; Bender, R.; Bowden, J.; Knapp, G.; Kuss, O.; Higgins, J.P.T.; Langan, D.; Salanti, G. Methods to estimate the between-study variance and its uncertainty in meta-analysis. Res. Synth. Methods 2016, 7, 55–79. [Google Scholar] [CrossRef] [Green Version]
- Freeman, M.F.; Tukey, J.W. Transformations related to the angular and the square root. Ann. Math. Stat. 1950, 607–611. [Google Scholar] [CrossRef]
- Miller, J.J. The inverse of the Freeman—Tukey double arcsine transformation. Am. Stat. 2012, 32, 3–4. [Google Scholar] [CrossRef]
- Higgins, J.P.T.; Thompson, S.G.; Deeks, J.J.; Altman, D.G. Measuring inconsistency in meta-analyses. BMJ 2003, 327, 557–560. [Google Scholar] [CrossRef] [Green Version]
- Egger, M.; Davey Smith, G.; Schneider, M.; Minder, C. Bias in meta-analysis detected by a simple, graphical test. BMJ 1997, 315, 629–634. [Google Scholar] [CrossRef] [Green Version]
- Pinior, B.; Garcia, S.; Minviel, J.J.; Raboisson, D. Epidemiological factors and mitigation measures influencing production losses in cattle due to bovine viral diarrhoea virus infection: A meta-analysis. Transbound. Emerg. Dis. 2019, 66, 2426–2439. [Google Scholar] [CrossRef]
- Belsley, D.A.; Kuh, E.; Welsch, R.E. Detecting influential observations and outliers. In Regression Diagnostics; Belsley, D.A., Kuh, E., Welsch, R.E., Eds.; John Wiley & Sons, Inc.: Hoboken, NJ, USA, 1980; Volume 6, p. 50. [Google Scholar] [CrossRef]
- Cook, R.D. Detection of influential observation in linear regression. Technometrics 1977, 19, 15–18. [Google Scholar] [CrossRef]
- Viechtbauer, W. Conducting meta-analyses in R with the metafor package. J. Stat. Softw. 2010, 36, 1–48. [Google Scholar] [CrossRef] [Green Version]
- Pearson, R. GoodmanKruskal: Association Analysis for Categorical Variables. R Packag. Version 0.0.3. 2020. Available online: https://cran.r-project.org/web/packages/GoodmanKruskal/vignettes/GoodmanKruskal.html (accessed on 3 April 2021).
- Borenstein, M.; Hedges, L.V.; Higgins, J.P.T.; Rothstein, H.R. Identifying and quantifying heterogeneity. In Introduction to Meta-Analysis; Borenstein, M., Hedges, L.V., Higgins, J.P.T., Rothstein, H.R., Eds.; John Wiley & Sons, Ltd.: Hoboken, NJ, USA, 2009; pp. 107–125. [Google Scholar] [CrossRef]
- Kolenda, R.; Burdukiewicz, M.; Schierack, P. A systematic review and meta-analysis of the epidemiology of pathogenic Escherichia coli of calves and the role of calves as reservoirs for human pathogenic E. coli. Front. Cell. Infect. Microbiol. 2015, 5, 23. [Google Scholar] [CrossRef]
- Hatam-Nahavandi, K.; Ahmadpour, E.; Carmena, D.; Spotin, A.; Bangoura, B.; Xiao, L. Cryptosporidium infections in terrestrial ungulates with focus on livestock: A systematic review and meta-analysis. Parasites Vectors 2019, 12, 1–23. [Google Scholar] [CrossRef]
- Papp, H.; László, B.; Jakab, F.; Ganesh, B.; De Grazia, S.; Matthijnssens, J.; Ciarlet, M.; Martella, V.; Bányai, K. Review of group A rotavirus strains reported in swine and cattle. Vet. Microbiol. 2013, 165, 190–199. [Google Scholar] [CrossRef]
- Kiehl, W. RKI-Fachwörterbuch Infektionsschutz Und Infektionsepidemiologie; Robert-Koch-Institut: Berlin, Germany, 2015. [Google Scholar]
- Sahlström, L.; Virtanen, T.; Kyyrö, J.; Lyytikäinen, T. Biosecurity on Finnish cattle, pig and sheep farms—results from a questionnaire. Prev. Vet. Med. 2014, 117, 59–67. [Google Scholar] [CrossRef]
- Bokusheva, R.; Kimura, S. Cross-country comparison of farm size distribution. OECD Food Agric. Fish. Pap. 2016, 94. [Google Scholar] [CrossRef]
- Frank, N.A.; Kaneene, J.B. Management risk factors associated with calf diarrhea in michigan dairy herds. J. Dairy Sci. 1993, 76, 1313–1323. [Google Scholar] [CrossRef]
- Logan, E.F.; Pearson, G.R.; McNulty, M.S. Studies on the immunity of the calf to colibacillosis--VII: The experimental reproduction of enteric colibacillosis in colostrum-fed calves. Vet. Rec. 1977, 101, 443–446. [Google Scholar] [CrossRef]
- Barry, J.; Bokkers, E.A.M.; Berry, D.P.; de Boer, I.J.M.; McClure, J.; Kennedy, E. Associations between colostrum management, passive immunity, calf-related hygiene practices, and rates of mortality in preweaning dairy calves. J. Dairy Sci. 2019, 102, 10266–10276. [Google Scholar] [CrossRef]
- Kehoe, S.I.; Jayarao, B.M.; Heinrichs, A.J. A survey of bovine colostrum composition and colostrum management practices on Pennsylvania dairy farms. J. Dairy Sci. 2007, 90, 4108–4116. [Google Scholar] [CrossRef] [Green Version]
- Cho, Y.-I.I.; Han, J.-I.I.; Wang, C.; Cooper, V.; Schwartz, K.; Engelken, T.; Yoon, K.-J.J. Case-control study of microbiological etiology associated with calf diarrhea. Vet. Microbiol. 2013, 166, 375–385. [Google Scholar] [CrossRef]
- Meganck, V.; Hoflack, G.; Piepers, S.; Opsomer, G. Evaluation of a protocol to reduce the incidence of neonatal calf diarrhoea on dairy herds. Prev. Vet. Med. 2015, 118, 64–70. [Google Scholar] [CrossRef]
- Trotz-Williams, L.A.; Wayne Martin, S.; Leslie, K.E.; Duffield, T.; Nydam, D.V.; Peregrine, A.S. Calf-level risk factors for neonatal diarrhea and shedding of Cryptosporidium parvum in Ontario dairy calves. Prev. Vet. Med. 2007, 82, 12–28. [Google Scholar] [CrossRef] [PubMed]
- Gulliksen, S.M.; Lie, K.I.; Sølverød, L.; Østerås, O. Risk factors associated with colostrum quality in Norwegian dairy cows. J. Dairy Sci. 2008, 91, 704–712. [Google Scholar] [CrossRef] [PubMed]
- Maddox-Hyttel, C.; Langkjaer, R.B.; Enemark, H.L.; Vigre, H. Cryptosporidium and Giardia in different age groups of Danish cattle and pigs--occurrence and management associated risk factors. Vet. Parasitol. 2006, 141, 48–59. [Google Scholar] [CrossRef] [PubMed]
- Hamnes, I.S.; Gjerde, B.; Robertson, L. Prevalence of Giardia and Cryptosporidium in dairy calves in three areas of Norway. Vet. Parasitol. 2006, 140, 204–216. [Google Scholar] [CrossRef]
- Council Directive 2008/119/EC of 18 December 2008 Laying Down Minimum Standards for the Protection of Calves [2008] OJ L 10. Available online: https://eur-lex.europa.eu/legal-content/EN/TXT/PDF/?uri=CELEX:32008L0119&rid=2 (accessed on 3 April 2021).
- Malmuthuge, N.; Griebel, P.J.; Guan, L.L. The Gut Microbiome and Its Potential Role in the Development and Function of Newborn Calf Gastrointestinal Tract. Front. Vet. Sci. 2015, 2, 36. [Google Scholar] [CrossRef] [Green Version]
- Malmuthuge, N.; Guan, L.L. Understanding the gut microbiome of dairy calves: Opportunities to improve early-life gut health. J. Dairy Sci. 2017, 100, 5996–6005. [Google Scholar] [CrossRef]
- Alipour, M.J.; Jalanka, J.; Pessa-Morikawa, T.; Kokkonen, T.; Satokari, R.; Hynönen, U.; Iivanainen, A.; Niku, M. The composition of the perinatal intestinal microbiota in cattle. Sci. Rep. 2018, 8, 10437. [Google Scholar] [CrossRef]
- Osorio, J.S. Gut health, stress, and immunity in neonatal dairy calves: The host side of host-pathogen interactions. J. Anim. Sci. Biotechnol. 2020, 11, 105. [Google Scholar] [CrossRef]
- Hang, B.P.T.; Wredle, E.; Dicksved, J. Analysis of the developing gut microbiota in young dairy calves-impact of colostrum microbiota and gut disturbances. Trop. Anim. Health Prod. 2020, 53, 50. [Google Scholar] [CrossRef]
- Runnels, P.L.; Moon, H.W.; Schneider, R.A. Development of resistance with host age to adhesion of K99+ Escherichia coli to isolated intestinal epithelial cells. Infect. Immun. 1980, 28, 298–300. [Google Scholar] [CrossRef] [Green Version]
- Izzo, M.M.; Kirkland, P.D.; Mohler, V.L.; Perkins, N.R.; Gunn, A.A.; House, J.K. Prevalence of major enteric pathogens in Australian dairy calves with diarrhoea. Aust. Vet. J. 2011, 89, 167–173. [Google Scholar] [CrossRef]
- Hulbert, L.E.; Moisá, S.J. Stress, immunity, and the management of calves. J. Dairy Sci. 2016, 99, 3199–3216. [Google Scholar] [CrossRef] [Green Version]
- Bulgin, M.S.; Anderson, B.C.; Ward, A.C.S.; Evermann, J.F. Infectious agents associated with neonatal calf disease in southwestern Idaho and eastern Oregon. J. Am. Vet. Med. Assoc. 1982, 180, 1222–1226. [Google Scholar]
- García, A.; Ruiz-Santa-Quiteria, J.A.; Orden, J.A.; Cid, D.; Sanz, R.; Gómez-Bautista, M.; de la Fuente, R. Rotavirus and concurrent infections with other enteropathogens in neonatal diarrheic dairy calves in Spain. Comp. Immunol. Microbiol. Infect. Dis. 2000, 23, 175–183. [Google Scholar] [CrossRef]
- Snodgrass, D.R.R.; Smith, M.L.; Krautil, F.L. Interaction of rotavirus and enterotoxigenic Escherichia coli in conventionally-reared dairy calves. Vet. Microbiol. 1982, 7, 51–60. [Google Scholar] [CrossRef]
- Gouet, P.; Contrepois, M.; Dubourguier, H.C.; Riou, Y.; Scherrer, R.; Laporte, J.; Vautherot, J.F.; Cohen, J.; L’Haridon, R. The experimental production of diarrhoea in colostrum deprived axenic and gnotoxenic calves with enteropathogenic Escherichia coli, rotavirus, coronavirus and in a combined infection of rotavirus and E. coli. Ann. Rech. Vet. 1978, 9, 433–440. [Google Scholar]
- Hess, R.G.; Bachmann, P.A.; Baljer, G.; Mayr, A.; Pospischil, A.; Schmid, G. Synergism in experimental mixed infections of newborn colostrum-deprived calves with bovine rotavirus and enterotoxigenic Escherichia coli (ETEC). Zent. für Veterinärmedizin B 1984, 31, 585–596. [Google Scholar] [CrossRef]
- Runnels, P.L.; Moon, H.W.; Matthews, P.J.; Whipp, S.C.; Woode, G.N. Effects of microbial and host variables on the interaction of rotavirus and Escherichia coli infections in gnotobiotic calves. Am. J. Vet. Res. 1986, 47, 1542–1550. [Google Scholar]
- Tzipori, S.R.; Makin, T.J.; Smith, M.L.; Krautil, F.L.I. Clinical manifestations of diarrhea in calves infected with rotavirus and enterotoxigenic Escherichia coli. J. Clin. Microbiol. 1981, 13, 1011–1016. [Google Scholar] [CrossRef] [Green Version]
- Collins, J.; Starkey, W.G.; Wallis, T.S.; Clarke, G.J.; Worton, K.J.; Spencer, A.J.; Haddon, S.J.; Osborne, M.P.; Candy, D.C.; Stephen, J. Intestinal enzyme profiles in normal and rotavirus-infected mice. J. Pediatr. Gastroenterol. Nutr. 1988, 7, 264–272. [Google Scholar] [CrossRef]
- Jourdan, N.; Brunet, J.P.; Sapin, C.; Blais, A.; Cotte-Laffitte, J.; Forestier, F.; Quero, A.M.; Trugnan, G.; Servin, A.L. Rotavirus infection reduces sucrase-isomaltase expression in human intestinal epithelial cells by perturbing protein targeting and organization of microvillar cytoskeleton. J. Virol. 1998, 72, 7228–7236. [Google Scholar] [CrossRef] [Green Version]
- Morin, M.; Larivière, S.; Lallier, R.; Lariviere, S.; Lallier, R. Pathological and microbiological observations made on spontaneous cases of acute neonatal calf diarrhea. Can. J. Comp. Med. Rev. Can. Med. Comp. 1976, 40, 228–240. [Google Scholar]
- Durham, P.J.K.; Farquharson, B.C.; Stevenson, B.J. Rotavirus and coronavirus associated diarrohoea in calves. N. Z. Vet. J. 1979, 27, 266–272. [Google Scholar] [CrossRef] [Green Version]
- Crawford, S.E.; Ramani, S.; Tate, J.E.; Parashar, U.D.; Svensson, L.; Hagbom, M.; Franco, M.A.; Greenberg, H.B.; O’Ryan, M.; Kang, G.; et al. Rotavirus infection. Nat. Rev. Dis. Prim. 2017, 3, 17083. [Google Scholar] [CrossRef] [Green Version]
- Brunet, J.P.; Jourdan, N.; Cotte-Laffitte, J.; Linxe, C.; Géniteau-Legendre, M.; Servin, A.; Quéro, A.M. Rotavirus infection induces cytoskeleton disorganization in human intestinal epithelial cells: Implication of an increase in intracellular calcium concentration. J. Virol. 2000, 74, 10801–10806. [Google Scholar] [CrossRef] [Green Version]
- Brunet, J.P.; Cotte-Laffitte, J.; Linxe, C.; Quero, A.M.; Géniteau-Legendre, M.; Servin, A. Rotavirus infection induces an increase in intracellular calcium concentration in human intestinal epithelial cells: Role in microvillar actin alteration. J. Virol. 2000, 74, 2323–2332. [Google Scholar] [CrossRef] [Green Version]
- Chen, X.M.; LaRusso, N.F. Mechanisms of attachment and internalization of Cryptosporidium parvum to biliary and intestinal epithelial cells. Gastroenterology 2000, 118, 368–379. [Google Scholar] [CrossRef]
- Tzipori, S.; Sherwood, D.; Angus, K.W.; Campbell, I.; Gordon, M. Diarrhea in lambs: Experimental infections with enterotoxigenic Escherichia coli, rotavirus, and Cryptosporidium sp. Infect. Immun. 1981, 33, 401–406. [Google Scholar] [CrossRef] [Green Version]
- Gurevitch, J.; Koricheva, J.; Nakagawa, S.; Stewart, G. Meta-analysis and the science of research synthesis. Nature 2018, 555, 175–182. [Google Scholar] [CrossRef]
- Berge, A.C.B.B.; Besser, T.E.; Moore, D.A.; Sischo, W.M. Evaluation of the effects of oral colostrum supplementation during the first fourteen days on the health and performance of preweaned calves. J. Dairy Sci. 2009, 92, 286–295. [Google Scholar] [CrossRef] [Green Version]
- Gutzwiller, A. Effect of colostrum intake on diarrhoea incidence in new-born calves. Schweiz. Arch. Tierheilkd. 2002, 144, 59–64. [Google Scholar] [CrossRef] [PubMed]
- Trotz-Williams, L.A.; Martin, S.W.; Leslie, K.E.; Duffield, T.; Nydam, D.V.; Peregrine, A.S. Association between management practices and within-herd prevalence of Cryptosporidium parvum shedding on dairy farms in southern Ontario. Prev. Vet. Med. 2008, 83, 11–23. [Google Scholar] [CrossRef] [PubMed]
- Anderson, E.J.; Weber, S.G. Rotavirus infection in adults. Lancet. Infect. Dis. 2004, 4, 91–99. [Google Scholar] [CrossRef]
- Checkley, W.; White, A.C.J.; Jaganath, D.; Arrowood, M.J.; Chalmers, R.M.; Chen, X.-M.; Fayer, R.; Griffiths, J.K.; Guerrant, R.L.; Hedstrom, L.; et al. A review of the global burden, novel diagnostics, therapeutics, and vaccine targets for cryptosporidium. Lancet. Infect. Dis. 2015, 15, 85–94. [Google Scholar] [CrossRef] [Green Version]


| Category | Systematic Review | (Subgroup) Meta-Analysis and Uni-vs. Multivariate Regression Analysis |
|---|---|---|
| Geographical region | Countries described the area where calves were tested. | Individual countries were assigned in respective regions (Europe, Australia, West Asia, East Asia, South Asia, North America, South America and Africa). The regions were included 1. |
| Sampling period | The date of sampling was defined as period begin and end of sampling. If the date of sampling was not mentioned, it was assigned to the category “not specified” and the submission date or publication date was used. | The sampling period were summarised in five time periods (1978–1980, 1981–1990, 1991–2000, 2001–2010, 2011–2019) and were included. The publication year and sampling period deviate from each other on average by three years. The period was included. |
| Number of herds | Only studies with greater or equal two herds were considered. The number of herds was recorded. If the number of herds was not mentioned, but it was described that several herds were sampled, it was assigned to the category “not specified”. | The number of herds was included in the meta-regression analysis. |
| Herd type | Herd types were categorised into dairy, beef and mixed (i.e., mixed covered more than one herd type). If the herd type was not mentioned, it was assigned to the category “not specified”. | The herd types (i.e., dairy, beef, mixed, not specified) were included. |
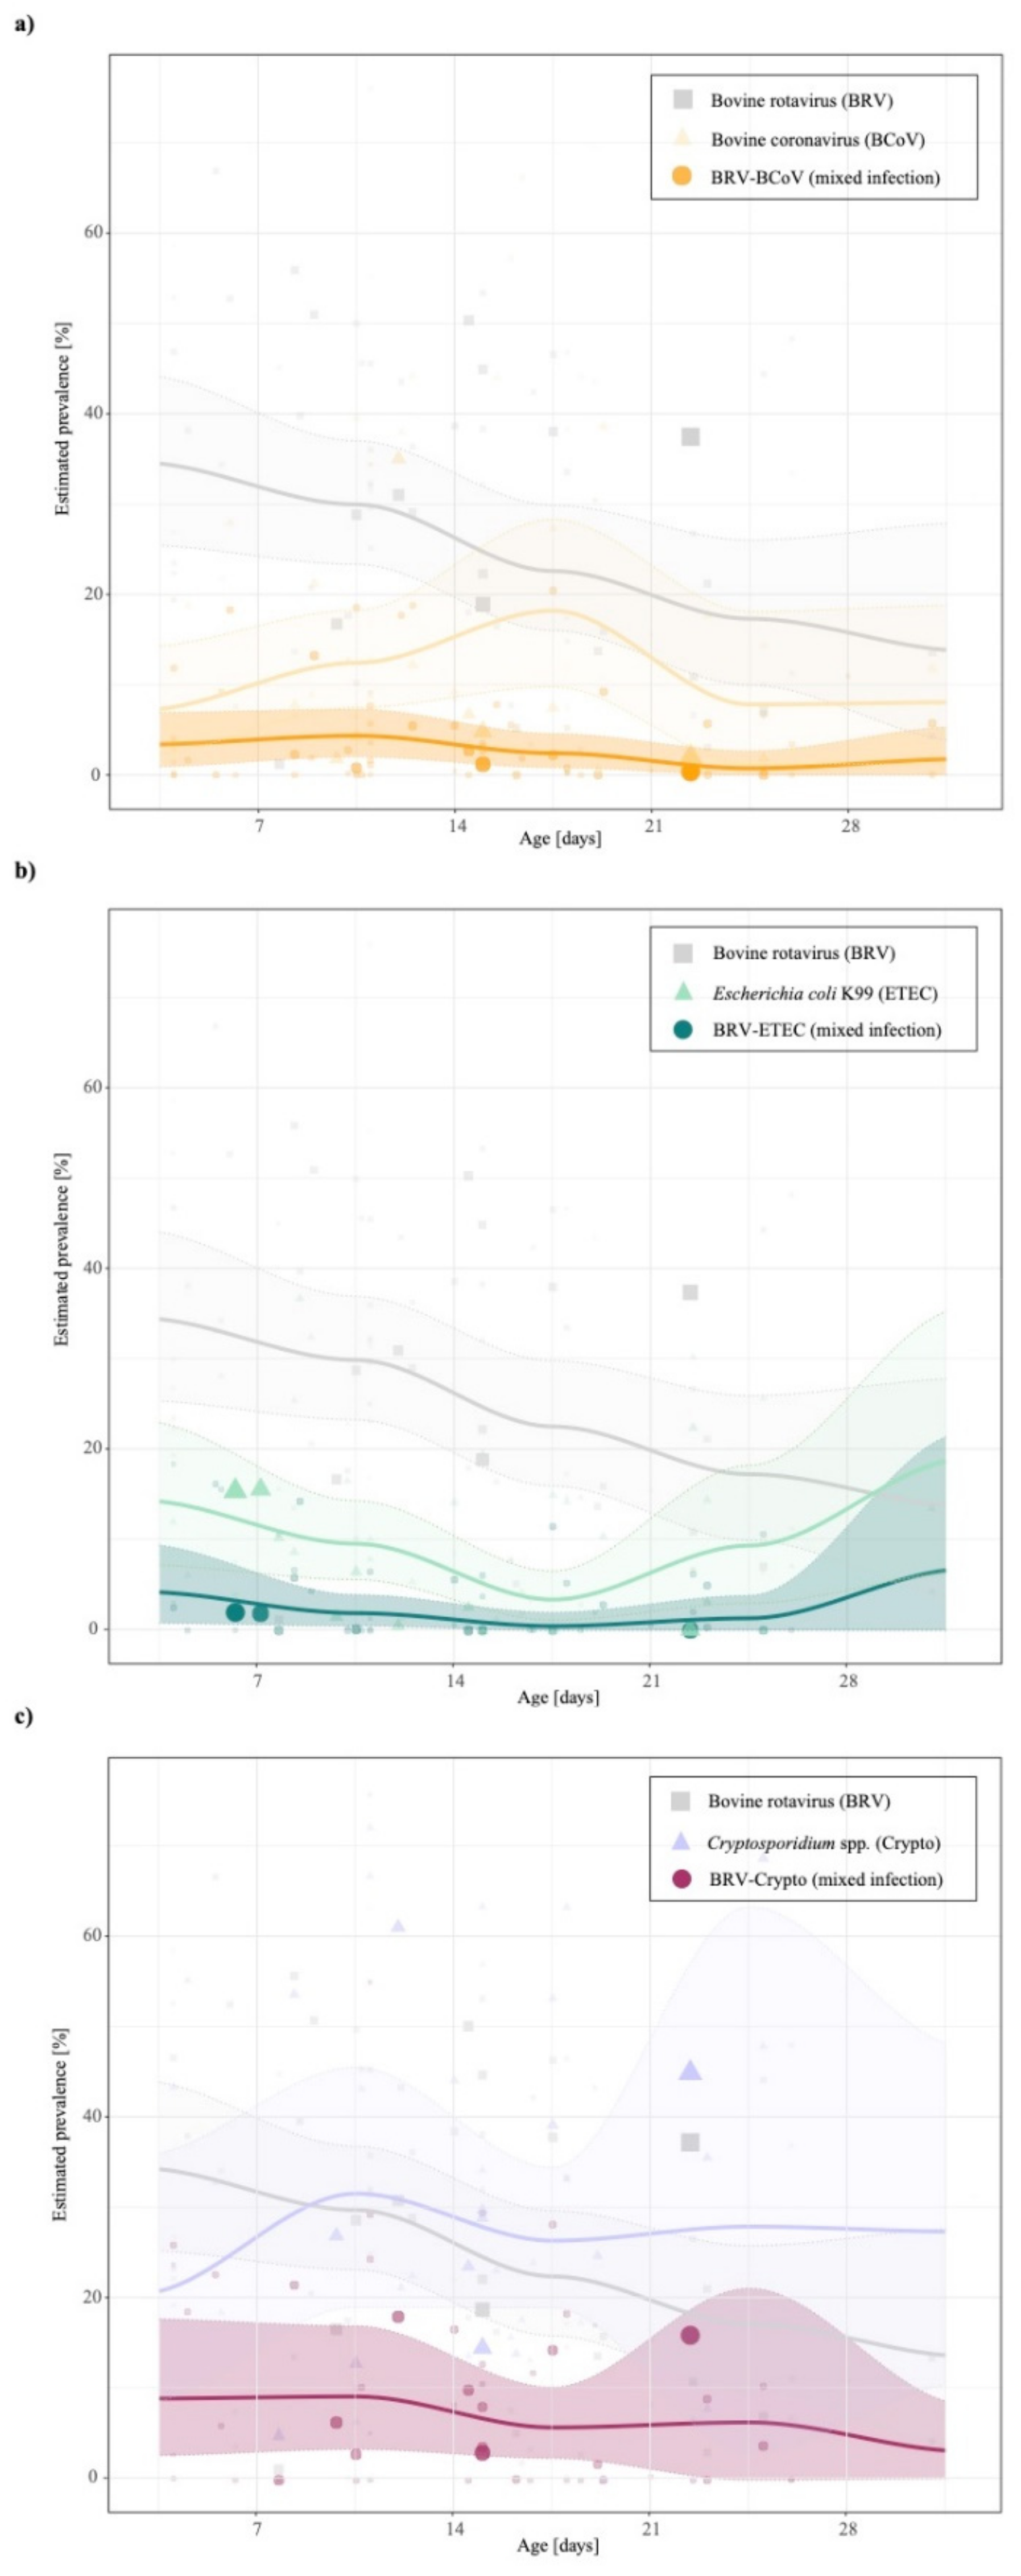
| Age (days) | Only calves under 60 days of age were considered. If the age was not mentioned but the animals were classified as “calves”, “neonatal” or “pre-weaned calves” the calves were assigned to the category “not specified”. | Age and age groups were very inconsistent across the different studies. In cases with published age median or mean we used that value, otherwise we calculated the center of the published age range. These centered data were clustered in 7-day periods. The seven-age class were included and ranged from 0–7 to 42–49 days. |
| Health status | Health status were categorised into diarrhoea, normal, mixed (i.e., mixed include both diarrhoea and normal). If the health status was not mentioned, it was assigned to the category “not specified”. | The health status (i.e., diarrhoea, normal, mixed, not specified) were included. |
| Samples size | Number of tested samples i.e., one sample per animal was included. | The number of tested samples were included in the subgroup meta-analysis and the meta-regression analysis. |
| Sample type | Sample types were categorised into autopsy, fecal and both (i.e., both covered more than one sample type). | The three sample types (i.e., autopsy, fecal, both) were included. |
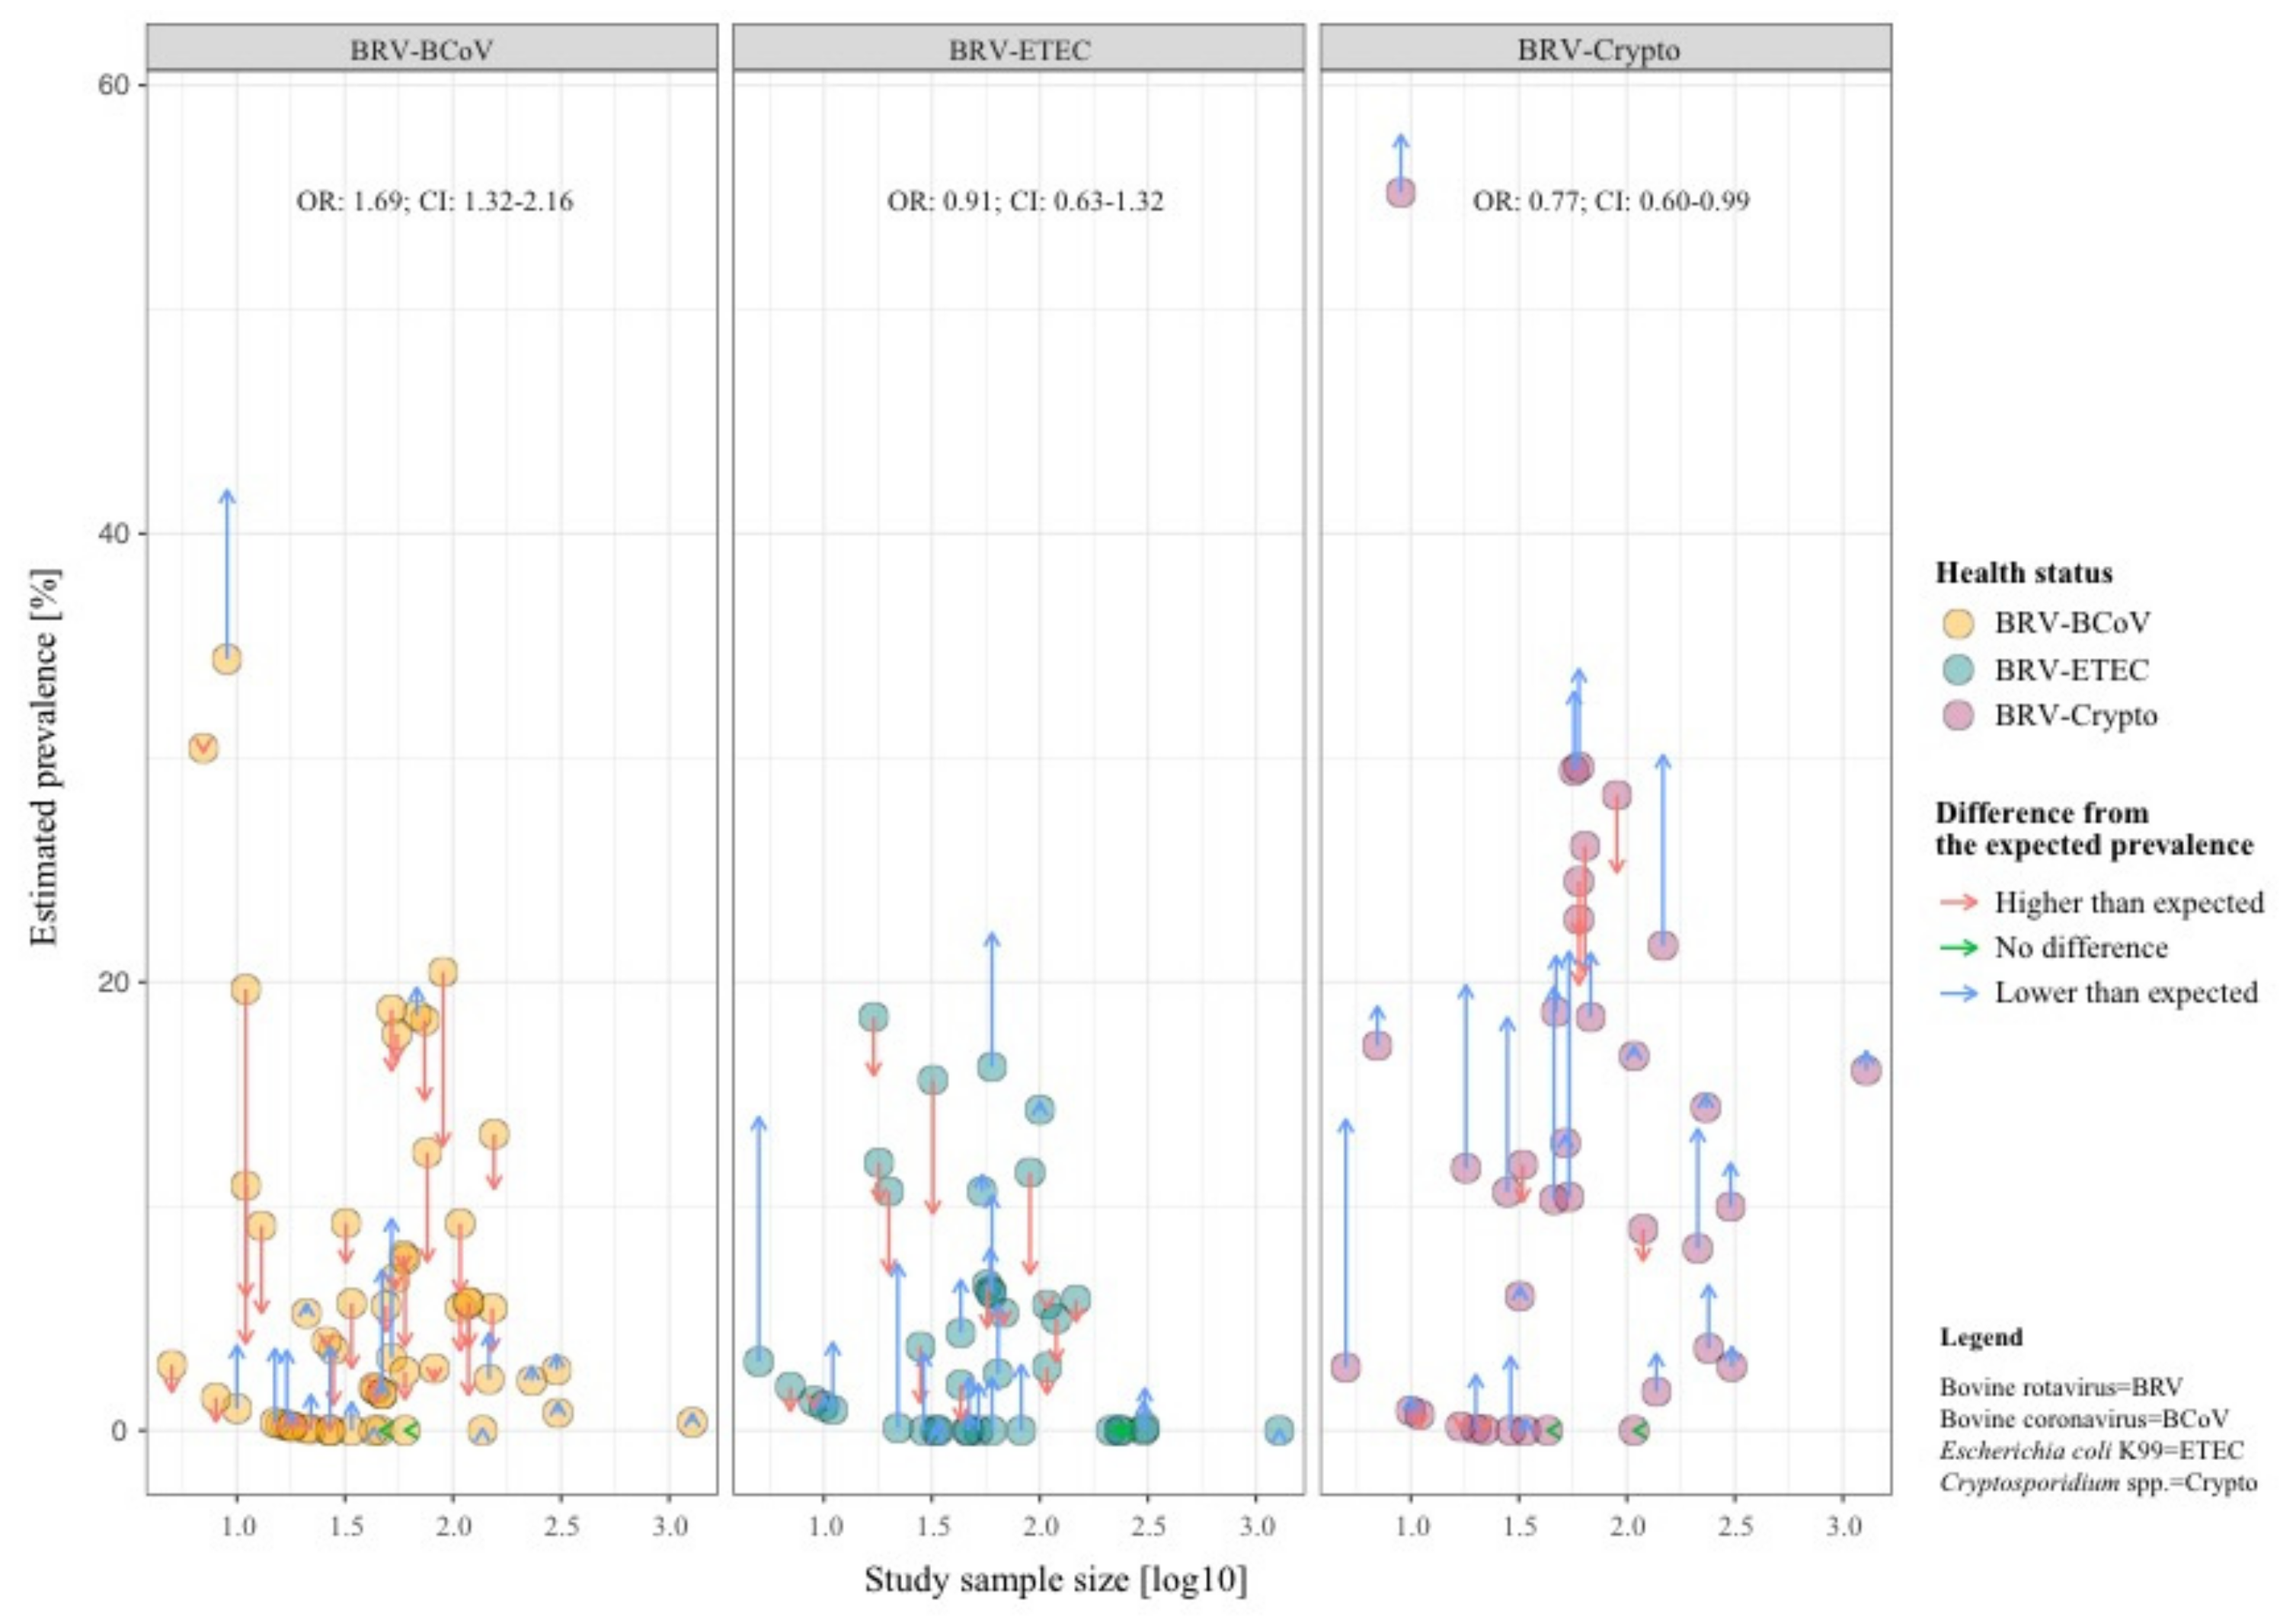
| Prevalence of single and concurrent infections | All combinations of bovine rotavirus, bovine coronavirus, Escherichia coli K99 and Cryptosporidium spp. were considered as concurrent infections. Prevalence data, i.e., percentage and/or total number of tested and positively tested samples were recorded (including individual for bovine rotavirus, bovine coronavirus, Escherichia coli K99 and Cryptosporidium spp.) If only percentage data were available, then the number of positive samples was extrapolated. | Only combinations of bovine rotavirus with other pathogens were included. Cumulative and absolute numbers of BRV-BCoV, BRV-ETEC and BRV-Crypto were included (i.e., including triple and quadruple infections). If a combination of these pathogens was not present it was considered as zero prevalence to avoid publication bias. The latter would have happened if only positive combinations were considered. |
| Genotype | Information of Cryptosporidium spp. was collected. | The genotypes were not incorporated in the meta-analysis due to insufficient number of studies and data. |
| Vaccination status | The vaccination status of the dam was collected with “Yes” or “No”. If only a part of the tested herds were vaccinated, then it was assigned to the category “partly vaccinated”. If the vaccination status was not mentioned, it was assigned to the category “not specified”. | The vaccination status was not incorporated in the meta-analysis due to insufficient data. More than 75% of the studies not specified the vaccination status of the dam. |
| Colostrum | Assurance of colostrum intake was assigned to the category “Yes” or “No”. If failure of passive transfer of maternal antibodies was diagnosed it was categorised as “deficient”. If the assurance of colostrum intake was not mentioned, it was assigned to the category “not specified”. | The assurance of colostrum intake was not incorporated in the meta-analysis due to insufficient data. More than 90% of the studies did not report data of the colostrum intake (i.e., Ig/L or TP/L). |
| Diagnostic method | Types of diagnostic methods (e.g., PCRa, ELISAb, acid-fast staining) used were collected and wherever available the corresponding sensitivity and specificity were recorded. If the diagnostic method was not mentioned, it was assigned to the category “not specified”. | The different applied diagnostic methods were classified per pathogen as follows: -Diagnostic method (BRV) covered PCR a, ELISA b, RA c and EM d as single detection method; “Several” covered combinations of diagnostic methods for screening and confirmation of laboratory results (parallel interpretation of tests) as follows: EM d, ELISA b, IF h, LA o, PAGE f, RA b, FAT i, PCR a; “other im” covered other antibody-based methods besides ELISA b and RA c (i.e., IHC j, FAT i). -Diagnostic method (BCoV) covered PCR a, ELISA b, RA c and EM d as single detection method; “Several” covered combinations of diagnostic methods for screening and confirmation of laboratory results (parallel interpretation of tests) as follows: ELISA b, FAT i, IF h, EM d, SPIEM e, HEHA k, HE l, PCR a); “other im” covered other antibody-based methods besides ELISA b and RA c (i.e., IF h, IHC j, HEHA k, HAI m). -Diagnostic method (ETEC) covered agglutination (i.e., bacterial culture followed by SA n or LA o), ELISA b and RA c as single detection method; “Several” covered combinations of diagnostic methods for screening and confirmation of laboratory results (parallel interpretation of tests) as follows: ELISA b, IF h, IHC j, RA c, Agglutination, PCR a. -Diagnostic method (Crypto) covered MS g, ELISA b and RA c as single detection method; “Several” covered combinations of diagnostic methods for screening and confirmation of laboratory results (parallel interpretation of tests) as follows: MS g, ELISA b, RA c, IF h, PCR a. The diagnostic methods were included. The prevalence was not corrected to the test sensitivity and specificity due to insufficient data. More than 75% of the studies not provided the information. |
| Study type | The studies were categorised into three levels. (1) Case-control study: studies tested diarrheic and normal calves and/or sampling were performed in several regions of a country; (2) Case study: studies tested only cases with diarrhoea and/or testing were performed in several regions of a country; (3) Other studies: studies focusing on diagnostic of pathogens. | The three study types were included. |
| BRV-BCoV | |||||||
|---|---|---|---|---|---|---|---|
| Sample Size (No. Animals) | No. Studies | No. Prevalence Inputs | Weighted Mean Estimate (%) | Confidence Interval (95%) | Qep a | I2 (%) b | |
| Overall | 6974 | 31 | 76 | 2.84 | (1.78–4.08) | <0.01 | 77.97 |
| Geographical region | |||||||
| Europe | 3841 | 15 | 30 | 4.72 | (2.49–7.45) | <0.01 | 87.61 |
| North America | 487 | 5 | 10 | 2.63 | (0.19–6.79) | <0.01 | 71.28 |
| South America | - | - | - | - | - | - | - |
| East Asia | 251 | 1 | 2 | 0.00 | (0.00–0.07) | 0.95 | 0.00 |
| West Asia | 366 | 3 | 8 | 2.35 | (0.50–5.09) | 0.18 | 27.92 |
| South Asia | 393 | 3 | 17 | 1.19 | (0.13–2.90) | 0.68 | 0.00 |
| Oceania | 1226 | 1 | 2 | 1.22 | (0.51–2.15) | 0.91 | 0.00 |
| Africa | 410 | 3 | 7 | 2.72 | (0.21–6.97) | <0.01 | 62.42 |
| Period | |||||||
| 1978–1980 | 59 | 1 | 2 | 3.16 | (0.00–17.62) | 0.07 | 69.83 |
| 1981–1990 | 1437 | 7 | 19 | 5.48 | (2.32–9.58) | <0.01 | 82.59 |
| 1991–2000 | 1177 | 7 | 17 | 4.64 | (2.35–7.48) | <0.01 | 68.22 |
| 2001–2010 | 1197 | 9 | 22 | 0.86 | (0.02–2.48) | <0.01 | 61.55 |
| 2011–2019 | 3104 | 7 | 16 | 1.54 | (0.49–2.98) | 0.01 | 61.18 |
| Herd type | |||||||
| Dairy | 3057 | 16 | 37 | 3.44 | (1.91–5.28) | <0.01 | 72.78 |
| Beef | 91 | 1 | 3 | 0.62 | (0.00–4.27) | 0.72 | 0.00 |
| Mixed | 832 | 4 | 8 | 0.78 | (0.00–2.57) | 0.10 | 45.81 |
| Not specified | 2994 | 10 | 28 | 3.17 | (1.21–5.75) | <0.01 | 84.18 |
| Age class (in days) | |||||||
| 0–7 | 926 | 11 | 14 | 3.39 | (0.91–6.92) | <0.01 | 70.06 |
| 7–14 | 1615 | 16 | 23 | 4.35 | (2.02–7.30) | <0.01 | 78.18 |
| 14–21 | 2314 | 16 | 22 | 2.43 | (0.82–4.60) | <0.01 | 77.19 |
| 21–28 | 1901 | 9 | 11 | 0.74 | (0.00–2.68) | <0.01 | 68.42 |
| 28–35 | 207 | 4 | 5 | 1.75 | (<0.01–5.34) | 0.19 | 20.13 |
| 35–42 | - | - | - | - | - | - | - |
| 42–49 | 11 | 1 | 1 | 19.68 | (1.90–47.48) | 1.00 | 0.00 |
| Health status | |||||||
| Diarrhoea | 4975 | 29 | 59 | 4.22 | (2.83–5.82) | <0.01 | 75.29 |
| Normal | 577 | 11 | 14 | 0.00 | (0.00–0.25) | 0.99 | 0.00 |
| Mixed | 196 | 1 | 1 | 0.00 | (0.00–0.06) | 1.00 | 0.00 |
| Not specified | 1226 | 1 | 2 | 1.22 | (0.51–2.15) | 0.91 | 0.00 |
| Sample type | |||||||
| Fecal | 6437 | 1 | 67 | 2.18 | (1.27–3.26) | <0.01 | 73.20 |
| Autopsy | 457 | 28 | 4 | 11.57 | (6.68–17.42) | 0.03 | 64.00 |
| Both | 80 | 2 | 5 | 10.55 | (0.82–27.00) | 0.02 | 66.04 |
| Diagnostic method (BRV) | |||||||
| ELISA | 1183 | 9 | 25 | 1.62 | (0.35–3.48) | <0.01 | 59.40 |
| RA c | 1576 | 4 | 8 | 1.80 | (0.23–4.28) | 0.03 | 48.79 |
| Several | 3684 | 15 | 33 | 3.31 | (1.84–5.09) | <0.01 | 76.75 |
| EM d | 259 | 1 | 5 | 9.50 | (3.80–17.02) | 0.02 | 66.17 |
| Other im e | 21 | 1 | 3 | 22.50 | (5.00–46.74) | 0.25 | 29.86 |
| PCR | 251 | 1 | 2 | 0.00 | (0.00–0.07) | 0.95 | 0 |
| Diagnostic method (BCoV) | |||||||
| ELISA | 2735 | 12 | 32 | 1.95 | (0.77–3.49) | <0.01 | 67.89 |
| RA | 1576 | 4 | 8 | 1.80 | (0.23–4.28) | 0.03 | 48.79 |
| Several | 1424 | 8 | 13 | 1.46 | (0.42–2.92) | 0.07 | 48.03 |
| EM | 418 | 3 | 9 | 7.05 | (2.52–13.16) | <0.01 | 73.18 |
| Other im | 570 | 3 | 12 | 9.85 | (5.68–14.84) | 0.04 | 52.84 |
| PCR | 251 | 1 | 2 | 0.00 | (0.00–0.07) | 0.95 | 0 |
| Study type | |||||||
| Case-control | 3486 | 13 | 34 | 0.67 | (0.16–1.40) | <0.01 | 46.56 |
| Case | 3368 | 16 | 40 | 5.48 | (3.55–7.71) | <0.01 | 74.36 |
| Other | 120 | 2 | 2 | 9.84 | (0.06–28.94) | 0.01 | 85.43 |
| BRV-ETEC | |||||||
|---|---|---|---|---|---|---|---|
| Sample Size (No. Animals) | No. Studies | No. Prevalence Inputs | Weighted Mean Estimate (%) | Confidence Interval (95%) | Qep a | I2 (%) b | |
| Overall | 8897 | 30 | 55 | 1.64 | (0.76–2.75) | <0.01 | 83.88 |
| Geographical region | |||||||
| Europe | 6692 | 17 | 27 | 0.97 | (0.17–2.20) | <0.01 | 85.09 |
| North America | 326 | 4 | 8 | 3.62 | (0.50–8.57) | <0.01 | 64.32 |
| South America | 663 | 2 | 4 | 0.15 | (0.00–3.32) | <0.01 | 86.51 |
| East Asia | - | - | - | - | - | - | - |
| West Asia | 366 | 3 | 8 | 3.70 | (0.32–9.39) | <0.01 | 74.42 |
| South Asia | 93 | 1 | 4 | 3.40 | (0.00–11.80) | 0.14 | 49.67 |
| Oceania | 429 | 1 | 1 | 1.20 | (0.17–2.82) | 1.00 | 0.00 |
| Africa | 328 | 2 | 3 | 2.43 | (0.30–5.85) | 0.14 | 49.22 |
| Period | |||||||
| 1978–1980 | 159 | 2 | 3 | 8.36 | (0.21–23.56) | 0.01 | 81.53 |
| 1981–1990 | 4955 | 9 | 17 | 0.54 | (0.00–1.74) | <0.01 | 82.68 |
| 1991–2000 | 820 | 6 | 12 | 1.22 | (0.11–3.08) | <0.01 | 50.89 |
| 2001–2010 | 738 | 7 | 12 | 1.57 | (0.04–4.37) | <0.01 | 68.10 |
| 2011–2019 | 2225 | 6 | 11 | 3.08 | (0.62–6.76) | <0.01 | 87.15 |
| Herd type | |||||||
| Dairy | 2556 | 16 | 27 | 1.90 | (0.76–3.39) | <0.01 | 70.01 |
| Beef | 304 | 2 | 4 | 0.00 | (0.00–0.12) | 0.82 | 0.00 |
| Mixed | 895 | 5 | 10 | 0.11 | (0.00–1.54) | 0.02 | 61.71 |
| Not specified | 5142 | 8 | 14 | 3.75 | (1.18–7.30) | <0.01 | 93.38 |
| Age class (in days) | |||||||
| 0–7 | 2495 | 8 | 9 | 4.24 | (0.81–9.45) | <0.01 | 89.03 |
| 7–14 | 2769 | 13 | 18 | 1.92 | (0.49–3.96) | <0.01 | 78.32 |
| 14–21 | 1559 | 12 | 16 | 0.48 | (0.00–2.00) | <0.01 | 73.83 |
| 21–28 | 2035 | 7 | 9 | 1.36 | (0.02–3.87) | <0.01 | 81.80 |
| 28–35 | 28 | 2 | 2 | 6.67 | (0.00–21.5) | 0.26 | 20.31 |
| 35–42 | - | - | - | - | - | - | |
| 42–49 | 11 | 1 | 1 | 0.91 | (0.00–16.82) | 1.00 | 0.00 |
| Health status | |||||||
| Diarrhoea | 7509 | 28 | 42 | 2.26 | (1.04–3.79) | <0.01 | 87.27 |
| Normal | 763 | 1 | 11 | 0.13 | (0.00–0.80) | 0.66 | 0.00 |
| Mixed | 196 | 1 | 1 | 0.00 | (0.00–1.18) | 1.00 | 0.00 |
| Not specified | 429 | 1 | 1 | 1.20 | (0.17–2.82) | 1.00 | 0.00 |
| Sample type | |||||||
| Fecal | 5624 | 26 | 48 | 1.54 | (0.62–2.72) | <0.01 | 80.75 |
| Autopsy | - | - | - | - | - | - | - |
| Both | 3273 | 4 | 7 | 2.52 | (0.62–5.28) | 0.22 | 74.52 |
| Diagnostic method (BRV) | |||||||
| ELISA | 1272 | 9 | 16 | 3.01 | (0.95–5.85) | <0.01 | 75.94 |
| RA c | 1576 | 4 | 8 | 3.90 | (0.43–9.57) | <0.01 | 83.39 |
| Several | 2835 | 14 | 26 | 0.59 | (0.02–1.66) | <0.01 | 71.85 |
| Other im d | 21 | 1 | 3 | 1.92 | (0.00–13.11) | 0.98 | 0.00 |
| Not specified | 3193 | 2 | 2 | 1.95 | (1.39–2.58) | 0.84 | 0.00 |
| Diagnostic method (ETEC) | |||||||
| ELISA | 183 | 2 | 5 | 5.36 | (0.60–13.18) | 0.04 | 59.51 |
| RA | 1576 | 4 | 8 | 3.90 | (0.43–9.57) | <0.01 | 83.39 |
| Several | 1426 | 10 | 18 | 1.58 | (0.34–3.40) | <0.01 | 61.00 |
| Agglutination e | 5712 | 14 | 24 | 0.85 | (0.09–2.09) | <0.01 | 85.43 |
| Study type | |||||||
| Case-control | 2622 | 13 | 27 | 1.66 | (0.45–3.35) | <0.01 | 78.15 |
| Case | 6223 | 16 | 27 | 1.77 | (0.56–3.44) | <0.01 | 86.91 |
| Other | 52 | 1 | 1 | 0.00 | (0.00–2.82) | 1.00 | 0.00 |
| BRV-Crypto | |||||||
|---|---|---|---|---|---|---|---|
| Sample Size (No. Animals) | No. Studies | No. Prevalence Inputs | Weighted Mean Estimate (%) | Confidence Interval (95%) | Qep a | I2 (%) b | |
| Overall | 7191 | 28 | 56 | 6.69 | (4.27–9.51) | <0.01 | 92.55 |
| Geographical region | |||||||
| Europe | 4235 | 16 | 26 | 8.90 | (4.98–13.65) | <0.01 | 94.03 |
| North America | 240 | 3 | 6 | 6.59 | (0.21–18.16) | <0.01 | 83.92 |
| South America | 452 | 1 | 2 | 5.68 | (1.99–10.67) | 0.07 | 69.09 |
| East Asia | 251 | 1 | 2 | 0.79 | (0.00–3.08) | 0.28 | 15.43 |
| West Asia | 266 | 2 | 6 | 16.61 | (8.03–27.19) | 0.01 | 73.82 |
| South Asia | 193 | 2 | 9 | 1.98 | (0.00–6.76) | 0.03 | 48.39 |
| Oceania | 1226 | 1 | 2 | 2.27 | (0.91–4.05) | 0.14 | 52.98 |
| Africa | 328 | 2 | 3 | 0.62 | (0.00–8.81) | <0.01 | 91.29 |
| Period | |||||||
| 1978–1980 | 59 | 1 | 2 | 2.04 | (0.00–11.65) | 0.16 | 49.67 |
| 1981–1990 | 1465 | 5 | 11 | 3.92 | (0.10–10.93) | <0.01 | 94.44 |
| 1991–2000 | 820 | 6 | 12 | 8.46 | (2.66–16.47) | <0.01 | 89.89 |
| 2001–2010 | 1313 | 8 | 13 | 5.62 | (1.79–10.88) | <0.01 | 88.07 |
| 2011–2019 | 3534 | 8 | 18 | 9.07 | (4.72–14.44) | <0.01 | 93.35 |
| Herd type | |||||||
| Dairy | 3892 | 16 | 29 | 6.13 | (2.90–10.19) | <0.01 | 93.46 |
| Beef | 304 | 2 | 4 | 5.64 | (0.03–16.64) | 0.01 | 80.25 |
| Mixed | 895 | 5 | 10 | 3.23 | (0.61–7.17) | <0.01 | 75.81 |
| Not specified | 2100 | 6 | 13 | 12.37 | (6.04–20.24) | <0.01 | 91.71 |
| Age class (in days) | |||||||
| 0–7 | 690 | 8 | 9 | 9.04 | (2.72–17.87) | <0.01 | 83.75 |
| 7–14 | 1943 | 12 | 15 | 9.27 | (3.42–17.10) | <0.01 | 94.83 |
| 14–21 | 2637 | 15 | 20 | 5.84 | (2.41–10.29) | <0.01 | 92.00 |
| 21–28 | 1843 | 7 | 8 | 3.28 | (0.16–8.74) | <0.01 | 90.48 |
| 28–35 | 28 | 2 | 2 | 6.41 | (0.00–21.29) | 0.26 | 20.31 |
| 35–42 | - | - | - | - | - | - | - |
| 42–49 | 50 | 2 | 2 | 7.80 | (0.00–27.97) | 0.11 | 60.99 |
| Health status | |||||||
| Diarrhoea | 4269 | 24 | 42 | 9.43 | (6.28–13.06) | <0.01 | 89.62 |
| Normal | 664 | 9 | 9 | 0.00 | (0.00–0.03) | 0.60 | 0.00 |
| Mixed | 1032 | 3 | 3 | 8.78 | (2.19–18.29) | <0.01 | 94.30 |
| Not specified | 1226 | 1 | 2 | 2.27 | (0.91–4.05) | 0.14 | 52.98 |
| Sample type | |||||||
| Fecal | 7111 | 26 | 51 | 6.50 | (4.09–9.32) | <0.01 | 92.72 |
| Autopsy | - | - | - | - | - | - | - |
| Both | 80 | 2 | 5 | 10.96 | (0.04–32.23) | <0.01 | 77.94 |
| Diagnostic method (BRV) | |||||||
| ELISA | 1086 | 7 | 16 | 2.21 | (0.06–6.16) | <0.01 | 84.92 |
| RA c | 2412 | 6 | 10 | 14.94 | (9.76–20.89) | <0.01 | 87.27 |
| Several | 3421 | 13 | 25 | 7.01 | (3.81–10.90) | <0.01 | 91.33 |
| Other im d | 21 | 1 | 3 | 23.33 | (0.97–59.14) | 0.05 | 65.92 |
| PCR | 251 | 1 | 2 | 0.79 | (0.00–3.08) | 0.28 | 15.43 |
| Diagnostic method (Crypto) | |||||||
| ELISA | 93 | 1 | 4 | <0.01 | (0.00–2.39) | 0.97 | 0.00 |
| RA | 1794 | 4 | 4 | 13.49 | (6.80–21.74) | <0.01 | 89.72 |
| Several | 2957 | 11 | 24 | 12.21 | (7.27–15.75) | <0.01 | 89.01 |
| MS e | 2347 | 12 | 24 | 3.44 | (0.85–7.16) | <0.01 | 91.00 |
| Study type | |||||||
| Case-control | 4109 | 13 | 26 | 4.27 | (1.89–7.30) | <0.01 | 91.55 |
| Case | 3030 | 14 | 29 | 9.29 | (5.13–14.34) | <0.01 | 91.39 |
| Other | 52 | 1 | 1 | 12.82 | (4.59–23.81) | 1.00 | 0.00 |
| Univariate (BRV-BCoV) | Univariate (BRV-ETEC) | Univariate (BRV-Crypto) | |||||||
|---|---|---|---|---|---|---|---|---|---|
| Factors | R2 | p | Factors | R2 | p | Factors | R2 | p | |
| Region | 7.68 | 0.12 * | Region | 0.14 | 0.42 | Region | 12.01 | 0.07 * | |
| Period | 13.78 | 0.02 * | Period | 11.42 | 0.07 ** | Period | 0.00 | 0.53 | |
| Number of herds | 0.00 | 0.81 | Number of herds | 10.65 | 0.03 ** | Number of herds | 0.00 | 0.57 | |
| Herd type | 1.11 | 0.29 | Herd type | 15.60 | 0.02 ** | Herd type | 4.32 | 0.17 * | |
| Age class | 4.86 | 0.17 * | Age class | 2.13 | 0.34 | Age class | 0.00 | 0.54 | |
| Health status | 30.25 | 0.00 ** | Health status | 2.28 | 0.27 | Health status | 27.32 | <0.01 ** | |
| Sample size | 0.00 | 0.30 | Sample size | 0.71 | 0.26 | Sample size | 0.00 | 0.69 | |
| Sample type | 20.66 | <0.01 * | Sample type | 0.00 | 0.48 | Sample type | 0.00 | 0.56 | |
| Diagnostic BRV | 27.22 | <0.01 ** | Diagnostic BRV | 5.25 | 0.20 * | Diagnostic BRV | 22.81 | <0.01 * | |
| Diagnostic BCoV | 38.20 | 0.00 ** | Diagnostic ETEC | 6.32 | 0.14 * | Diagnostic Crypto | 22.51 | <0.01 ** | |
| Study type | 39.31 | 0.00 ** | Study type | 0.00 | 0.67 | Study type | 4.51 | 0.13 * | |
| Multivariate (BRV-BCoV) | Multivariate (BRV-ETEC) | Multivariate (BRV-Crypto) | |||||||
| Number of factors | R2 | AICc/p Value LRT | Number of factors | R2 | AICc/p Value LRT | Number of factors | R2 | AICc/p Value LRT | |
| Full Model (n = 8; p < 0.25 *) | 61.23 | −63.27/- | Full Model (n = 5; p < 0.25 *) | 47.83 | −60.11/- | Full Model (n = 6; p < 0.25 *) | 46.20 | −4.57/- | |
| Reduced Model (n=4 **) | 59.75 | −114.01/0.07 | Reduced Model (n = 3 **) | 37.82 | −71.64/0.03 | Reduced Model (n = 2 **) | 49.54 | −48.71/0.05 | |
Publisher’s Note: MDPI stays neutral with regard to jurisdictional claims in published maps and institutional affiliations. |
© 2021 by the authors. Licensee MDPI, Basel, Switzerland. This article is an open access article distributed under the terms and conditions of the Creative Commons Attribution (CC BY) license (https://creativecommons.org/licenses/by/4.0/).
Share and Cite
Brunauer, M.; Roch, F.-F.; Conrady, B. Prevalence of Worldwide Neonatal Calf Diarrhoea Caused by Bovine Rotavirus in Combination with Bovine Coronavirus, Escherichia coli K99 and Cryptosporidium spp.: A Meta-Analysis. Animals 2021, 11, 1014. https://doi.org/10.3390/ani11041014
Brunauer M, Roch F-F, Conrady B. Prevalence of Worldwide Neonatal Calf Diarrhoea Caused by Bovine Rotavirus in Combination with Bovine Coronavirus, Escherichia coli K99 and Cryptosporidium spp.: A Meta-Analysis. Animals. 2021; 11(4):1014. https://doi.org/10.3390/ani11041014
Chicago/Turabian StyleBrunauer, Michael, Franz-Ferdinand Roch, and Beate Conrady. 2021. "Prevalence of Worldwide Neonatal Calf Diarrhoea Caused by Bovine Rotavirus in Combination with Bovine Coronavirus, Escherichia coli K99 and Cryptosporidium spp.: A Meta-Analysis" Animals 11, no. 4: 1014. https://doi.org/10.3390/ani11041014