
Dietary Probiotic Pediococcus acidilactici MA18/5M Improves the Growth, Feed Performance and Antioxidant Status of Penaeid Shrimp Litopenaeus stylirostris: A Growth-Ration-Size Approach

Abstract
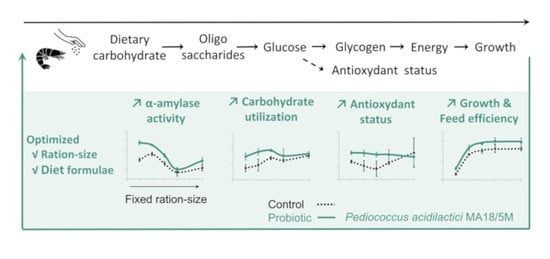
:Simple Summary
Abstract
1. Introduction
2. Materials and Methods
2.1. Experimental Diets and Dietary Probiotic
2.2. Animals, Tagging and System
2.3. Experimental Design, Feeding and Sampling
2.4. Analytical Protocols
2.4.1. Samples Preparation
2.4.2. Biochemical Analysis
2.5. Calculations: Growth and Nutritional Parameters
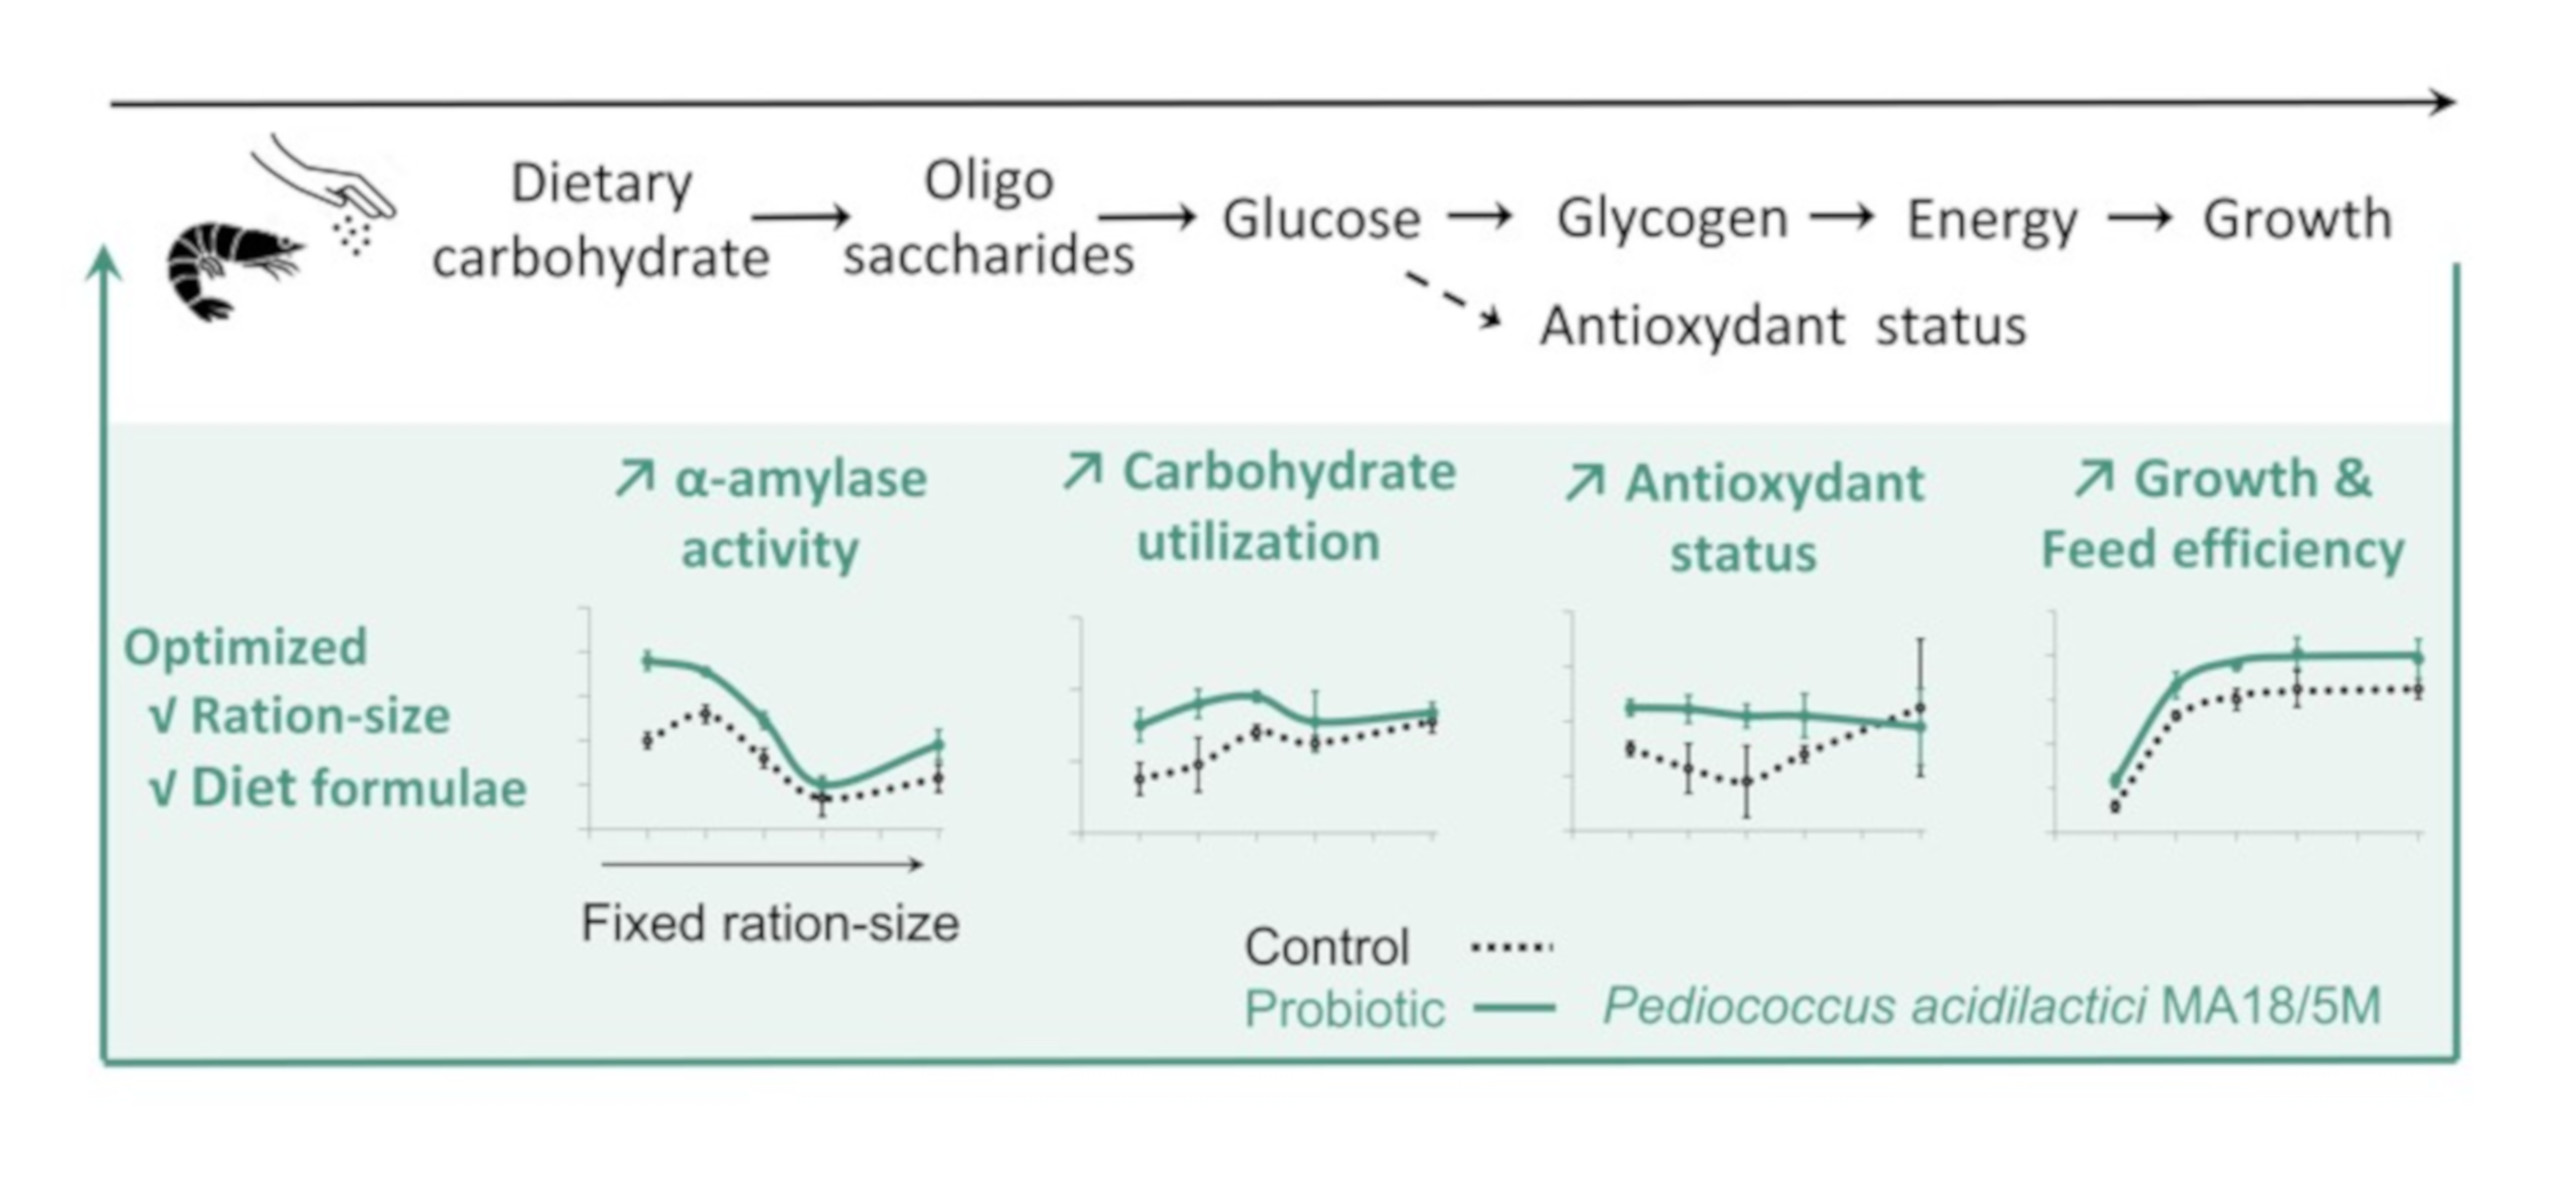
2.5.1. Relative Daily Growth Rate (RGR), K1 and K2
2.5.2. Growth-Ration (GR) and K1-Ration (KR) Curve Models
2.5.3. Determination of Maintenance (Rm) and Optimal (Ropt) Rations
2.5.4. Scope for Growth (SFG)
2.6. Statistics
3. Results
3.1. Survival, Growth and Nutritional Parameters
3.2. Biochemical Parameters
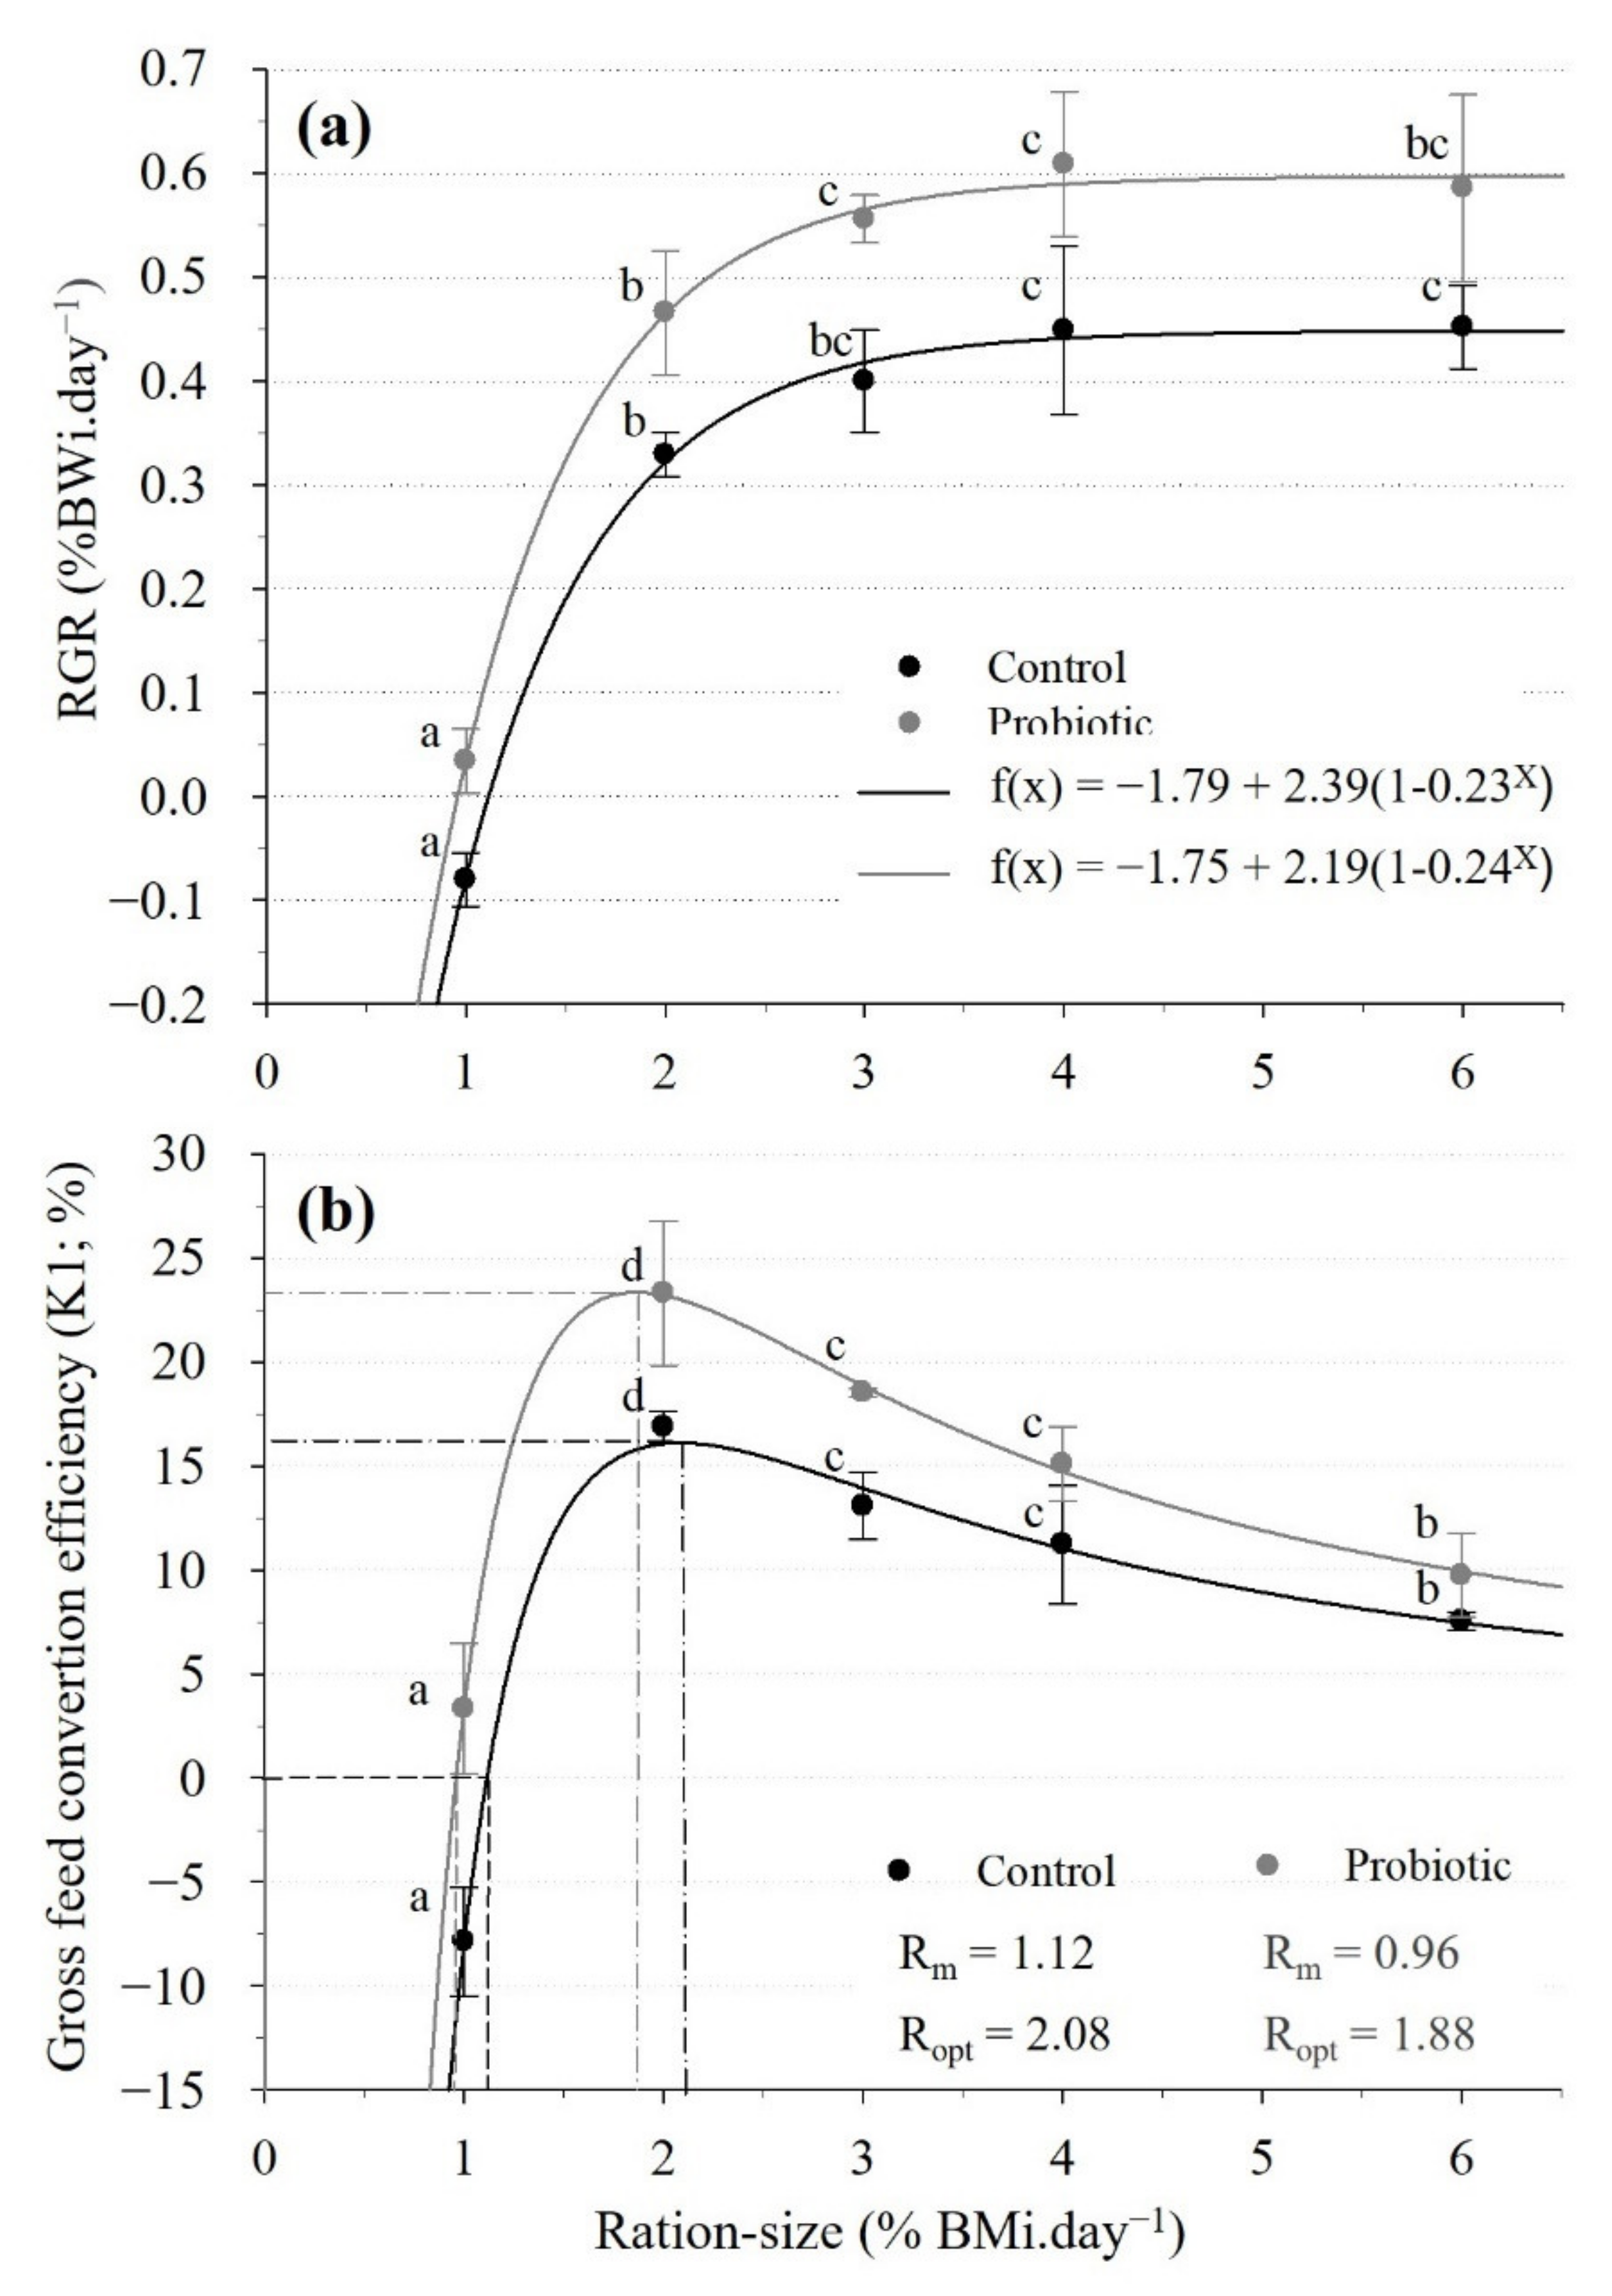
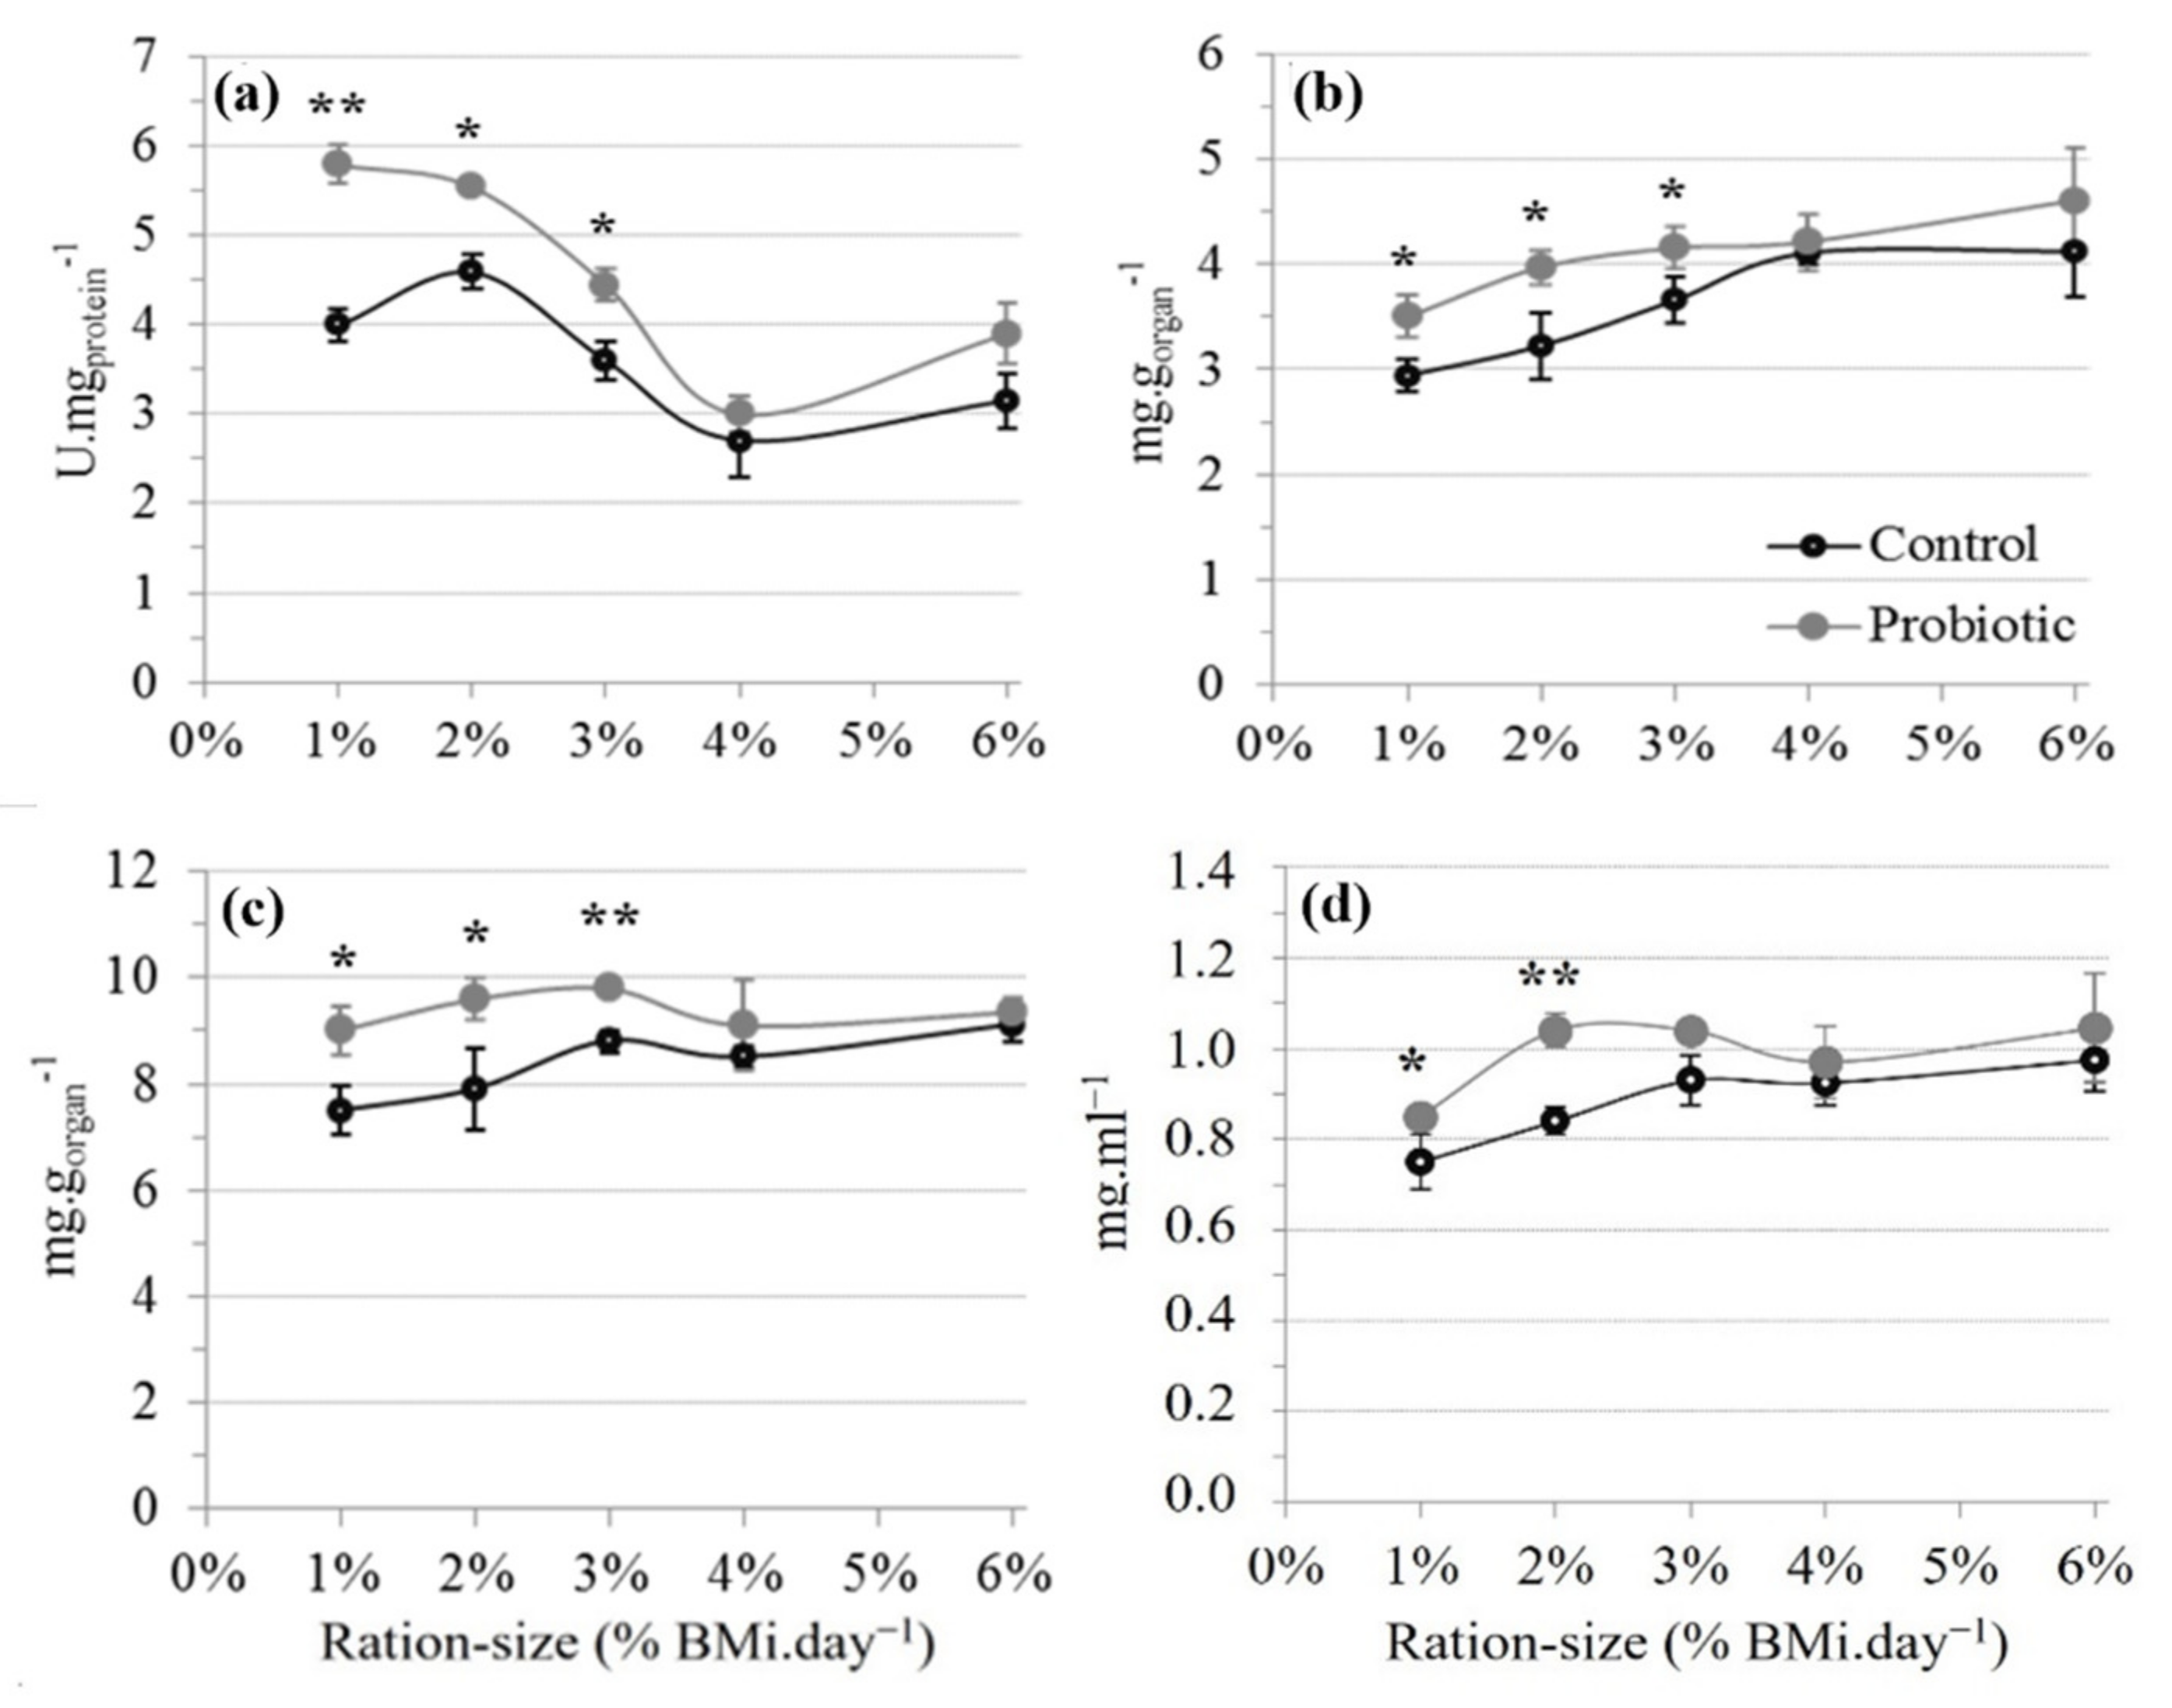
3.2.1. Digestive Enzymes
3.2.2. Glucose and Glycogen Content
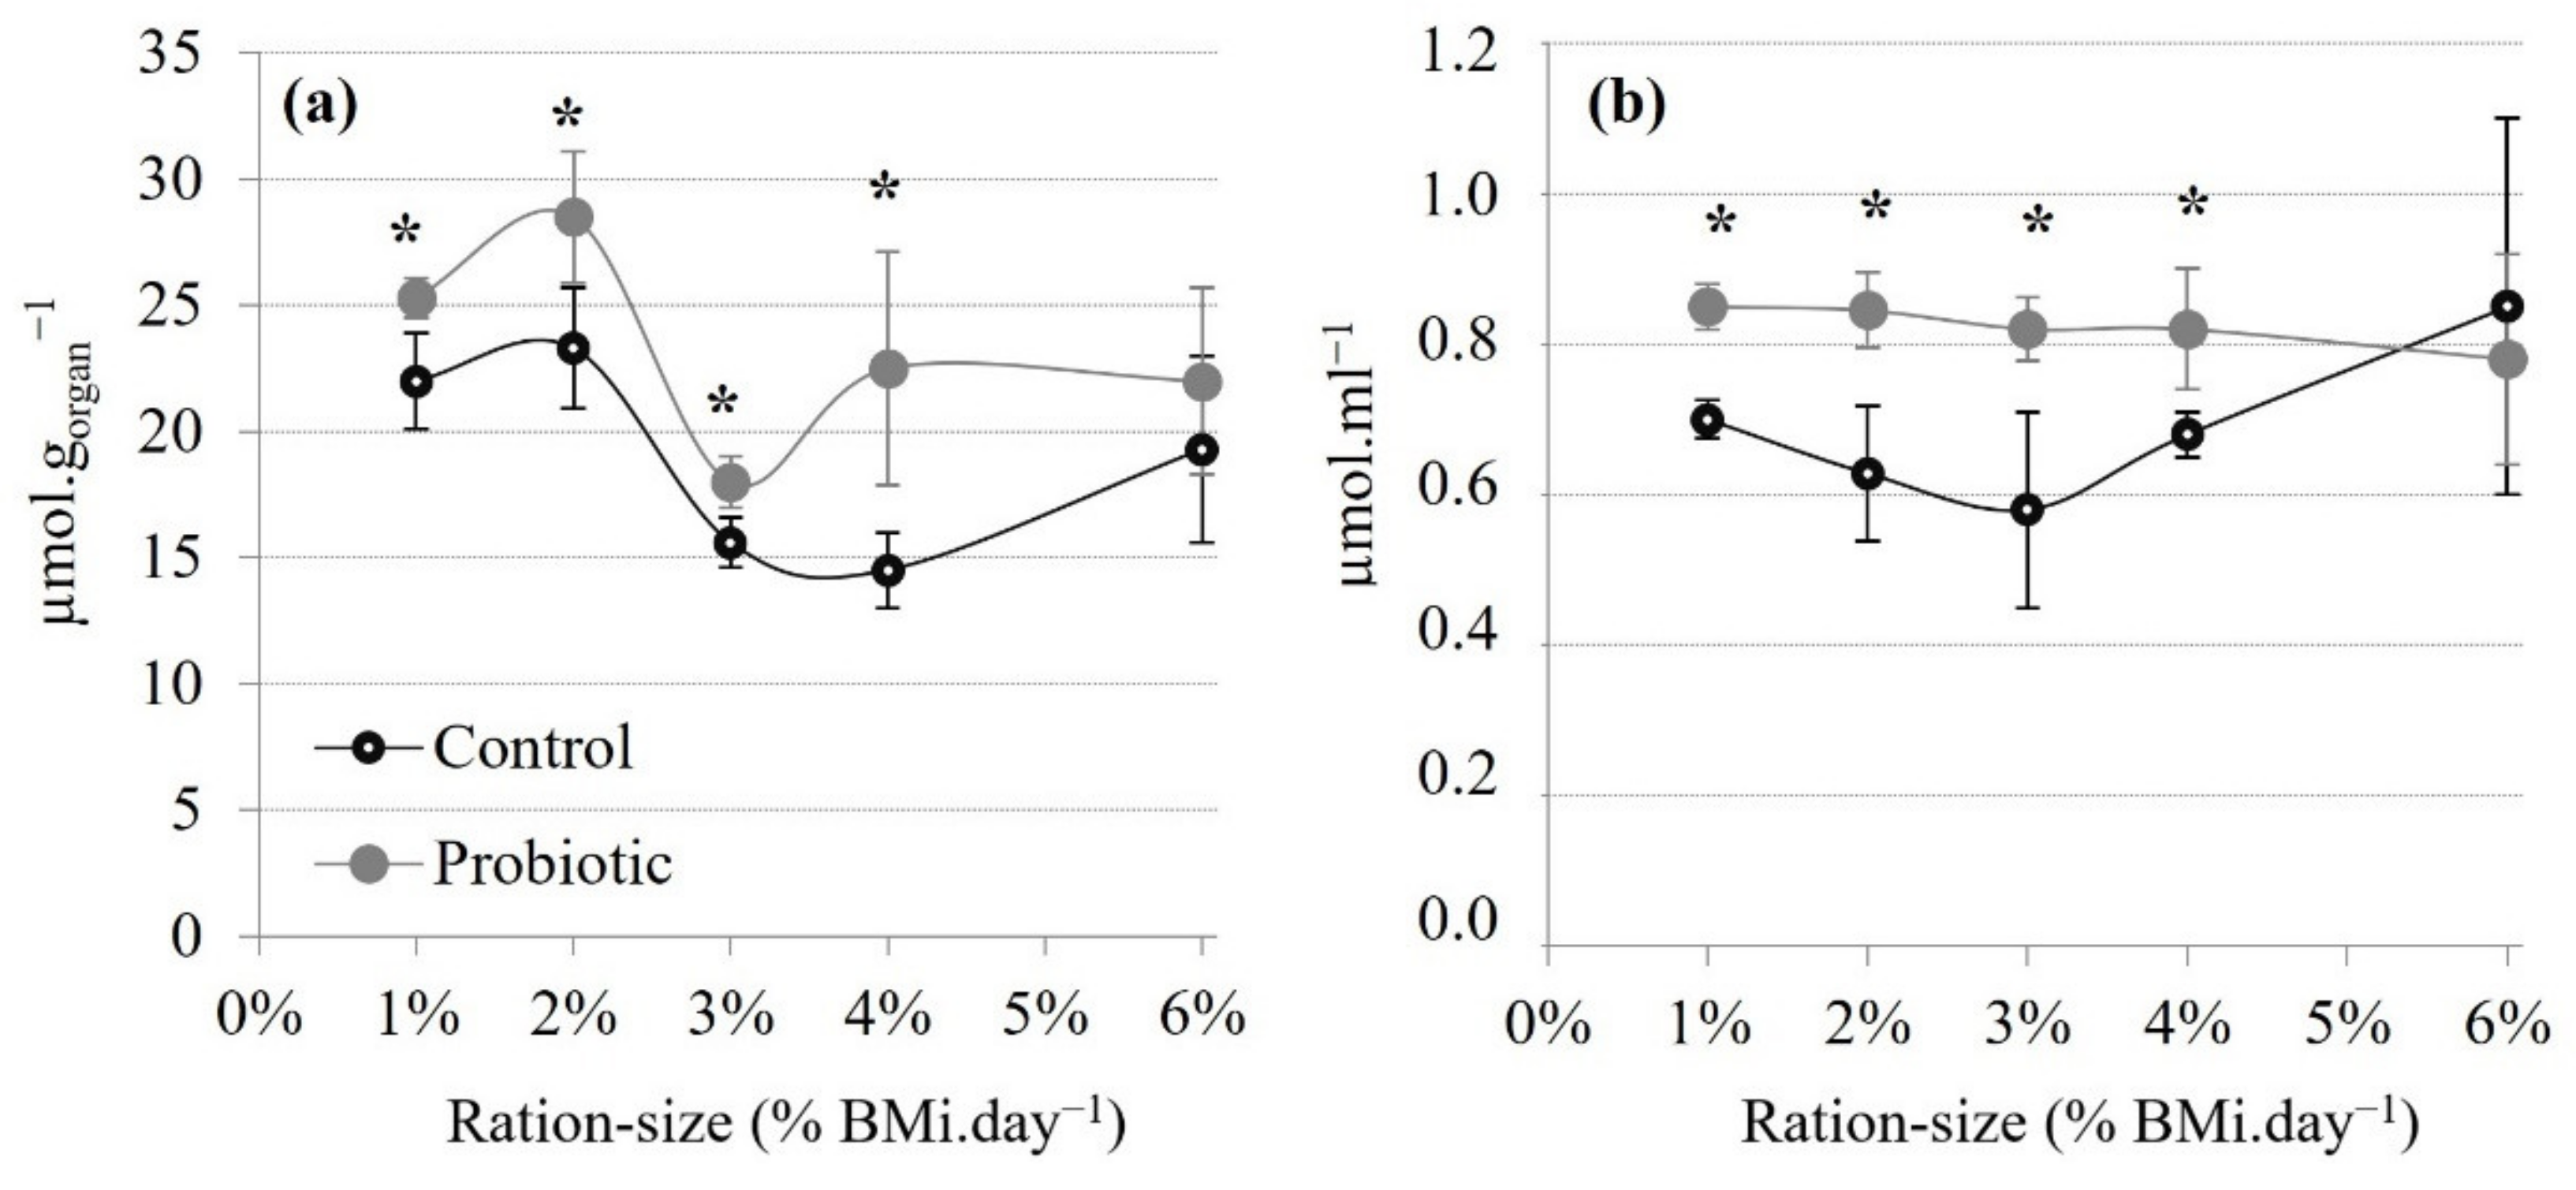
3.2.3. Total Antioxidant Status
4. Discussion
4.1. GR-Curves and Nutritional Parameters in the Control Diet
4.2. Effects of the Probiotic on Growth and Nutritional Parameters
4.3. Dietary Carbohydrates (CBH) Utilization and the Effect of Probiotic
4.4. A Link between Carbohydrate Metabolism and the Antioxidant Status
5. Conclusions
Author Contributions
Funding
Institutional Review Board Statement
Informed Consent Statement
Data Availability Statement
Acknowledgments
Conflicts of Interest
References
- Gatesoupe, F.J. The use of probiotics in aquaculture. Aquaculture 1999, 180, 147–165. [Google Scholar] [CrossRef]
- Dawood, M.A.O.; Koshio, S.; Abdel-Daim, M.M.; Doan, H.V. Probiotic application for sustainable aquaculture. Rev. Aquac. 2019, 11, 907–924. [Google Scholar] [CrossRef]
- Fuller, R. Probiotics in man and animals. J. Appl. Bacteriol. 1989, 66, 365–378. [Google Scholar]
- Mombelli, B.; Gismondi, M.R. The use of probiotics in medical practice. Int. J. Antimicrob. Agents 2000, 16, 531–536. [Google Scholar] [CrossRef]
- Ouwehand, A.C.; Salminen, S.; Isolauri, E. Probiotics: An overview of beneficial effects. Antonie Van Leeuwenhoek 2002, 82, 279–289. [Google Scholar] [CrossRef] [PubMed]
- Vine, N.G.; Leukes, W.D.; Kaiser, H. Probiotics in marine larviculture. FEMS Microbiol. Rev. 2006, 30, 404–427. [Google Scholar] [CrossRef] [Green Version]
- Kesarcodi-Watson, A.; Kaspar, H.; Lategan, J.; Gibson, L. Probiotics in aquaculture: The need, principles and mechanisms of action and screening processes. Aquaculture 2008, 274, 1–14. [Google Scholar] [CrossRef]
- Kumar, V.; Roy, S.; Kumar Meena, D.; Kumar Sarkar, U. Application of probiotics in shrimp aquaculture: Importance, mechanisms of action, and methods of administration. Rev. Fish. Sci. Aquac. 2016, 24, 342–368. [Google Scholar] [CrossRef]
- Toledo, A.; Frizzo, L.; Signorini, M.; Bossier, P.; Arenal, A. Impact of probiotics on growth performance and shrimp survival: A meta-analysis. Aquaculture 2019, 500, 196–205. [Google Scholar] [CrossRef]
- Kuebutornye, F.K.A.; Abarike, E.D.; Yishan, L. A review on the application of Bacillus as probiotics in aquaculture. Fish Shellfish Immunol. 2019, 87, 820–828. [Google Scholar] [CrossRef] [PubMed]
- Butt, U.D.; Lin, N.; Akhter, N.; Siddiqui, T.; Li, S.; Wu, B. Overview of the latest developments in the role of probiotics, prebiotics and synbiotics in shrimp aquaculture. Fish Shellfish Immunol. 2021, 114, 263–281. [Google Scholar] [CrossRef]
- Verschuere, L.; Rombaut, G.; Sorgeloos, P.; Verstraete, W. Probiotic bacteria as biological control agents in aquaculture. Microbiol. Mol. Biol. Rev. 2000, 64, 655–671. [Google Scholar] [CrossRef] [PubMed] [Green Version]
- Vine, N.; Leukes, W.D.; Kaiser, H.; Daya, S.; Baxter, J.; Hecht, T. Competition for attachment of aquaculture candidate probiotic and pathogenic bacteria on fish intestinal mucus. J. Fish Dis. 2004, 27, 319–326. [Google Scholar] [CrossRef]
- Guzmán-Villanueva, L.T.; Escobedo-Fregoso, C.; Barajas-Sandoval, D.R.; Gomez-Gil, B.; Peña-Rodríguez, A.; Martínez-Diaz, S.F.; Balcazar, J.L.; Quiroz-Guzmán, E. Assessment of microbial dynamics and antioxidant enzyme gene expression following probiotic administration in farmed Pacific white shrimp (Litopenaeus vannamei). Aquaculture 2020, 519, 734907. [Google Scholar] [CrossRef]
- Knipe, H.; Temperton, B.; Lange, A.; Bass, D.; Tyler, C.R. Probiotics and competitive exclusion of pathogens in shrimp aquaculture. Rev. Aquac. 2020, 13, 324–352. [Google Scholar] [CrossRef]
- Scholz, U.; Garcia-Diaz, G.; Ricque, D.; Cruz-Suarez, L.E.; Vargas-Albores, F.; Latchford, J. Enhancement of vibriosis resistance in juvenile Penaeus vannamei by supplementation of diets with different yeast products. Aquaculture 1999, 176, 271–283. [Google Scholar] [CrossRef]
- Castex, M.; Lemaire, P.; Wabete, N.; Chim, L. Effect of dietary probiotic Pediococcus acidilactici on antioxidant defences and oxidative stress status of shrimp Litopenaeus stylirostris. Aquaculture 2009, 294, 306–313. [Google Scholar] [CrossRef] [Green Version]
- Castex, M.; Lemaire, P.; Wabete, N.; Chim, L. Effect of probiotic Pediococcus acidilactici on antioxidant defences and oxidative stress of Litopenaeus stylirostris under Vibrio nigripulchritudo challenge. Fish Shellfish Immunol. 2010, 28, 622–631. [Google Scholar] [CrossRef] [Green Version]
- Wang, Y.-C.; Hu, S.-Y.; Chiu, C.-S.; Liu, C.-H. Multiple-strain probiotics appear to be more effective in improving the growth performance and health status of white shrimp, Litopenaeus vannamei, than single probiotic strains. Fish Shellfish Immunol. 2019, 84, 1050–1058. [Google Scholar] [CrossRef]
- Kewcharoen, W.; Srisapoom, P. Probiotic effects of Bacillus spp. from Pacific white shrimp (Litopenaeus vannamei) on water quality and shrimp growth, immune responses, and resistance to Vibrio parahaemolyticus (AHPND strains). Fish Shellfish Immunol. 2019, 94, 175–189. [Google Scholar] [CrossRef]
- Madhana, S.; Kanimozhi, G.; Panneerselvam, A. Chapter 20—Probiotics in shrimp aquaculture. In Advances in Probiotics; Dhanasekaran, D., Sankaranarayanan, A., Eds.; Academic Press: New York, NY, USA, 2021; pp. 309–325. [Google Scholar] [CrossRef]
- Castex, M.; Chim, L.; Pham, D.; Lemaire, P.; Wabete, N.; Nicolas, J.-L.; Schmidely, P.; Mariojouls, C. Probiotic, P. acidilactici application in shrimp Litopenaeus stylirostris culture subject to vibriosis in New Caledonia. Aquaculture 2008, 275, 182–193. [Google Scholar] [CrossRef] [Green Version]
- Jin, L.Z.; Ho, Y.W.; Abdullah, N.; Ali, L.A.; Jalaludin, S. Effects of adherent Lactobacillus cultures on growth, weight of organs and intestinal microflora and volatile fatty acids in broilers. Anim. Feed Sci. Technol. 1998, 70, 197–209. [Google Scholar] [CrossRef]
- Abe, F.; Ishibashi, N.; Shimamura, S. Effect of administration of bifidobacteria and lactic acid bacteria to newborn calves and piglets. J. Dairy Sci. 1995, 78, 2838–2846. [Google Scholar] [CrossRef]
- Guedes, C.M.; Gonçalves, D.; Rodrigues, M.A.M. Effects of age and mannanoligosaccharides supplementation on production of volatile fatty acids in the caecum of rabbits. Anim. Feed Sci. Technol. 2009, 150, 330–336. [Google Scholar] [CrossRef]
- Irianto, A.; Austin, B. Probiotics in aquaculture. J. Fish Dis. 2002, 25, 633–642. [Google Scholar] [CrossRef]
- Gupta, A.; Verma, G.; Gupta, P. Growth performance, feed utilization, digestive enzyme activity, innate immunity and protection against Vibrio harveyi of freshwater prawn, Macrobrachium rosenbergii fed diets supplemented with Bacillus coagulans. Aquac. Int. 2016, 24, 1379–1392. [Google Scholar] [CrossRef]
- Doeschate, K.T.; Coyne, V. Improved growth rate in farmed Haliotis midae through probiotic treatment. Aquaculture 2008, 284, 174–179. [Google Scholar] [CrossRef]
- Bomba, A.; Nemcová, R.; Gancarcíková, S.; Herich, R.; Guba, P.; Mudroňová, D. Improvement of the probiotic effect of micro-organisms by their combination with maltodextrins, fructo-oligosaccharides and polyunsaturated fatty acids. Br. J. Nutr. 2002, 88, S95–S99. [Google Scholar] [CrossRef] [PubMed] [Green Version]
- Rajeev, R.; Adithya, K.K.; Kiran, G.S.; Selvin, J. Healthy microbiome: A key to successful and sustainable shrimp aquaculture. Rev. Aquac. 2020, 13, 238–258. [Google Scholar] [CrossRef]
- Zheng, X.; Duan, Y.; Dong, H.; Zhang, J. The effect of Lactobacillus plantarum administration on the intestinal microbiota of whiteleg shrimp Penaeus vannamei. Aquaculture 2020, 526, 735331. [Google Scholar] [CrossRef]
- Venkat, H.K.; Sahu, N.P.; Jain, K.K. Effect of feeding Lactobacillus-based probiotics on the gut microflora, growth and survival of postlarvae of Macrobrachium rosenbergii (de Man). Aquac. Res. 2004, 35, 501–507. [Google Scholar] [CrossRef]
- Ziaei-Nejad, S.; Rezaei, M.H.; Takami, G.A.; Lovett, D.L.; Mirvaghefi, A.; Shakouri, M. The effect of Bacillus spp. bacteria used as probiotics on digestive enzyme activity, survival and growth in the Indian white shrimp Fenneropenaeus indicus. Aquaculture 2006, 252, 516–524. [Google Scholar] [CrossRef]
- Bernal, M.G.; Marrero, R.M.; Campa-Córdova, Á.I.; Mazón-Suástegui, J.M. Probiotic effect of Streptomyces strains alone or in combination with Bacillus and Lactobacillus in juveniles of the white shrimp Litopenaeus vannamei. Aquac. Int. 2017, 25, 927–939. [Google Scholar] [CrossRef]
- Wang, Y.; Liang, J.; Duan, Y.; Niu, J.; Wang, J.; Huang, Z.; Lin, H. Effects of dietary Rhodiola rosea on growth, body composition and antioxidant capacity of white shrimp Litopenaeus vannamei under normal conditions and combined stress of low-salinity and nitrite. Aquac. Nutr. 2017, 23, 548–559. [Google Scholar] [CrossRef]
- Brett, J.R. Environmental factors and growth. In Fish Physiology; Hoar, W.S., Randall, D.J., Brett, J.R., Eds.; Academic Press: New York, NY, USA, 1979; Volume VIII, pp. 595–675. [Google Scholar]
- Elliott, J.M. The growth rate of brown trout (Salmo trutta L.) fed on reduced rations. J. Anim. Ecol. 1975, 44, 823–842. [Google Scholar] [CrossRef]
- Staples, D.J.; Nomura, M. Influence of body size and food ration on the energy budget of rainbow trout Salmo gairdneri Richardson. J. Fish Biol. 1976, 9, 29–43. [Google Scholar] [CrossRef]
- Brett, J.R.; Groves, T.D.D. Physiological energetics. In Fish Physiology; Hoar, W.S., Randall, D.J., Brett, J.R., Eds.; Academic Press: New York, NY, USA, 1979; Volume VIII, pp. 279–352. [Google Scholar]
- Malloy, K.D.; Targett, T.E. Effects of ration limitation and low temperature on growth, biochemical condition, and survival of juvenile summer flounder from two Atlantic coast nurseries. Trans. Am. Fish. Soc. 1994, 123, 182–193. [Google Scholar] [CrossRef]
- Gatlin, D.M.; Poe, W.E.; Wilson, R.P. Protein and energy requirements of fingerling channel catfish for maintenance and maximum growth. J. Nutr. 1986, 116, 2121–2131. [Google Scholar] [CrossRef] [PubMed]
- Lupatsch, I.; Kissil, G.W.; Sklan, D. Comparison of energy and protein efficiency among three fish species gilthead sea bream. (Sparus aurata), European sea bass (Dicentrarchus labrax) and white grouper (Epinephelus aeneus): Energy expenditure for protein and lipid deposition. Aquaculture 2003, 225, 175–189. [Google Scholar] [CrossRef]
- Ozório, R.O.A.; Valente, L.M.P.; Correia, S.; Pousão-Ferreira, P.; Damasceno-Oliveira, A.; Escórcio, C.; Oliva-Teles, A. Protein requirement for maintenance and maximum growth of two-banded seabream (Diplodus vulgaris) juveniles. Aquac. Nutr. 2008, 15, 85–93. [Google Scholar] [CrossRef]
- Helland, S.J.; Hatlen, B.; Grisdale-Helland, B. Energy, protein and amino acid requirements for maintenance and efficiency of utilization for growth of Atlantic salmon post-smolts determined using increasing ration levels. Aquaculture 2010, 305, 150–158. [Google Scholar] [CrossRef]
- Sedgwick, R.W. Effect of ration-size and feeding frequency on the growth and food conversion of juvenile Penaeus merguiensis de Man. Aquaculture 1979, 16, 279–298. [Google Scholar] [CrossRef]
- Wabete, N.; Chim, L.; Lemaire, P.; Massabuau, J.-C. Growth ration relationship in the shrimp Litopenaeus Stylirostris: Effect of feeding frequency on maintenance energy requirement and scope for growth. In Proceedings of the European Aquaculture Society Meeting, Aquacuture Europe, Florence, Italy, 9–13 May 2006. [Google Scholar]
- Chim, L.; Wabete, N.; Lemaire, P.; Della-Patrona, L.; Massabuau, J.C. Growth-ration relationship in the shrimp Litopenaeus stylirostris: Effect of natural food from the pond on maintenance energy requirement and scope for growth. In Proceedings of the European Aquaculture Society Meeting, Aquacuture Europe, Florence, Italy, 9–13 May 2006. [Google Scholar]
- Kureshy, N.; Davis, A. Protein requirement for maintenance and maximum weight gain for the Pacific white shrimp Litopenaeus vannamei. Aquaculture 2002, 204, 125–143. [Google Scholar] [CrossRef]
- Ruohonen, K. Individual measurements and nested designs in aquaculture experiments: A simulation study. Aquaculture 1998, 165, 149–157. [Google Scholar] [CrossRef]
- Hurlbert, S.H. Pseudoreplication and the design of ecological field experiments. Ecol. Monogr. 1984, 54, 187–211. [Google Scholar] [CrossRef] [Green Version]
- Sokal, R.R.; Rohlf, F.J. Biometry: The Principles and Practice of Statistics in Biological Research, 3rd ed.; W. H. Freeman and Co.: New York, NY, USA, 1995; 887p, ISBN 0716786044. [Google Scholar]
- Ling, N.; Cotter, D. Statistical power in comparative aquaculture studies. Aquaculture 2003, 224, 159–168. [Google Scholar] [CrossRef]
- Jobling, M.; Koskela, J. Inter-individual variations in feeding and growth in rainbow trout during restricted feeding and in a subsequent period of compensatory growth. J. Fish Biol. 1996, 49, 658–667. [Google Scholar] [CrossRef]
- Lowry, O.; Rosebrough, N.J.; Farr, A.L.; Randall, R.S. Protein measurements with Folin phenol reagent. J. Biol. Chem. 1951, 193, 265–275. [Google Scholar] [CrossRef]
- Dubois, M.; Gilles, K.A.; Hamilton, J.K.; Rebers, P.A.; Smith, F. Colorimetric method for determination of sugars and related substances. Anal. Chem. 1956, 28, 350–356. [Google Scholar] [CrossRef]
- Bernfeld, P. Amylase. In Methods in Enzymology; Colowick, S.P., Kaplan, N.O., Eds.; Academic Press: New York, NY, USA, 1955; pp. 149–158. [Google Scholar]
- Erlanger, B.F.; Kokowsky, N.; Cohen, W. The preparation and properties of 2 chromogenic substrates of trypsin. Arch. Biochem. Biophys. 1961, 95, 271–278. [Google Scholar] [CrossRef]
- Garcia-Carreno, F.L.; Hernandez-Cortes, M.P.; Haard, N.F. Enzymes with peptidase and proteinase activity from the digestive systems of a freshwater and a marine decapod. J. Agric. Food Chem. 1994, 42, 1456–1461. [Google Scholar] [CrossRef]
- Warren, C.E.; Davis, G.E. Laboratory studies on the feeding bioenergetics and growth of fishes. In The Biological Basis of Freshwater Fish Production, A Symposium; Gerking, S.D., Ed.; Blackwell: Oxford, UK, 1967; pp. 175–214. [Google Scholar]
- Brett, J.R. Scope for metabolism and growth of sockeye salmon, Oncorhynchus nerka, and some related energetics. J. Fish. Res. Board Can. 1976, 33, 307–313. [Google Scholar] [CrossRef]
- R Development Core Team. R: A Language and Environment for Statistical Computing; R Foundation for Statistical Computing: Vienna, Austria, 2008; ISBN 3-900051-07-0. Available online: http://www.R-project.org (accessed on 23 September 2021).
- Cui, Y.; Wootton, R.J. Effects of ration, temperature and body size on the body composition, energy content and condition of the minnow, Phoxinus phoxinus (L.). J. Fish Biol. 1988, 32, 749–764. [Google Scholar] [CrossRef]
- Jobling, M. Fish Bioenergetics. Fish and Fisheries Series 13; Springer Science, Chapman and Hall: London, UK, 1994; 310p. [Google Scholar]
- National Research Council. Nutrient Requirements of Fish and Shrimp; The National Academies Press: Washington, DC, USA, 2011; 392p. [Google Scholar] [CrossRef]
- Dall, W.; Smith, D. Oxygen consumption and ammonia-N excretion in fed and starved tiger prawns, Penaeus esculentus Haswell. Aquaculture 1986, 55, 23–33. [Google Scholar] [CrossRef]
- Wabete, N. Etude Ecophysiologique du Métabolisme Respiratoire et Nutritionnelle Chez la Crevette Peneide Litopeneaus stylirostris. Application à la crevetticulture en Nouvelle Calédonie. Ph.D. Thesis, Université Bordeaux 1. Ecole Doctorale Sciences du Vivant, Géosciences et Sciences de l’Environnement, Talence, France, 2005; 173p. [Google Scholar]
- Saoud, I.P.; Anderson, G. Using scope-for-growth estimates to compare the suitability of feeds used in shrimp aquaculture. J. World Aquac. Soc. 2004, 35, 523–528. [Google Scholar] [CrossRef]
- Glencross, B.D.; Smith, D.M.; Tonks, M.L.; Tabrett, S.M.; Williams, K.C. A reference diet for nutritional studies of the prawn, Penaeus monodon. Aquac. Nutr. 1999, 5, 33–40. [Google Scholar] [CrossRef]
- Logan, D.T.; Epifanio, C.E. A laboratory energy balance for the larvae and juvenile of the American lobster Homarus americanus. Mar. Biol. 1978, 47, 381–389. [Google Scholar] [CrossRef]
- Lemos, D.; Phan, V.N. Energy partitioning into growth, respiration, excretion and exuvia during larval development of the shrimp Farfantapenaeus paulensis. Aquaculture 2001, 199, 131–143. [Google Scholar] [CrossRef]
- Sumule, O.; Koshio, S.; Teshima, S.-I.; Ishikawa, M.; Gilmore, J.; Starr, D. Energy budget of Marsupenaeus japonicus postlarvae fed highly unsaturated fatty acid-enriched and non-enriched Artemia nauplii. Fish. Sci. 2003, 69, 706–715. [Google Scholar] [CrossRef] [Green Version]
- Yu, M.C.; Li, Z.L.; Lin, H.Z.; Wen, G.L.; Ma, S. Effects of dietary Bacillus and medicinal herbs on the growth, digestive enzyme activity, and serum biochemical parameters of the shrimp Litopenaeus vannamei. Aquac. Int. 2008, 16, 471–480. [Google Scholar] [CrossRef]
- Wang, Y.B. Effect of probiotics on growth performance and digestive enzyme activity of the shrimp Penaeus vannamei. Aquaculture 2007, 269, 259–264. [Google Scholar] [CrossRef]
- Zuo, H.H.; Shang, B.-J.; Shao, Y.-C.; Li, W.-Y.; Sun, J.-S. Screening of intestinal probiotics and the effects of feeding probiotics on the growth, immune, digestive enzyme activity and intestinal flora of Litopenaeus vannamei. Fish Shellfish Immunol. 2019, 86, 160–168. [Google Scholar] [CrossRef]
- Fang, H.; Wang, B.; Jiang, K.; Liu, M.; Wang, L. Effects of Lactobacillus pentosus HC-2 on the growth performance, intestinal morphology, immune-related genes and intestinal microbiota of Penaeus vannamei affected by aflatoxin B1. Aquaculture 2020, 525, 735289. [Google Scholar] [CrossRef]
- Lee, C.; Kim, S.; Shin, J.; Kim, M.-G.; Gunathilaka, B.E.; Kim, S.H.; Kim, J.E.; Ji, S.-C.; Han, J.E.; Lee, K.-J. Dietary supplementations of Bacillus probiotic improve digestibility, growth performance, innate immunity, and water ammonia level for Pacific white shrimp, Litopenaeus vannamei. Aquac. Int. 2021, 29, 2463–2475. [Google Scholar] [CrossRef]
- Zainuddin, H.; Haryati, H.; Aslamyah, S. Effect of dietary carbohydrate levels and feeding frequencies on growth and carbohydrate digestibility of white shrimp Litopenaeus vannamei under laboratory conditions. J. Aquac. Res. Dev. 2014, 5, 274. [Google Scholar] [CrossRef] [Green Version]
- Guo, R.; Liu, Y.; Huang, J.; Tian, L.-X. Effect of dietary cornstarch levels on growth performance, digestibility and microscopic structure in the white shrimp, Litopenaeus vannamei reared in brackish water. Aquac. Nutr. 2006, 12, 83–88. [Google Scholar] [CrossRef]
- Sánchez-Paz, A.; García-Carreño, F.; Hernández-López, J.; Muhlia-Almazán, A.; Yepiz-Plascencia, G. Effect of short-term starvation on hepatopancreas and plasma energy reserves of the Pacific white shrimp (Litopenaeus vannamei). J. Exp. Mar. Biol. 2007, 340, 184–193. [Google Scholar] [CrossRef]
- Rosas, C.; Cuzon, G.; Gaxiola, G.; Arena, L.; Lemaire, P.; Soyez, C.; Van Wormhoudt, A. Influence of dietary carbohydrate on the metabolism of juvenile Litopenaeus stylirostris. J. Exp. Mar. Biol. Ecol. 2000, 249, 181–198. [Google Scholar] [CrossRef]
- Rosas, C.; Cuzon, G.; Gaxiola, G.; Pascual, C.; Taboada, G.; Arena, L.; van Wormhoudt, A. An energetic and conceptual model of the physiological role of dietary carbohydrates and salinity on Litopenaeus vannamei juveniles. J. Exp. Mar. Biol. Ecol. 2002, 268, 47–67. [Google Scholar] [CrossRef]
- Cousin, M.; Cuzon, G.; Guillaume, J. Aquacop Digestibility of starch in Penaeus vannamei: In vivo and in vitro study on eight samples of various origin. Aquaculture 1996, 140, 361–372. [Google Scholar] [CrossRef]
- Gamboa-Delgado, J.; Molina-Poveda, C.; Cahu, C. Digestive enzyme activity and food ingesta in juvenile shrimp Litopenaeus vannamei (Boone, 1931) as a function of body weight. Aquac. Res. 2003, 34, 1403–1411. [Google Scholar] [CrossRef] [Green Version]
- Maugle, P.D.; Deshimaru, O.; Katayama, T.; Simpson, K.L. Effect of short necked clams diet on shrimp growth and digestive enzyme activities. Bull. Jpn. Soc. Sci. Fish. 1982, 48, 1758–1764. [Google Scholar] [CrossRef] [Green Version]
- Van Wormhoudt, A.; Cruz, E.; Guillaume, J.; Favrel, P. Action de l’inhibiteur trypsique de soja sur la croissance et l’activité des enzymes digestives chez Penaeus japonicus (Crustacea, Decapoda): Rôle éventuel des hormones gastro-intestinales. Oceanis 1986, 12, 305–319. [Google Scholar]
- Cecile, S. Utilisation d’un Bioessai Artemia Pour Caractériser les Molécules Actives d’une Préparation Microbienne Commerciale à Base de Lactobacilles Sur la Physiologie Digestive de Crustacés. Master’s Thesis, Université Pierre et Marie Curie, Paris, France, 2006; p. 71. [Google Scholar]
- Wei, C.; Wang, X.; Li, C.; Zhou, H.; Liu, C.; Mai, K.; He, G. Effects of dietary Shewanella sp. MR-7 on the growth performance, immunity, and intestinal microbiota of Pacific white shrimp. Aquac. Rep. 2021, 19, 100595. [Google Scholar] [CrossRef]
- Garibay-Valdez, E.; Martínez-Porchas, M.; Calderón, K.; Vargas-Albores, F.; Gollas-Galván, T.; Martínez-Córdova, L. Taxonomic and functional changes in the microbiota of the white shrimp (Litopenaeus vannamei) associated with postlarval ontogenetic development. Aquaculture 2020, 518, 734–842. [Google Scholar] [CrossRef]
- Fan, L.; Li, Q.X. Characteristics of intestinal microbiota in the Pacific white shrimp Litopenaeus vannamei differing growth performances in the marine cultured environment. Aquaculture 2019, 505, 450–461. [Google Scholar] [CrossRef]
- Lygren, B.; Hemre, G.-I. Influence of dietary carbohydrate on antioxidant enzyme activities in liver of Atlantic salmon (Salmo salar L.). Aquac. Int. 2001, 9, 421–427. [Google Scholar] [CrossRef]
- Sagone, A.L., Jr.; Greenwald, J.; Kraut, E.H.; Bianchine, J.; Singh, D. Glucose: A role as free radical scavenger in biological system. J. Lab. Clin. Med. 1983, 101, 97–103. [Google Scholar] [PubMed]
- Morelli, R.; Russo-Volpe, S.; Bruno, N.; Lo Scalzo, R. Fenton-dependent damage to carbohydrates: Free radical scavenging activity of some simple sugars. J. Agric. Food Chem. 2003, 51, 7418–7425. [Google Scholar] [CrossRef]
- Fynn-Aikins, K.; Hung, S.S.; Liu, W.; Li, H. Growth, lipogenesis and liver composition of juvenile white sturgeon fed different levels of D-glucose. Aquaculture 1992, 105, 61–72. [Google Scholar] [CrossRef]
- Carefoot, T.H. Specific dynamic action (SDA) in the supralittoral isopod, Ligia pallasii: Effect of ration and body size on SDA. Comp. Biochem. Phys. A 1990, 95, 317–320. [Google Scholar] [CrossRef]
- Luvizotto-Santos, R.; Lee, J.T.; Pereira-Branco, Z.; Bianchini, A.; Maia-Nery, L.E. Lipids as energy source during salinity acclimation in the euryhaline crab Chasmagnathus granulate Dana, 1851 (Crustacea–Grapsidae). J. Exp. Zool. 2003, 295, 200–205. [Google Scholar] [CrossRef] [PubMed]
- Kullisaar, T.; Songisepp, E.; Mikelsaar, M.; Zilmer, K.; Vihalemm, T.; Zilmer, M. Antioxidative probiotic fermented goats’ milk decreases oxidative stress-mediated atherogenicity in human subjects. Br. J. Nutr. 2003, 90, 449–456. [Google Scholar] [CrossRef] [PubMed] [Green Version]


| (a) Ingredients (g/kg) | |
|---|---|
| LT fish meal (a) | 300 |
| Soybean meal (b) | 200 |
| Wheat meal (c) | 370 |
| Wheat gluten | 70 |
| Fish oil | 20 |
| Soy oil | 20 |
| Soy lecithin (d) | 20 |
| Shrimp Vitamin premix (e) | 0.5 |
| Shrimp trace mineral premix (f) | 1 |
| Stay C (g) | 0.4 |
| (b) Proximate Analysis | |
| Protein (1) (%, DM basis) | 43.8 |
| Fat (2) (%, DM basis) | 10 |
| Fiber (3) (%, DM basis) | 2 |
| Ash (4) (%, DM basis) | 6.9 |
| (c) Energy Content (kcal.kg−1) | |
| Gross energy (5) | 4502 |
| Digestible energy (6) | 3376 |
| Daily Ration Size (% BMi.day−1) | P. acidilactici Count (×107 CFU.g−1 Feed) | |
|---|---|---|
| Expected | Measured | |
| 1 | 4.00 | 3.8 ± 0.4 |
| 2 | 2.00 | 2.5 ± 0.2 |
| 3 | 1.33 | 1.5 ± 0.3 |
| 4 | 1.00 | 0.87 ± 0.05 |
| 6 | 0.67 | 0.65 ± 0.05 |
| Daily Ration Size (% BMi.day−1) | Survival (%) | BWi (g) | BWf (g) | RGR (% BWi.day−1) | ||||
|---|---|---|---|---|---|---|---|---|
| Control | Probiotic | Control | Probiotic | Control | Probiotic | Control | Probiotic | |
| 1 | 83 ± 17 a | 83 ± 17 a | 11.55 ± 0.10 a | 11.02 ± 0.31 b | 11.25 ± 0.07 | 11.06 ± 0.40 | −0.08 ± 0.03 a | 0.03 ± 0.03 b |
| 2 | 75 ± 12 a | 78 ± 10 a | 10.70 ± 1.42 a | 11.68 ± 0.44 a | 11.64 ± 1.54 | 13.47 ± 0.22 | 0.33 ± 0.02 a | 0.47 ± 0.06 b |
| 3 | 78 ± 25 a | 83 ± 17 a | 11.88 ± 0.59 a | 10.70 ± 0.31 b | 13.70 ± 0.60 | 12.15 ± 0.50 | 0.40 ± 0.05 a | 0.56 ± 0.02 b |
| 4 | 89 ± 19 a | 83 ± 29 a | 11.15 ± 0.41 a | 10.31 ± 0.69 a | 12.03 ± 1.55 | 11.81 ± 0.67 | 0.45 ± 0.08 a | 0.61 ± 0.07 b |
| 6 | 83 ± 0 a | 78 ± 10 a | 10.84 ± 1.19 a | 9.62 ± 0.43 a | 12.07 ± 1.01 | 11.06 ± 0.98 | 0.45 ± 0.04 a | 0.59 ± 0.09 a |
| Ration-size effect | n.s. | n.s. | n.s. | ** | - | - | *** | *** |
| Performance Indices | Diet | Ration Size | BWi | Diet × Ration Size | Tank Effect | |
|---|---|---|---|---|---|---|
| BWf (1) | (g) | *** | *** | *** | n.s. | ** |
| RGR (1) | (% BWi.day−1) | *** | *** | n.s. | n.s. | n.s. |
| K1 (2) | *** | *** | n.a. | * | n.a. | |
| K2 (2) | ** | *** | n.a. | n.s. | n.a. |
| Daily Ration Size (% BMi.day−1) | K1 (%) | K2 (%) | ||
|---|---|---|---|---|
| Control | Probiotic | Control | Probiotic | |
| 1 | −7.87 ± 2.61 a | 3.33 ± 3.14 b | - | 83.33 ± 45.3 |
| 2 | 16.88 ± 0.75 a | 23.33 ± 3.47 b | 36.30 ± 1.88 a | 49.74 ± 6.68 b |
| 3 | 13.08 ± 1.61 a | 18.53 ± 0.19 b | 20.87 ± 2.57 a | 27.25 ± 0.27 b |
| 4 | 11.25 ± 2.85 a | 15.09 ± 1.80 a | 15.62 ± 3.96 a | 19.86 ± 2.37 a |
| 6 | 7.54 ± 0.45 a | 9.73 ± 2.01 a | 9.27 ± 0.55 a | 11.59 ± 02.40 a |
| Ration-size effect | * | ** | * | * |
| Feed and Growth Indices | Maintenance Ration (Rm) | Optimal Ration (Ropt) | |||
|---|---|---|---|---|---|
| Control | Probiotic | Control | Probiotic | ||
| Feed intake | (g.kg−1.day−1) | 11.3 | 9.4 | 21.3 | 18.9 |
| GE intake (a) | (kcal.kg−1.day−1) | 50.9 | 42.3 | 95.9 | 85.1 |
| DE intake (b) | (kcal.kg−1.day−1) | 38.1 | 31.7 | 71.9 | 63.8 |
| SFG | (kcal) | 33.8 | 32.1 | ||
| GR (c) | (g.kg−1.day−1) | 3.3 | 4.5 | ||
| Parameter | Diet | Ration Size | Diet × Ration Size | |
|---|---|---|---|---|
| (a) Digestive Gland | ||||
| α-amylase activity | (U.mgprot−1) | *** | *** | n.s. |
| Trypsine activity | (U.mgprot−1) | ** | n.s. | * |
| α-amylase/trypsine | n.s. | n.s. | n.s. | |
| Glucose | (mg.gorgan−1) | n.s. | ** | n.s. |
| Glycogene | (mg.gorgan−1) | ** | * | n.s. |
| TAS | (µmol.gorgan−1) | *** | *** | n.s. |
| (b) Hemolymph | ||||
| Glucose | (mg.mL−1) | * | * | n.s. |
| TAS | (µmol.mL−1) | n.s. | * | n.s. |
| Daily Ration Size (% BMi.day−1) | α-amylase Activity (U.mgprot−1) | Trypsin Activity (U.mgprot−1) | α-amylase/Trypsin | |||
|---|---|---|---|---|---|---|
| Control | Probiotic | Control | Probiotic | Control | Probiotic | |
| 1 | 4.03 ± 0.12 a | 5.77 ± 0.29 b | 0.38 ± 0.04 a | 0.33 ± 0.04 a | 11.96 ± 1.16 a | 18.50 ± 2.26 b |
| 2 | 4.56 ± 0.27 a | 5.52 ± 0.11 b | 0.30 ± 0.03 a | 0.38 ± 0.05 a | 16.00 ± 1.80 a | 16.29 ± 0.73 a |
| 3 | 3.62 ± 0.26 a | 4.43 ± 0.20 b | 0.31 ± 0.03 a | 0.27 ± 0.02 a | 11.99 ± 2.47 a | 16.91 ± 1.45 a |
| 4 | 2.63 ± 0.54 a | 3.05 ± 0.12 a | 0.22 ± 0.04 a | 0.23 ± 0.01 a | 12.69 ± 1.36 a | 13.40 ± 0.66 a |
| 6 | 3.19 ± 0.31 a | 3.90 ± 0.31 a | 0.18 ± 0.02 a | 0.32 ± 0.06 b | 17.80 ± 2.61 a | 15.60 ± 4.63 a |
| Ration size effect | *** | ** | ** | n.s. | n.s. | n.s. |
Publisher’s Note: MDPI stays neutral with regard to jurisdictional claims in published maps and institutional affiliations. |
© 2021 by the authors. Licensee MDPI, Basel, Switzerland. This article is an open access article distributed under the terms and conditions of the Creative Commons Attribution (CC BY) license (https://creativecommons.org/licenses/by/4.0/).
Share and Cite
Castex, M.; Leclercq, E.; Lemaire, P.; Chim, L. Dietary Probiotic Pediococcus acidilactici MA18/5M Improves the Growth, Feed Performance and Antioxidant Status of Penaeid Shrimp Litopenaeus stylirostris: A Growth-Ration-Size Approach. Animals 2021, 11, 3451. https://doi.org/10.3390/ani11123451
Castex M, Leclercq E, Lemaire P, Chim L. Dietary Probiotic Pediococcus acidilactici MA18/5M Improves the Growth, Feed Performance and Antioxidant Status of Penaeid Shrimp Litopenaeus stylirostris: A Growth-Ration-Size Approach. Animals. 2021; 11(12):3451. https://doi.org/10.3390/ani11123451
Chicago/Turabian StyleCastex, Mathieu, Eric Leclercq, Pierrette Lemaire, and Liêt Chim. 2021. "Dietary Probiotic Pediococcus acidilactici MA18/5M Improves the Growth, Feed Performance and Antioxidant Status of Penaeid Shrimp Litopenaeus stylirostris: A Growth-Ration-Size Approach" Animals 11, no. 12: 3451. https://doi.org/10.3390/ani11123451