
Transcriptomics Analysis Reveals the Immune Response Mechanism of Rabbits with Diarrhea Fed an Antibiotic-Free Diet

 , and
, and 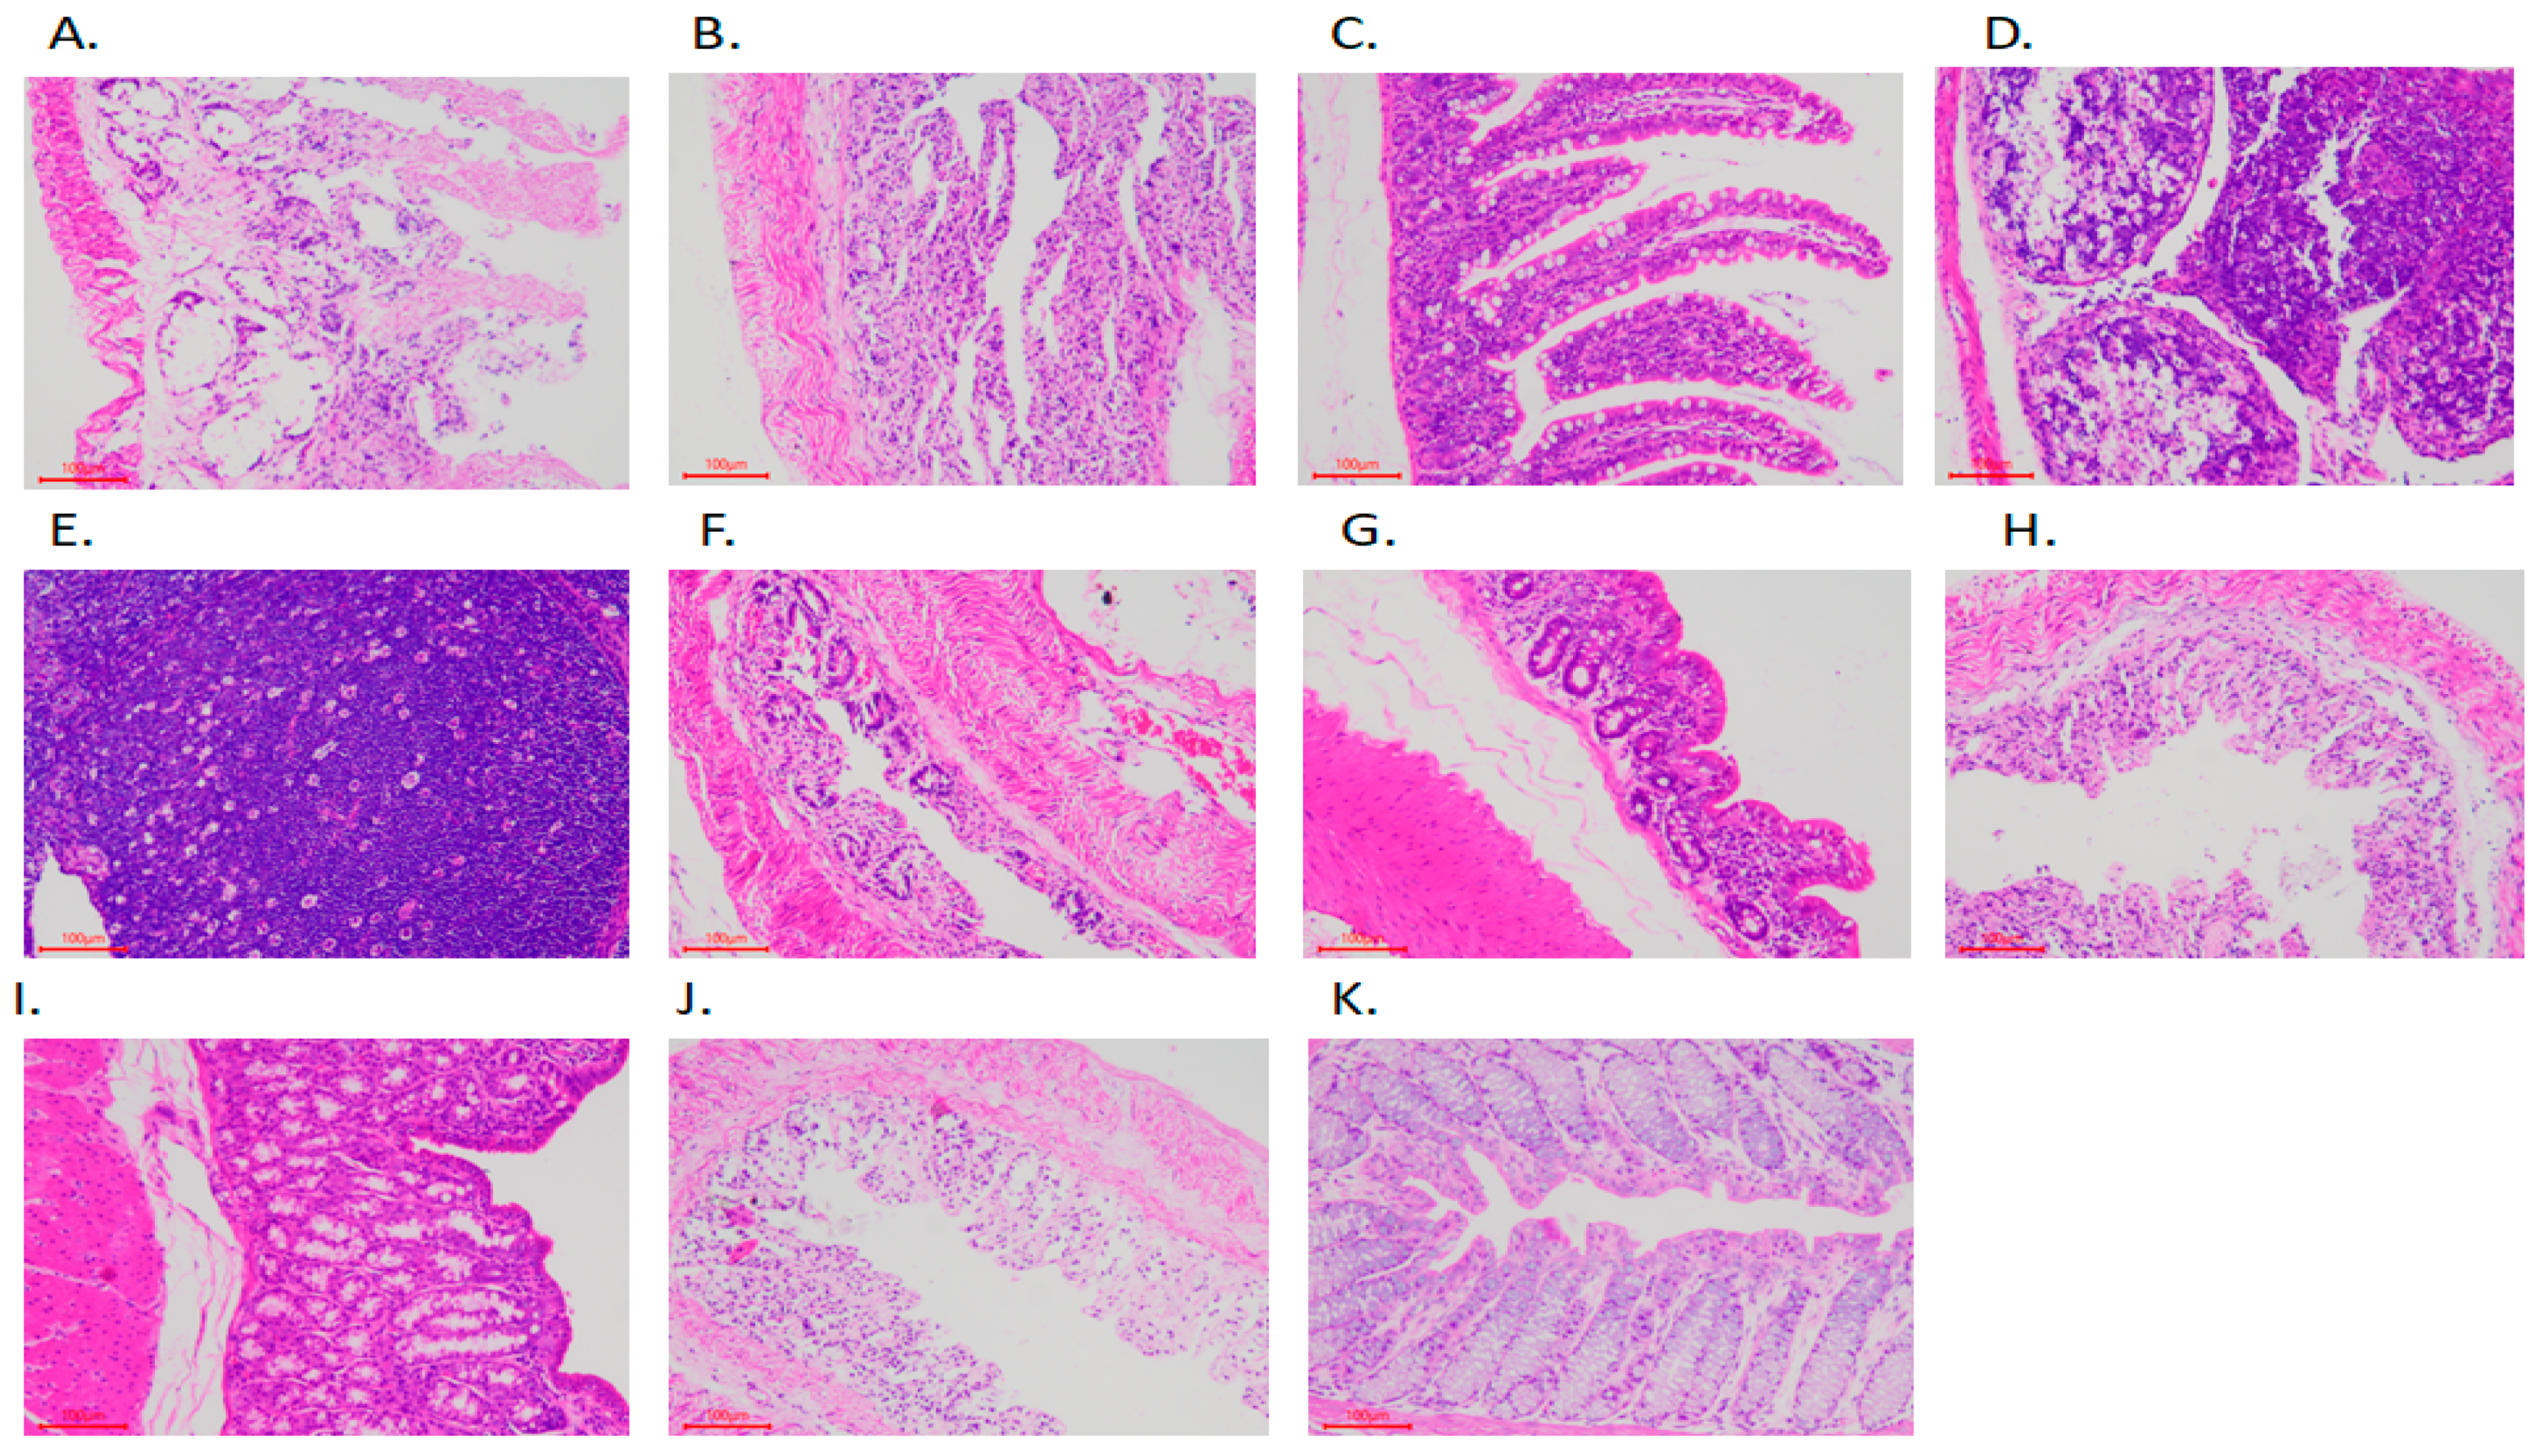
Abstract
:Simple Summary
Abstract
1. Introduction
2. Materials and Methods
2.1. Ethics Statement
2.2. Animals
2.3. Collection of Rabbit Intestinal Tissue Samples
2.4. Morphological Section Analysis of Rabbit Intestine
2.5. RNA Extraction, cDNA Library Construction, and Sequencing
2.6. RNA-Seq Data Analyses
3. Results
3.1. Rabbit Intestinal Tissue Section
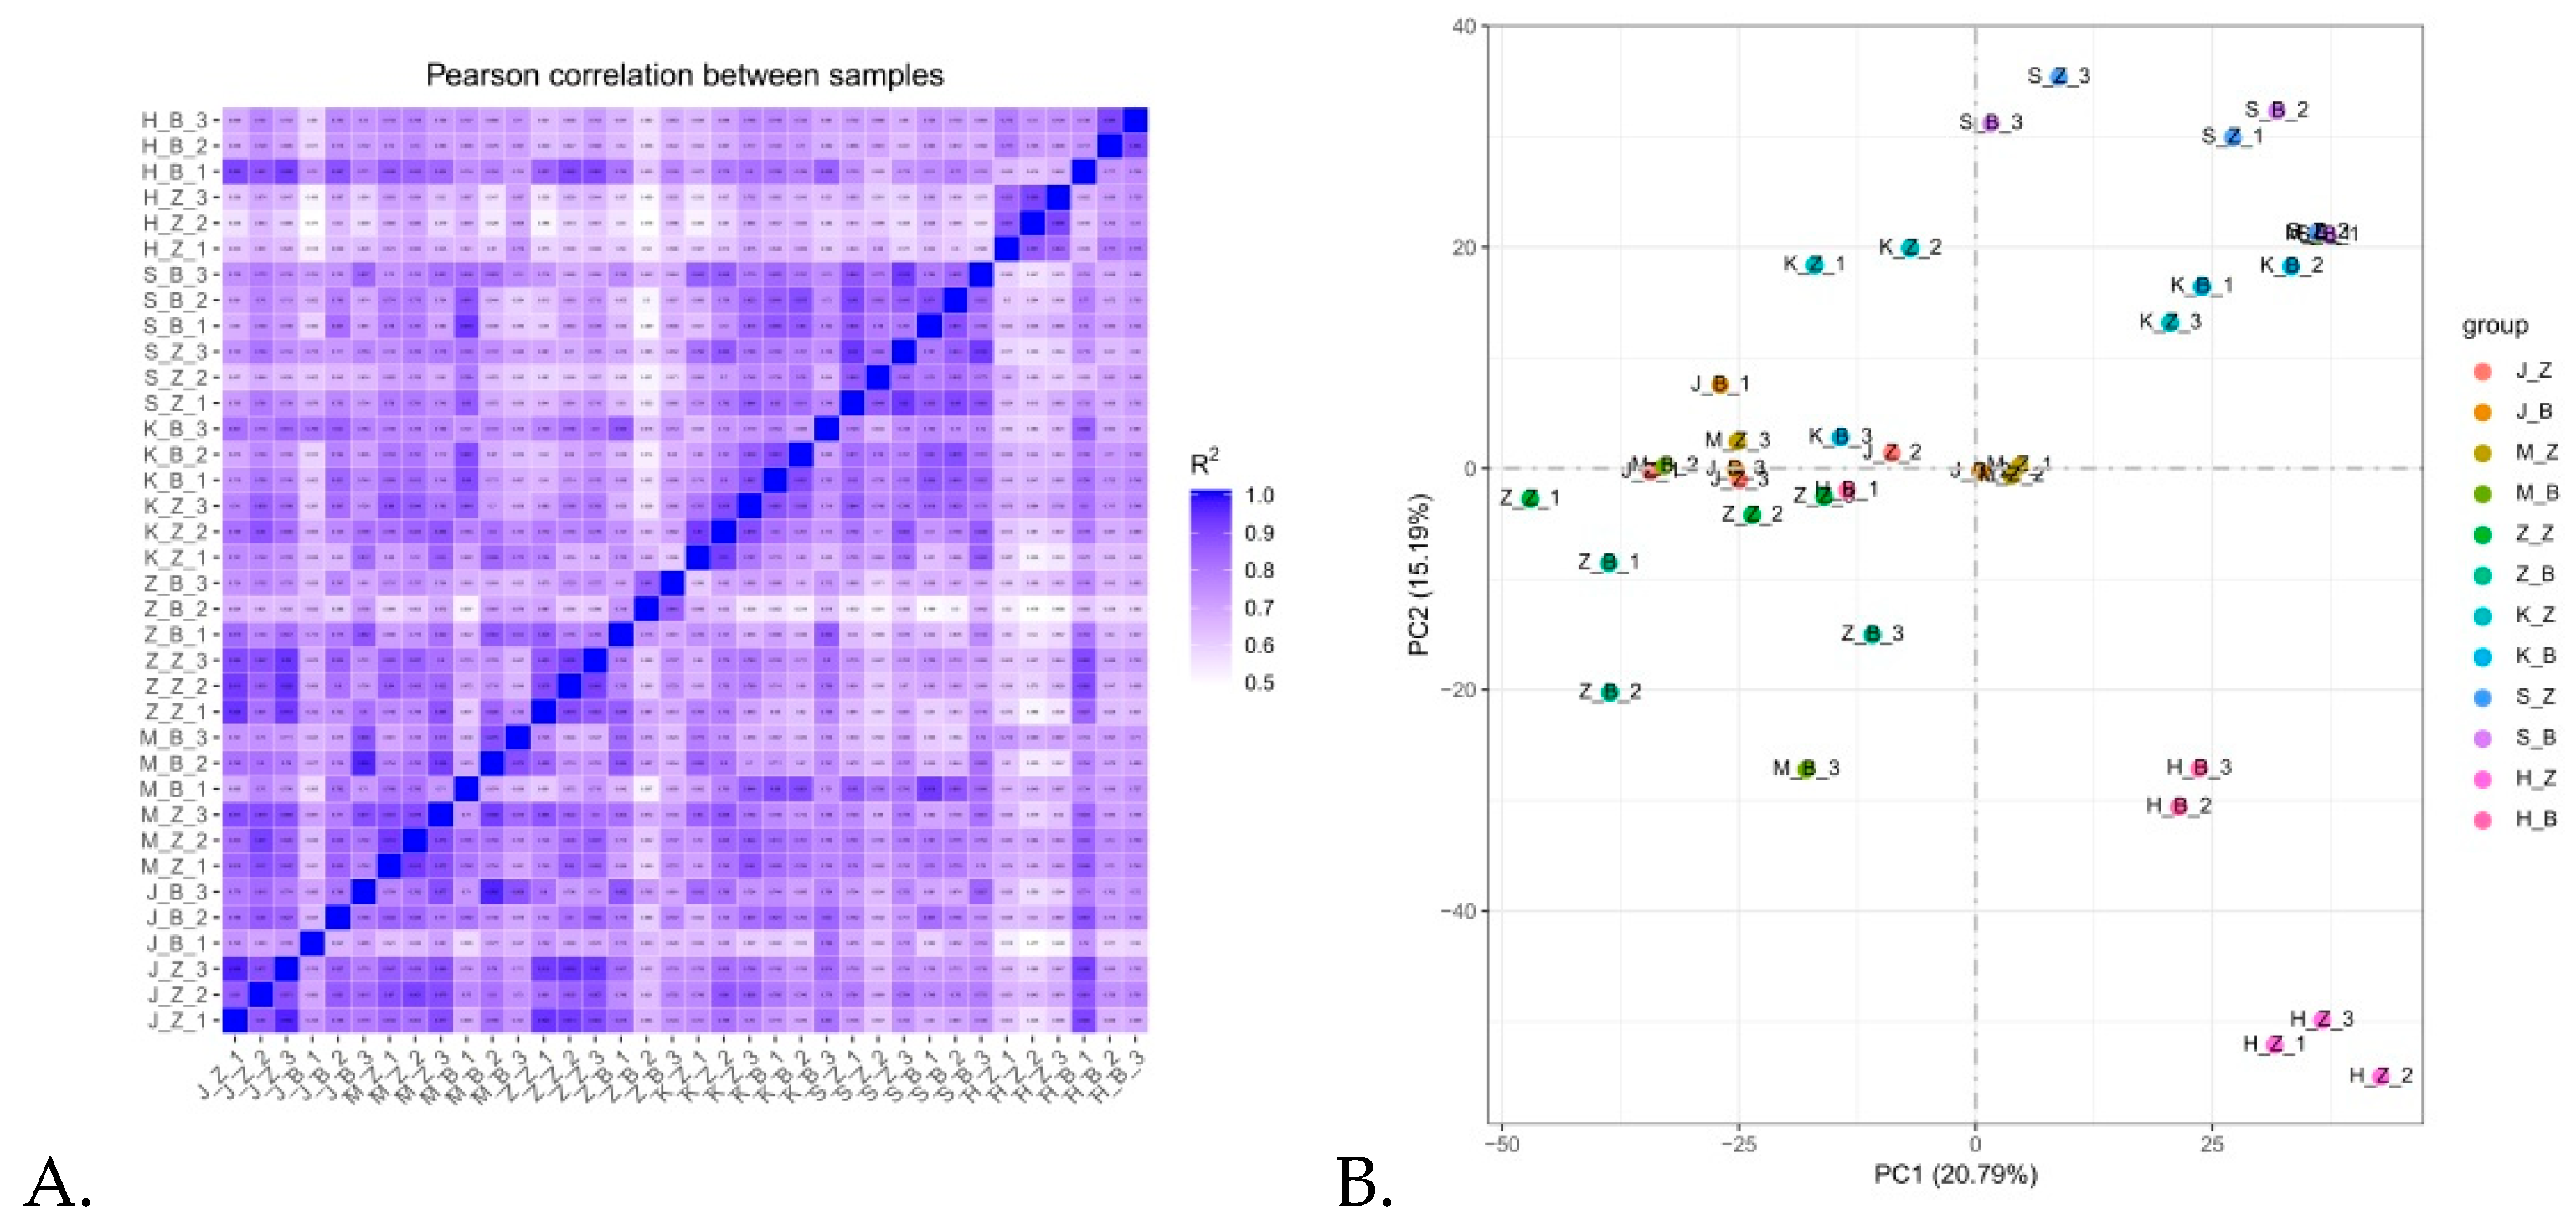
3.2. Correlation Analysis among Samples and Principal Component Analysis
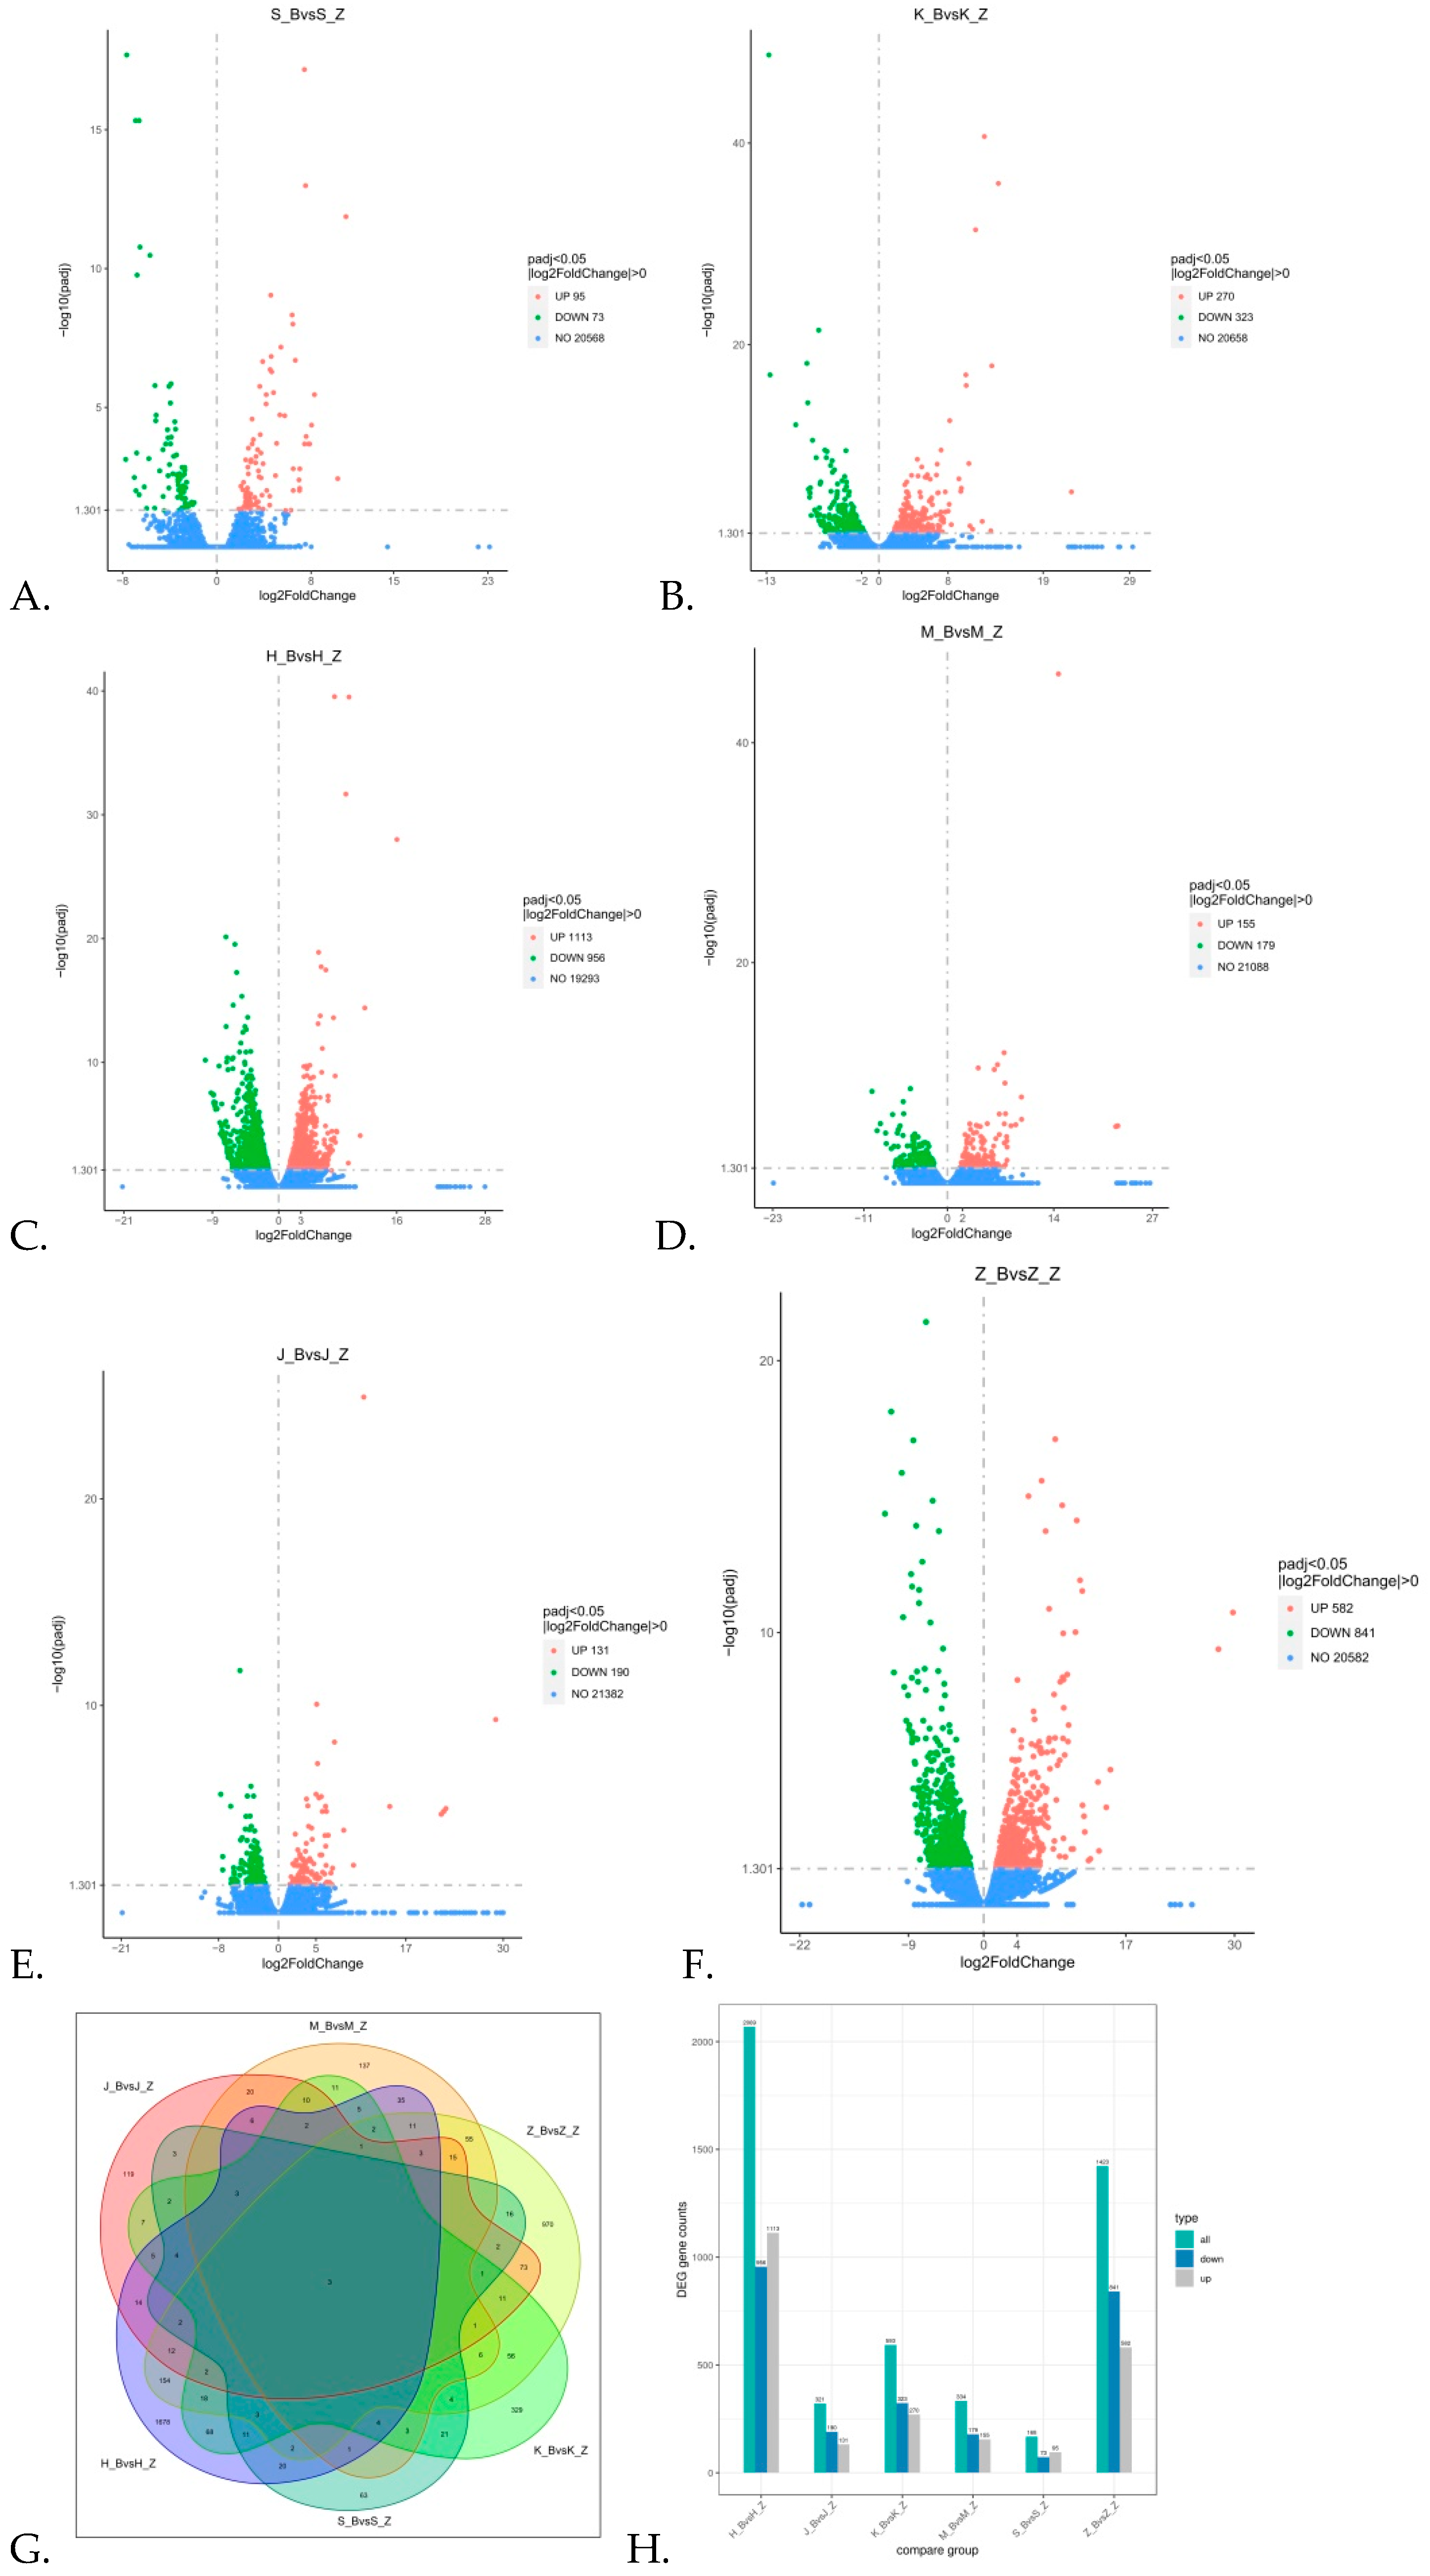
3.3. Differential Expression of Genes in Rabbits with Diarrhea
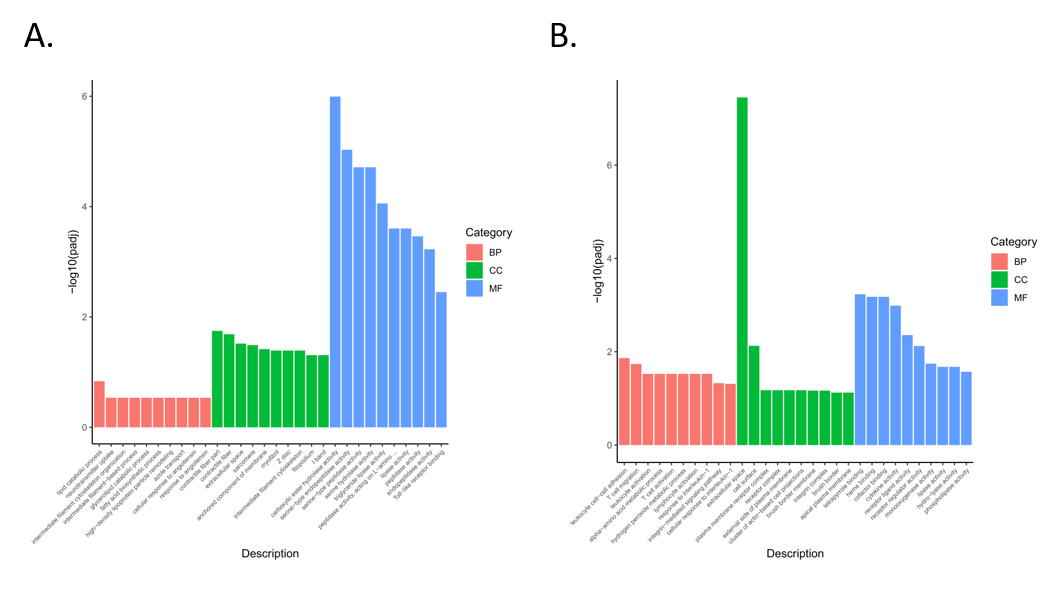
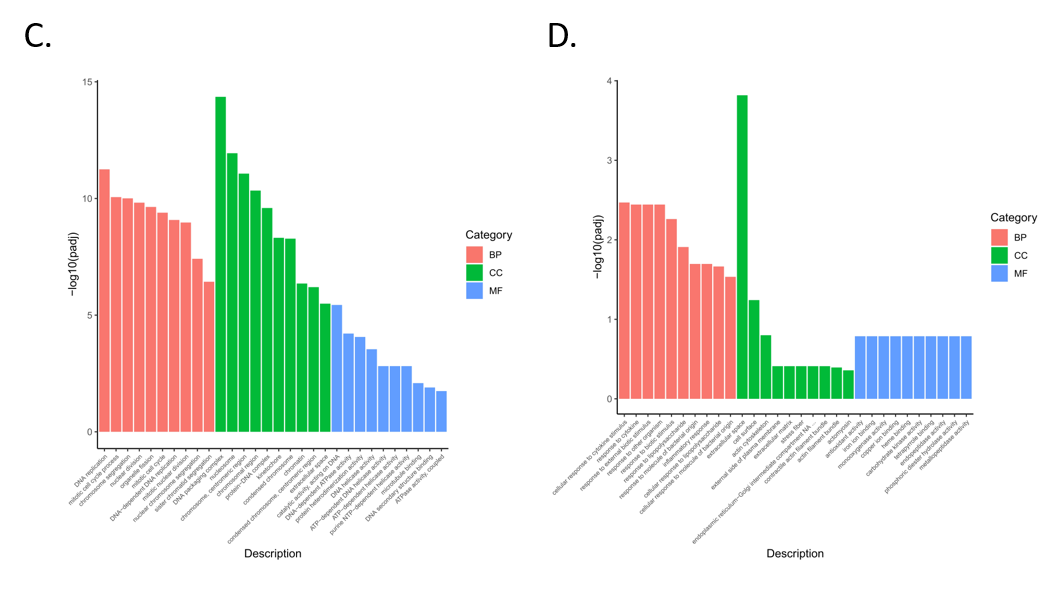
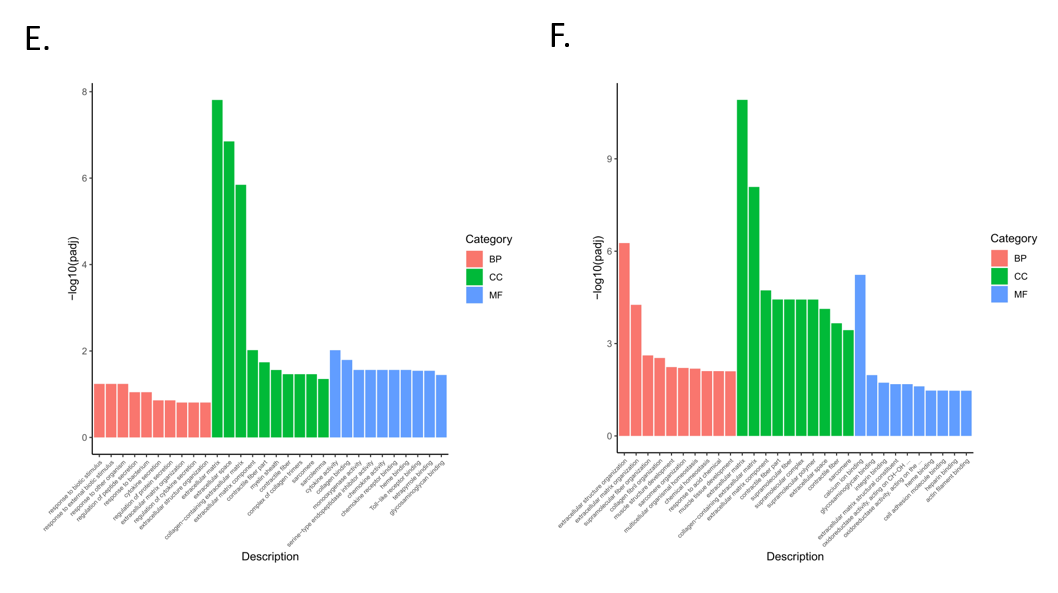
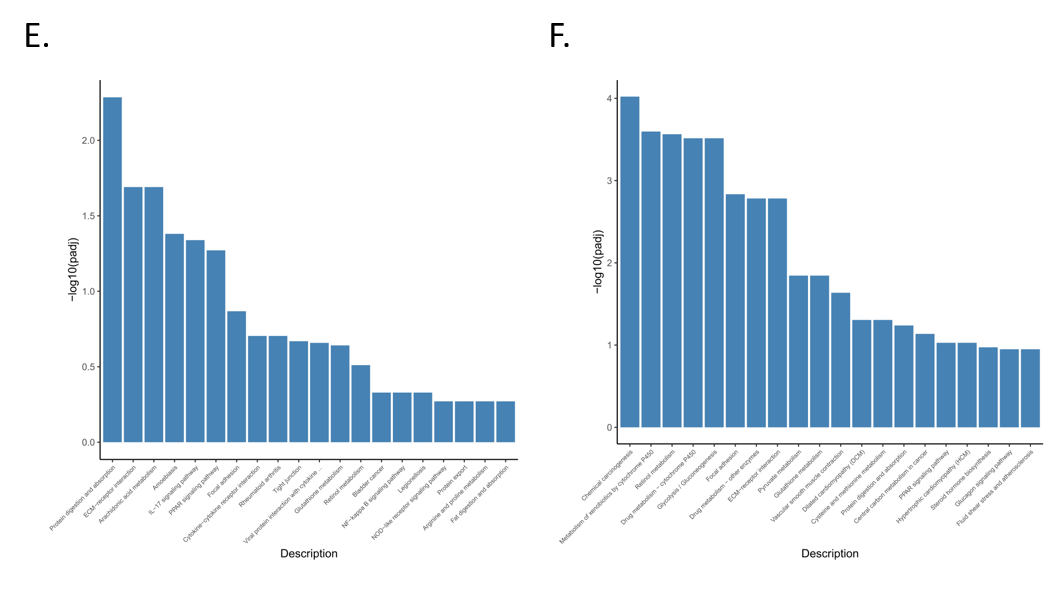
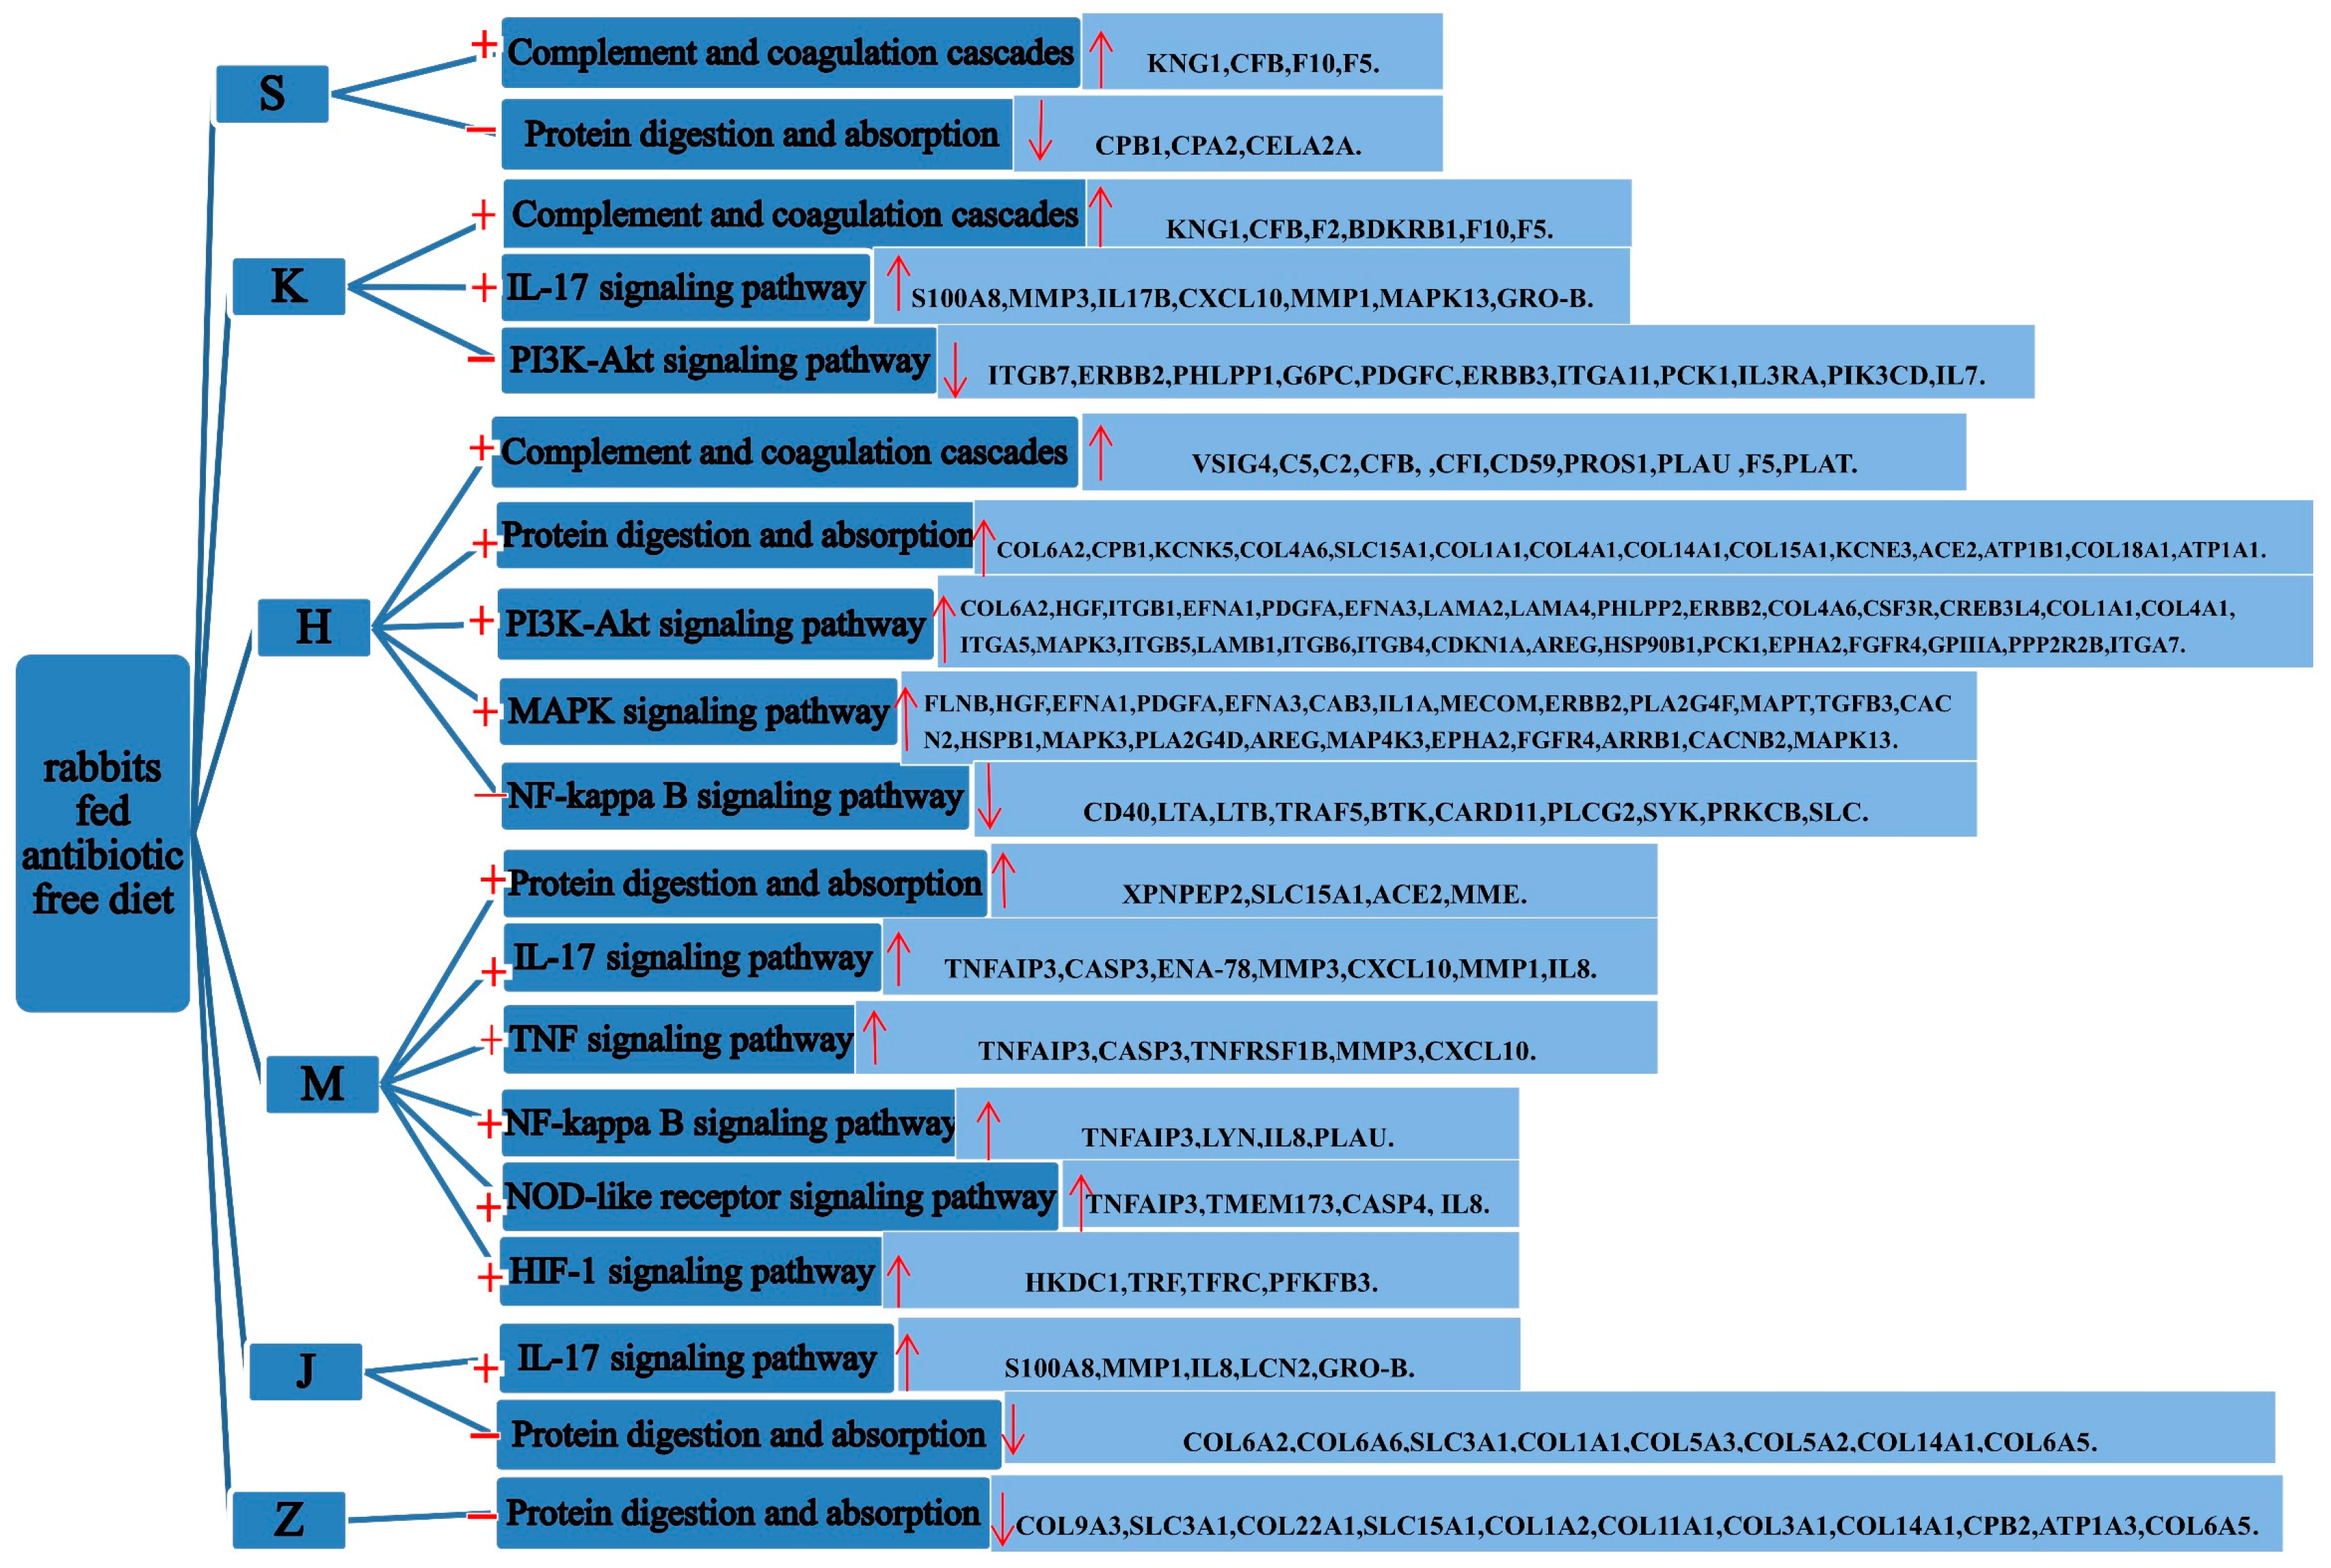
3.4. Functional Enrichment Analysis of Differentially Expressed Genes
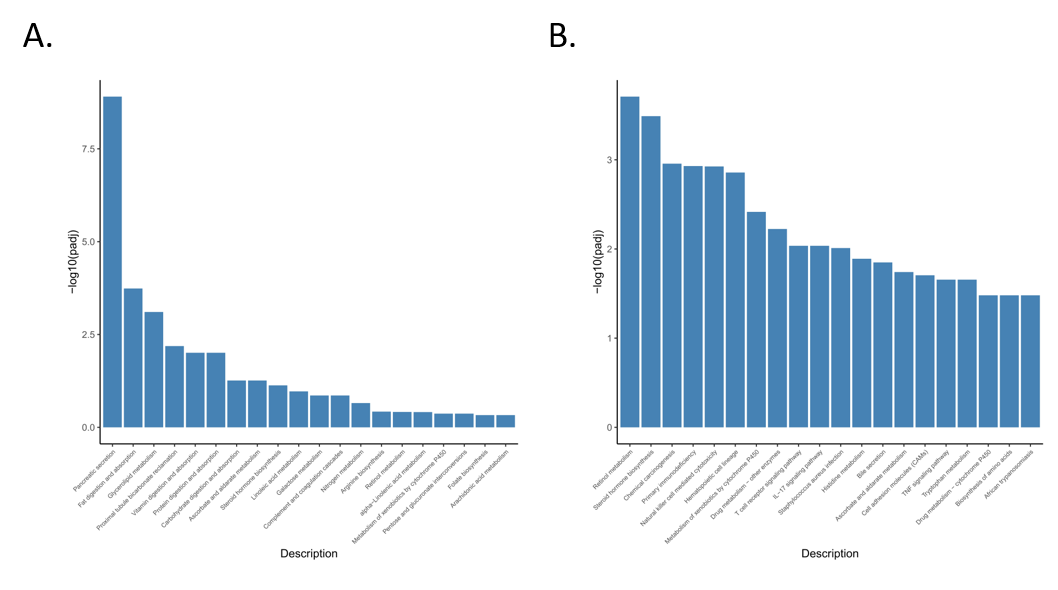
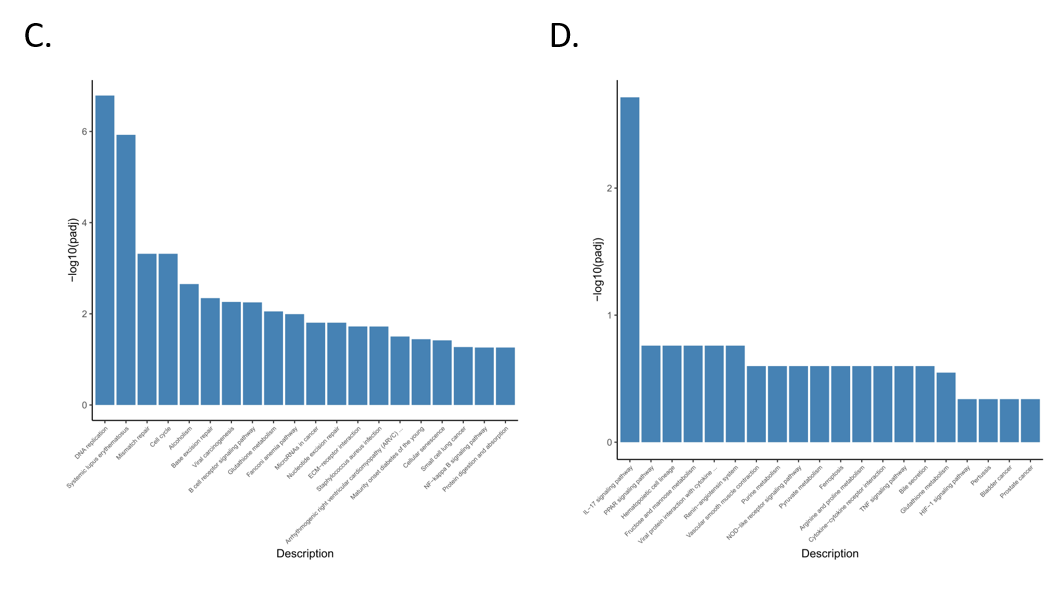
3.5. Enrichment Analysis of GO and KEGG Pathway
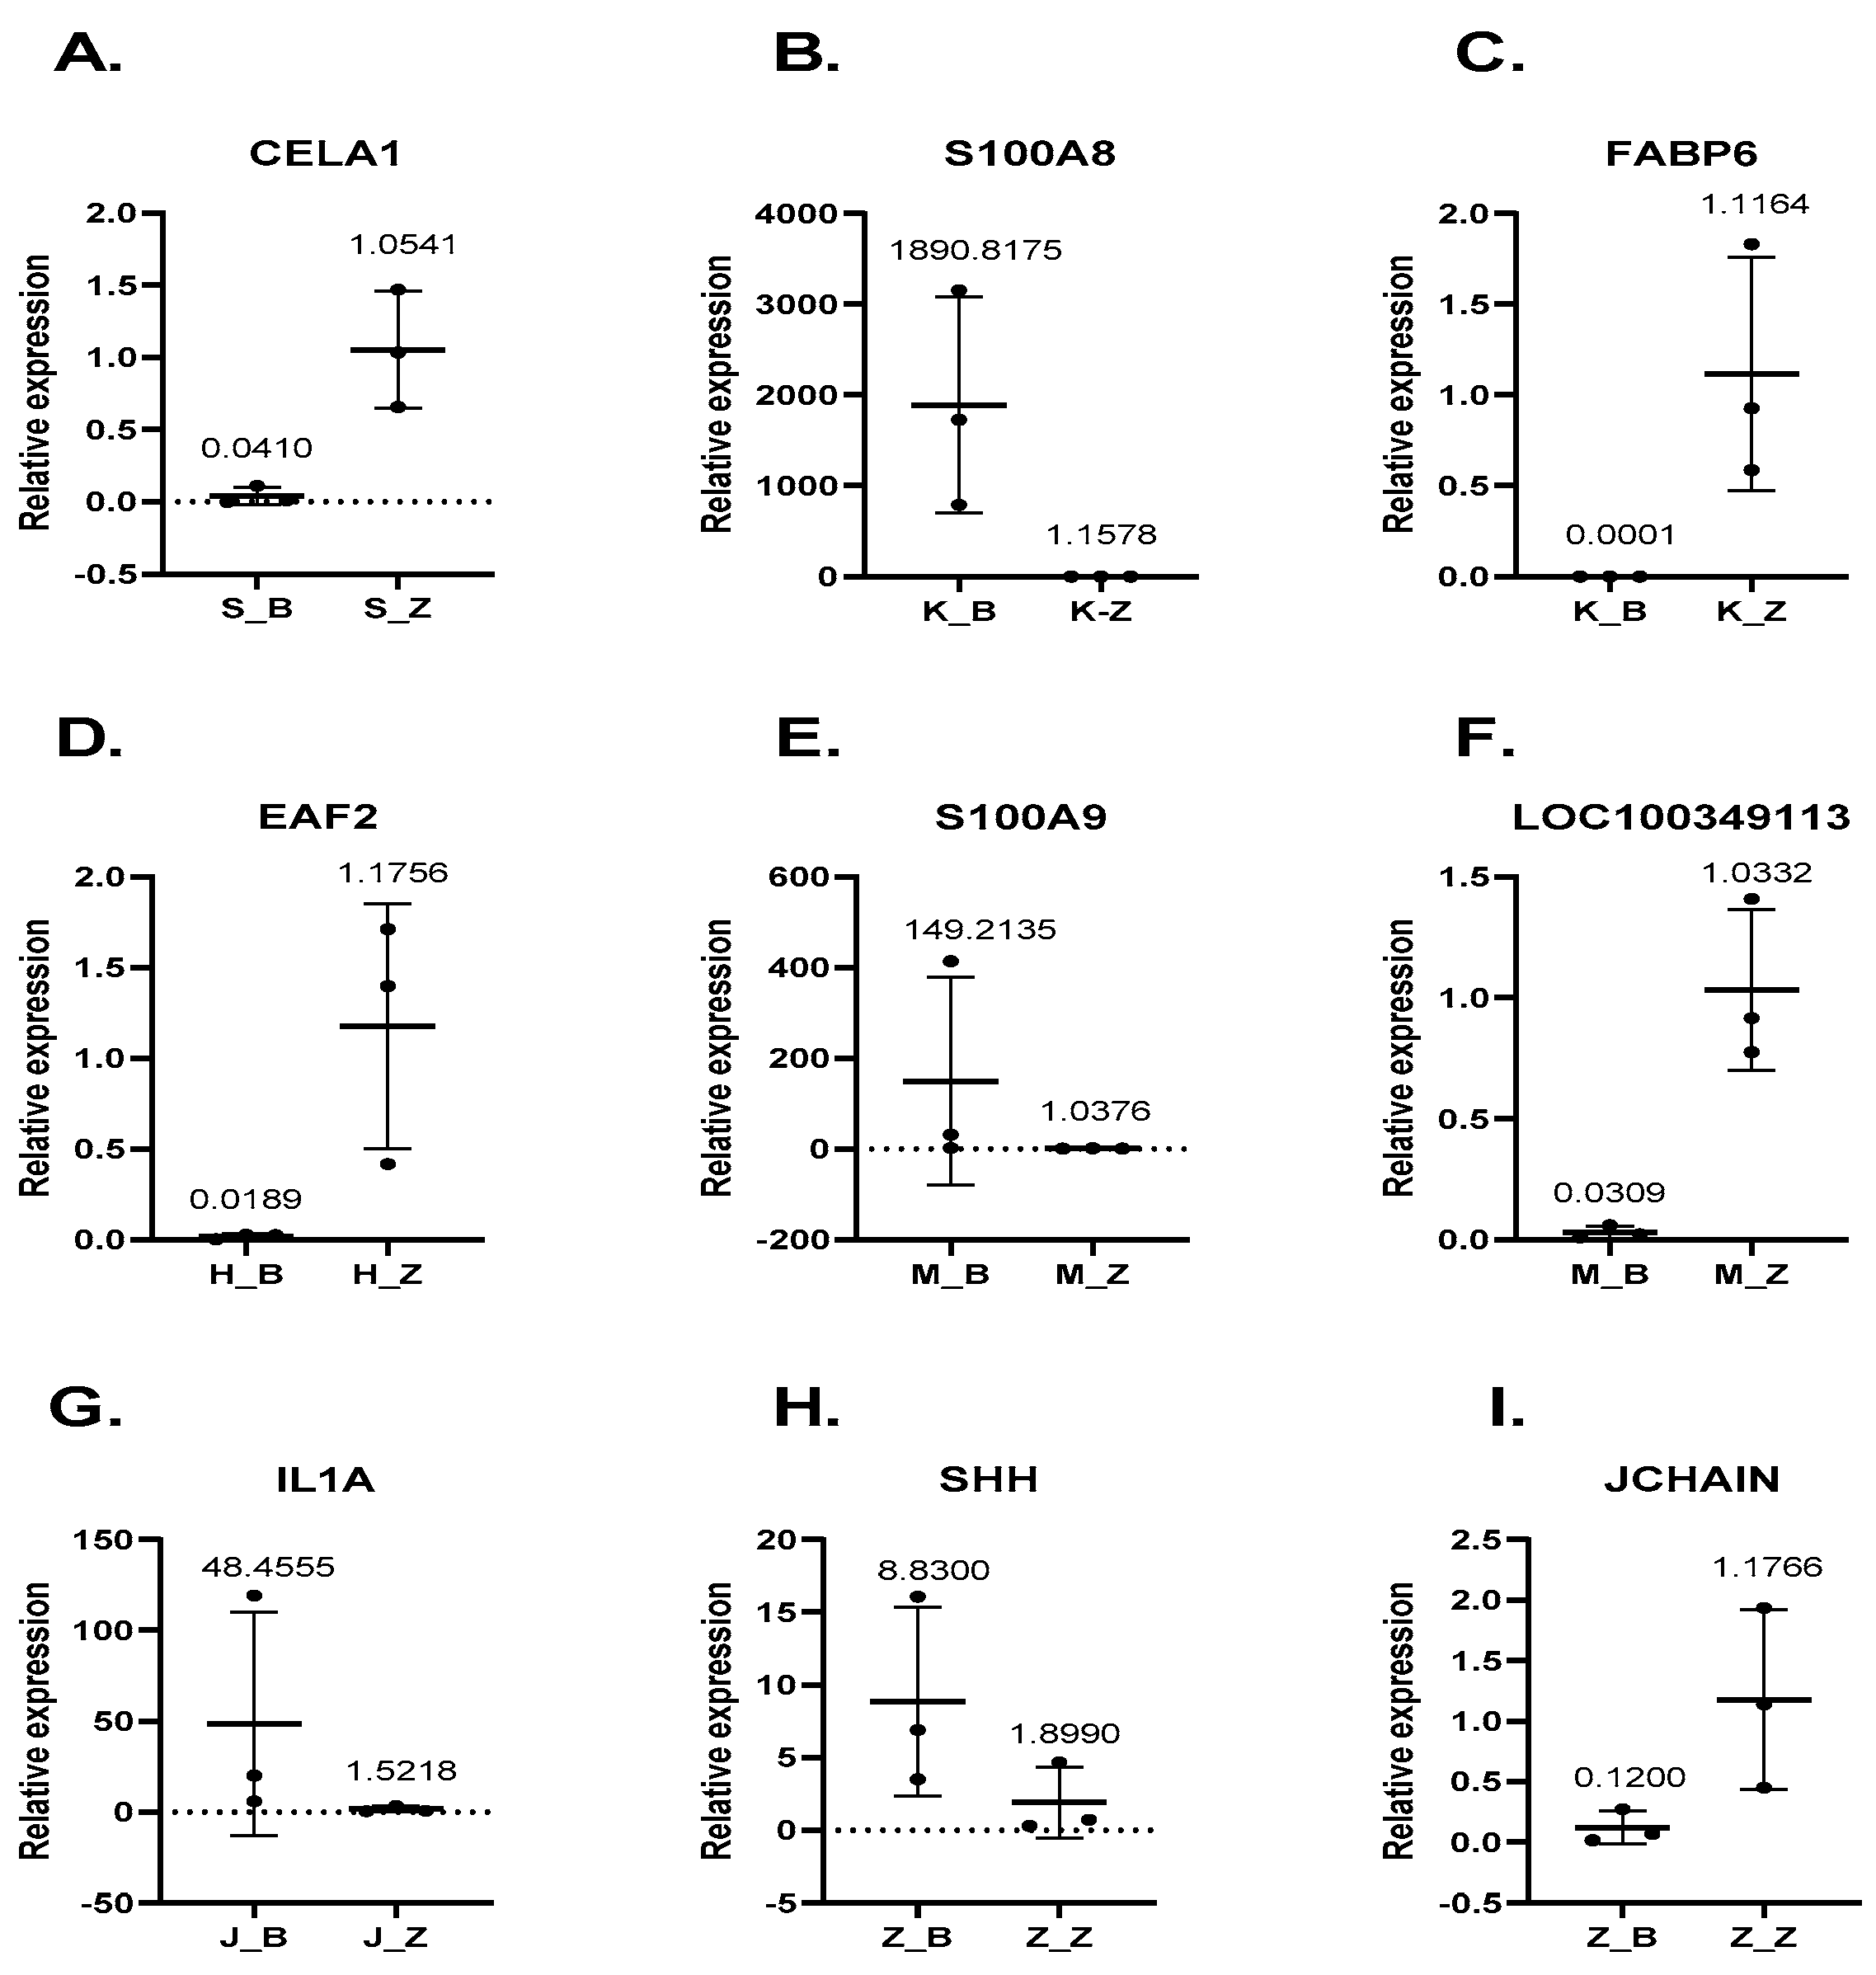
3.6. Gene Expression Levels Are Consistent in Both qRT-PCR and RNA-Seq
4. Discussion
5. Conclusions
Supplementary Materials
Author Contributions
Funding
Institutional Review Board Statement
Data Availability Statement
Conflicts of Interest
References
- Rosen, G.D. Antibacterials in Poultry And Pig Nutrition. City: Biotechnology in Animal Feeds and Animal Feeding. 2007. Available online: https://xueshu.baidu.com/usercenter/paper/show?paperid=e831e3a2036244c8207aa42278c3e699&site=xueshu_se (accessed on 10 March 2020).
- Danzeisen, J.L.; Kim, H.B.; Isaacson, R.E.; Tu, Z.J.; Johnson, T.J.; Parkinson, J. Modulations of the Chicken Cecal Microbiome and Metagenome in Response to Anticoccidial and Growth Promoter Treatment. PLoS ONE 2011, 6, e27949. [Google Scholar] [CrossRef] [PubMed]
- Low, C.X.; Tan, T.H.; Mutalib, N.S.A.; Pusparajah, P.; Lee, L.H. Unveiling the Impact of Antibiotics and Alternative Methods for Animal Husbandry: A Review. Antibiotics 2021, 10, 578. [Google Scholar] [CrossRef] [PubMed]
- Gorbach, S.L. Antimicrobial use in animal feed—Time to stop. N. Engl. J. Med. 2001, 345, 1202–1203. [Google Scholar] [CrossRef] [PubMed]
- Kjeld, P.V. Alliance for the Prudent Use of Antibiotics. 2011. Available online: https://www.bookdepository.com/Alliance-for-Prudent-Use-Antibiotics-Pollux-Variste-Kjeld/9786135810288 (accessed on 8 October 2021).
- Mark, C.; Christian, F.; Enric, M.; McMullin, P.; Phillips, I. The European ban on growth-promoting antibiotics and emerging consequences for human and animal health. J. Antimicrob. Chemother. 2003, 52, 159–161. [Google Scholar]
- Callaway, T.R.; Lillehoj, H.; Chuanchuen, R.; Gay, C.G. Alternatives to Antibiotics: A Symposium on the Challenges and Solutions for Animal Health and Production. Antibiotics 2021, 10, 471. [Google Scholar] [CrossRef]
- Drouin, E. Helicobacter pylori: Novel Therapies. Can. J. Gastroenterol. 1999, 13, 581–583. [Google Scholar] [CrossRef] [Green Version]
- Rosea, N.; Beaudeaub, F.; Drouina, P.; Touxa, J.Y.; Rosea, V.; Colina, P. Risk factors for Salmonella enterica subsp. enterica contamination in French broiler-chicken flocks at the end of the rearing period. Prev. Vet. Med. 1999, 39, 265. [Google Scholar] [CrossRef]
- Lovland, A.; Kaldhusdal, M. Severely impaired production performance in broiler flocks with high incidence of Clostridium perfringens-associated hepatitis. Avian Pathol. 2001, 30, 73–81. [Google Scholar] [CrossRef]
- Jensen, G.B.; Hansen, B.M.; Eilenberg, J.; Mahillon, J. The hidden lifestyles of Bacillus cereus and relatives. Environ. Microbiol. 2003, 5, 631–640. [Google Scholar] [CrossRef]
- Zorn, A.M.; Wells, J.M. Vertebrate Endoderm Development and Organ Formation. Annu. Rev. Cell Dev. Biol. 2009, 1, 221–251. [Google Scholar] [CrossRef] [Green Version]
- Peterson, L.W.; Artis, D. Intestinal epithelial cells: Regulators of barrier function and immune homeostasis. Nat. Rev. Immunol. 2014, 14, 141–153. [Google Scholar] [CrossRef] [PubMed]
- Tremaroli, V.; Backhed, F. Functional interactions between the gut microbiota and host metabolism. Nature 2012, 489, 242–249. [Google Scholar] [CrossRef] [PubMed]
- Murphy, K.G.; Bloom, S.R.; Murphy, K.G.; Bloom, S.R. Gut hormones and the regulation of energy homeostasis. Nature 2007, 444, 854–859. [Google Scholar] [CrossRef] [PubMed]
- Sanger, G.J.; Lee, K. Hormones of the gut-brain axis as targets for the treatment of upper GI disorders. Nat. Rev. Drug Discov. 2008, 7, 241–254. [Google Scholar] [CrossRef] [PubMed]
- Wang, L.; Zhou, X.; Gastroenterology, D.O. Intestinal flora, intestinal mucosal immunity and the related intestinal diseases: Research progress. Chin. J. Microecol. 2017, 29, 494–497. [Google Scholar]
- Agersø, Y.; Andersen, V.D.; Helwigh, B.; Høg, B.B.; Jensen, L.B.; Jensen, V.F.; Korsgaard, H.; Larsen, L.S.; Seyfarth, A.M.; Struve, T. DANMAP 2012: Use of antimicrobial agents and occurrence of antimicrobial resistance in bacteria from food animals, food and humans in Denmark. J. Veg. Sci. 2012, 9, 797–804. [Google Scholar]
- Carabano, R.; Badiola, I.; Chamorro, S.; Garcia, J.; de Blas, J.C. New trends in rabbit feeding: Influence of nutrition on intestinal health. A review. Span. J. Agric. Res. 2008, 6, 15–25. [Google Scholar] [CrossRef] [Green Version]
- Beltz, K.M.; Rosales, M.M.; Morales, E. Histological and ultrastructural findings in commercial bred rabbits exhibiting severe diarrhea. Scand. J. Lab. Anim. Ence 2005, 32, 243–250. [Google Scholar]
- Fann, M.K. Normal bacterial flora of the rabbit gastrointestinal tract: A clinical approach. Semin. Avian Exot. Pet Med. 2001, 10, 45–47. [Google Scholar] [CrossRef]
- Tang, T.; Li, Y.; Wang, J.; Elzo, M.A.; Lai, S. Untargeted Metabolomics Reveals Intestinal Pathogenesis and Self-Repair in Rabbits Fed an Antibiotic-Free Diet. Animals 2021, 11, 1560. [Google Scholar] [CrossRef]
- Parkhomchuk, D.; Borodina, T.; Amstislavskiy, V.; Banaru, M.; Soldatov, A. Transcriptome analysis by strand-specific sequencing of complementary DNA. Nucleic Acids Res. 2009, 37, e123. [Google Scholar] [CrossRef] [PubMed] [Green Version]
- Pertea, M.; Pertea, G.M.; Antonescu, C.M.; Chang, T.C.; Mendell, J.T.; Salzberg, S.L. StringTie enables improved reconstruction of a transcriptome from RNA-seq reads. Nat. Biotechnol. 2015, 33, 290–295. [Google Scholar] [CrossRef] [PubMed] [Green Version]
- Love, M.I.; Huber, W.; Anders, S. Moderated estimation of fold change and dispersion for RNA-seq data with DESeq2. Genome Biol. 2014, 15, 550. [Google Scholar] [CrossRef] [Green Version]
- Mortazavi, A.; Williams, B.A.; McCue, K.; Schaeffer, L. Mapping and quantifying mammalian transcriptomes by RNA-Seq. Nature 2008, 5, 621–628. [Google Scholar] [CrossRef]
- Gao, T.; Chongyang, H.; Jiaye, C.; Chen, B.; Shi, Y.; Zhi, F. An IRF1-dependent pathway of TNFα-induced shedding in intestinal epithelial cells. J. Crohns Colitis 2021, jjab134. [Google Scholar] [CrossRef]
- Mathan, M.M.; Mathan, V.I. Morphology of rectal mucosa of patients with shigellosis. Rev. Infect. Dis. 1991, 13, S314–S318. [Google Scholar] [CrossRef]
- Anand, B.S.; Malhotra, V.; Bhattacharya, S.K.; Datta, P.; Datta, D.; Sen, D.; Bhattacharya, M.K.; Mukherjee, P.P.; Pal, S.C. Rectal histology in acute bacillary dysentery. Gastroenterology 1986, 90, 654. [Google Scholar] [CrossRef]
- Crowley, S.M.; Allaire, J.M.; Han, X.; Graef, F.A.; Stahl, M.; Knodler, L.; Vallance, B. A46 the inflammatory caspases coordinate mucosal restriction of salmonella through the epithelial-intrinsic inflammasome and il-22 driven mucin secretion. J. Can. Assoc. Gastroenterol. 2020, 54–55. [Google Scholar] [CrossRef] [Green Version]
- Krem, M.M.; Cera, E. Evolution of enzyme cascades from embryonic development to blood coagulation. Trends Biochem. Sci. 2002, 27, 67–74. [Google Scholar] [CrossRef]
- Dodds, A.W. Which came first, the lectin/classical pathway or the alternative pathway of complement? Immunobiology 2002, 205, 340–354. [Google Scholar] [CrossRef]
- Iwanaga, S. The molecular basis of innate immunity in the horseshoe crab. Curr. Opin. Immunol. 2002, 14, 87–95. [Google Scholar] [CrossRef]
- Ricklin, D.; Hajishengallis, G.; Yang, K.; Lambris, J.D. Complement: A key system for immune surveillance and homeostasis. Nat. Immunol 2010, 11, 785–797. [Google Scholar] [CrossRef] [PubMed] [Green Version]
- Matsumoto, M.; Fukuda, W.; Circolo, A.; Goellner, J.; Strauss-Schoenberger, J.; Wang, X.; Fujita, S.; Hidvegi, T.; Chaplin, D.D.; Colten, H.R. Abrogation of the alternative complement pathway by targeted deletion of murine factor B. Proc. Natl. Acad. Sci. USA 1997, 94, 8720–8725. [Google Scholar] [CrossRef] [PubMed] [Green Version]
- Williams, J.A.; Stampoulis, D.; Gunter, C.E.; John, G.; Peter, A.; Moss, S.E.; Thomas, L. Regulation of C3 Activation by the Alternative Complement Pathway in the Mouse Retina. PLoS ONE 2016, 11, e0161898. [Google Scholar]
- Campagne, M.V.L.; Wiesmann, C.; Brown, E.J. Macrophage complement receptors and pathogen clearance. Cell. Microbiol. 2007, 9, 2095–2102. [Google Scholar] [CrossRef]
- Flierman, R.; Daha, M.R. The clearance of apoptotic cells by complement. Immunobiology 2007, 212, 363–370. [Google Scholar] [CrossRef]
- Trouw, L.A.; Blom, A.M.; Gasque, P. Role of complement and complement regulators in the removal of apoptotic cells. Mol. Immunol. 2008, 45, 1199–1207. [Google Scholar] [CrossRef]
- Zhu, Y.; Wang, C.; Wang, X.; Li, B.; Li, F. Effect of dietary fiber/starch balance on the cecal proteome of growing rabbits. J. Proteom. 2014, 103, 23–34. [Google Scholar] [CrossRef]
- Zheng, W.; Kuhlicke, J.; Jäckel, K.; Eltzschig, H.K.; Singh, A.; Sjoblom, M.; Riederer, B.; Weinhold, C.; Seidler, U.; Colgan, S.P. Hypoxia inducible factor-1 (HIF-1)-mediated repression of cystic fibrosis transmembrane conductance regulator (CFTR) in the intestinal epithelium. FASEB J. 2009, 23, 204–213. [Google Scholar] [CrossRef] [Green Version]
- Lendahl, U.; Lee, K.L.; Yang, H.; Poellinger, L. Generating specificity and diversity in the transcriptional response to hypoxia. Nat. Rev. Genet. 2009, 10, 821–832. [Google Scholar] [CrossRef]
- Schröder, J.; Wardelmann, E.; Winkler, W.; Faendrich, F.; Schweizer, P. Glutamine dipeptide-supplemented parenteral nutrition reverses gut atrophy, disaccharidase enzyme activity, and absorption in rats. JPEN J. Parenter Enter. Nutr. 1995, 19, 502–506. [Google Scholar] [CrossRef]
- Zhen, Y.; Chu, C.; Zhou, S.; Qi, M.; Shu, R. Imbalance of tumor necrosis factor-α, interleukin-8 and interleukin-10 production evokes barrier dysfunction, severe abdominal symptoms and psychological disorders in patients with irritable bowel syndrome-associated diarrhea. Mol. Med. Rep. 2015, 12, 5239–5245. [Google Scholar] [CrossRef] [Green Version]
- Korn, T.; Bettelli, E.; Oukka, M.; Kuchroo, V.K. IL-17 and Th17 Cells. Annu. Rev. Immunol. 2009, 8, 485–517. [Google Scholar] [CrossRef]
- Shen, F.; Gaffen, S.L. Structure-function relationships in the IL-17 receptor: Implications for signal transduction and therapy. Cytokine 2008, 41, 92–104. [Google Scholar] [CrossRef] [PubMed] [Green Version]
- Ogura, H.; Murakami, M.; Okuyama, Y.; Tsuruoka, M. Interleukin-17 promotes autoimmunity by triggering a positive-feedback loop via interleukin-6 induction. Immunity 2008, 29, 628–636. [Google Scholar] [CrossRef] [Green Version]
- Onishi, R.M.; Gaffen, S.L. Interleukin-17 and its target genes: Mechanisms of interleukin-17 function in disease. Immunology 2010, 129, 311–321. [Google Scholar] [CrossRef] [PubMed]
- Fritz, J.H.; Ferrero, R.L.; Philpott, D.J.; Travassos, L.H. Nod-like proteins in immunity, inflammation and disease. Nat. Immunol. 2006, 7, 1250–1257. [Google Scholar] [CrossRef]
- Li, X.Q.; Zhu, Y.H.; Zhang, H.F.; Yue, Y.; Cai, Z.X.; Lu, Q.P.; Zhang, L.; Weng, X.G.; Zhang, F.J.; Zhou, D. Risks associated with high-dose Lactobacillus rhamnosus in an Escherichia coli model of piglet diarrhoea: Intestinal microbiota and immune imbalances. PLoS ONE 2012, 7, e40666. [Google Scholar] [CrossRef]
- Bradley, J.R. TNF-mediated inflammatory disease. J. Pathol. 2008, 214, 149–160. [Google Scholar] [CrossRef]
- Horiuchi, T.; Mitoma, H.; Harashima, S.; Hiroshi, T.; Terufumi, S. Transmembrane TNF-alpha: Structure, function and interaction with anti-TNF agents. Rheumatology 2010, 49, 1215–1228. [Google Scholar] [CrossRef] [Green Version]
- Barnabe, C.; Martin, B.J.; Ghali, W.A. Systematic review and meta-analysis: Anti-tumor necrosis factor α therapy and cardiovascular events in rheumatoid arthritis. Arthritis Care Res. 2011, 63, 522–529. [Google Scholar] [CrossRef]
- Wang, H.; Bloom, O.; Zhang, M.; Jaideep, M.V.; Ombrellino, M.; Che, J.; Frazier, A.; Yang, H.; Ivanova, S.; Borovikova, L.; et al. HMG-1 as a late mediator of endotoxin lethality in mice. Science 1999, 285, 248–251. [Google Scholar] [CrossRef]
- Wang, L.; Qiao, X.; Zhang, S.; Qin, Y.; Guo, T. Porcine transmissible gastroenteritis virus nonstructural protein 2 contributes to inflammation via NF-κB activation. Virulence 2018, 9, 1685–1698. [Google Scholar] [CrossRef] [PubMed] [Green Version]
- Wei, J.; Feng, J. Signaling pathways associated with inflammatory bowel disease. Recent Pat. Inflamm. Allergy Drug Discov. 2010, 4, 105–117. [Google Scholar] [CrossRef] [PubMed]
- Hawkins, P.T.; Anderson, K.E.; Davidson, K.; Stephens, L.R. Signalling through Class I PI3Ks in mammalian cells. Biochem. Soc. Trans. 2006, 34, 647–662. [Google Scholar] [CrossRef] [PubMed] [Green Version]
- Lindemans, C.A.; Coffer, P.J. Regulation of granulocyte apoptosis by phosphatidylinositol 3-kinase. Biochem. Soc. Trans. 2004, 32, 480–484. [Google Scholar] [CrossRef]
- Yang, K.Y.; Arcaroli, J.; Kupfner, J.; Pitts, T.M.; Park, J.S.; Strasshiem, D.; Perng, R.; Abraham, E. Involvement of phosphatidylinositol 3-kinase gamma in neutrophil apoptosis. Cell Signal. 2003, 15, 225–233. [Google Scholar] [CrossRef]
- Cowburn, A.S.; Deighton, J.; Walmsley, S.R.; Chilvers, E.R. The survival effect of TNF-alpha in human neutrophils is mediated via NF-kappa B-dependent IL-8 release. Eur. J. Immunol. 2004, 34, 1733–1743. [Google Scholar] [CrossRef]


Publisher’s Note: MDPI stays neutral with regard to jurisdictional claims in published maps and institutional affiliations. |
© 2021 by the authors. Licensee MDPI, Basel, Switzerland. This article is an open access article distributed under the terms and conditions of the Creative Commons Attribution (CC BY) license (https://creativecommons.org/licenses/by/4.0/).
Share and Cite
Chen, L.; Du, K.; Bai, X.; Shao, J.; Tang, T.; Xia, S.; Fan, H.; Wang, J.; Jia, X.; Lai, S. Transcriptomics Analysis Reveals the Immune Response Mechanism of Rabbits with Diarrhea Fed an Antibiotic-Free Diet. Animals 2021, 11, 2994. https://doi.org/10.3390/ani11102994
Chen L, Du K, Bai X, Shao J, Tang T, Xia S, Fan H, Wang J, Jia X, Lai S. Transcriptomics Analysis Reveals the Immune Response Mechanism of Rabbits with Diarrhea Fed an Antibiotic-Free Diet. Animals. 2021; 11(10):2994. https://doi.org/10.3390/ani11102994
Chicago/Turabian StyleChen, Li, Kun Du, Xue Bai, Jiahao Shao, Tao Tang, Siqi Xia, Huimei Fan, Jie Wang, Xianbo Jia, and Songjia Lai. 2021. "Transcriptomics Analysis Reveals the Immune Response Mechanism of Rabbits with Diarrhea Fed an Antibiotic-Free Diet" Animals 11, no. 10: 2994. https://doi.org/10.3390/ani11102994