Article

Genome-Wide Scan for Runs of Homozygosity Identifies Candidate Genes Related to Economically Important Traits in Chinese Merino

1
Key Laboratory of Ruminant Genetics, Breeding & Reproduction, Ministry of Agriculture; Key Laboratory of Animal Biotechnology of Xinjiang, Institute of Biotechnology, Xinjiang Academy of Animal Science, Xinjiang, Urumqi 830026, China
2
Xinjiang Wool sheep and Cashmere Goat Key Breeding Lab, Institute of Animal Science, Xinjiang Academy of Animal Sciences, Xinjiang, Urumqi 830026, China
*
Author to whom correspondence should be addressed.
Animals 2020, 10(3), 524; https://doi.org/10.3390/ani10030524
Submission received: 26 January 2020 / Revised: 17 March 2020 / Accepted: 17 March 2020 / Published: 20 March 2020
(This article belongs to the Section Animal Genetics and Genomics)

Abstract

:

Simple Summary

Runs of homozygosity (ROH) are commonly used to estimate inbreeding coefficients and identify selection signatures in livestock population. The present study determined ROH patterns, estimated the inbreeding levels, and identified the genome regions with high ROH frequency (ROH hotspots) in Chinese Merino. Our results showed that the genome of Chinese Merino harbored lower ROH abundance. Moreover, the inbreeding levels were relatively low. Thirteen ROH hotspots consisting of 190 genes were identified. The ROH hotspots overlapped the selective signatures might be associated with body size, horn traits, immune traits and environment adaption. These findings could contribute to an optimum breeding program by identifying the candidate genes related to economically traits in Chinese Merino.

Abstract

In this study, we estimated the number, length, and frequency of runs of homozygosity (ROH) in 635 Chinese Merino and identified genomic regions with high ROH frequency using the OvineSNP50 whole-genome genotyping array. A total of 6039 ROH exceeding 1 Mb were detected in 634 animals. The average number of ROH in each animal was 9.23 and the average length was 5.87 Mb. Most of the ROH were less than 10 Mb, accounting for 88.77% of the total number of detected ROH. In addition, Ovies aries chromosome (OAR) 21 and OAR3 exhibited the highest and lowest coverage of chromosomes by ROH, respectively. OAR1 displayed the highest number of ROH, while the lowest number of ROH was found on OAR24. An inbreeding coefficient of 0.023 was calculated from ROH greater than 1 Mb. Thirteen regions on chromosomes 1, 2, 3, 5, 6, 10, 11, and 16 were found to contain ROH hotspots. Within the genome regions of OAR6 and OAR11, NCAPG/LCORL, FGF11 and TP53 were identified as the candidate genes related to body size, while the genome region of OAR10 harbored RXFP2 gene responsible for the horn trait. These findings indicate the adaptive to directional trait selection in Chinese Merino.

1. Introduction

Runs of homozygosity (ROH) are defined as contiguous homozygous genotype segments that arise from the transmission of identical haplotypes from parents to their offspring [1]. The distribution, frequency, and length of ROH are commonly associated with several factors, such as selective breeding, natural selection, recombination rate, and demographic history [2]. In animal breeding programs, to avoid inbreeding depression, a highly sensitive and accurate estimation of inbreeding is of great importance [3]. The classical method for calculating the inbreeding coefficient is through the use of pedigree data. However, the pedigree-based inbreeding coefficient (FPED) is largely dependent on the accuracy, completeness and depth of pedigree information, and pedigree errors are common in many livestock populations. Moreover, FPED tends to ignore the history of selective breeding and underestimates the level of inbreeding, possibly due to the pedigree records [4].
At present, several alternative methods have been proposed to estimate inbreeding coefficient based on the whole-genome single nucleotide polymorphism (SNP)-derived metrics of autozygosity. For instance, the ROH-based inbreeding coefficient (FROH) is an optimal approach to reflect the present-day and ancient inbreeding levels [5]. This method has been widely used to estimate the genomic inbreeding of many livestock populations in recent years [6,7,8,9,10]. The animals subjected to direct selection for target traits may form selection signatures or selective sweeps in the genome regions. With the loss of nucleotide diversity and increased homozygosity, the selected genome regions tend to generate ROH islands or ROH hotspots compared to the rest of the genome [11]. ROH hotspots are not randomly distributed across the genome and are shared by all individuals within a breed [12]. ROH are commonly used to identify genome regions under putative selection in order to map the candidate genes responsible for economically important traits in livestock populations [13,14,15,16,17,18,19,20].
Chinese Merino (Xinjiang type) is the most well-known sheep breed with fine wool in China. The breeding goals for a sheep breed include fine and soft wool, polled females, and large body size. However, there is limited information about the distribution of ROH across the genome in Chinese Merino. Therefore, this study aimed to investigate the characteristics of ROH in Chinese Merino using the Illumina Ovine 50 K SNP BeadChip, as well as to identify the genomic regions with high ROH frequency, namely ROH islands or ROH hotpots, which could have occurred during the selective breeding for production-related traits.

2. Materials and Methods

2.1. Sampling, Genotyping, and Data Quality Control

Ear tissue samples were collected from 635 female Chinese Merino (Xinjiang type) sheep in Bohu farm and Gongnaisi farm (Xinjiang, China). All samples were genotyped for 54241 SNPs using the OvineSNP50 Genotyping BeadChip (Illumina Inc., San Diego, CA, USA). The quality control of SNP data was performed with PLINK v1.90 software. SNPs were removed from the analysis if they did not align to the autosome of Ovis aries. The eligible SNPs were then filtered according to the following criteria: (1) Call frequency ⩾ 0.95, (2) minor allele frequency (MAF ⩾ 0.01), (3) Hardy–Weinberg equilibrium (HWE > 0.000001), and (4) individual call rate >0.9. The samples that did not satisfy these criteria were excluded.

2.2. Selection Criteria for Runs of Homozygosity

The runs of homozygosity (ROH) in each sample were evaluated using PLINK v1.90 software. The following criteria were used for ROH estimation: (1) The minimum length of ROH was set to 1 Mb, (2) five missing SNPs and up to one possible heterozygous genotype were permitted for each ROH window, (3) the minimum number of SNPs was set to 40, (4) a minimum density of one SNP every 100 kb, and (5) the maximum gap between two consecutive SNPs was set to 1 Mb.

2.3. Distribution of Runs of Homozygosity

The mean number, average length, and total number of ROH in each animal were estimated. The percentage of chromosomes covered by ROH was also determined. First, the mean ROH length was calculated by summing all ROH (Mb) on the Ovies aries chromosome (OAR) and then dividing by the number of animals that had ROH on that OAR. Subsequently, the mean ROH length was divided by the length (in Mb) of OAR.

2.4. Genomic Inbreeding Coefficients

Based on ROH data, the genomic inbreeding coefficient (FROH) of each animal was calculated as follows: FROH = LROH / LAUT, where LROH is the total length of all ROH in an animal genome, and LAUT refers to the length of autosomal genome covered by the SNPs included in the array.
In addition, the values of chromosomal FROH (FROHOAR) were estimated as follows: FROHOAR = LROHOAR / LOAR, where LROHOAR is the total length of ROH in an OAR, and LOAR is the length of an OAR covered by the corresponding SNPs.

2.5. Identification of Common Runs of Homozygosity

To identify the most commonly ROH-associated genomic regions, the percentage of SNP occurrence in ROH was calculated by counting the number of times each SNP within the detected ROH and then dividing the number of animals. The obtained data were plotted against the chromosomal positions of SNPs. The genomic regions with top 1% SNPs were considered as a potential ROH ROH hotspot in the genome [21,22].
To verify whether recombination can affect ROH hotspots, ROH were mapped based on the position of SNP (i.e., position in the genetic map of female sheep) [23]. The average recombination rate (cM/Mb) in each ROH hotspot was calculated. Next, the genetic map of ROH lengths was used to deduce demographic event using the method reported by Thompson et al. [18]. The methods used for meat sheep breeds [19] and Valle del Belice sheep [17] were adopted in this study, in which four similar ROH length categories were applied.
The identified genomic hotspots were used for gene annotation using Biomart according to the sheep reference genome (Oar 3.1). Gene ontology (GO) and Kyoto Encyclopedia of Genes and Genomes (KEGG) pathway enrichment analyses were then performed using Metascape with default parameters [24].

3. Results

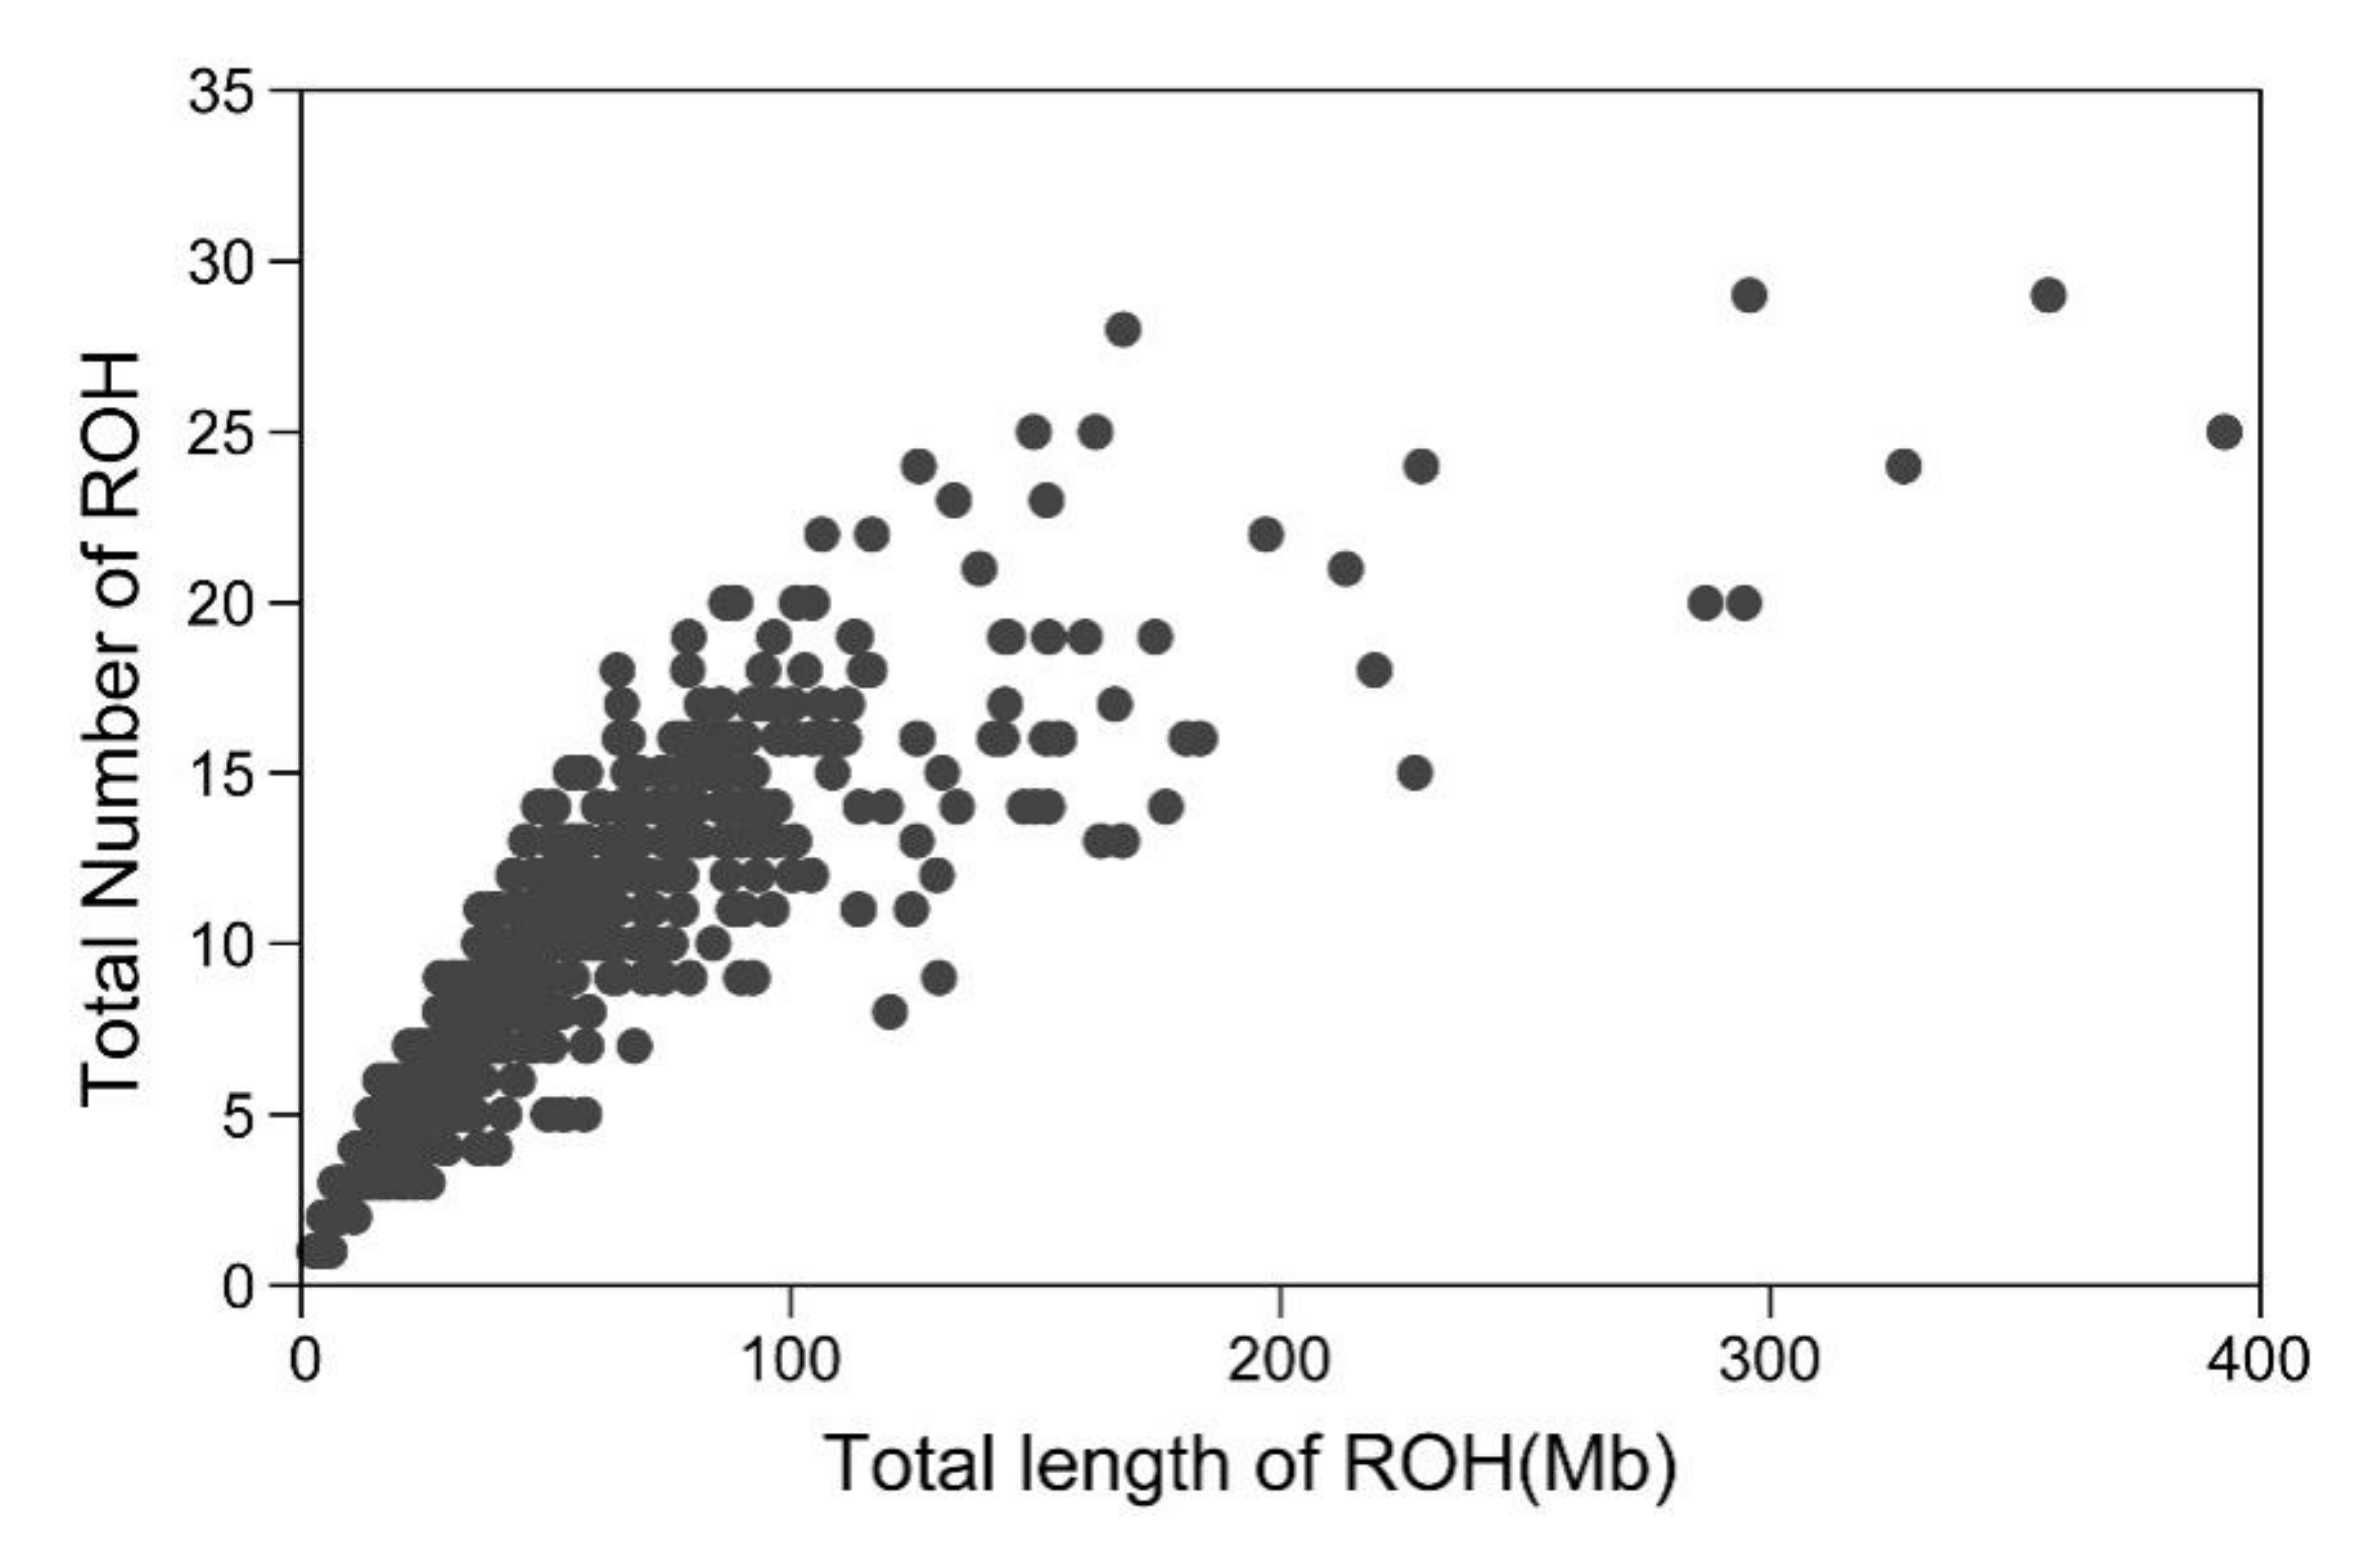
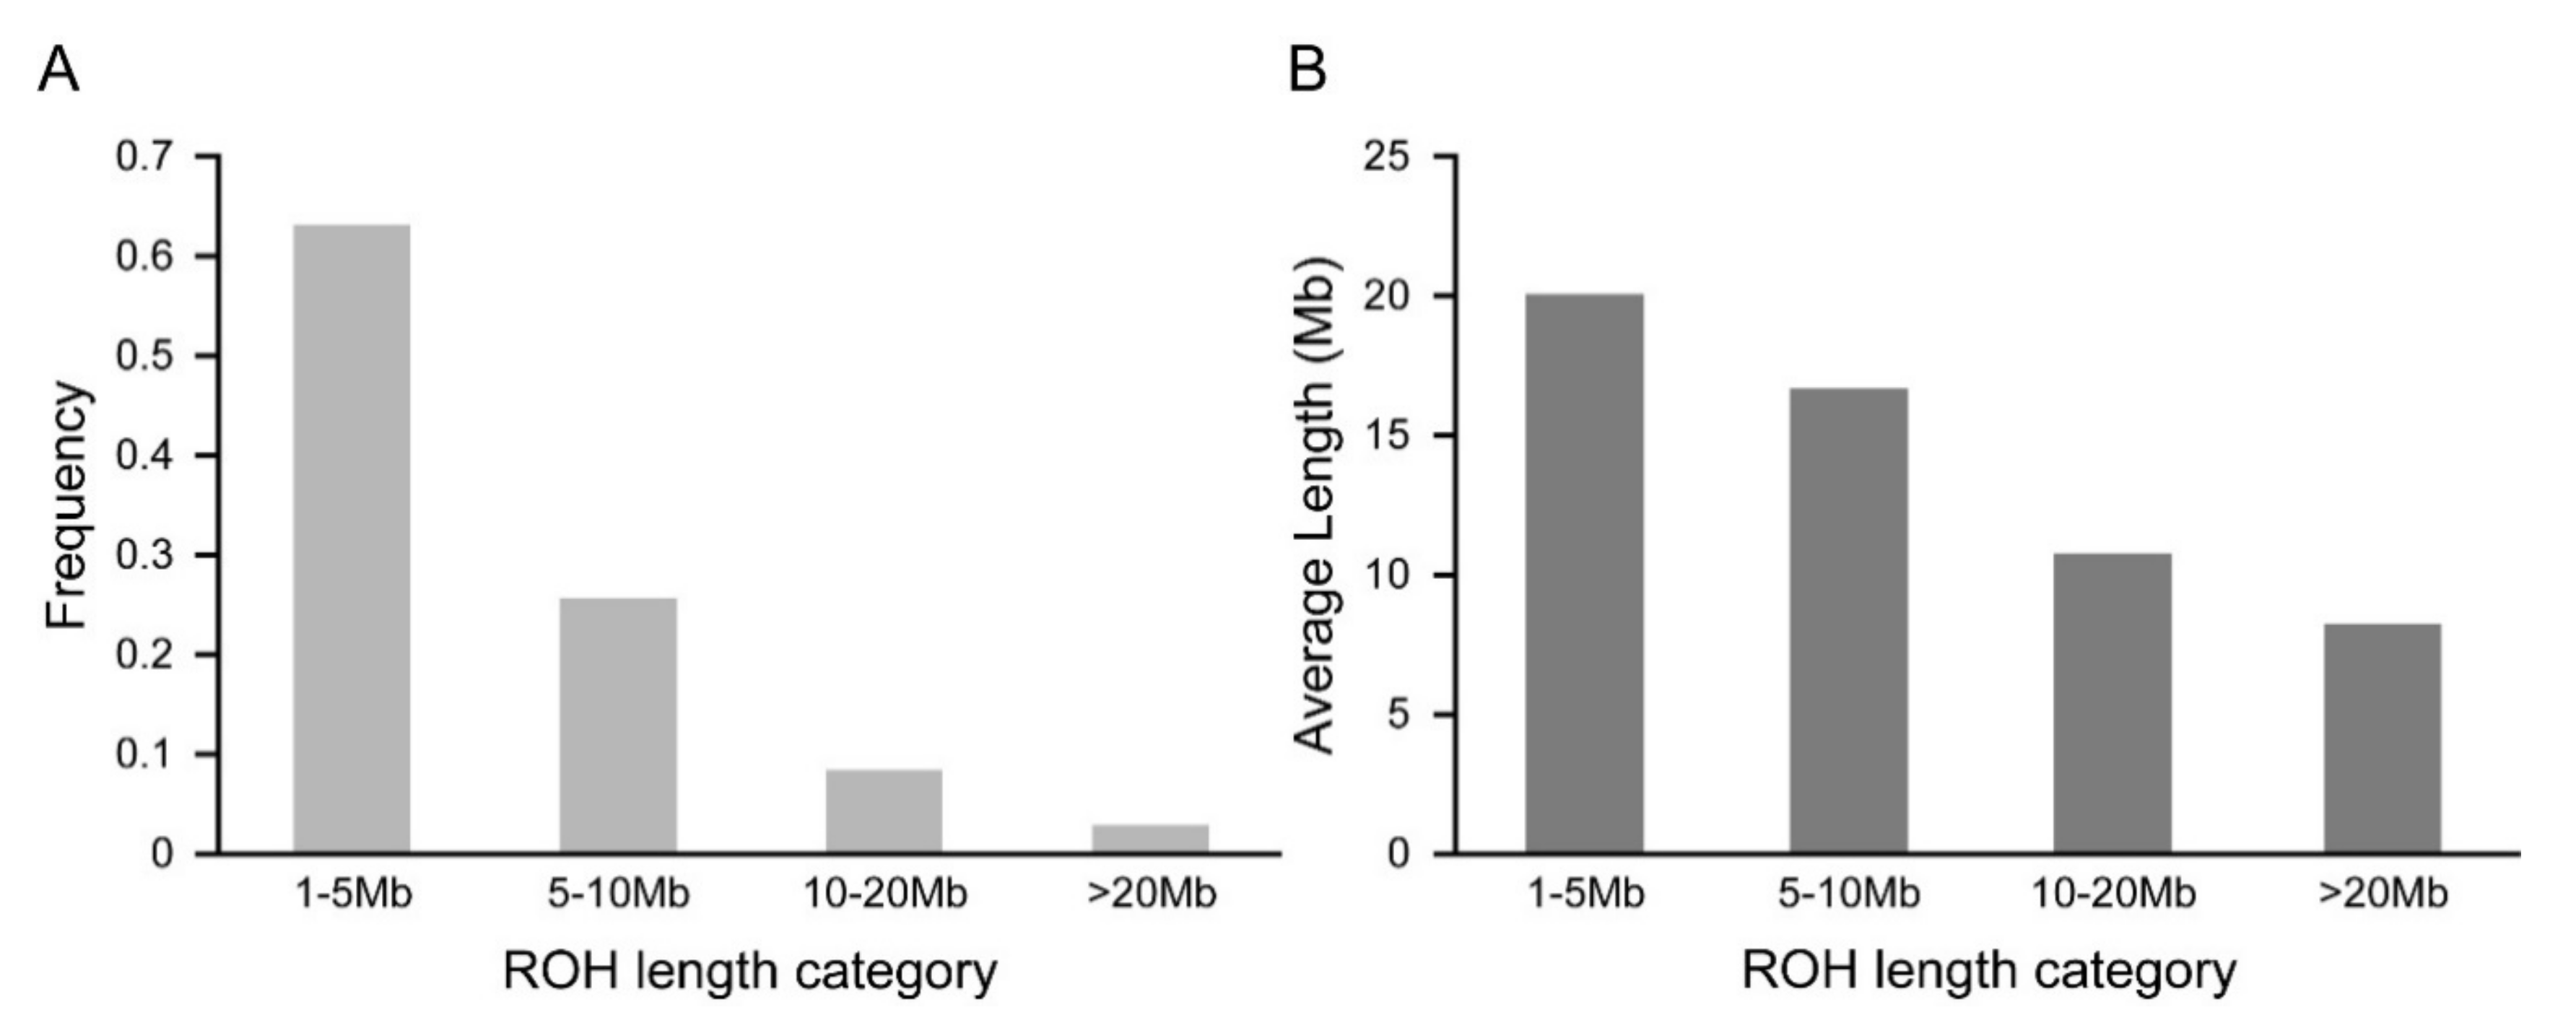
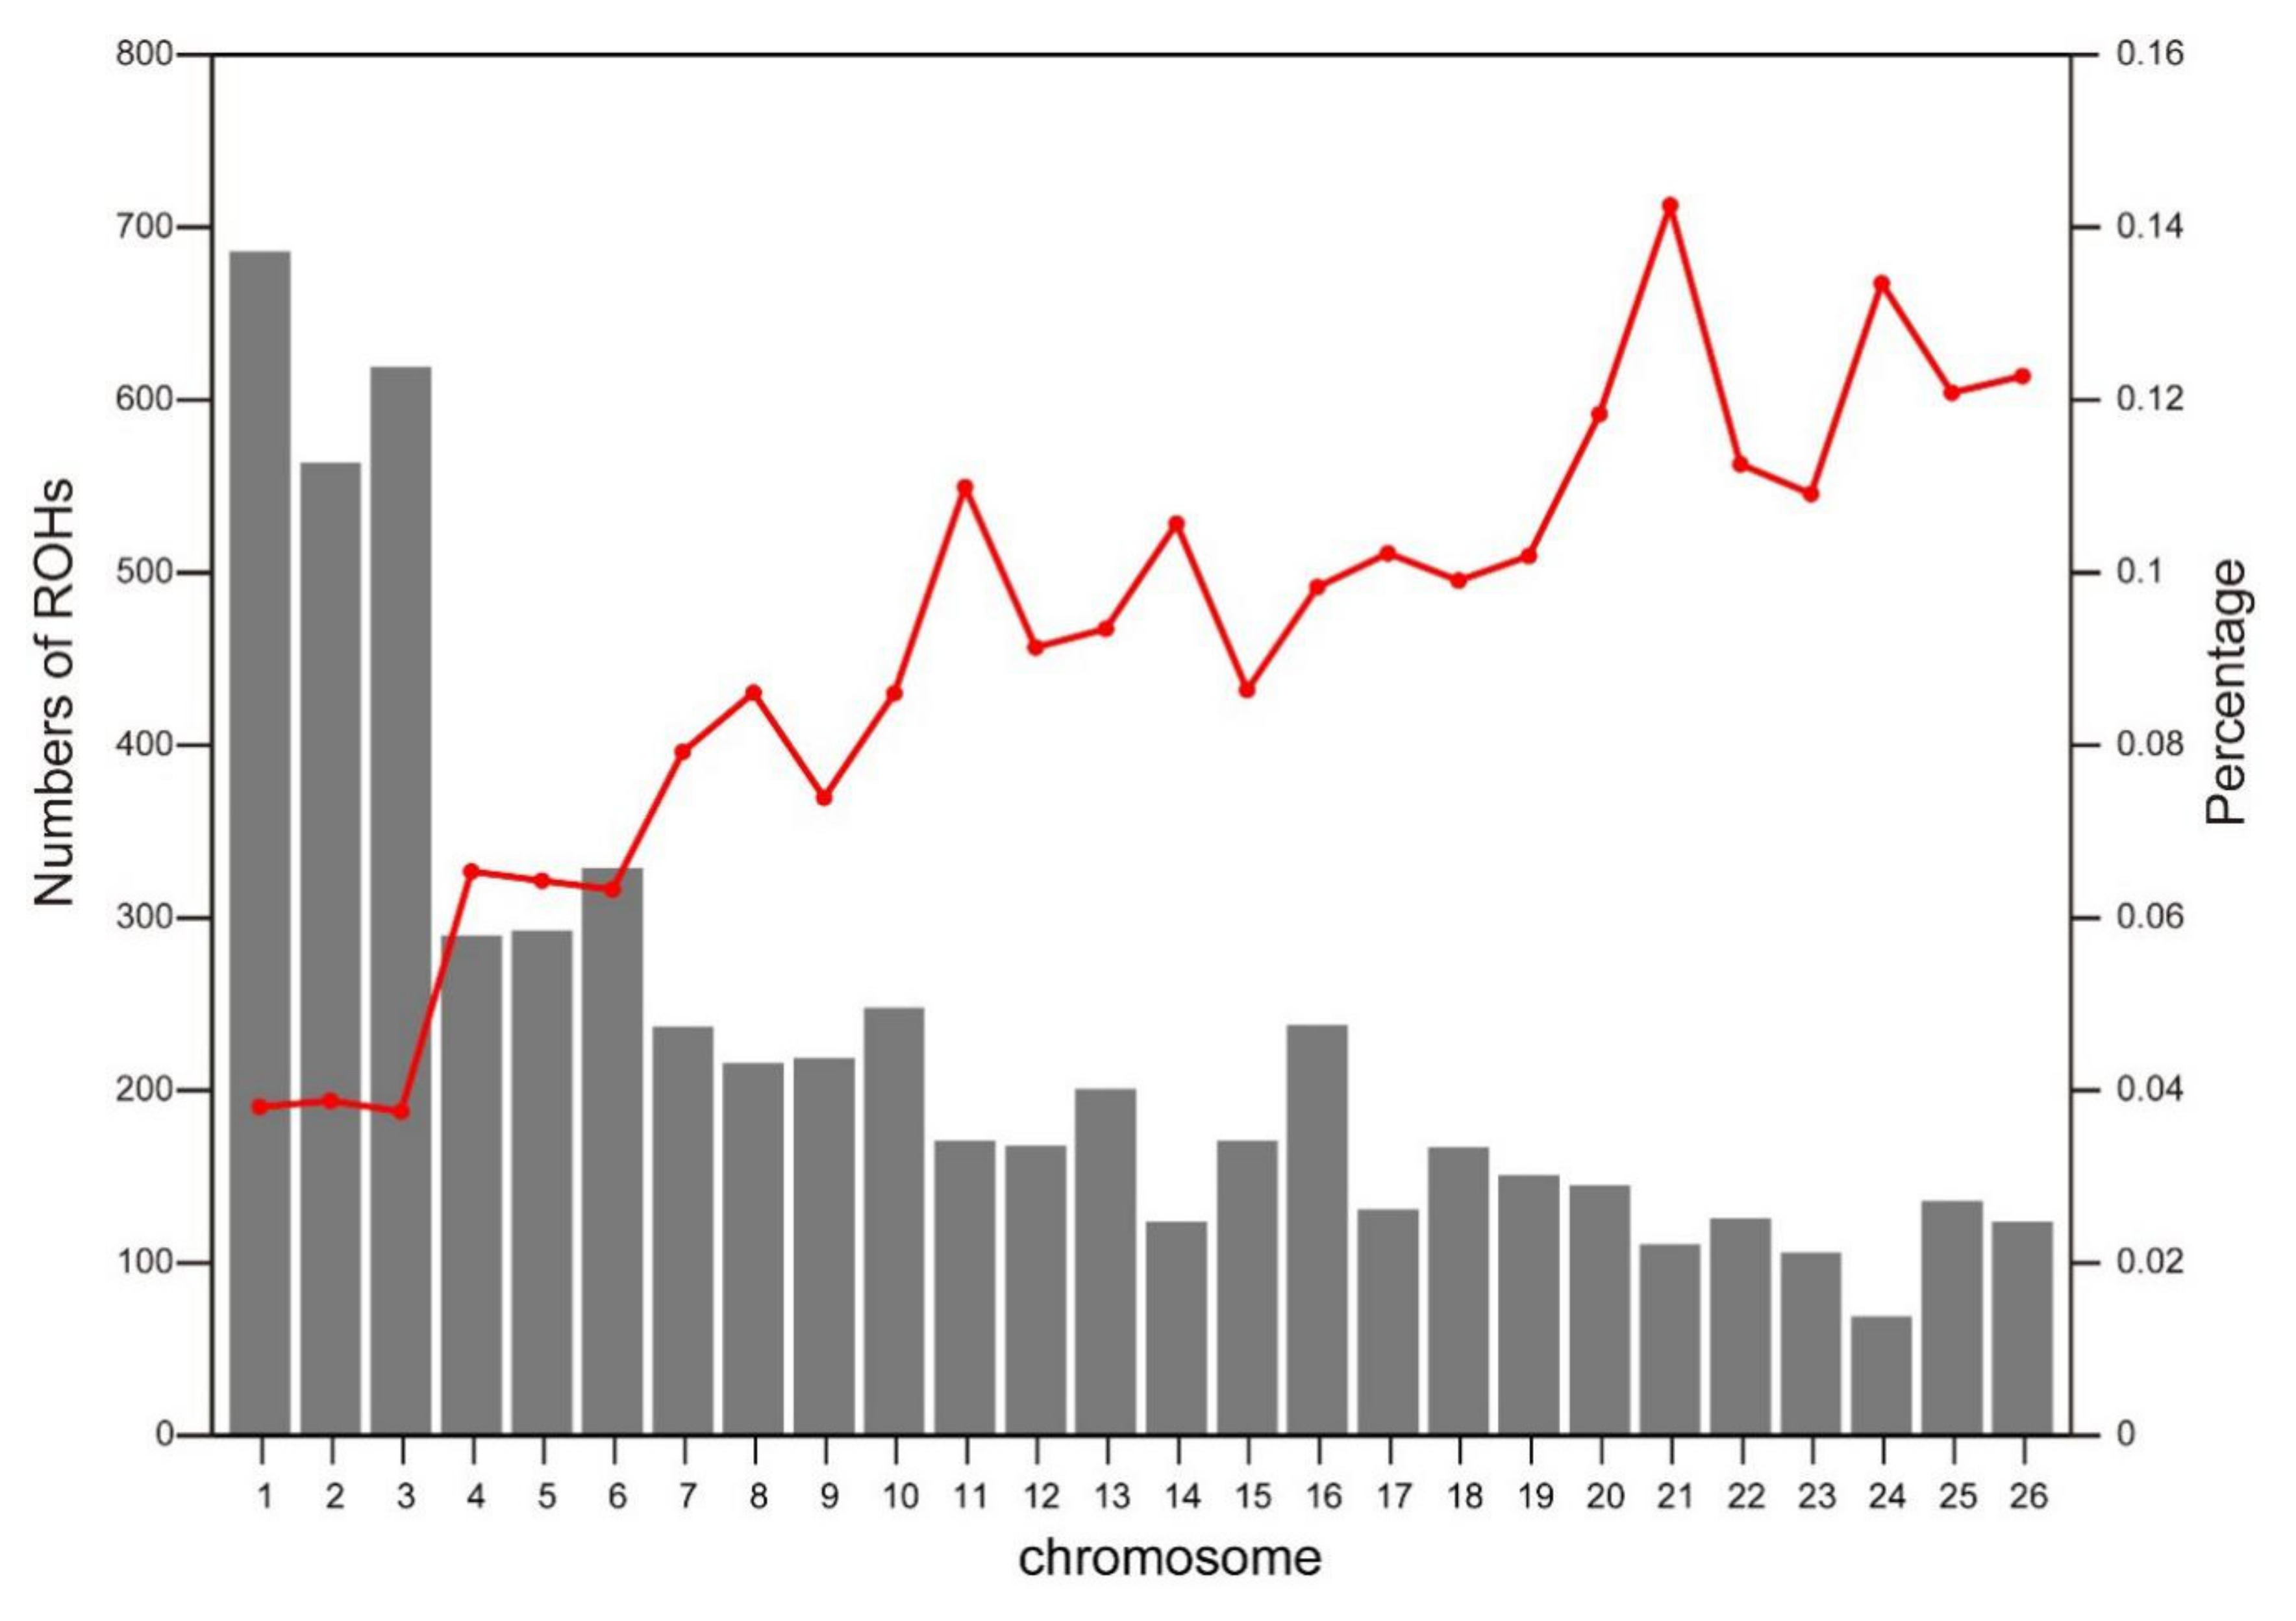
3.1. Distribution of Runs of Homozygosity

In total, 6039 ROH with varying length were identified in all 635 samples, and the average length of ROH was 5.87 Mb. Notably, the longest ROH (up to 60.19 Mb) containing 1247 SNPs was found on chromosome 3, while the shortest ROH was only 1.54 Mb. Among the studied samples, 634 of them had at least one ROH. The average number of ROH in each animal was 9.23 (ranging from 1 to 29 ROH), while the average total length of ROH was 55.78 Mb. Three Merino sheep had the highest homozygosity levels of 392.74 Mb, 356.76 Mb and 327.21 Mb, which were relatively close to 15% of the genome. On the contrary, the Merino sheep with lowest homozygosity had only one ROH of 2.66 Mb. Figure 1 demonstrates the number and total length of ROH in Chinese Merino.
The frequencies of ROH in Chinese Merino under different ROH length categories are presented in Figure 2A. The majority of detected ROH were less than 10 Mb (ROH 1–5 Mb and ROH 5–10 Mb), which accounted for 88.77% of the total number of ROH. Moreover, the frequency of ROH between 10 Mb and 20 Mb was 8.40%, while relatively few long ROH (more than 20 Mb in length) were detected. The mean genome coverages (in Mb) by ROH under different ROH length categories are shown in Figure 2B. The highest mean coverage of Merino genome was approximately 20.06 Mb in the 1–5 Mb ROH length group, whereas the lowest mean coverage was detected in the >20 Mb ROH length group.
The number of ROH in each chromosome and the percentage of chromosomes covered by ROH are demonstrated in Figure 3. OAR1 displayed the highest number of ROH (n = 686), while the lowest number of ROH (n = 69) was observed on OAR24. The highest genome coverage by ROH was found on OAR21 (14.26%), while the lowest coverage was on OAR3 (3.76%). In overall, the number of ROH tended to reduce with decreasing chromosome length, and the percentages of genome coverage by ROH exhibited significantly different patterns.
Furthermore, the genetic position of each SNP was used to map the ROH hotspots, and the abundance levels of ROH in different length categories were used to assess the historical demographic patterns of the breed. The time to the most recent common ancestor (TMRCA) in the four different categories of the breed was evaluated (Figure S1). The power to deduce demographic patterns for >20 generations ago was limited due to the density of SNP array. A substantial increase in the abundance of ROH in Chinese Merino was observed from 10–20 generations ago to <5 generations ago, suggesting a recent decrease in the effective population size.

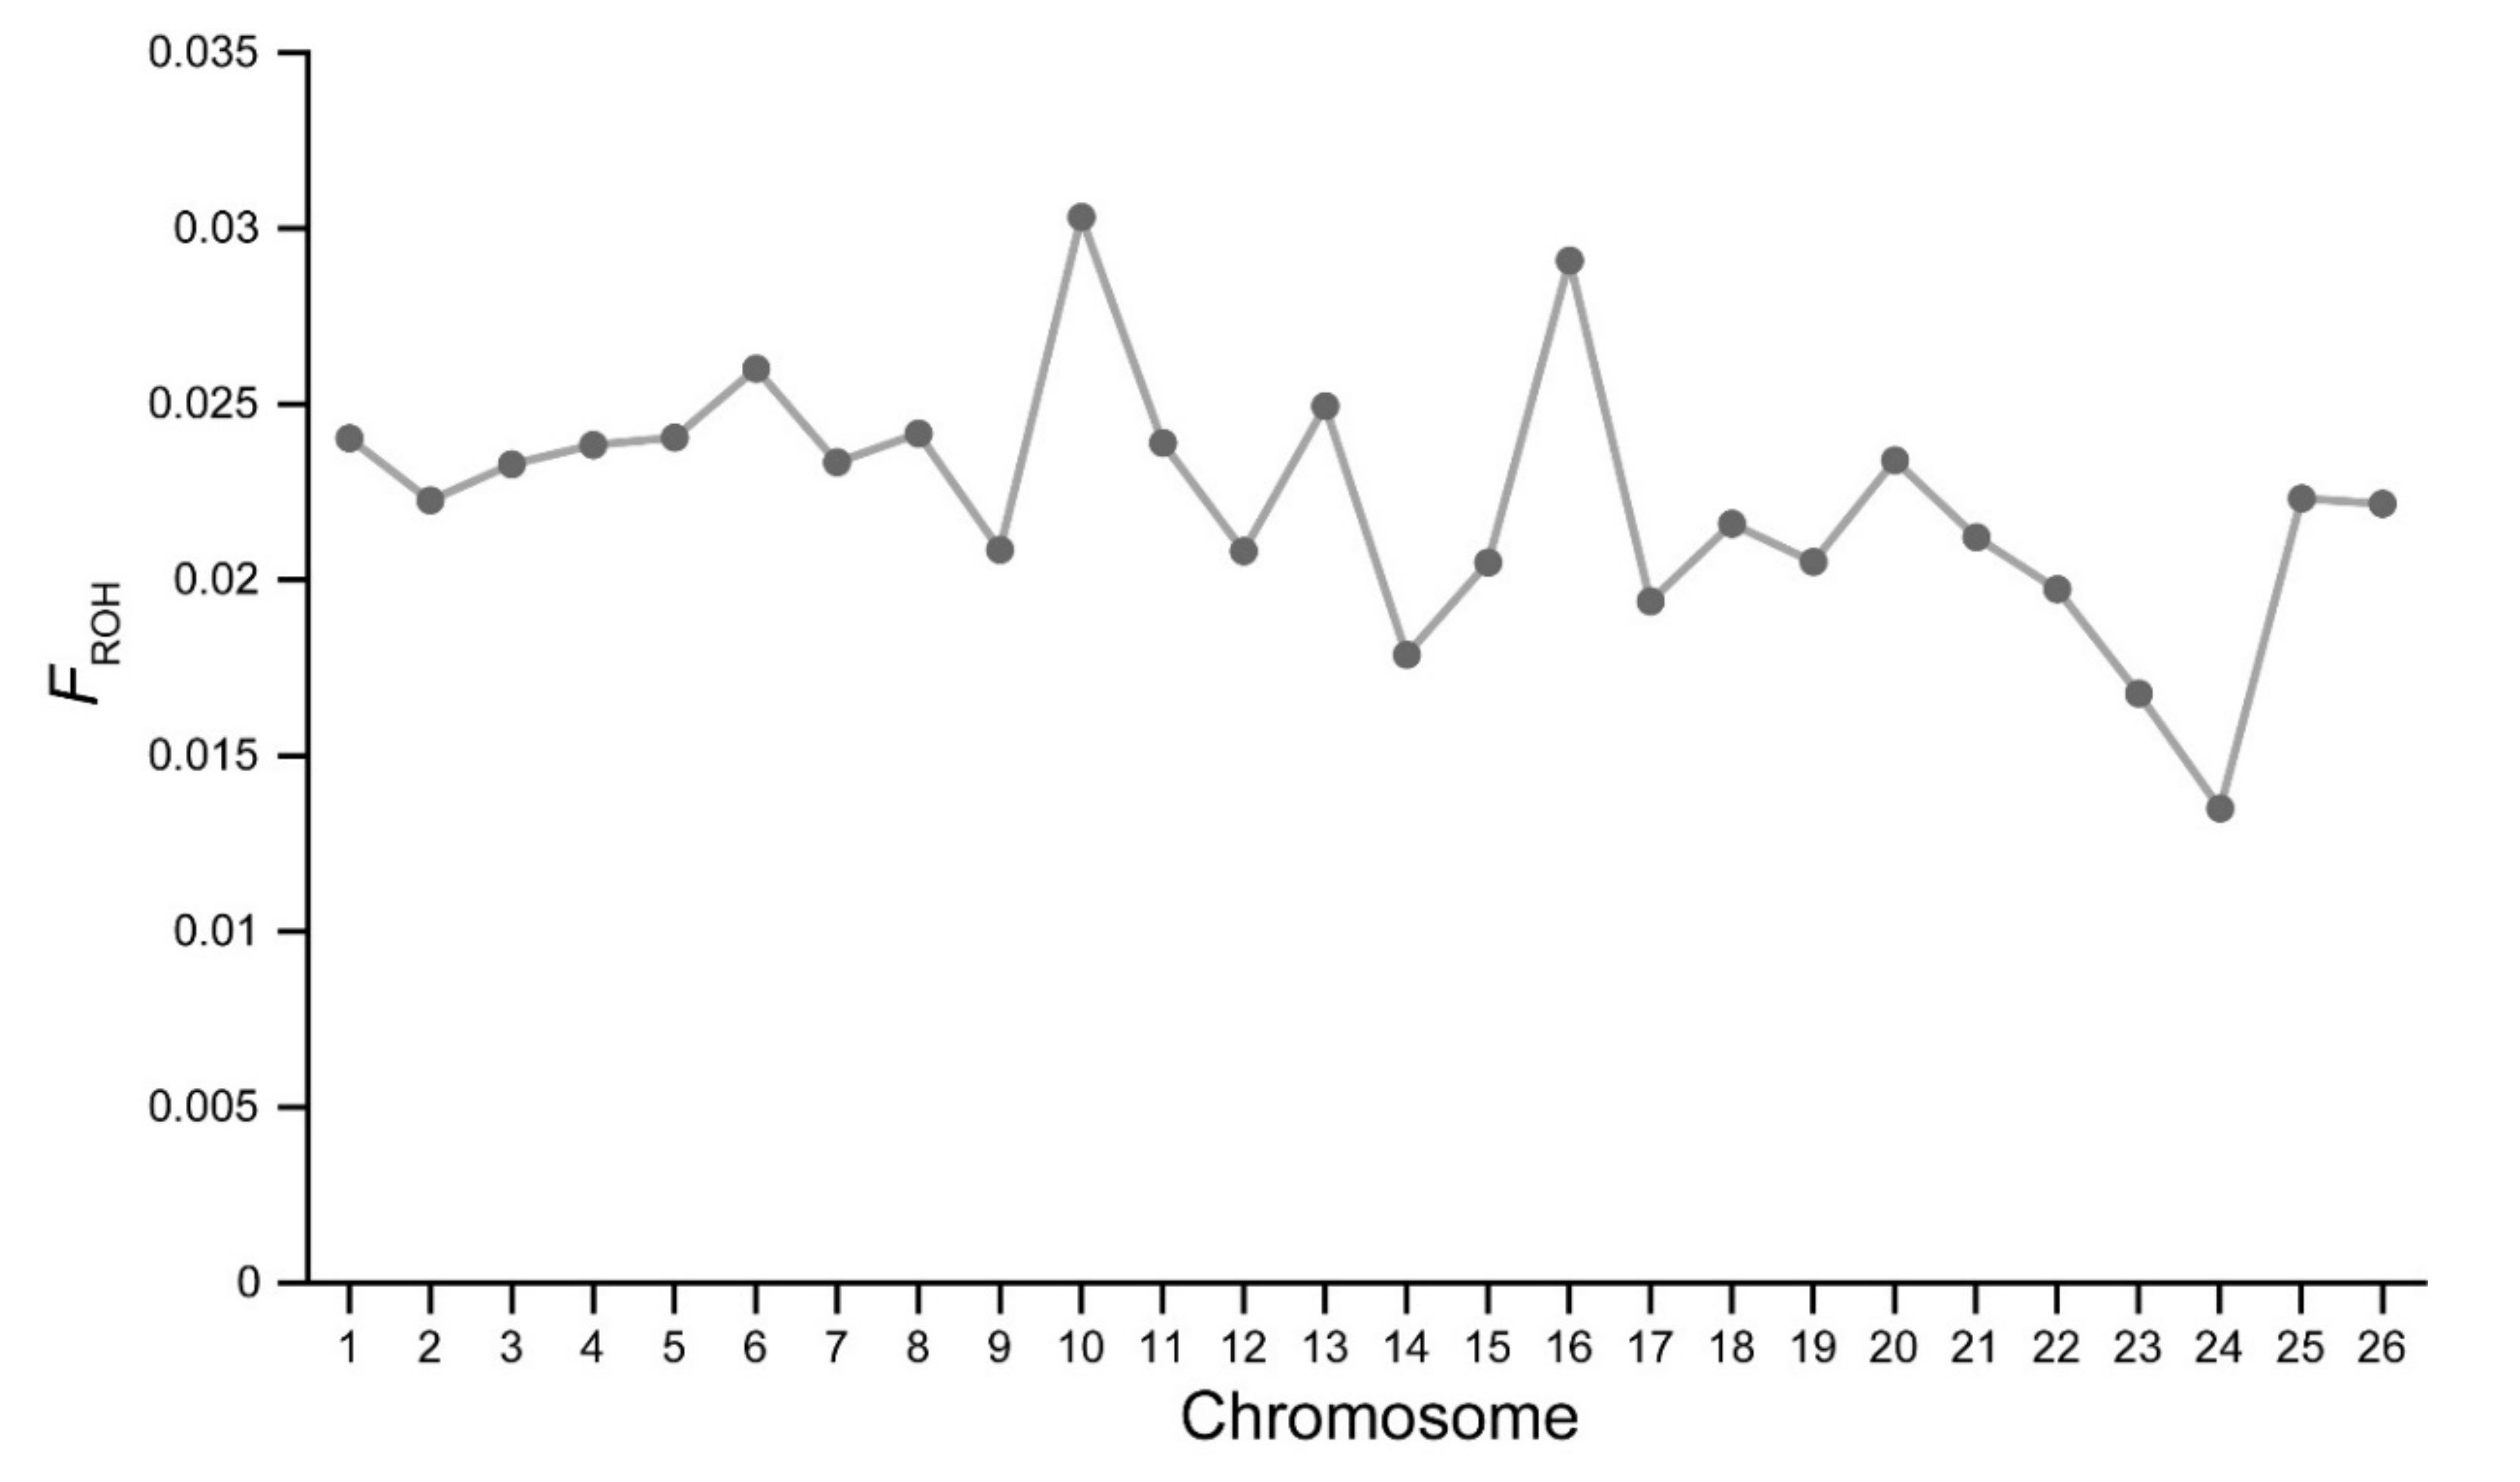
3.2. Inbreeding Coefficient Based on ROH

Descriptive statistics for ROH-based inbreeding coefficients (FROH) under different length categories are presented in Table 1. The values of FROH gradually increased as a function of ROH length, ranging from 0.008 to 0.022. In addition, the coefficient of variation was also increased with increasing ROH length. As shown in Table 1, the mean FROH of Chinese Merino (0.023) was relatively low, with the highest FROH of up to 0.16.
The distribution of FROH in each chromosome (FROHOAR) is illustrated in Figure 4. Notably, the values of FROHOAR were comparatively different in the genome of Chinese Merino. The highest value of FROHOAR was found on OAR10, while the lowest value was observed on OAR24.

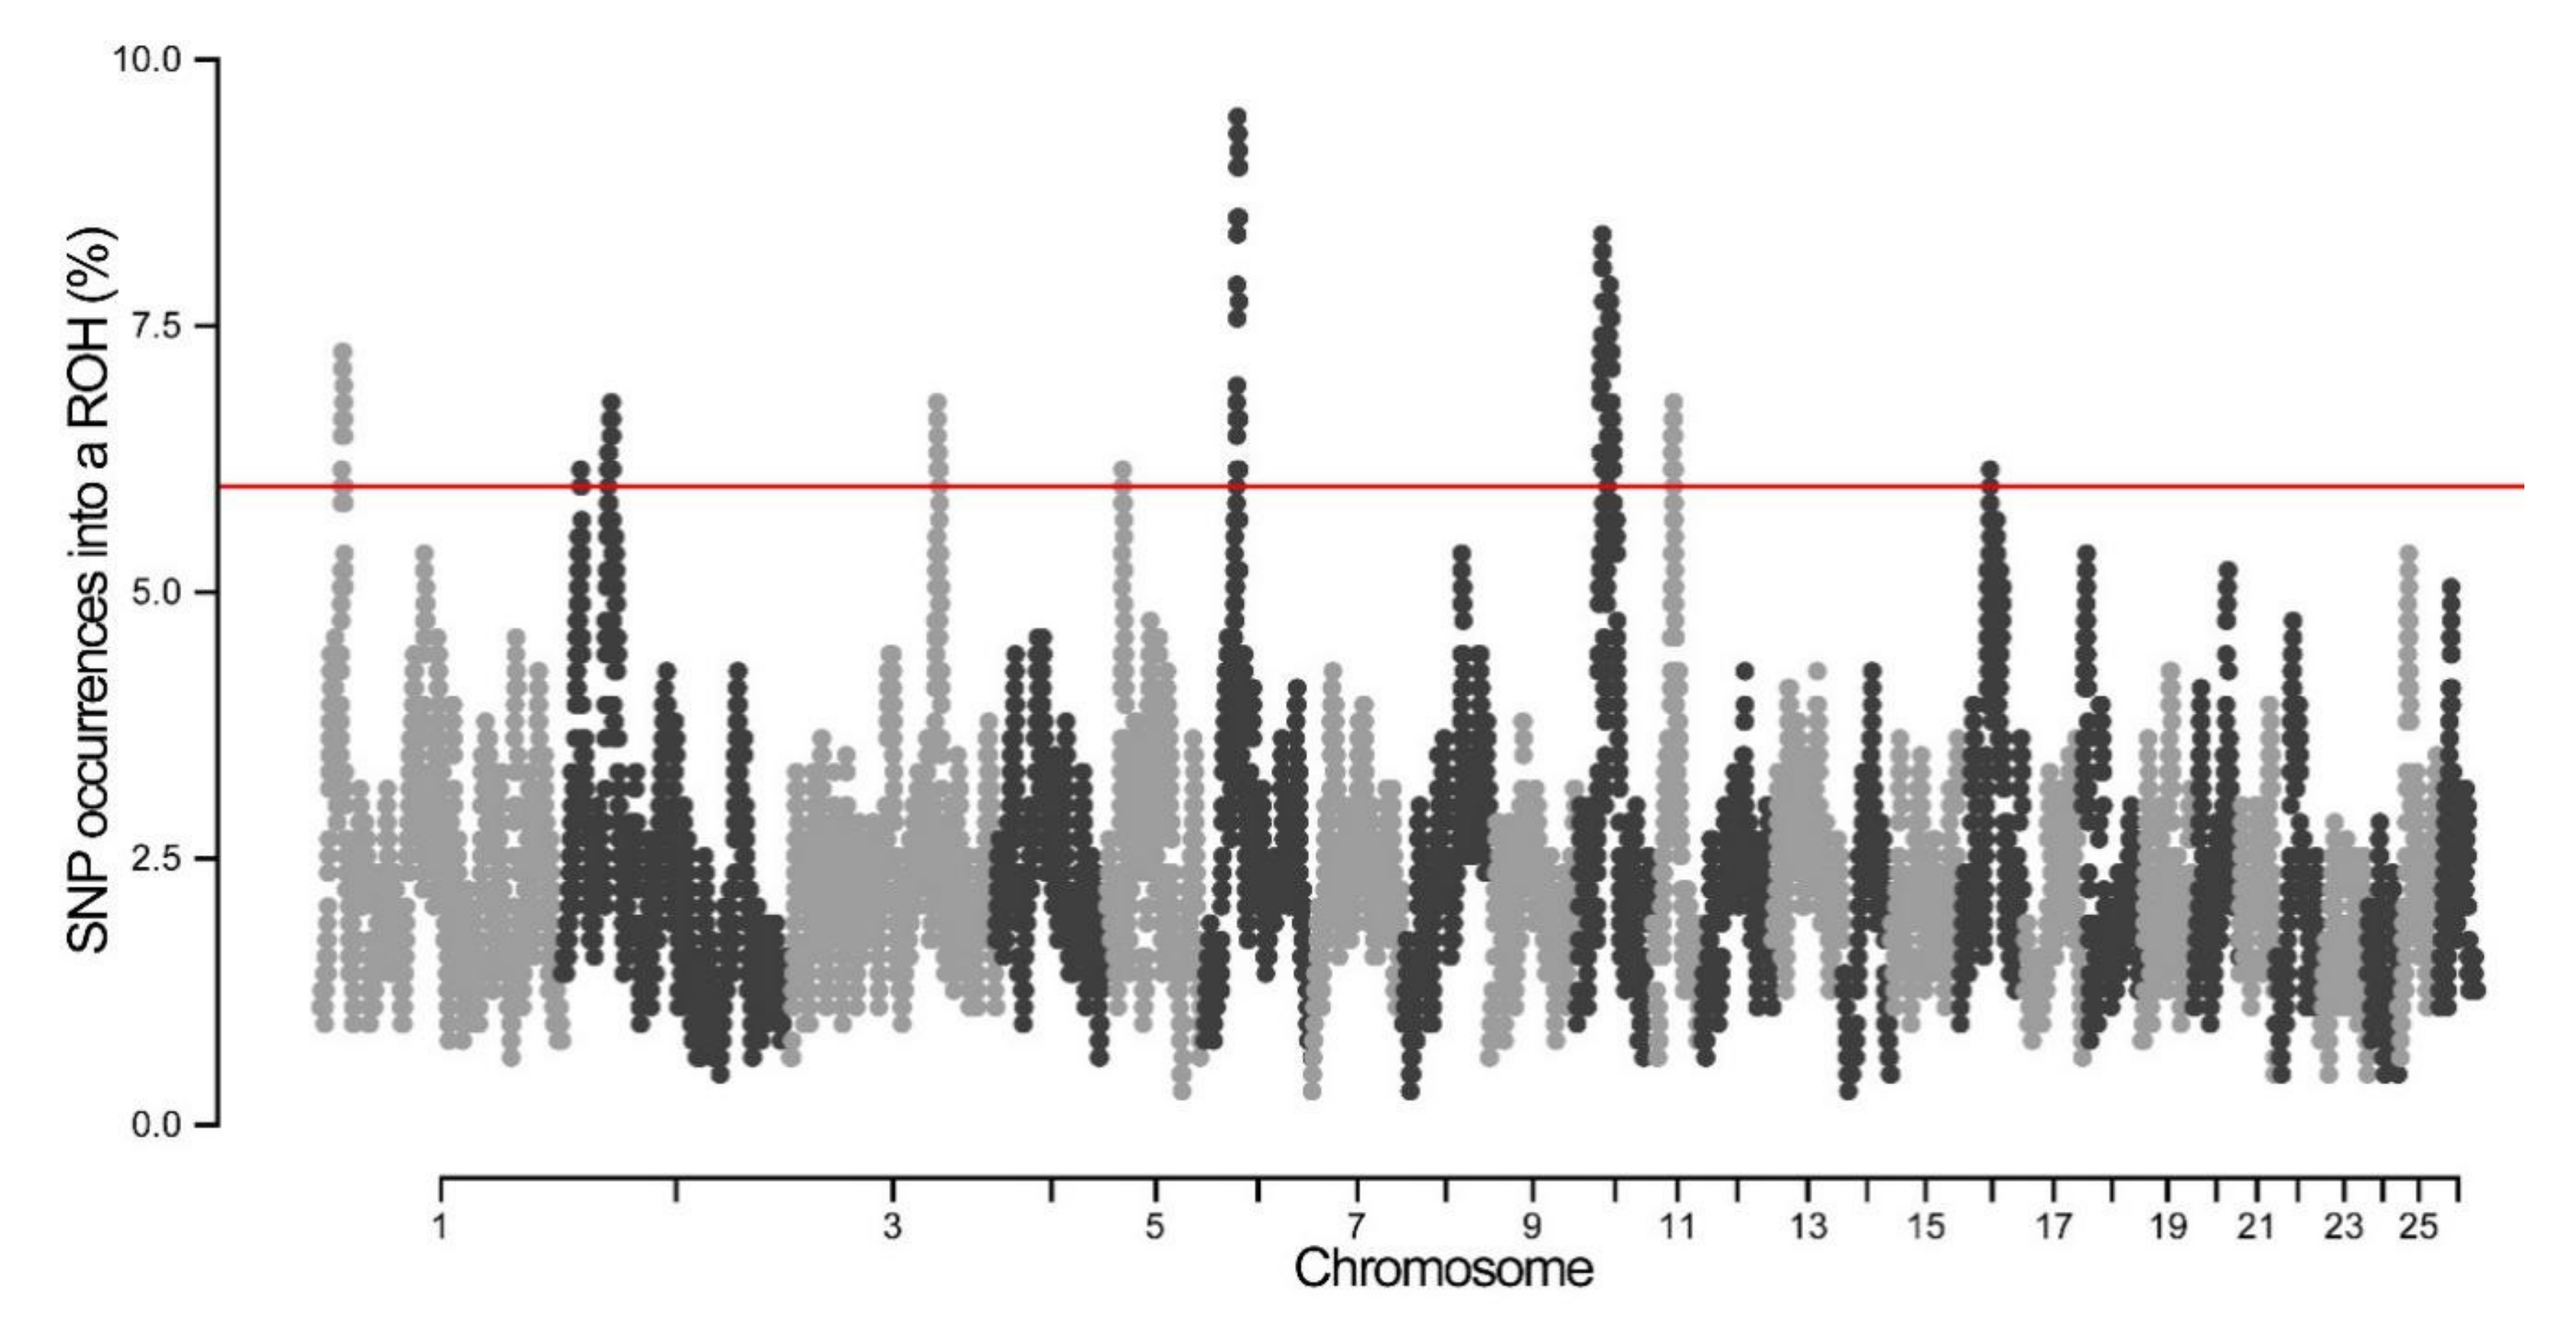
3.3. Genomic Regions with ROH Hotspots

By determining the abundance of SNPs in ROH, several genome regions were identified as potential ROH hotspots. As shown in Figure 5, the frequency of SNPs in ROH ranged from 6.15% to 9.46%. A total of 10 genomic regions on chromosomes 1, 2, 3, 5, 6, 10, and 11 were found to contain putative ROH hotspots (Figure 5, Table 2). The longest ROH island (7.31 Mb) was observed on OAR10, while the shortest one was observed on OAR11. The highest percentage of SNPs in ROH was found on OAR6, which consisted of 58 SNPs and 3.32 Mb ROH length (Figure 5, Table 2). To determine whether genetic recombination can affect ROH hotspots, the recombination rate of each hotspot was calculated based on the sheep genetic map. It was found that the recombination rates of ROH hotspots ranged from 0 to 1.32.
Furthermore, the identified ROH hotspots harbored 190 candidate genes (Supplementary Materials Table S1). Gene ontology (GO) and KEGG pathway analyses were carried out to determine the enriched functional genes (−log10P > 2). The results indicated that the top 20 clusters were related to the regulation of cyclin-dependent protein serine/threonine kinase activity, positive regulation of immunoglobulin production, oocyte development, regulation of neuroblast proliferation, and regulation of growth and embryo implantation (Table 3).

4. Discussion

The length, frequency, and abundance of ROH constitute valuable sources of information on the historical demographic patterns of livestock species [25]. In this study, the characteristics of ROH in Chinese Merino were assessed using the Illumina Ovine 50K SNP BeadChip. The abundance of Chinese Merino was relatively similar to that of Australian Merino [26], but lower compared with some Italian sheep breeds [22] and commercial meat sheep breeds [19,26]. The lower ROH abundance of Merino sheep was consistent with their large effective population size [27,28]. There was a substantial increase in the abundance of ROH in Chinese Merino from 10–20 generations ago to <5 generations ago, suggesting a recent decrease in the effective population size in agreement with the formation history of Chinese Merino. The analysis of ROH length revealed that the majority of them were shorter than 10 Mb, which were consistent with the findings reported on the ROH length of sheep [19], pig [29], and cattle [6]. The length and number of ROH shorter than 5 Mb might probably be underestimated, as these ROH remained undetectable when using a medium-density SNP panel [6].
In Chinese Merino, the mean values of FROH were all less than 0.03, suggesting the low levels of inbreeding in this breed (Table 1). Similar FROH values were found in Italian sheep breeds and Spanish sheep breeds [21,22]. The main reason is that Chinese Merino sheep do not undergo intense selection and have a large effective population size [28]. The FROH values under different ROH length categories can be employed to reflect the present-day and ancient inbreeding [5]. According to the obtained FROH values (Table 1), the evidence of present-day inbreeding could become more overwhelming than that of ancient inbreeding. Furthermore, the maximum value of FROH (>20 Mb) was greater than 0.1, suggesting a relatively high level of relatedness among the individuals in this breed. However, these results consistently overlapped with the recent decrease in effective population, which might be attributed to the broad use of artificial insemination and decreased number of Chinese Merino raised in farm due to low wool prices in recent years.
In addition, ROH was used to measure the chromosomal inbreeding coefficients of Chinese Merino. Notably, the highest FROHOAR value was found on Oar10, and these findings were not consistent with those of the Valle del Belice breed [17]. Possible reasons for such difference may be due to the selection of different traits in sheep breeds. Selective breeding can reduce nucleotide diversity, increase linkage disequilibrium, and form a high level of homozygosity in genomic regions. Within OAR10, numerous quantitative trait loci associated with horn phenotype were detected, and the candidate gene related to horn development was also identified. Our previous works have indicated the high degree of linkage disequilibrium across OAR10 in Chinese Merino.
The maximum frequency of SNPs in ROH in Chinese Merino was around 6.15%–9.46%, Similar SNP frequency in ROH was found in Italian sheep breeds and Spanish sheep breeds [21,22]. On the contrary, the incidence of SNPs in commercial meat sheep breeds is higher than 20% [19]. In cattle, the ROH hotspots with the percentage of SNPs above 50% are more frequent than sheep [30]. These results reveal the hotspots in Merino and native sheep breeds are quite limited.
The existence of ROH hotspots might be partially attributed to genetic recombination rate [2]. The recombination rates within ROH hotspots ranged from 0 to 1.32 in Chinese Merino (Table 2). The previously reported recombination rates within ROH hotspots ranged from 0 to 0.87 [19] in commercial sheep and from 0.47 to 1.64 in Valle del Belice sheep [17]. The ROH hotspots in low recombination regions may be caused by selection process [19]. To verify whether these hotspots can overlap with putative selection signatures in sheep, we compared the hotspots region with previously reported selection signatures, and the results showed that five hotspots overlapped with a region under selection signature (Table 4).
The ROH hotspot with highest SNP occurrence was located on OAR6 (35.07–38.67 Mb), which consisted of the NCAPG/LCORL gene. Similar findings were also reported in Italian sheep breeds [22], Spanish sheep breeds [21], Swiss sheep breeds, and Merino [18,31]. Moreover, the selective signatures in NCAPG/LCORL region were found in many sheep breeds [18,32,33], including Merino [34]. A previous genome-wide association study (GWAS) demonstrated that this region was associated with body weight in Australian Merino [35]. In addition, this region was also associated with growth and body size in human [36,37], chicken [38], cattle, and horse [39,40,41]. Furthermore, the ROH hotspots on OAR11 from 28.02 Mb to 28.52 Mb and the corresponding selective signatures on the same gnome region were also reported by Kim et al. [42] and Signer-Hasler et al. [18]. A guilt-by-association study has also revealed that TP53 is the most plausible functional candidate gene for body size in sheep [43]. Taken altogether, these results suggest that the ROH hotspots detected on OAR6 (35.07–38.67 Mb) and OAR11 (28.02–28.52 Mb) in Chinese Merino are caused by the artificial selection for body size trait performed on candidate genes.
The ROH on OAR10 (27.31–29.84 Mb) found in this study overlapped a common ROH island in Swiss sheep breeds [18] and Spanish sheep breeds [21]. More importantly, relaxin-like receptor 2 (RXFP2) gene was harbored in this genomic region. The ROH hotspot region also overlapped the selective signatures in RXFP2 across many sheep breeds [27,32,45,46,47,48]. GWAS results demonstrated that RXFP2 region was associated with horn phenotype in sheep [49]. The selective sweep region harbouring RXFP2 was also identified in Merino [31], and this region was successfully used to predict the horned and polled phenotypes in Merino [50,51]. Additionally, the recombination rate on this genome region was relatively high. These findings support the effects of genetic recombination and selection on ROH hotspot formation.
Besides, the ROH hotspots on OAR2 (51.10–52.41 Mb) could be overlapped with a region under climate-associated selection that harbors two genes (e.g., MELK and GNE) [44]. The ROH hotspots on OAR5 (18.66–19.86 Mb) contained several immune-related genes (e.g., IL4, IL13, IL5, and IRF1) within the genome region, and this selection signature has been detected in sheep breeds [33].

5. Conclusions

In this study, the distribution patterns of ROH in Chinese Merino were analyzed based on the Ovine SNP50 BeadChip data. Our results demonstrated that the genome of Chinese Merino harbored a lower abundance of ROH, and the levels of ROH abundance were consistent with the effective population size. Moreover, both short and long ROH were detected, indicating that the ancient and recent inbreeding may have an impact on the genome of Merino sheep breed. It was also found that the ROH hotspots in sheep were formed through recombination and selection. In addition, several candidate genes were detected in ROH hotspots, revealing that the selection process for body size, horn, and immune traits in Chinese Merino has left distinctive signatures and formed ROH hotspots. The findings of this study can contribute to the identification of candidate genes associated with economically important traits in Merino sheep.

Supplementary Materials

The following are available online at https://www.mdpi.com/2076-2615/10/3/524/s1, Table S1: Candidate genes within ROH hotspots. Figure S1. The mean sum of runs of homozygosity (ROH) per animal estimated within four different generation categories. ROH were mapped according to their genetic positions. ROH length within each category was calculated using 100/2 g, replacing g with the number of generations of interest.

Author Contributions

Conceptualization, W.L. and S.H.; methodology, S.H.; software, S.H.; validation, W.L. and M.L.; formal analysis, S.H.; investigation, L.C. and B.H.; resources, J.D. and W.L.; data curation, J.D. and B.H.; writing—original draft preparation, S.H.; writing—review and editing, S.H.,W.L. and M.L.; visualization, S.H.; supervision, W.L.; project administration, M.L.; funding acquisition, S.H. and W.L. All authors have read and agreed to the published version of the manuscript.

Funding

This research was funded by The Key Laboratory Research Grant of Xinjiang Province (2016D03016).

Acknowledgments

This work was also supported by Natural Science Foundations of China (U1303284), National High Technology Research and Development program of China (2013AA102506), Tianshan Innovation Team program (2018D14004) and Tianshan Xuesong program (2018XS16).

Conflicts of Interest

The authors declare no conflict of interest.

References

  1. Ceballos, F.C.; Joshi, P.K.; Clark, D.W.; Ramsay, M.; Wilson, J.F. Runs of homozygosity: Windows into population history and trait architecture. Nat. Rev. Genet. 2018, 19, 220. [Google Scholar] [CrossRef] [PubMed]
  2. Bosse, M.; Megens, H.J.; Madsen, O.; Paudel, Y.; Frantz, L.A.F.; Schook, L.B.; Crooijmans, R.P.M.A.; Groenen, M.A.M. Regions of Homozygosity in the Porcine Genome: Consequence of Demography and the Recombination Landscape. PLoS Genetics 2012, 8. [Google Scholar] [CrossRef] [Green Version]
  3. Ferenčaković, M.; Hamzić, E.; Gredler, B.; Solberg, T.; Klemetsdal, G.; Curik, I.; Sölkner, J. Estimates of autozygosity derived from runs of homozygosity: Empirical evidence from selected cattle populations. J. Anim. Breed. Genet. 2013, 130, 286–293. [Google Scholar] [CrossRef] [PubMed]
  4. Baumung, R.; Sölkner, J. Pedigree and marker information requirements to monitor genetic variability. Genet. Sel. Evol. 2003, 35, 369–383. [Google Scholar] [CrossRef] [PubMed]
  5. Keller, M.C.; Visscher, P.M.; Goddard, M.E. Quantification of inbreeding due to distant ancestors and its detection using dense single nucleotide polymorphism data. Genetics 2011, 189, 237–249. [Google Scholar] [CrossRef] [PubMed] [Green Version]
  6. Purfield, D.C.; Berry, D.P.; McParland, S.; Bradley, D.G. Runs of homozygosity and population history in cattle. BMC Genet. 2012, 13, 70. [Google Scholar] [CrossRef] [Green Version]
  7. Grilz-Seger, G.; Mesarič, M.; Cotman, M.; Neuditschko, M.; Druml, T.; Brem, G. Runs of homozygosity and population history of three horse breeds with small population size. J. Equine Vet. Sci. 2018, 71, 27–34. [Google Scholar] [CrossRef]
  8. Silió, L.; Rodríguez, M.; Fernández, A.; Barragán, C.; Benítez, R.; Óvilo, C.; Fernández, A. Measuring inbreeding and inbreeding depression on pig growth from pedigree or SNP-derived metrics. J. Anim. Breed. Genet. 2013, 130, 349–360. [Google Scholar] [CrossRef]
  9. Mastrangelo, S.; Tolone, M.; Di Gerlando, R.; Fontanesi, L.; Sardina, M.; Portolano, B. Genomic inbreeding estimation in small populations: Evaluation of runs of homozygosity in three local dairy cattle breeds. Animal 2016, 10, 746–754. [Google Scholar] [CrossRef] [Green Version]
  10. Chitneedi, P.; Arranz, J.; Suarez-Vega, A.; García-Gámez, E.; Gutiérrez-Gil, B. Estimations of linkage disequilibrium, effective population size and ROH-based inbreeding coefficients in Spanish Churra sheep using imputed high-density SNP genotypes. Anim. Genet. 2017, 48, 436–446. [Google Scholar] [CrossRef]
  11. Pemberton, T.J.; Absher, D.; Feldman, M.W.; Myers, R.M.; Rosenberg, N.A.; Li, J.Z. Genomic patterns of homozygosity in worldwide human populations. Am. J. Hum. Genet. 2012, 91, 275–292. [Google Scholar] [CrossRef] [PubMed] [Green Version]
  12. Zhang, Q.; Guldbrandtsen, B.; Bosse, M.; Lund, M.S.; Sahana, G. Runs of homozygosity and distribution of functional variants in the cattle genome. BMC Genom. 2015, 16, 542. [Google Scholar] [CrossRef] [PubMed] [Green Version]
  13. Kim, E.-S.; Cole, J.B.; Huson, H.; Wiggans, G.R.; Van Tassell, C.P.; Crooker, B.A.; Liu, G.; Da, Y.; Sonstegard, T.S. Effect of artificial selection on runs of homozygosity in US Holstein cattle. PLoS ONE 2013, 8, e80813. [Google Scholar]
  14. Metzger, J.; Karwath, M.; Tonda, R.; Beltran, S.; Águeda, L.; Gut, M.; Gut, I.G.; Distl, O. Runs of homozygosity reveal signatures of positive selection for reproduction traits in breed and non-breed horses. BMC Genom. 2015, 16, 764. [Google Scholar] [CrossRef] [PubMed] [Green Version]
  15. Mastrangelo, S.; Sardina, M.; Tolone, M.; Di Gerlando, R.; Sutera, A.; Fontanesi, L.; Portolano, B. Genome-wide identification of runs of homozygosity islands and associated genes in local dairy cattle breeds. Animal 2018, 12, 2480–2488. [Google Scholar] [CrossRef] [PubMed]
  16. Kim, E.-S.; Sonstegard, T.S.; Rothschild, M.F. Recent artificial selection in US Jersey cattle impacts autozygosity levels of specific genomic regions. BMC Genom. 2015, 16, 302. [Google Scholar] [CrossRef] [Green Version]
  17. Mastrangelo, S.; Tolone, M.; Sardina, M.T.; Sottile, G.; Sutera, A.M.; Di Gerlando, R.; Portolano, B. Genome-wide scan for runs of homozygosity identifies potential candidate genes associated with local adaptation in Valle del Belice sheep. Genet. Sel. Evol. 2017, 49, 84. [Google Scholar] [CrossRef] [Green Version]
  18. Signer-Hasler, H.; Burren, A.; Ammann, P.; Drögemüller, C.; Flury, C. Runs of homozygosity and signatures of selection: A comparison among eight local Swiss sheep breeds. Anim. Genet. 2019, 50, 512–525. [Google Scholar] [CrossRef]
  19. Purfield, D.C.; McParland, S.; Wall, E.; Berry, D.P. The distribution of runs of homozygosity and selection signatures in six commercial meat sheep breeds. PLoS ONE 2017, 12, e0176780. [Google Scholar] [CrossRef] [Green Version]
  20. Grilz-Seger, G.; Druml, T.; Neuditschko, M.; Mesarič, M.; Cotman, M.; Brem, G. Analysis of ROH patterns in the Noriker horse breed reveals signatures of selection for coat color and body size. Anim. Genet. 2019, 50, 334–346. [Google Scholar] [CrossRef]
  21. Luigi-Sierra, M.; Cardoso, T.; Martínez, A.; Pons, A.; Bermejo, L.; Jordana, J.; Delgado, J.; Adán, S.; Ugarte, E.; Arranz, J. Low genome-wide homozygosity in 11 Spanish ovine breeds. Anim. Genet. 2019, 50, 501–511. [Google Scholar] [CrossRef] [PubMed]
  22. Mastrangelo, S.; Ciani, E.; Sardina, M.; Sottile, G.; Pilla, F.; Portolano, B.; Consortium, B.O.I. Runs of homozygosity reveal genome-wide autozygosity in Italian sheep breeds. Anim. Genet. 2018, 49, 71–81. [Google Scholar] [CrossRef] [PubMed] [Green Version]
  23. Johnston, S.E.; Bérénos, C.; Slate, J.; Pemberton, J.M. Conserved genetic architecture underlying individual recombination rate variation in a wild population of Soay sheep (Ovis aries). Genetics 2016, 203, 583–598. [Google Scholar] [CrossRef] [PubMed] [Green Version]
  24. Zhou, Y.; Zhou, B.; Pache, L.; Chang, M.; Khodabakhshi, A.H.; Tanaseichuk, O.; Benner, C.; Chanda, S.K. Metascape provides a biologist-oriented resource for the analysis of systems-level datasets. Nat. Commun. 2019, 10, 1523. [Google Scholar] [CrossRef] [PubMed]
  25. Peripolli, E.; Munari, D.; Silva, M.; Lima, A.; Irgang, R.; Baldi, F. Runs of homozygosity: Current knowledge and applications in livestock. Anim. Genet. 2017, 48, 255–271. [Google Scholar] [CrossRef]
  26. Al-Mamun, H.A.; Clark, S.A.; Kwan, P.; Gondro, C. Genome-wide linkage disequilibrium and genetic diversity in five populations of Australian domestic sheep. Genet. Sel. Evol. 2015, 47, 90. [Google Scholar] [CrossRef] [Green Version]
  27. Kijas, J.W.; Lenstra, J.A.; Hayes, B.; Boitard, S.; Neto, L.R.P.; San Cristobal, M.; Servin, B.; McCulloch, R.; Whan, V.; Gietzen, K. Genome-wide analysis of the world’s sheep breeds reveals high levels of historic mixture and strong recent selection. PLoS Biol. 2012, 10, e1001258. [Google Scholar] [CrossRef] [Green Version]
  28. Liu, S.; He, S.; Chen, L.; Li, W.; Di, J.; Liu, M. Estimates of linkage disequilibrium and effective population sizes in Chinese Merino (Xinjiang type) sheep by genome-wide SNPs. Genes Genom. 2017, 39, 733–745. [Google Scholar] [CrossRef] [Green Version]
  29. Xie, R.; Shi, L.; Liu, J.; Deng, T.; Wang, L.; Liu, Y.; Zhao, F. Genome-Wide Scan for Runs of Homozygosity Identifies Candidate Genes in Three Pig Breeds. Animals 2019, 9, 518. [Google Scholar] [CrossRef] [Green Version]
  30. Zavarez, L.B.; Utsunomiya, Y.T.; Carmo, A.S.; Neves, H.H.; Carvalheiro, R.; Ferenčaković, M.; Pérez, O.; Brien, A.M.; Curik, I.; Cole, J.B.; et al. Assessment of autozygosity in Nellore cows (Bos indicus) through high-density SNP genotypes. Front. Genet. 2015, 6, 5. [Google Scholar] [CrossRef] [Green Version]
  31. Megdiche, S.; Mastrangelo, S.; Ben Hamouda, M.; Lenstra, J.A.; Ciani, E. Merino and Merino-derived sheep breeds: A further look at genome-wide selection signatures for wool traits. Front. Genet. 2019, 10, 1025. [Google Scholar] [CrossRef] [PubMed] [Green Version]
  32. Fariello, M.-I.; Servin, B.; Tosser-Klopp, G.; Rupp, R.; Moreno, C.; San Cristobal, M.; Boitard, S.; Consortium, I.S.G. Selection signatures in worldwide sheep populations. PLoS ONE 2014, 9. [Google Scholar] [CrossRef] [PubMed] [Green Version]
  33. Naval-Sanchez, M.; Nguyen, Q.; McWilliam, S.; Porto-Neto, L.R.; Tellam, R.; Vuocolo, T.; Reverter, A.; Perez-Enciso, M.; Brauning, R.; Clarke, S. Sheep genome functional annotation reveals proximal regulatory elements contributed to the evolution of modern breeds. Nat. Commun. 2018, 9, 859. [Google Scholar] [CrossRef] [PubMed]
  34. Gutiérrez-Gil, B.; Esteban-Blanco, C.; Wiener, P.; Chitneedi, P.K.; Suarez-Vega, A.; Arranz, J.-J. High-resolution analysis of selection sweeps identified between fine-wool Merino and coarse-wool Churra sheep breeds. Genet. Sel. Evol. 2017, 49, 81. [Google Scholar] [CrossRef] [Green Version]
  35. Al-Mamun, H.A.; Kwan, P.; Clark, S.A.; Ferdosi, M.H.; Tellam, R.; Gondro, C. Genome-wide association study of body weight in Australian Merino sheep reveals an orthologous region on OAR6 to human and bovine genomic regions affecting height and weight. Genet. Sel. Evol. 2015, 47, 66. [Google Scholar] [CrossRef] [Green Version]
  36. Gudbjartsson, D.F.; Walters, G.B.; Thorleifsson, G.; Stefansson, H.; Halldorsson, B.V.; Zusmanovich, P.; Sulem, P.; Thorlacius, S.; Gylfason, A.; Steinberg, S. Many sequence variants affecting diversity of adult human height. Nat. Genet. 2008, 40, 609. [Google Scholar] [CrossRef]
  37. Soranzo, N.; Rivadeneira, F.; Chinappen-Horsley, U.; Malkina, I.; Richards, J.B.; Hammond, N.; Stolk, L.; Nica, A.; Inouye, M.; Hofman, A. Meta-analysis of genome-wide scans for human adult stature identifies novel Loci and associations with measures of skeletal frame size. PLoS Genet. 2009, 5, e1000445. [Google Scholar] [CrossRef]
  38. Liu, R.; Sun, Y.; Zhao, G.; Wang, F.; Wu, D.; Zheng, M.; Chen, J.; Zhang, L.; Hu, Y.; Wen, J. Genome-wide association study identifies loci and candidate genes for body composition and meat quality traits in Beijing-You chickens. PLoS ONE 2013, 8, e61172. [Google Scholar] [CrossRef]
  39. Lindholm-Perry, A.K.; Sexten, A.K.; Kuehn, L.A.; Smith, T.P.; King, D.A.; Shackelford, S.D.; Wheeler, T.L.; Ferrell, C.L.; Jenkins, T.G.; Snelling, W.M. Association, effects and validation of polymorphisms within the NCAPG-LCORL locus located on BTA6 with feed intake, gain, meat and carcass traits in beef cattle. BMC Genet. 2011, 12, 103. [Google Scholar] [CrossRef] [Green Version]
  40. Makvandi-Nejad, S.; Hoffman, G.E.; Allen, J.J.; Chu, E.; Gu, E.; Chandler, A.M.; Loredo, A.I.; Bellone, R.R.; Mezey, J.G.; Brooks, S.A. Four loci explain 83% of size variation in the horse. PLoS ONE 2012, 7, e39929. [Google Scholar] [CrossRef] [Green Version]
  41. Tetens, J.; Widmann, P.; Kühn, C.; Thaller, G. A genome-wide association study indicates LCORL/NCAPG as a candidate locus for withers height in G erman W armblood horses. Anim. Genet. 2013, 44, 467–471. [Google Scholar] [CrossRef] [PubMed]
  42. Kim, E.-S.; Elbeltagy, A.; Aboul-Naga, A.; Rischkowsky, B.; Sayre, B.; Mwacharo, J.M.; Rothschild, M.F. Multiple genomic signatures of selection in goats and sheep indigenous to a hot arid environment. Heredity 2016, 116, 255–264. [Google Scholar] [CrossRef] [PubMed]
  43. Kominakis, A.; Hager-Theodorides, A.L.; Zoidis, E.; Saridaki, A.; Antonakos, G.; Tsiamis, G. Combined GWAS and ‘guilt by association’-based prioritization analysis identifies functional candidate genes for body size in sheep. Genet. Sel. Evol. 2017, 49, 41. [Google Scholar] [CrossRef]
  44. Lv, F.-H.; Agha, S.; Kantanen, J.; Colli, L.; Stucki, S.; Kijas, J.W.; Joost, S.; Li, M.-H.; Ajmone Marsan, P. Adaptations to climate-mediated selective pressures in sheep. Mol. Biol. Evol. 2014, 31, 3324–3343. [Google Scholar] [CrossRef] [PubMed] [Green Version]
  45. Manunza, A.; Cardoso, T.F.; Noce, A.; Martínez, A.; Pons, A.; Bermejo, L.; Landi, V.; Sànchez, A.; Jordana, J.; Delgado, J.V. Population structure of eleven Spanish ovine breeds and detection of selective sweeps with BayeScan and hapFLK. Sci. Rep. 2016, 6, 1–10. [Google Scholar] [CrossRef] [Green Version]
  46. Pan, Z.; Li, S.; Liu, Q.; Wang, Z.; Zhou, Z.; Di, R.; Miao, B.; Hu, W.; Wang, X.; Hu, X. Whole-genome sequences of 89 Chinese sheep suggest role of RXFP2 in the development of unique horn phenotype as response to semi-feralization. GigaScience 2018, 7, giy019. [Google Scholar] [CrossRef]
  47. Kardos, M.; Luikart, G.; Bunch, R.; Dewey, S.; Edwards, W.; McWilliam, S.; Stephenson, J.; Allendorf, F.W.; Hogg, J.T.; Kijas, J. Whole-genome resequencing uncovers molecular signatures of natural and sexual selection in wild bighorn sheep. Mol. Ecol. 2015, 24, 5616–5632. [Google Scholar] [CrossRef]
  48. Randhawa, I.A.S.; Khatkar, M.S.; Thomson, P.C.; Raadsma, H.W. Composite selection signals can localize the trait specific genomic regions in multi-breed populations of cattle and sheep. BMC Genet. 2014, 15, 34. [Google Scholar] [CrossRef] [Green Version]
  49. Johnston, S.E.; Gratten, J.; Berenos, C.; Pilkington, J.G.; Clutton-Brock, T.H.; Pemberton, J.M.; Slate, J. Life history trade-offs at a single locus maintain sexually selected genetic variation. Nature 2013, 502, 93. [Google Scholar] [CrossRef]
  50. Dominik, S.; Henshall, J.; Hayes, B. A single nucleotide polymorphism on chromosome 10 is highly predictive for the polled phenotype in Australian Merino sheep. Anim. Genet. 2012, 43, 468–470. [Google Scholar] [CrossRef]
  51. Duijvesteijn, N.; Bolormaa, S.; Daetwyler, H.D.; van der Werf, J.H. Genomic prediction of the polled and horned phenotypes in Merino sheep. Genet. Sel. Evol. 2018, 50, 28. [Google Scholar] [CrossRef] [PubMed] [Green Version]
Figure 1. Total number of runs of homozygosity (ROH) exceeding 1 Mb and total length of genome (in Mb) covered by ROH segments in Chinese Merino.
Animals 10 00524 g001
Figure 2. The percent frequency and mean sum of ROH in Chinese Merino under different length categories. (A) The percentage of ROH in the four ROH length categories. (B) The mean sum of ROH in the four ROH length categories.
Animals 10 00524 g002
Figure 3. Total number of ROH per chromosome (gray bars) and average percentage of each chromosome covered by ROH (red line).
Animals 10 00524 g003
Figure 4. Distribution of ROH-based inbreeding coefficients (FROHOAR) on each Ovies aries chromosome (OAR).
Animals 10 00524 g004
Figure 5. Manhattan plot of the occurrence of single nucleotide polymorphisms (SNPs) in ROH islands across different chromosomes.
Animals 10 00524 g005
Table 1. The number of genotyped animals and descriptive statistics of runs of homozygosity (ROH)-based inbreeding coefficient (FROH) under different length categories.
Inbreeding CoefficientMeanMedianMinimumMaximumCoefficient of VariationNumber of Animals
FROH1-5Mb0.0080.0080.0010.02452.25632
FROH5-10Mb0.0080.0060.0020.03169.30541
FROH10-20Mb0.0100.0070.0040.04264.02293
FROH>20Mb0.0220.0140.0080.10988.2499
FROH>1Mb0.0230.0180.0010.16084.05634
Table 2. ROH hotspots detected in Chinese Merino and average recombination rate (cM/Mb) within each hotspot.
No.OARStart (bp)Stop (bp)Length (bp)SNPsGenescM/Mb
112329437926901948360756962200.15
22199305872108005911494722600.13
32511060735240937913033062390.75
42534155845575820823426244910.94
5315839152516096310425715794120.77
651865938619857252119786613251.16
763507572738668794359306759180.79
810273056192984238325367646191.32
91034325096418025537477457132270.27
10112542557326939891151431822731.18
111128019509285188594933501450.96
12112896970428969704011/
1316329455613298257937018200
OAR = Ovies aries chromosome, SNPs = Number of SNPs in each ROH hotspot, Genes = Number of genes in each ROH hotspot.
Table 3. Gene ontology (GO) term and Kyoto Encyclopedia of Genes and Genomes (KEGG) pathway enriched data (−log10P > 2) based on the annotated genes in ROH hotspots.
CategoryDescription−log10P
GO Biological Processes
GO:0000079Regulation of cyclin-dependent protein serine/threonine kinase activity3.84
GO:0002639Positive regulation of immunoglobulin production3.47
GO:0048599Oocyte development3.36
GO:0048839Inner ear development3.12
GO:0007568Aging3.03
GO:0060079Excitatory postsynaptic potential2.96
GO:0031214Biomineral tissue development2.76
GO:0036465Synaptic vesicle recycling2.69
GO:1902692Regulation of neuroblast proliferation2.68
GO:0047496Vesicle transport along microtubule2.24
GO:0043065Positive regulation of apoptotic process2.20
GO:0051052Regulation of DNA metabolic process2.20
GO:0040008Regulation of growth2.15
GO:0007566Embryo implantation2.14
Reactome Gene Sets
R-HSA-5099900WNT5A-dependent internalization of FZD43.71
R-HSA-190828Gap junction trafficking3.32
Canonical Pathways
M219PID hedgehog-GLI pathway3.28
KEGG Pathway
hsa04918Thyroid hormone synthesis2.58
hsa04961Endocrine and other factor-regulated calcium reabsorption2.24
hsa00330Arginine and proline metabolism2.16
Table 4. ROH hotspots detected in Chinese Merino overlap with the selection signatures in sheep.
OARPosition (Mb)Overlap Selection Signature ReferenceCandidate GeneFunction
251.10–52.41Lv Fenghua et al. [44]MELK, GNEEnvironment adaption
518.66–19.86Naval-Sanchez et al. [33]IL4, IL13
IL5, IRF1
Immune function
635.08–38.67Fariello et al. [32]
Gutiérrez-Gil et al. [34]
Naval-Sanchez et al. [33]
Signer-Hasler et al. [18]
NCAPG,
LCORL
Weight/height
1027.31–29.84Kijas et al. [27]
Manunza et al. [45]
Fariello et al. [32]
Pan et al. [46]
Kardos et al. [47]
Randhawa et al. [48]
RXFP2Horn
1128.02–28.52Signer-Hasler et al. [18]
Kim et al. [42]
FGF11, TP53Body size
OAR = Ovies aries chromosome.

