Effects of Inhibin A on Apoptosis and Proliferation of Bovine Granulosa Cells


 and
and
Abstract
:Simple Summary
Abstract
1. Introduction
2. Materials and Methods
2.1. GCs Isolation and Culture
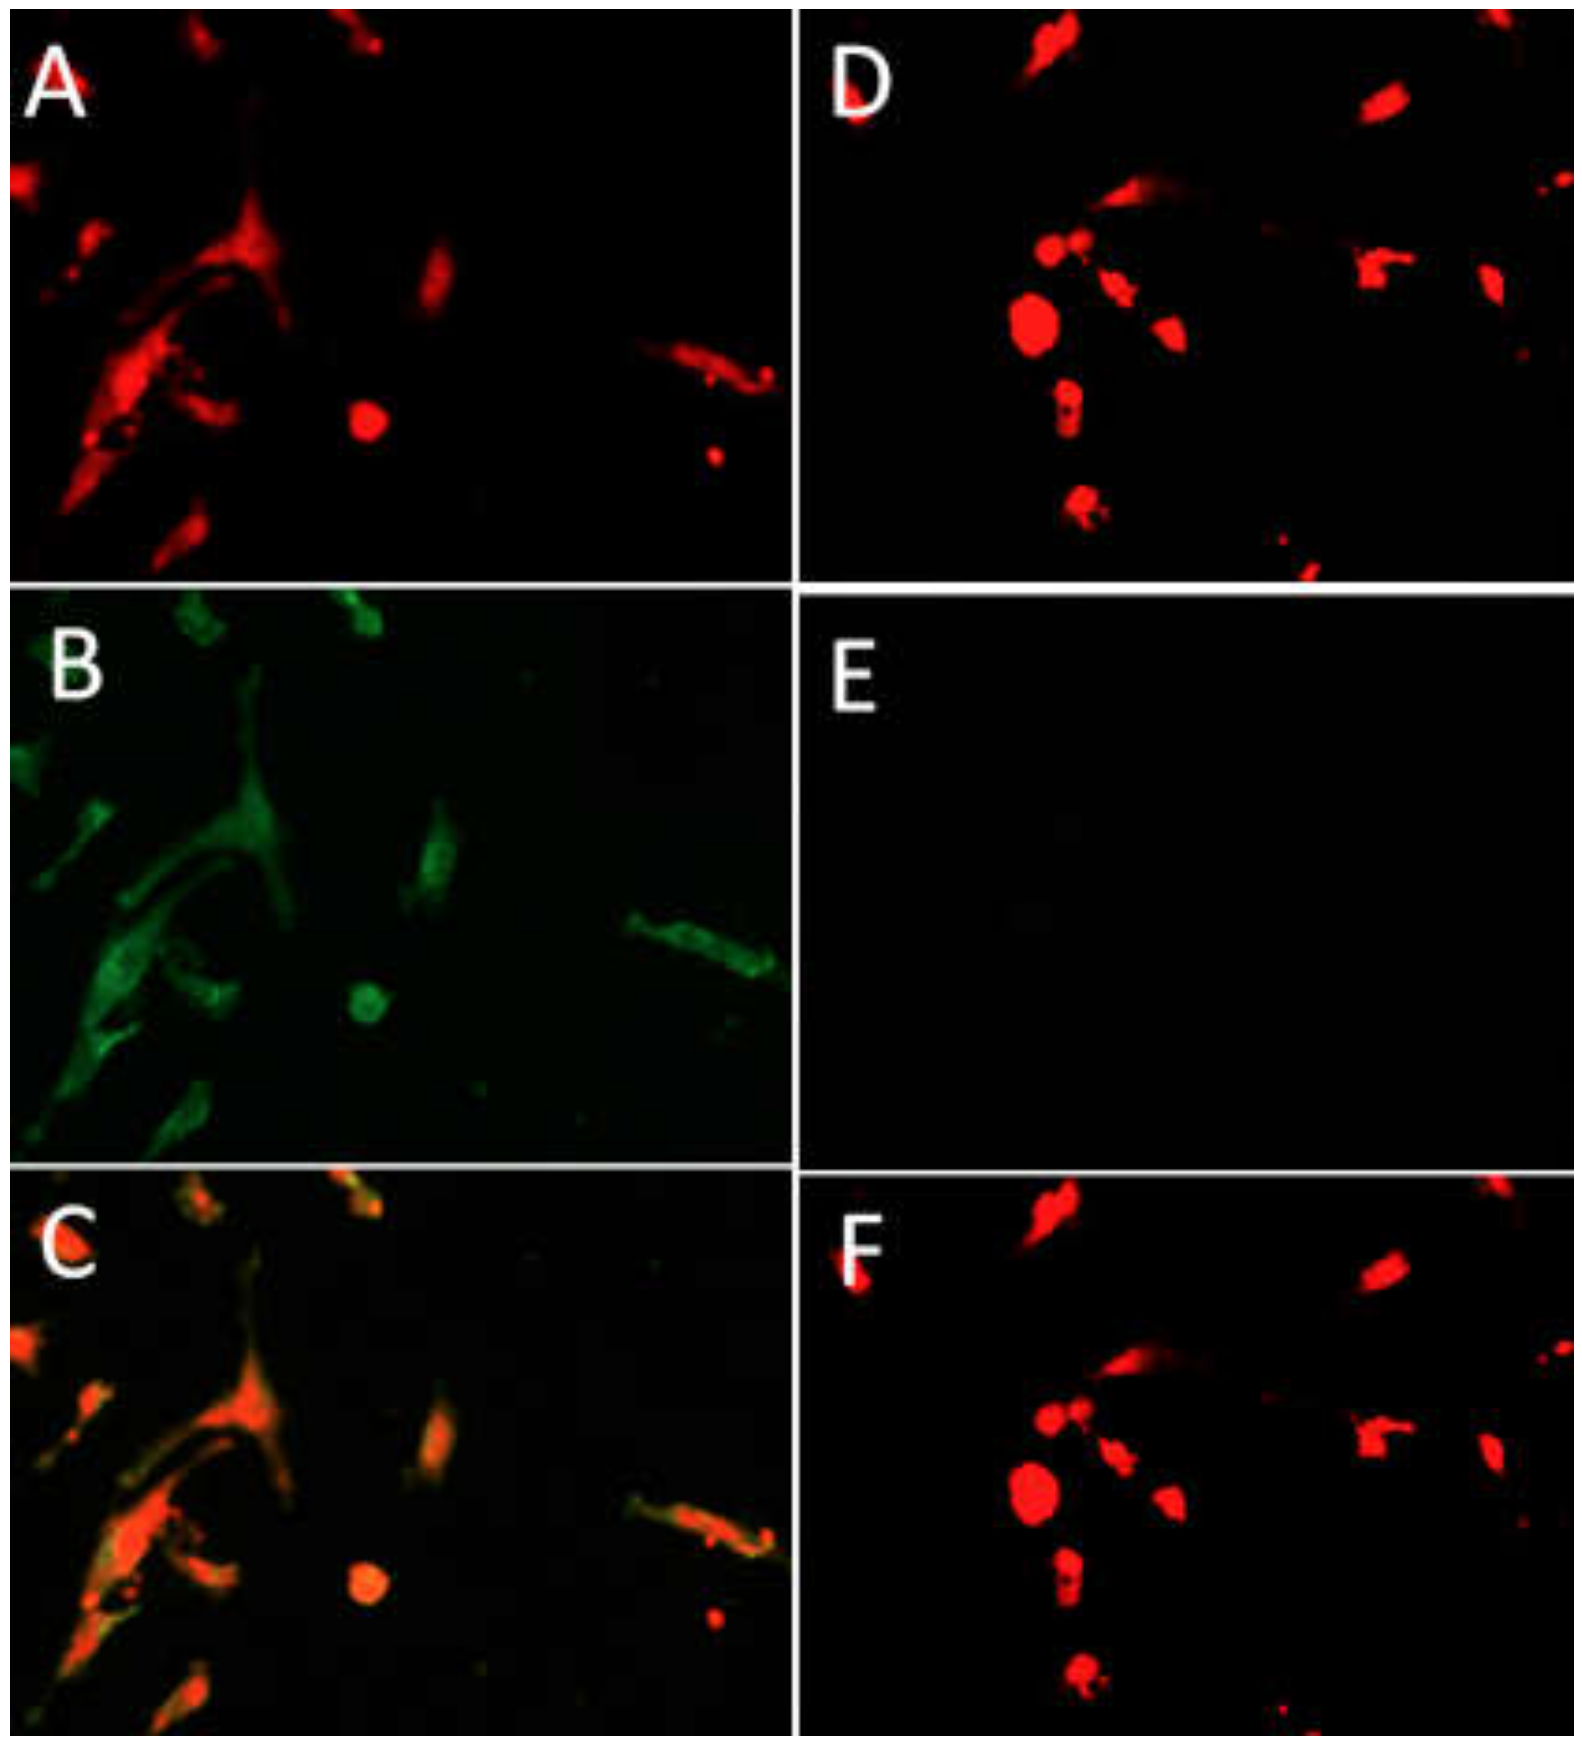
2.2. Identification of GCs by Immunofluorescence
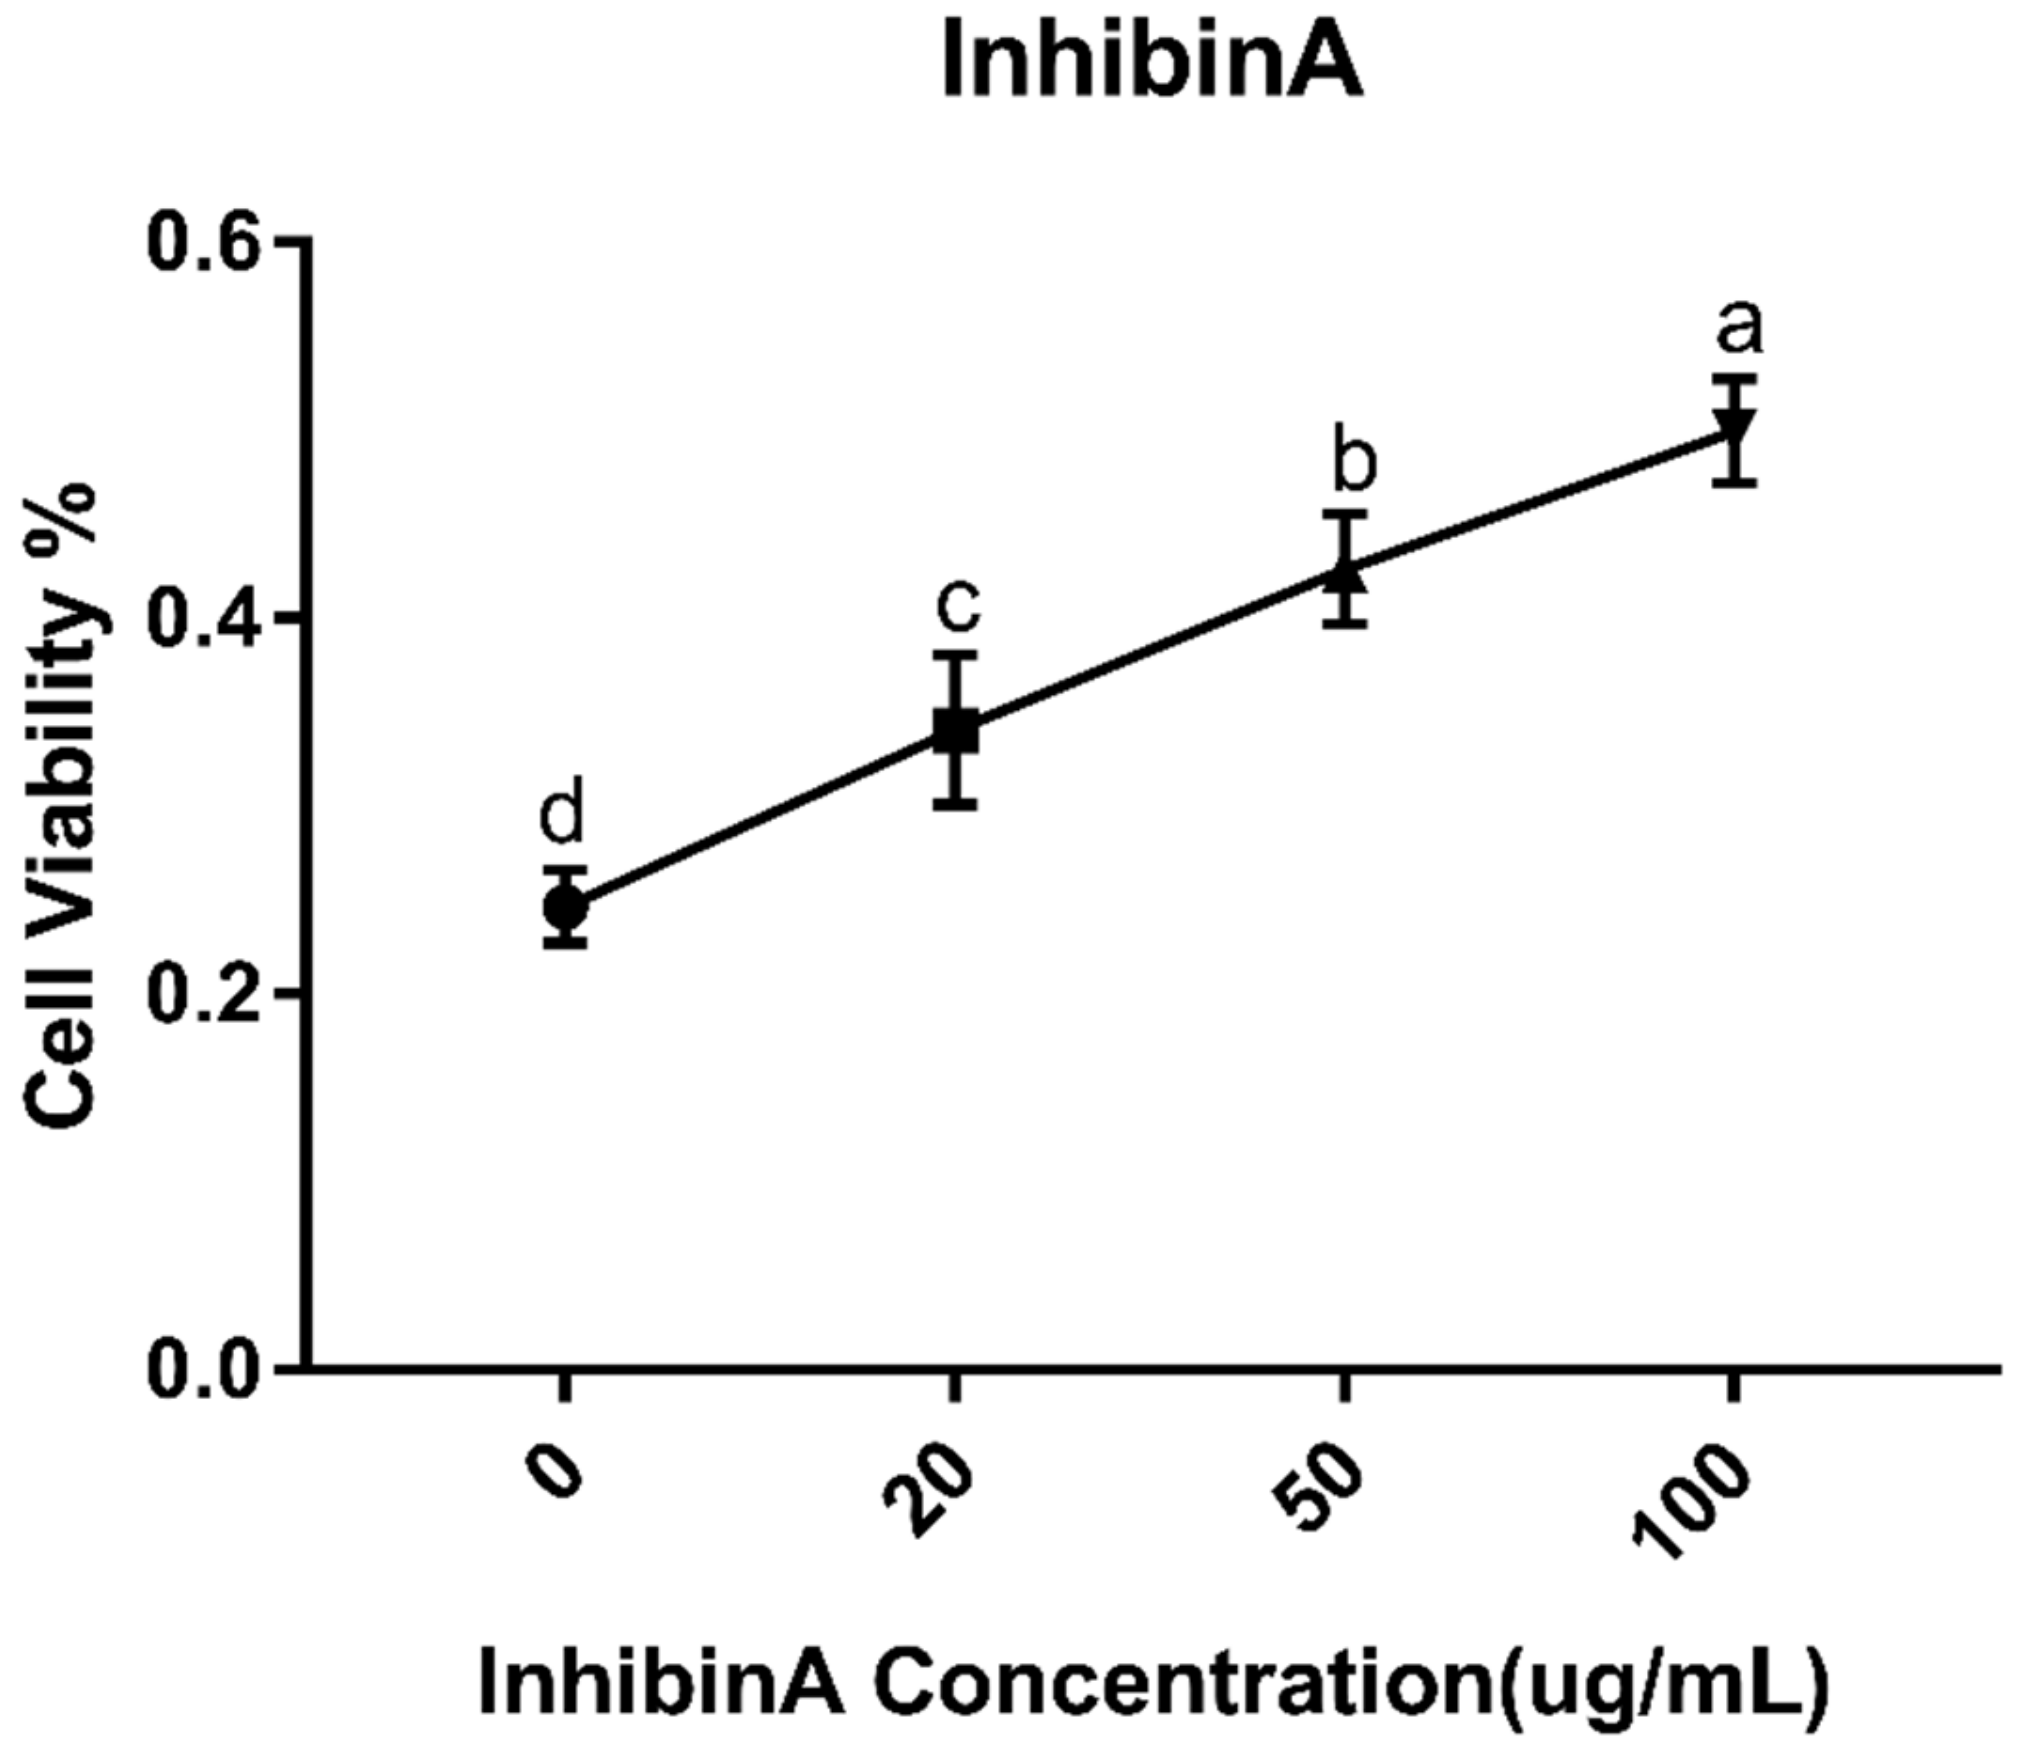
2.3. Estimation of Cell Viability
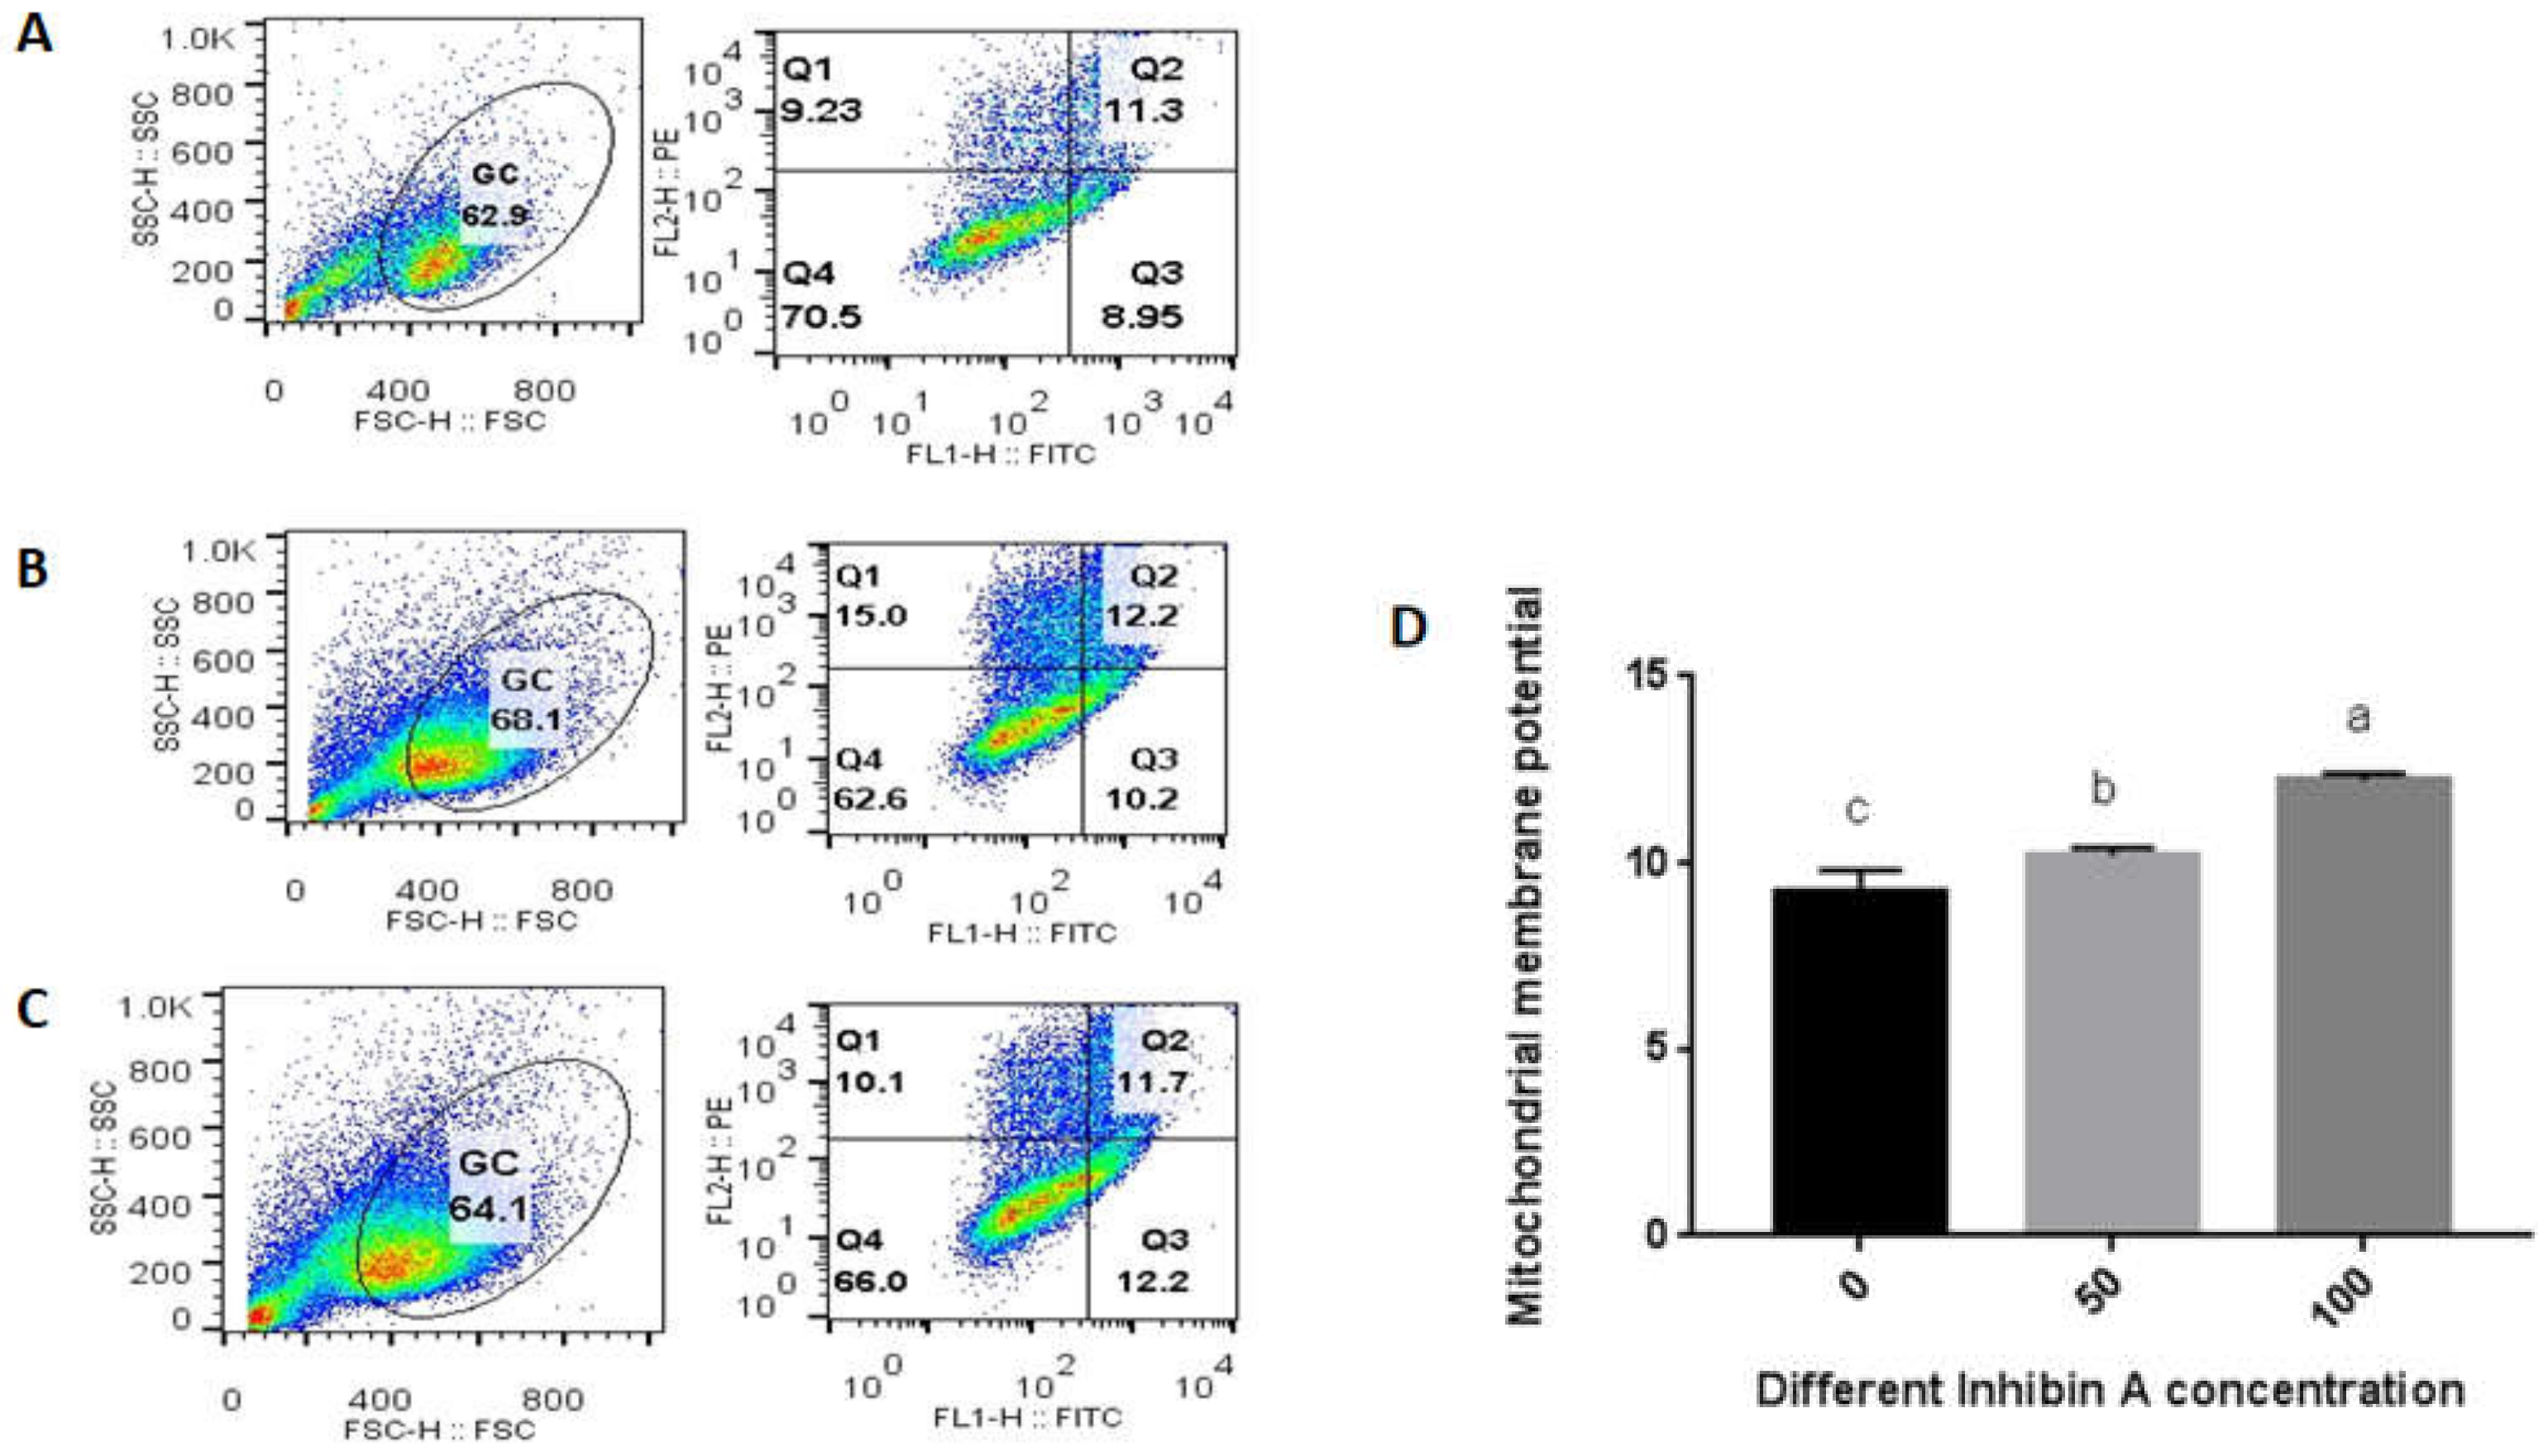
2.4. Assessment of Mitochondrial Membrane Potential
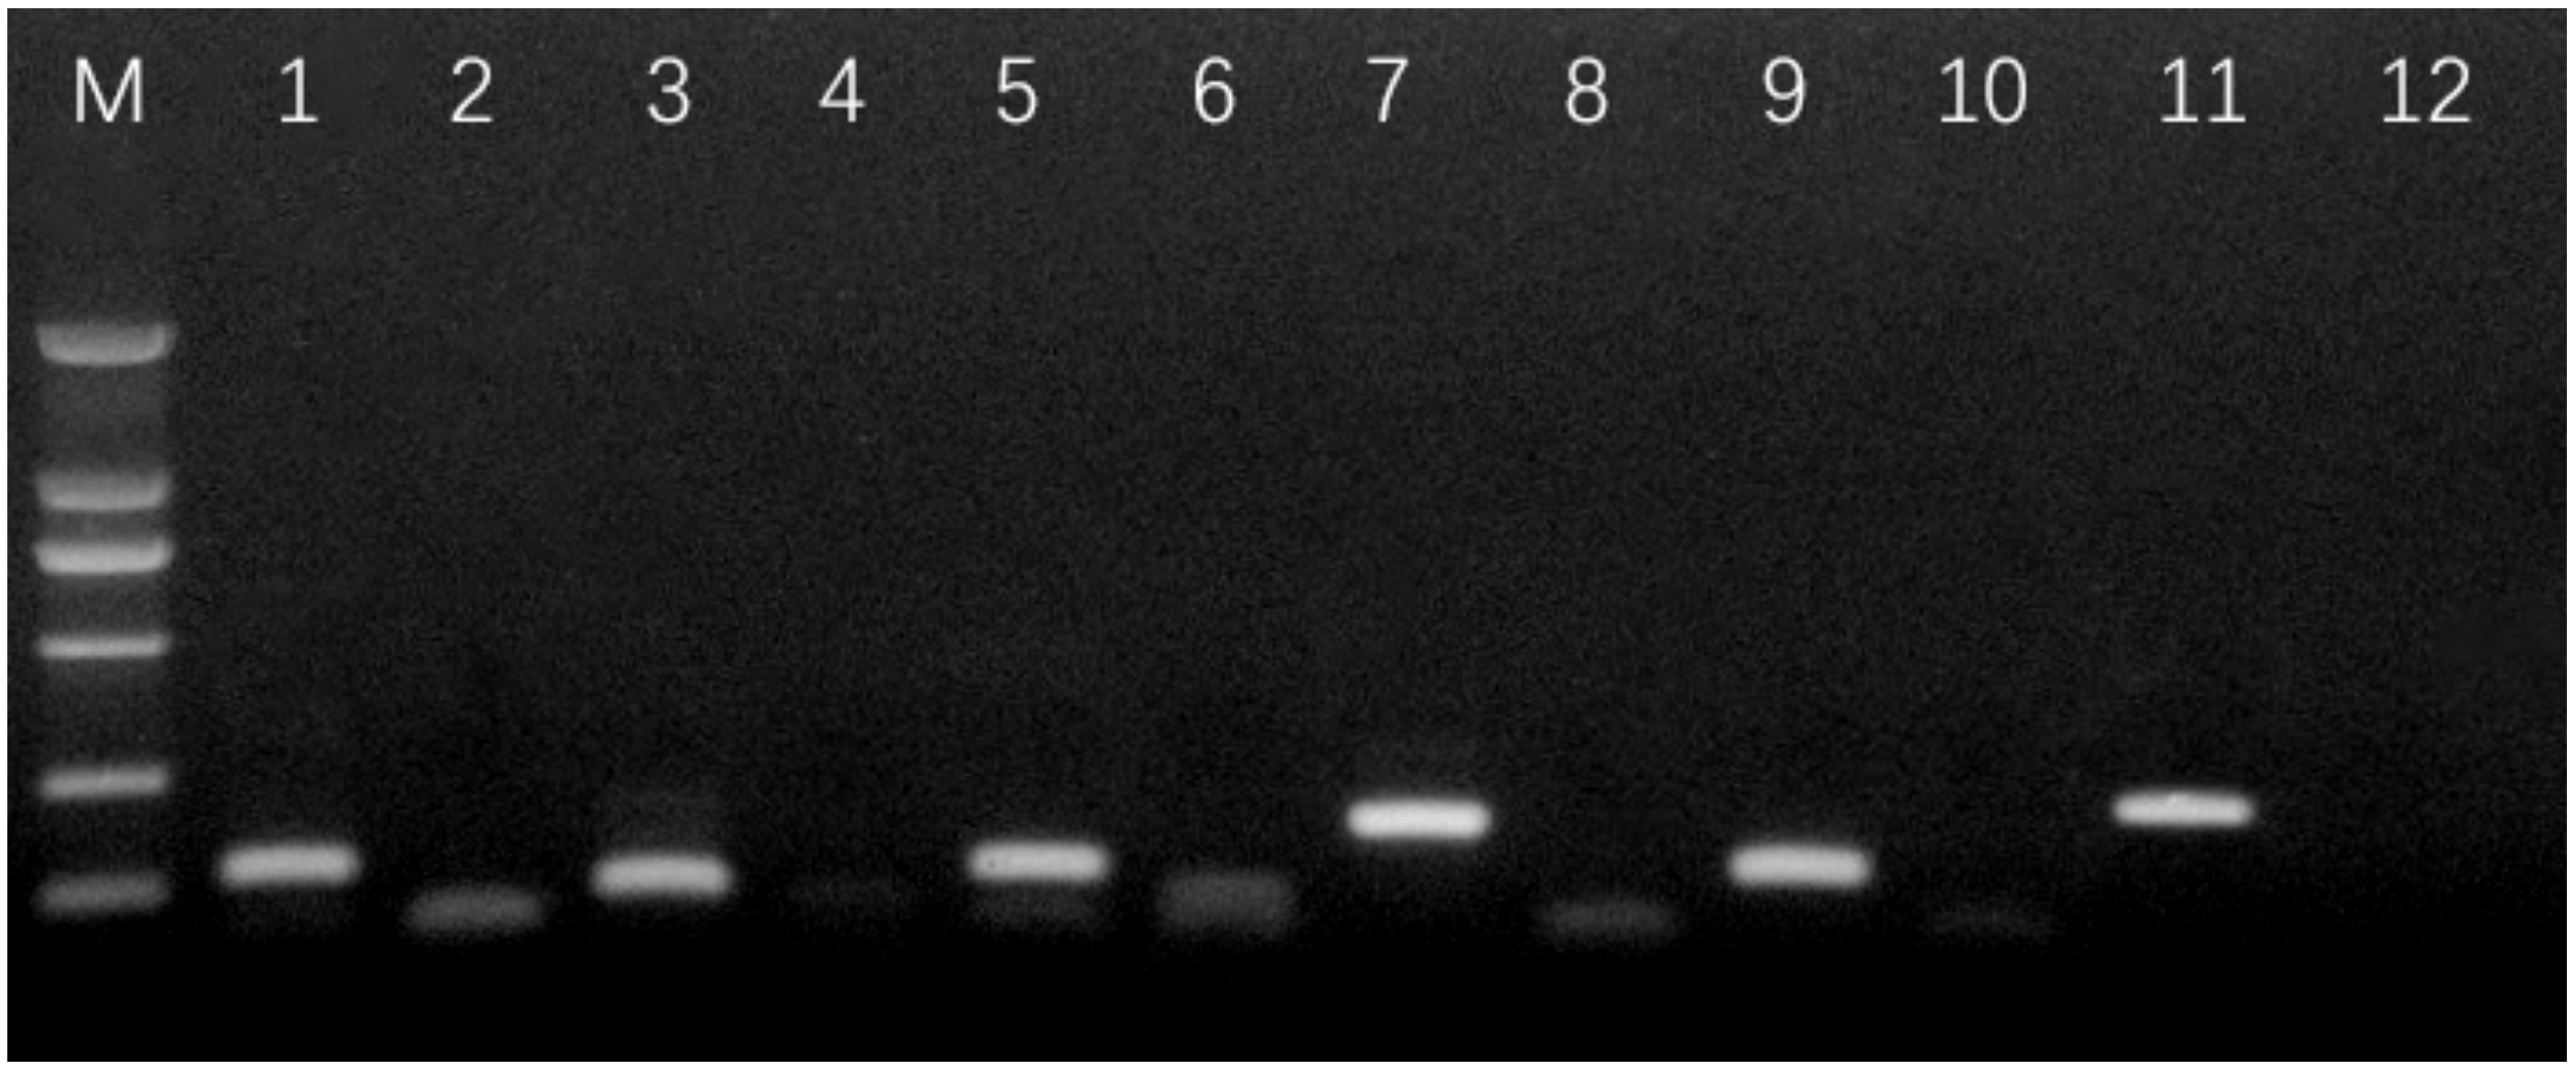
2.5. RNA Extraction and Quantitative RT-PCR (qRT-PCR)
2.6. Cell Cycle Analysis
2.7. Apoptotic Assay
2.8. Statistical Analysis
3. Results
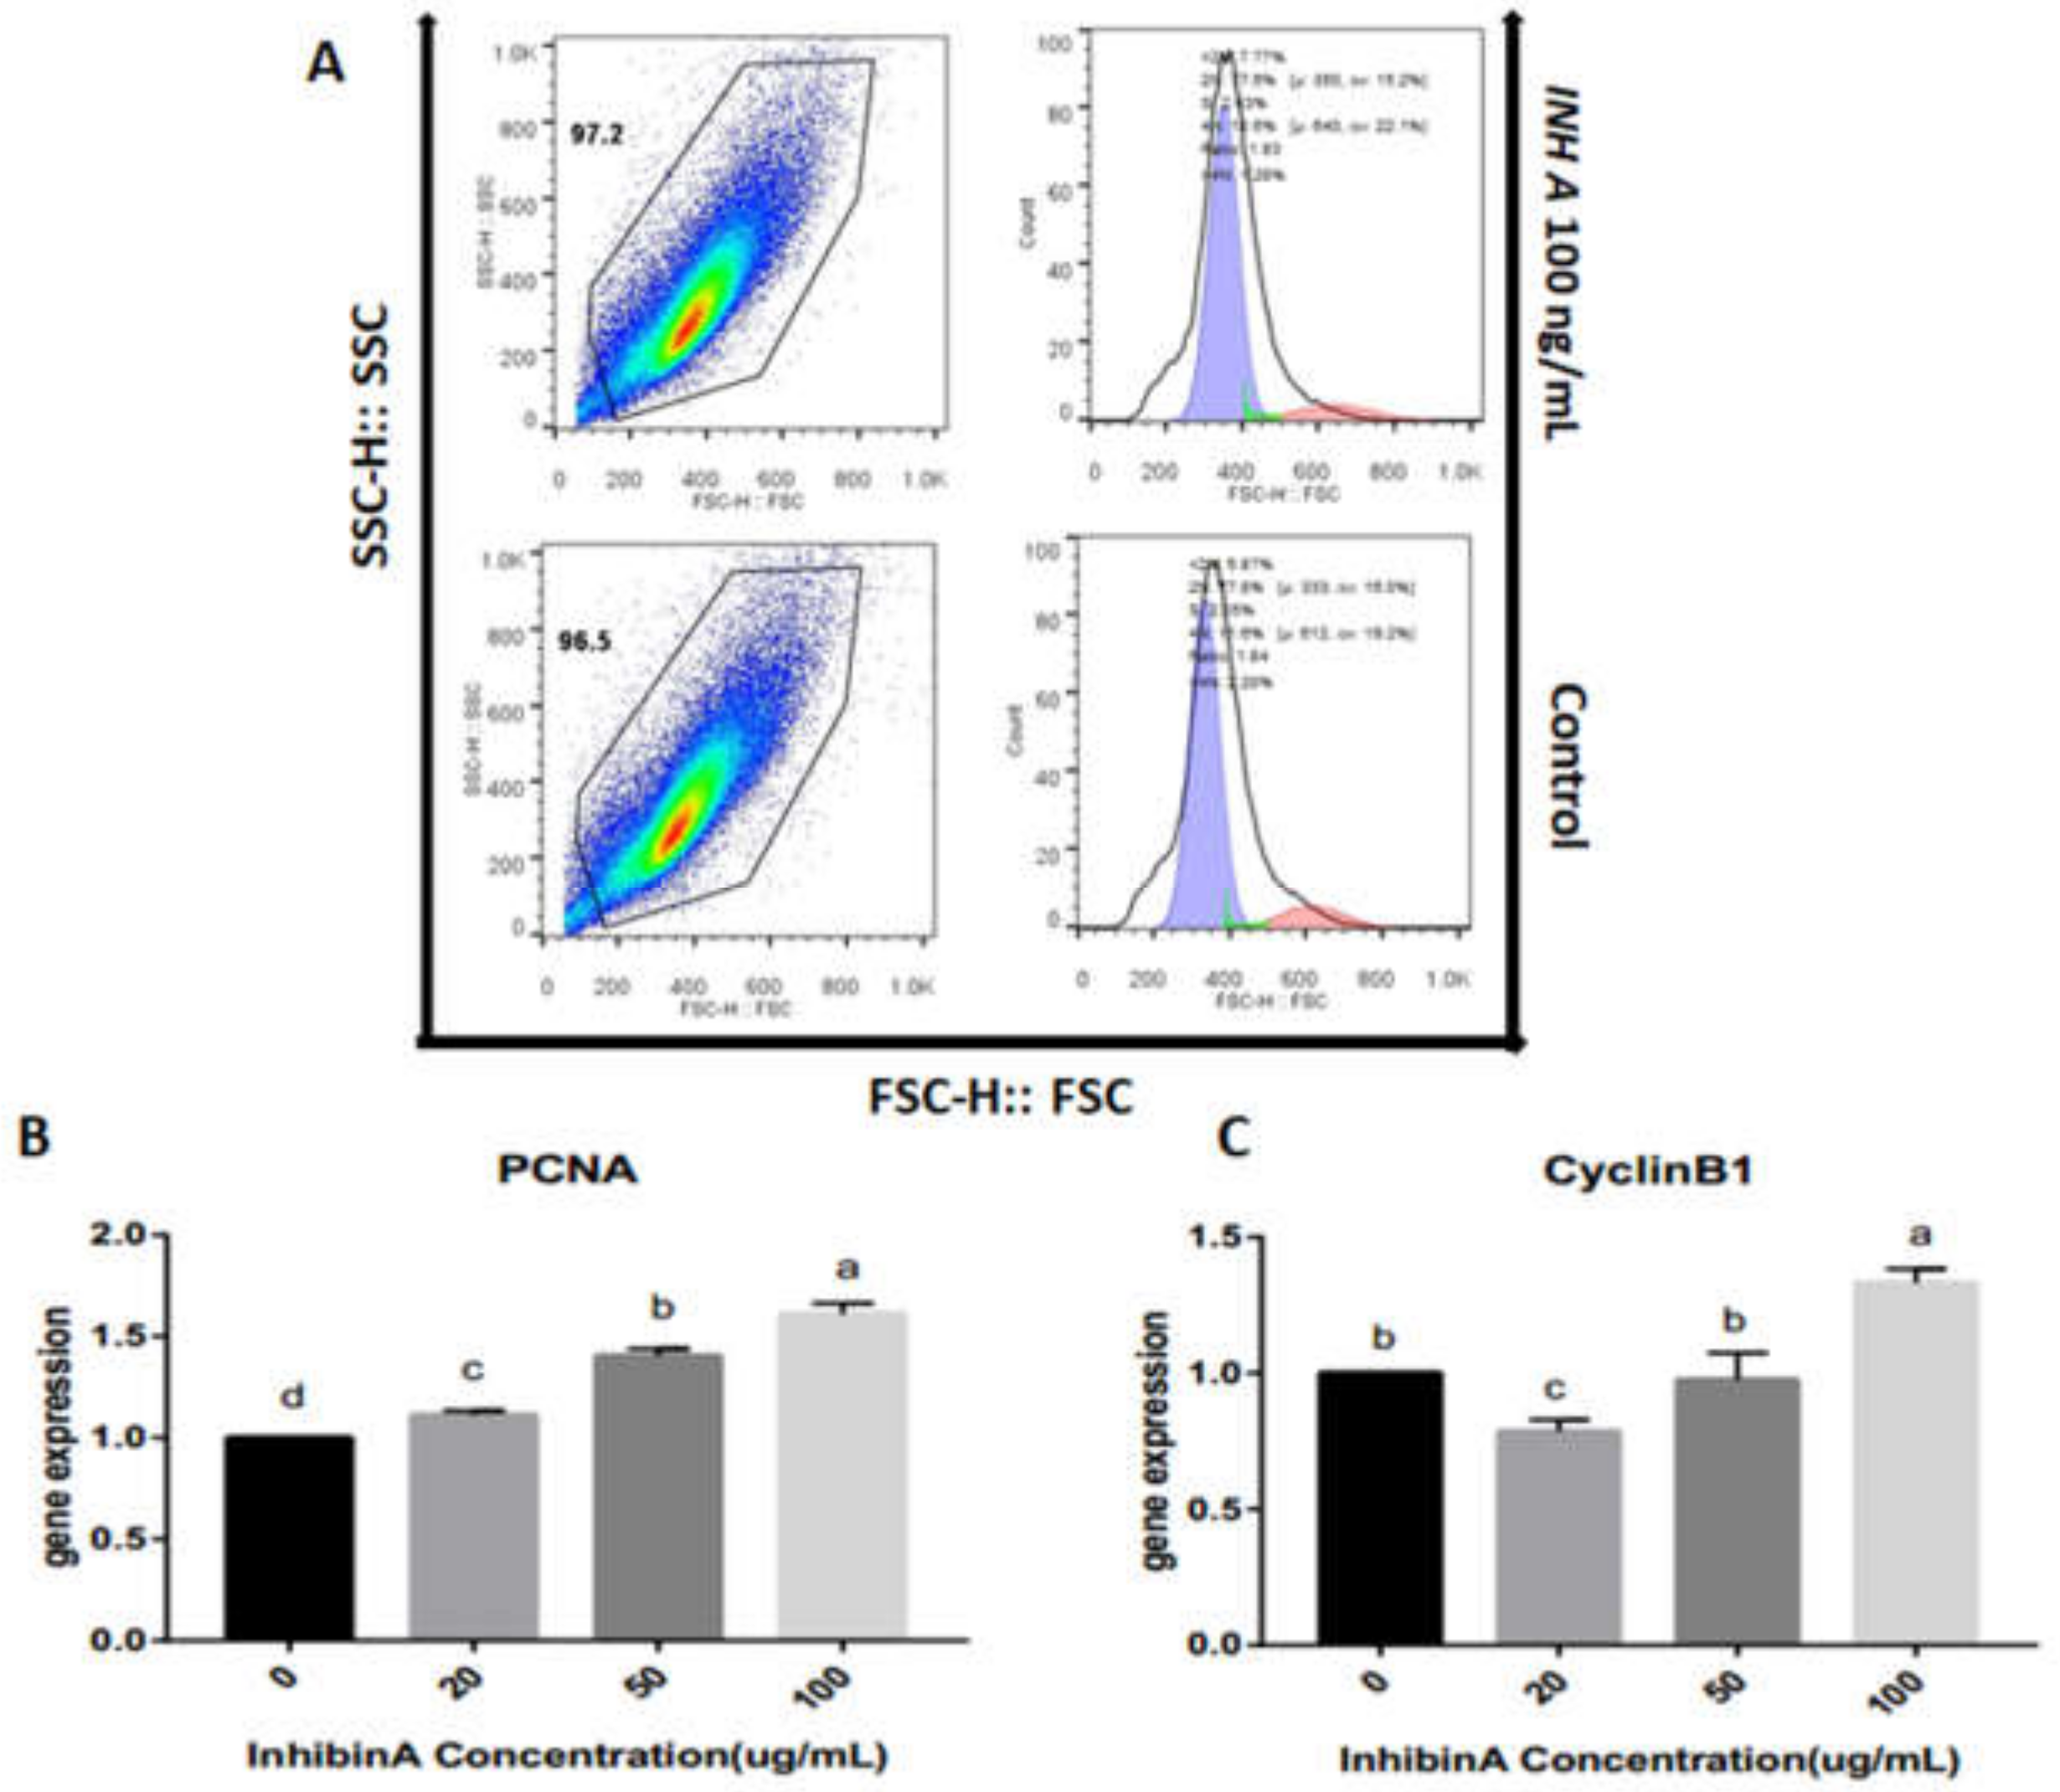
3.1. Effect of Inhibin A on GCs Identification and Viability
4.2. Effect of Inhibin A on Mitochondrial Membrane Potential
4.3. Effect of Inhibin A on Cell Cycle Progression
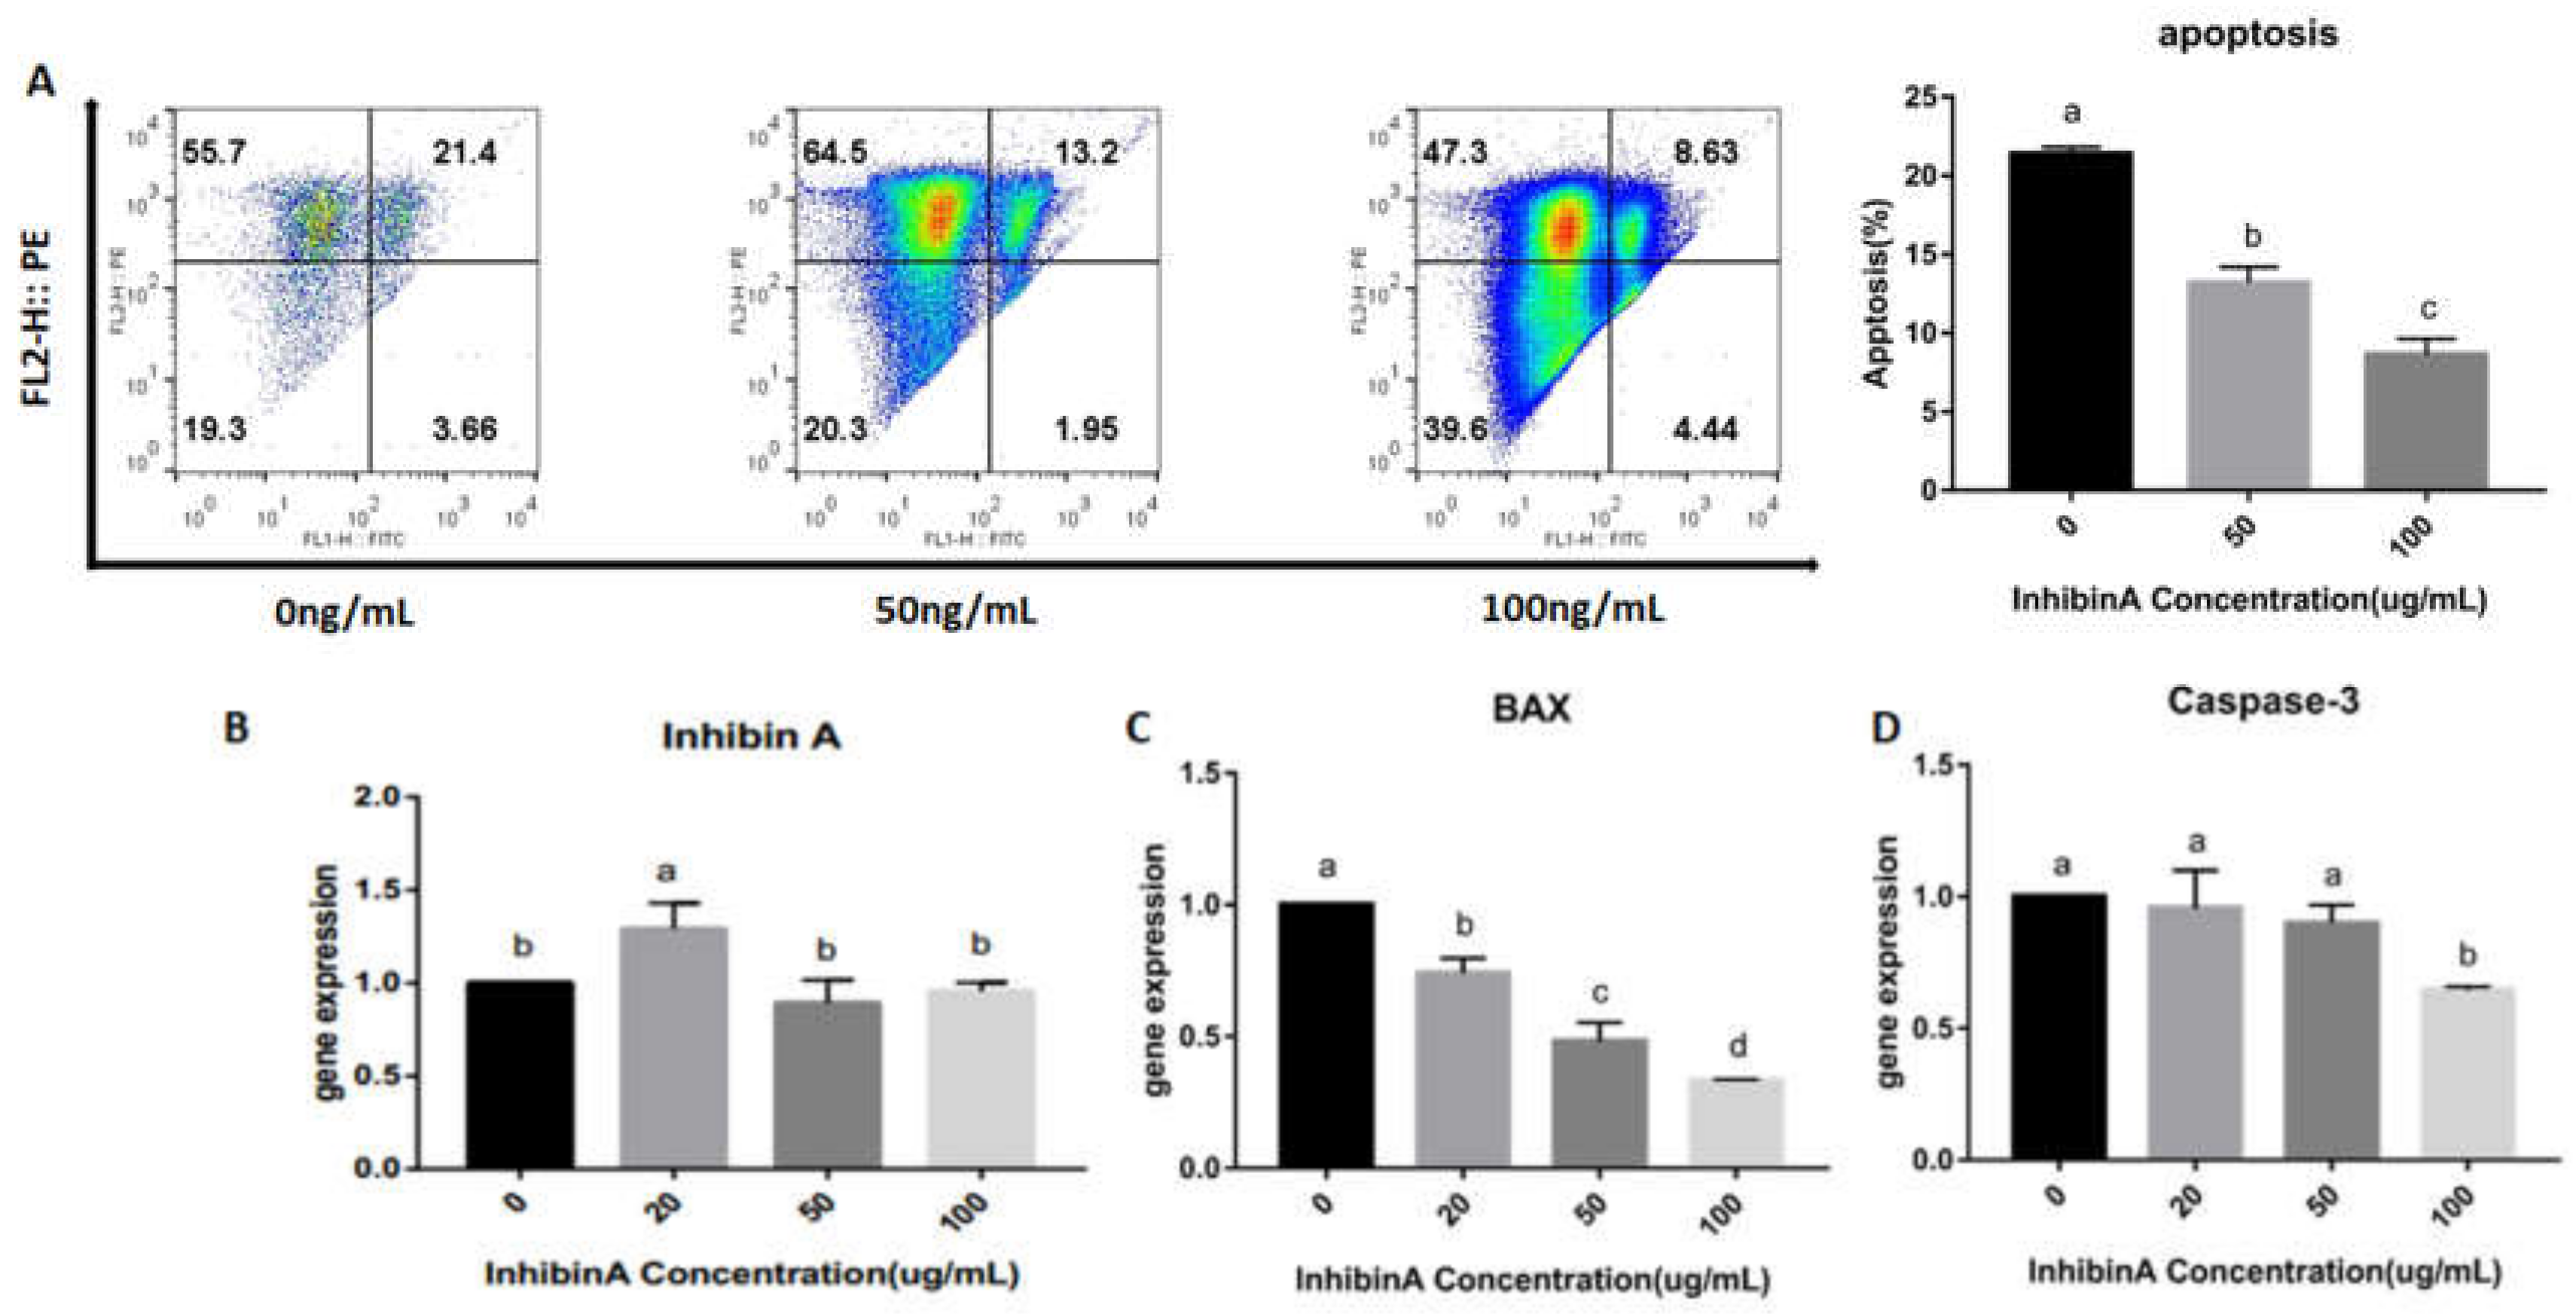
4.4. Effect of Inhibin A on GCs Apoptosis
4. Discussion
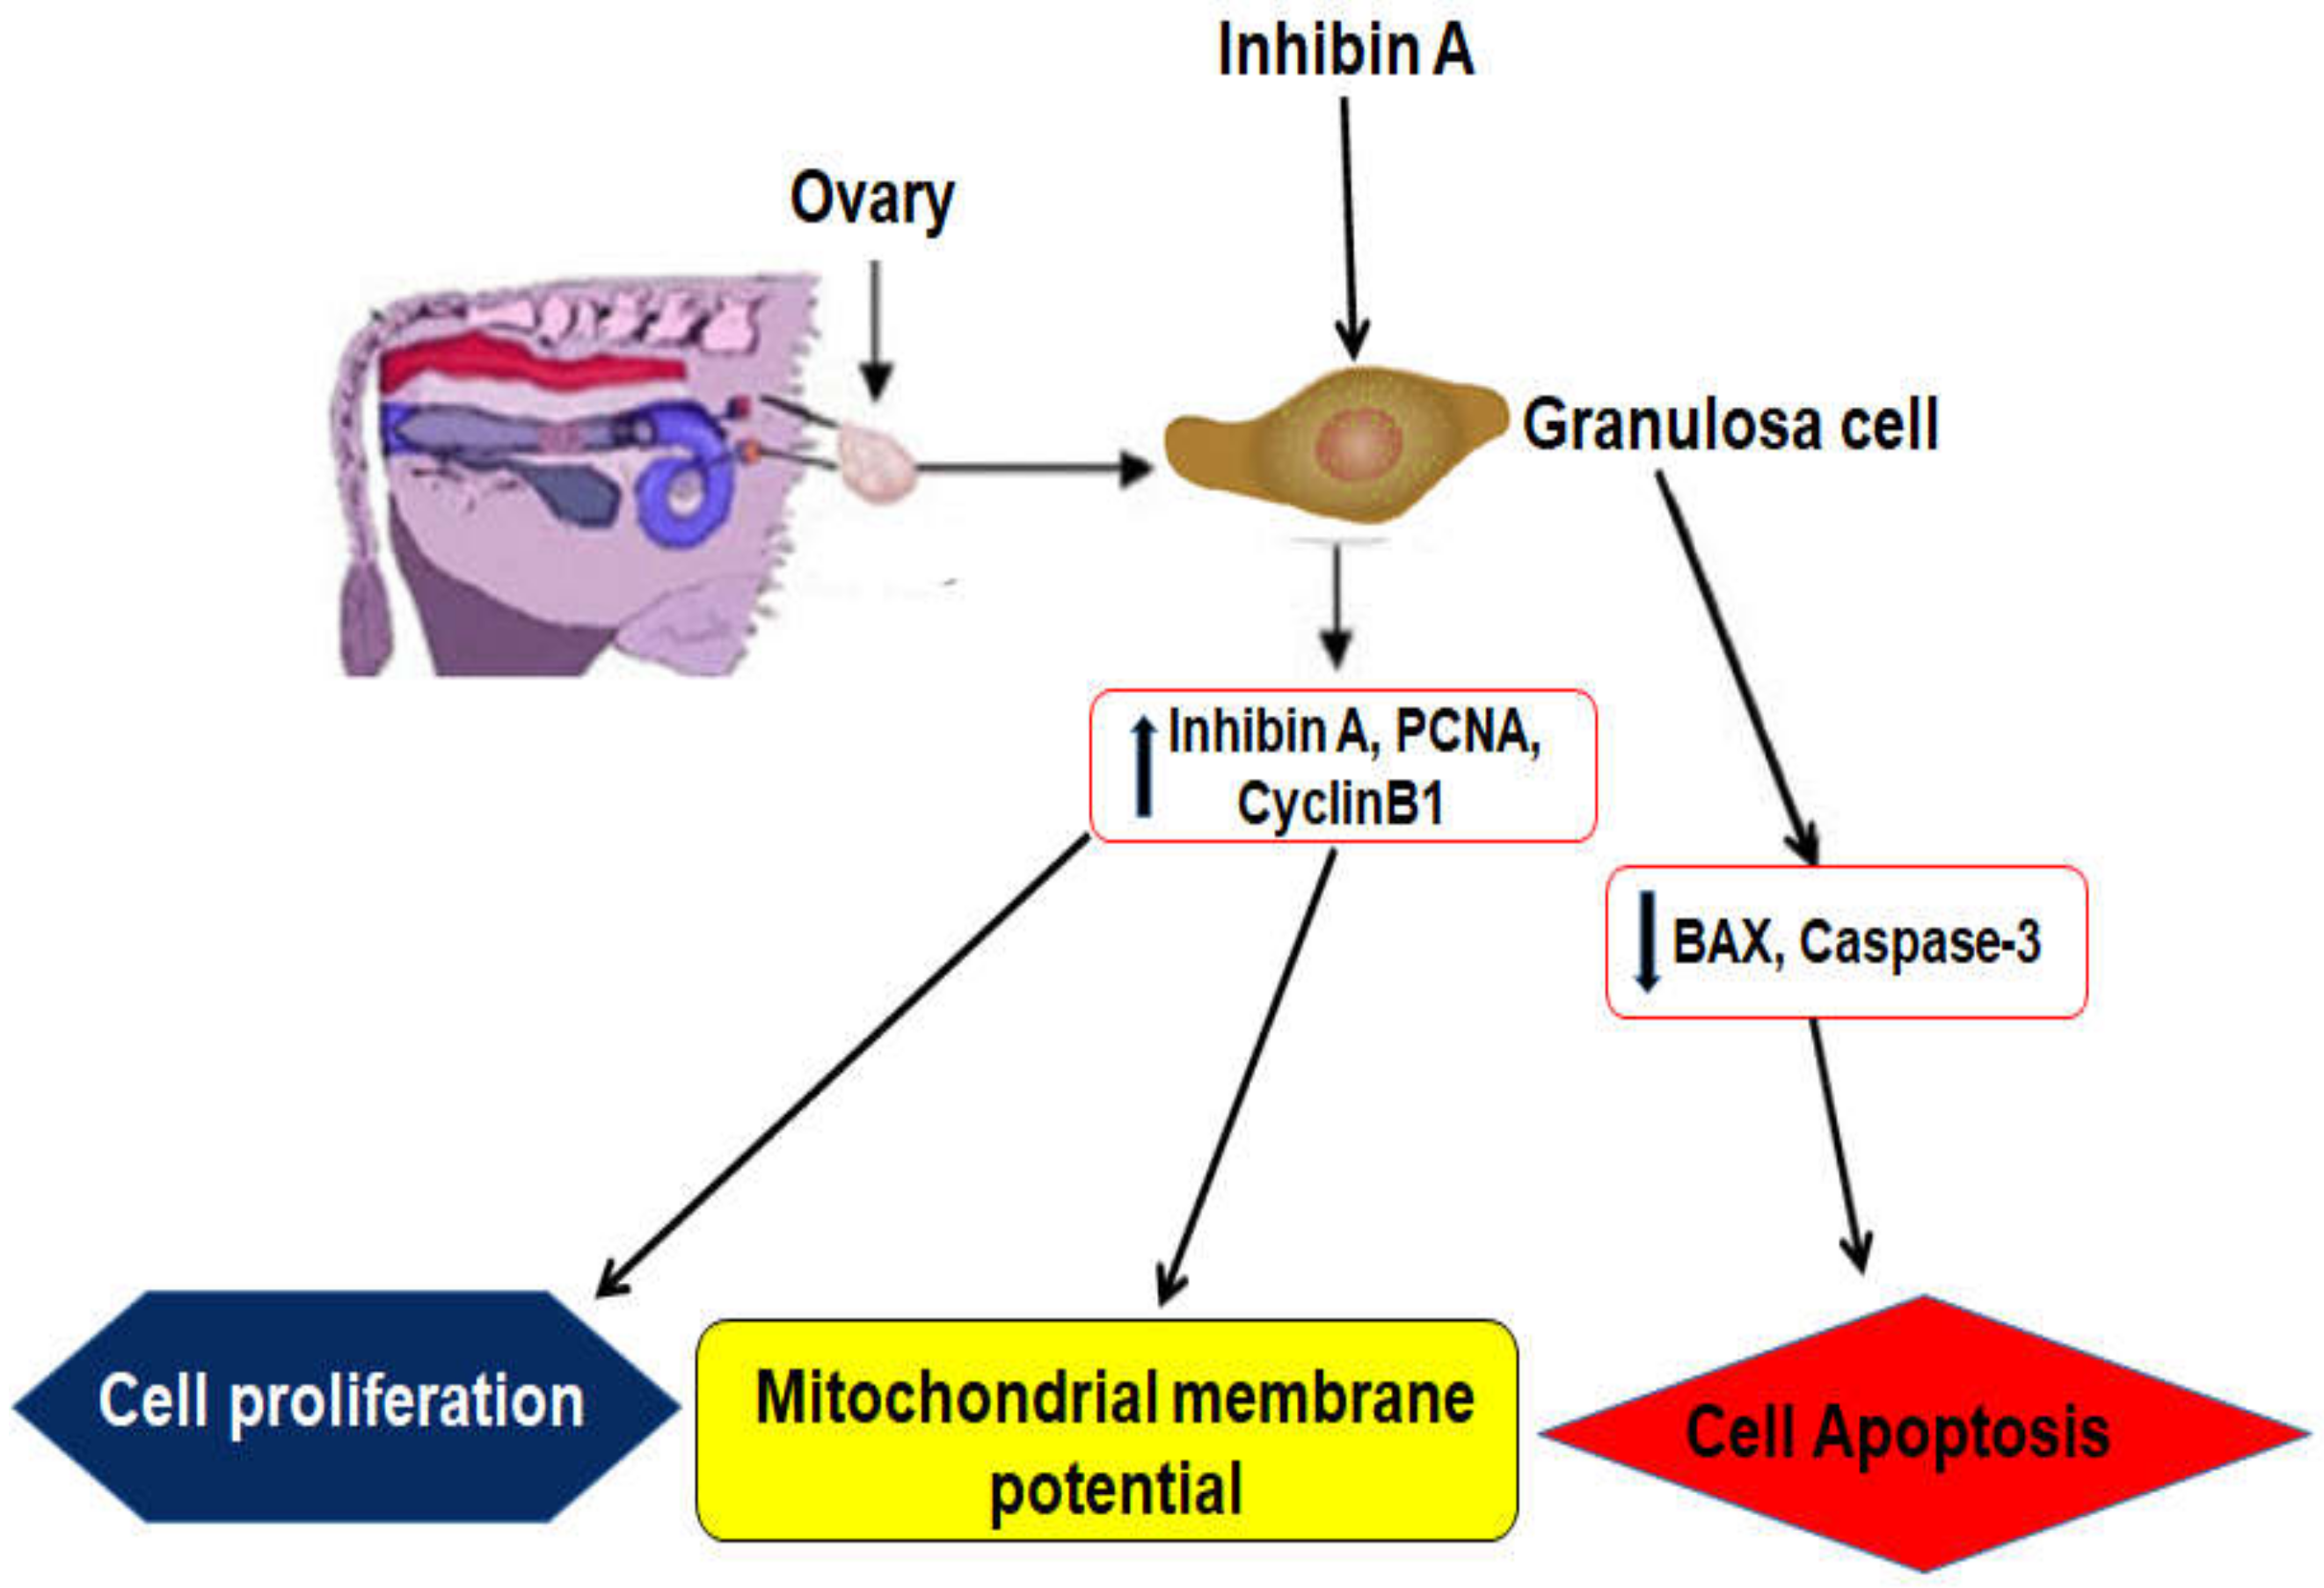
5. Conclusions
Author Contributions
Funding
Acknowledgments
Conflicts of Interest
References
- Gardner, D.G.; Shobac, D. Greenspan’s Basic & Clinical Endocrinology; McGraw-Hill: New York, NY, USA, 2011; pp. 715–720. [Google Scholar]
- Bilezikjian, L.M.; Blount, A.L.; Donaldson, C.J.; Vale, W.W. Pituitary actions of ligands of the TGF-β family: Activins and inhibins. Reproduction 2006, 132, 207–215. [Google Scholar] [CrossRef] [PubMed] [Green Version]
- Trombly, D.J.; Woodruff, T.K.; Mayo, K.E. Roles for transforming growth factor beta superfamily proteins in early folliculogenesis. Semin. Reprod. Med. 2009, 27, 14–23. [Google Scholar] [CrossRef] [PubMed] [Green Version]
- Myers, M.; Pangas, S.A. Regulatory roles of transforming growth factor beta family members in folliculogenesis. Wiley Interdiscip. Rev. Syst. Biol. Med. 2010, 2, 117–125. [Google Scholar] [CrossRef] [PubMed]
- Meng, C.; Shi, F.; Zhou, Z.; Huang, R.; Liu, G.; Watanabe, G.; Taya, K. Cellular localization of inhibin α-subunit, PKB/Akt and FoxO3a proteins in the ovaries of minipigs. J. Reprod. Dev. 2007, 53, 229–236. [Google Scholar] [CrossRef] [Green Version]
- Toulis, K.A.; Iliadou, P.K.; Venetis, C.A.; Tsametis, C.; Tarlatzis, B.C.; Papadimas, I.; Goulis, D.G. Inhibin B and anti-Müllerian hormone as markers of persistent spermatogenesis in men with non-obstructive azoospermia: A meta-analysis of diagnostic accuracy studies. Hum. Reprod. Update 2010, 16, 713–724. [Google Scholar] [CrossRef] [Green Version]
- Messinisi, I.E. Ovarian feedback, mechanism of action and possible clinical implications. Hum. Reprod. Update 2006, 12, 557–571. [Google Scholar] [CrossRef] [Green Version]
- Myers, M.; Middlebrook, B.S.; Matzuk, M.M.; Pangas, S.A. Loss of inhibin alpha uncouples oocyte-granulosa cell dynamics and disrupts postnatal folliculogenesis. Dev. Biol. 2009, 334, 458–467. [Google Scholar] [CrossRef] [Green Version]
- Lewis, K.A.; Gray, P.C.; Blount, A.L.; MacConell, L.A.; Wiater, E.; Bitezikjian, L.M.; Vate, W. Betaglycan binds inhibin and can mediate functional antagonism of activin signalling. Nature 2000, 404, 411–414. [Google Scholar] [CrossRef]
- Cheifetz, S.; Ling, N.; Guillemin, R.; Massague, J. A surface component on GH3pituitary cells that recognizes transforming growth factor-β, activin, and inhibin. J. Biol. Chem. 1988, 263, 17225–17228. [Google Scholar]
- Chen, F.; Jiang, X.; Chen, X.; Liu, G.; Ding, J. Effects of Downregulation of Inhibin α Gene Expression on Apoptosis and Proliferation of Goose Granulosa Cells. J. Genet. Genom. 2007, 34, 1106–1113. [Google Scholar] [CrossRef]
- Thériault, B.L.; Nachtigal, M.W. Human ovarian cancer cell morphology, motility, and proliferation are differentially influenced by autocrine TGFβ superfamily signalling. Cancer Lett. 2011, 313, 108–121. [Google Scholar] [CrossRef] [PubMed]
- Son, D.S.; Kabir, S.M.; Dong, Y.L.; Lee, E.; Adunyah, S.E. Inhibitory Effect of Tumor Suppressor p53 on Proinflammatory Chemokine Expression in Ovarian Cancer Cells by Reducing Proteasomal Degradation of IκB. PLoS ONE 2012, 7, e51116. [Google Scholar] [CrossRef] [PubMed]
- Zhao, B.X.; Sun, Y.B.; Wang, S.Q.; Duan, L.; Huo, Q.L.; Ren, F.; Li, G.F. feng. Grape Seed Procyanidin Reversal of P-glycoprotein Associated Multi-Drug Resistance via Down-regulation of NF-κB and MAPK/ERK Mediated YB-1 Activity in A2780/T Cells. PLoS ONE 2013, 8, e71071. [Google Scholar]
- Noguchi, M.; Yoshioka, K.; Itoh, S.; Suzuki, C.; Arai, S.; Wada, Y.; Hasegawa, Y.; Kaneko, H. Peripheral concentrations of inhibin A, ovarian steroids, and gonadotropins associated with follicular development throughout the estrous cycle of the sow. Reproduction 2010, 139, 153–161. [Google Scholar] [CrossRef] [PubMed] [Green Version]
- Li, W.; Chen, S.; Li, H.; Liu, Z.; Zhao, Y.; Chen, L.; Zhou, X.; Li, C. A new insertion/deletion fragment polymorphism of inhibin-α gene associated with follicular cysts in Large White sows. J. Vet. Med. Sci. 2016, 78, 473–476. [Google Scholar] [CrossRef] [PubMed] [Green Version]
- Voronina, E.; Lovasco, L.A.; Gyuris, A.; Baumgartner, R.A.; Parlow, A.F.; Freiman, R.N. Ovarian granulosa cell survival and proliferation requires the gonad-selective TFIID subunit TAF4b. Dev. Biol. 2007, 303, 715–726. [Google Scholar] [CrossRef] [Green Version]
- Welt, C.; Sidis, Y.; Keutmann, H.; Schneyer, A. Activins, inhibins, and follistatins: From endocrinology to signaling. A paradigm for the new millennium. Exp. Biol. Med. 2002, 227, 724–752. [Google Scholar] [CrossRef]
- Looyenga, B.D.; Wiater, E.; Vale, W.; Hammer, G.D. Inhibin-A antagonizes TGFβ2 signaling by down-regulating cell surface expression of the TGFβcoreceptor betaglycan. Mol. Endocrinol. 2010, 24, 608–620. [Google Scholar] [CrossRef] [Green Version]
- Li, W.; Sun, L.; Chen, S.; Chen, L.; Liu, Z.; Hou, X.; Chen, C.; Han, Y.; Wang, C.; Li, C.; et al. Association of inhibin-α gene polymorphisms with follicular cysts in large white sows. Theriogenology 2015, 84, 839–845. [Google Scholar] [CrossRef]
- Wang, C.; Li, C.; Li, H.; Ma, W.; Chen, S.; Zhao, Y.; Rao, J.; Zhou, X. Downregulation of the expression of inhibin α subunit and betaglycan in porcine cystic follicles. J. Vet. Med. Sci. 2015, 77, 1419–1425. [Google Scholar] [CrossRef] [Green Version]
- Vitale, A.M.; Gonzalez, O.M.; Parborell, F.; Irusta, G.; Campo, S.; Tesone, M. Inhibin A Increases Apoptosis in Early Ovarian Antral Follicles of Diethylstilbestrol-Treated Rats1. Biol. Reprod. 2002, 67, 1989–1995. [Google Scholar] [CrossRef] [PubMed] [Green Version]
- Cai, K.; Hua, G.; Ahmad, S.; Liang, A.; Han, L.; Wu, C.; Yang, F.; Yang, L. Action mechanism of inhibin α-subunit on the development of sertoli cells and first wave of spermatogenesis in mice. PLoS ONE 2011, 6, e25585. [Google Scholar] [CrossRef] [PubMed] [Green Version]
- Sun, Y.L.; Zhang, J.; Ping, Z.G.; Wang, C.Q.; Sun, Y.F.; Chen, L.; Li, X.Y.; Li, C.J.; Zhu, X.L.; Liu, Z.; et al. Relationship Between Apoptosis and Proliferation in Granulosa and Theca Cells of Cystic Follicles in Sows. Reprod. Domest. Anim. 2012, 47, 601–608. [Google Scholar] [CrossRef]
- Ghate, N.; Das, A.; Chaudhuri, D.; Panja, S.; Mandal, N. Sundew plant, a potential source of anti-inflammatory agents, selectively induces G2/M arrest and apoptosis in MCF-7 cells through upregulation of p53 and Bax/Bcl-2 ratio. Cell Death Discov. 2016, 2, 1–10. [Google Scholar] [CrossRef] [Green Version]
- Scott, M.; Bonnefin, P.; Vieyra, D.; Boisvert, F.M.; Young, D.; Bazett-Jones, D.P.; Riabowol, K. UV-induced binding of ING1 to PCNA regulates the induction of apoptosis. J. Cell Sci. 2001, 114, 3455–3462. [Google Scholar]
- Kroemer, G.; Reed, J.C. Mitochondrial control of cell death. Nat. Med. 2000, 6, 513–519. [Google Scholar] [CrossRef]
- Carrasco-Pozo, C.; Tan, K.N.; Reyes-Farias, M.; De La Jara, N.; Ngo, S.T.; Garcia-Diaz, D.F.; Llanos, P.; Cires, M.J.; Borges, K. The deleterious effect of cholesterol and protection by quercetin on mitochondrial bioenergetics of pancreatic β-cells, glycemic control and inflammation: In vitro and in vivo studies. Redox Biol. 2016, 9, 229–243. [Google Scholar] [CrossRef] [PubMed] [Green Version]
- Denkova, R.; Bourneva, V.; Staneva-Dobrovski, L.; Zvetkova, E.; Baleva, K.; Yaneva, E.; Nikolov, B.; Ivanov, I.; Simeonov, K.; Timeva, T.; et al. In vitro effects of inhibin on apoptosis and apoptosis related proteins in human ovarian granulosa cells. Endocr. Regul. 2004, 38, 51–55. [Google Scholar]
- Li, W.; Li, C.; Chen, S.; Sun, L.; Li, H.; Chen, L.; Zhou, X. Effect of inhibin A on proliferation of porcine granulosa cells in vitro. Theriogenology 2018, 114, 136–142. [Google Scholar] [CrossRef]


| Gene | Accession no. | Forward 5′→3′ | Reverse 5′→3′ |
|---|---|---|---|
| PCNA | NM_001291925.1 | GCGTTCATAGTCGTGTTCCG | TTCAAGATGGAGCCCTGGAC |
| BAX | XM_003355974.2 | GGCTGGACATTGGACTTCCTTC | TGGTCACTGTCTGCCATGTGG |
| CASP-3 | XM_005671704.1 | TACTTGGGAAGGTGTGAGAAAACTAA | AACCCGTCTCCCTTTATATTGCT |
| CyclinB1 | NM_001170768.1 | AAGACGGAGCGGATCCAAAC | CCAGTGACTTCACGACCCAT |
| INHβA | NM_214189.1 | GCTACCACGCCAACTACTGT | ACATGGGTCTCAGCTTGGTG |
| GAPDH | NM_001034034.2 | GGTGCTGAGTATGTGGTGGA | GGCATTGCTGACAATCTTGA |
| Treatment | G0/G1 | S | G2/M |
|---|---|---|---|
| Control | 77.8 ± 0.2 | 2.05 ± 0.05 a | 11.6 ± 0.4 |
| Inhibin A (100 g/mL) | 77.6 ± 0.76 | 2.43 ± 0.13 b | 10.6 ± 0.2 |
© 2020 by the authors. Licensee MDPI, Basel, Switzerland. This article is an open access article distributed under the terms and conditions of the Creative Commons Attribution (CC BY) license (http://creativecommons.org/licenses/by/4.0/).
Share and Cite
Xu, H.; Khan, A.; Zhao, S.; Wang, H.; Zou, H.; Pang, Y.; Zhu, H. Effects of Inhibin A on Apoptosis and Proliferation of Bovine Granulosa Cells. Animals 2020, 10, 367. https://doi.org/10.3390/ani10020367
Xu H, Khan A, Zhao S, Wang H, Zou H, Pang Y, Zhu H. Effects of Inhibin A on Apoptosis and Proliferation of Bovine Granulosa Cells. Animals. 2020; 10(2):367. https://doi.org/10.3390/ani10020367
Chicago/Turabian StyleXu, Huitao, Adnan Khan, Shanjiang Zhao, Huan Wang, Huiying Zou, Yunwei Pang, and Huabin Zhu. 2020. "Effects of Inhibin A on Apoptosis and Proliferation of Bovine Granulosa Cells" Animals 10, no. 2: 367. https://doi.org/10.3390/ani10020367