
Machine Learning Establishes Single-Cell Calcium Dynamics as an Early Indicator of Antibiotic Response


Abstract
:1. Introduction
2. Materials and Methods
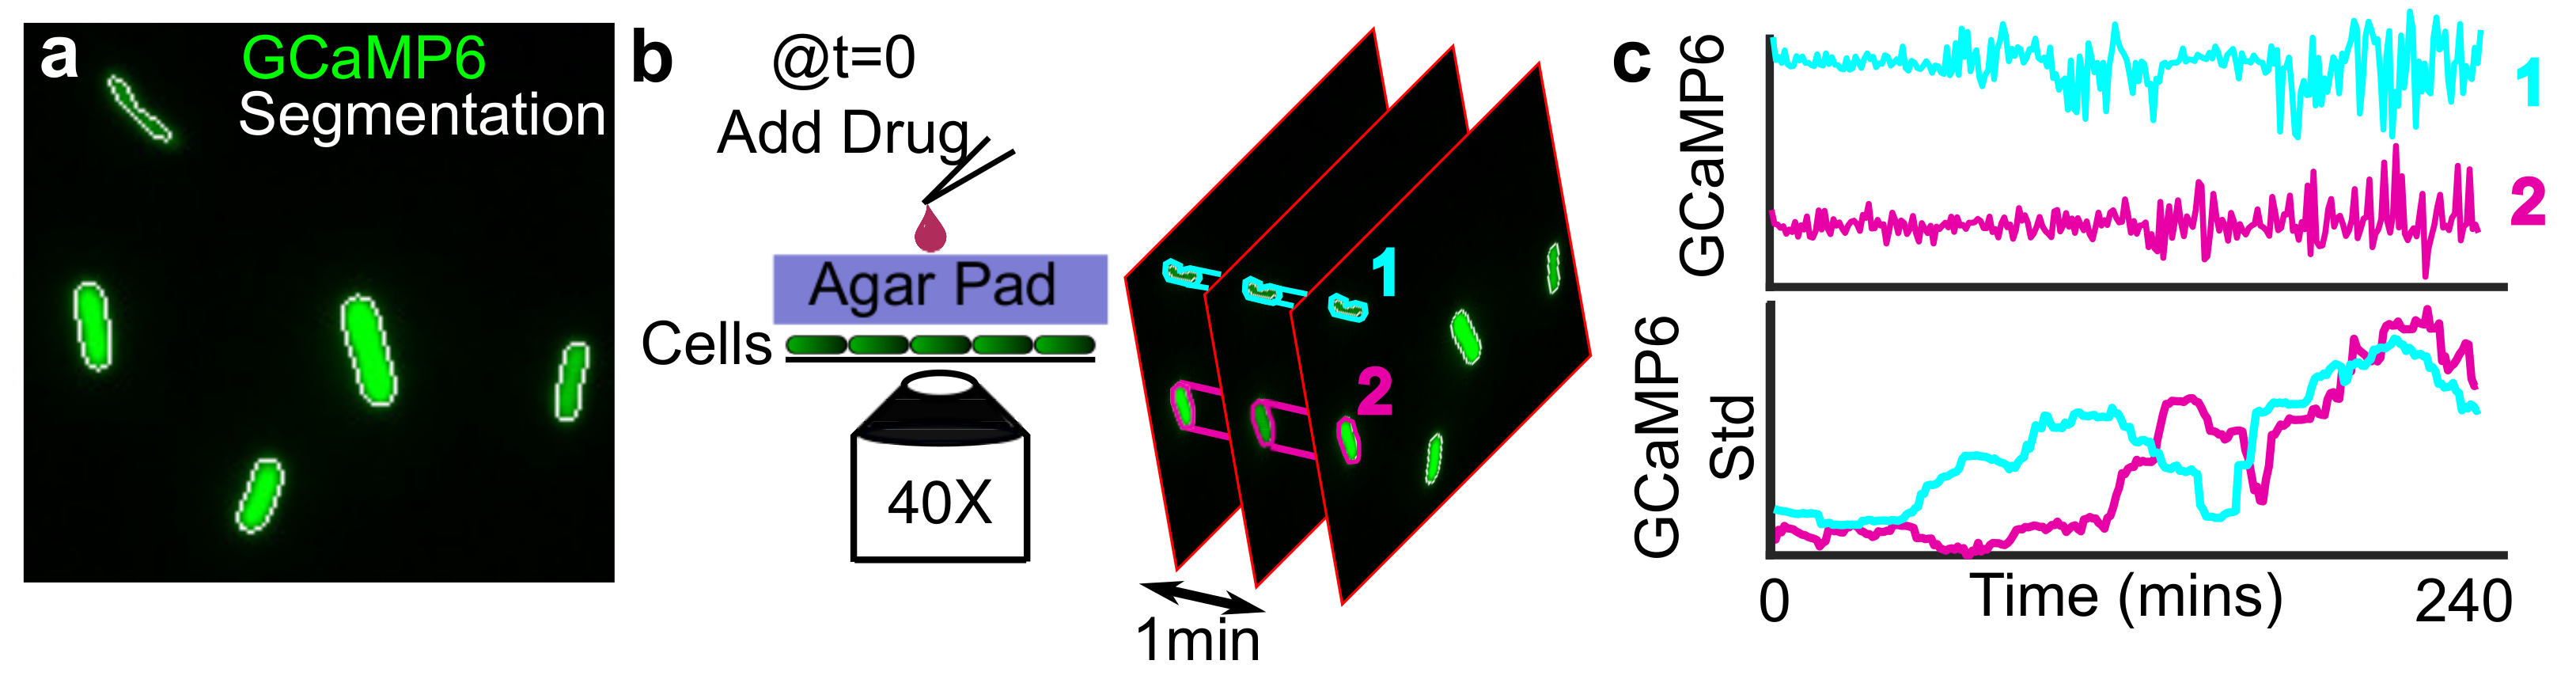
2.1. Experimental Set Up
2.2. Image Processing
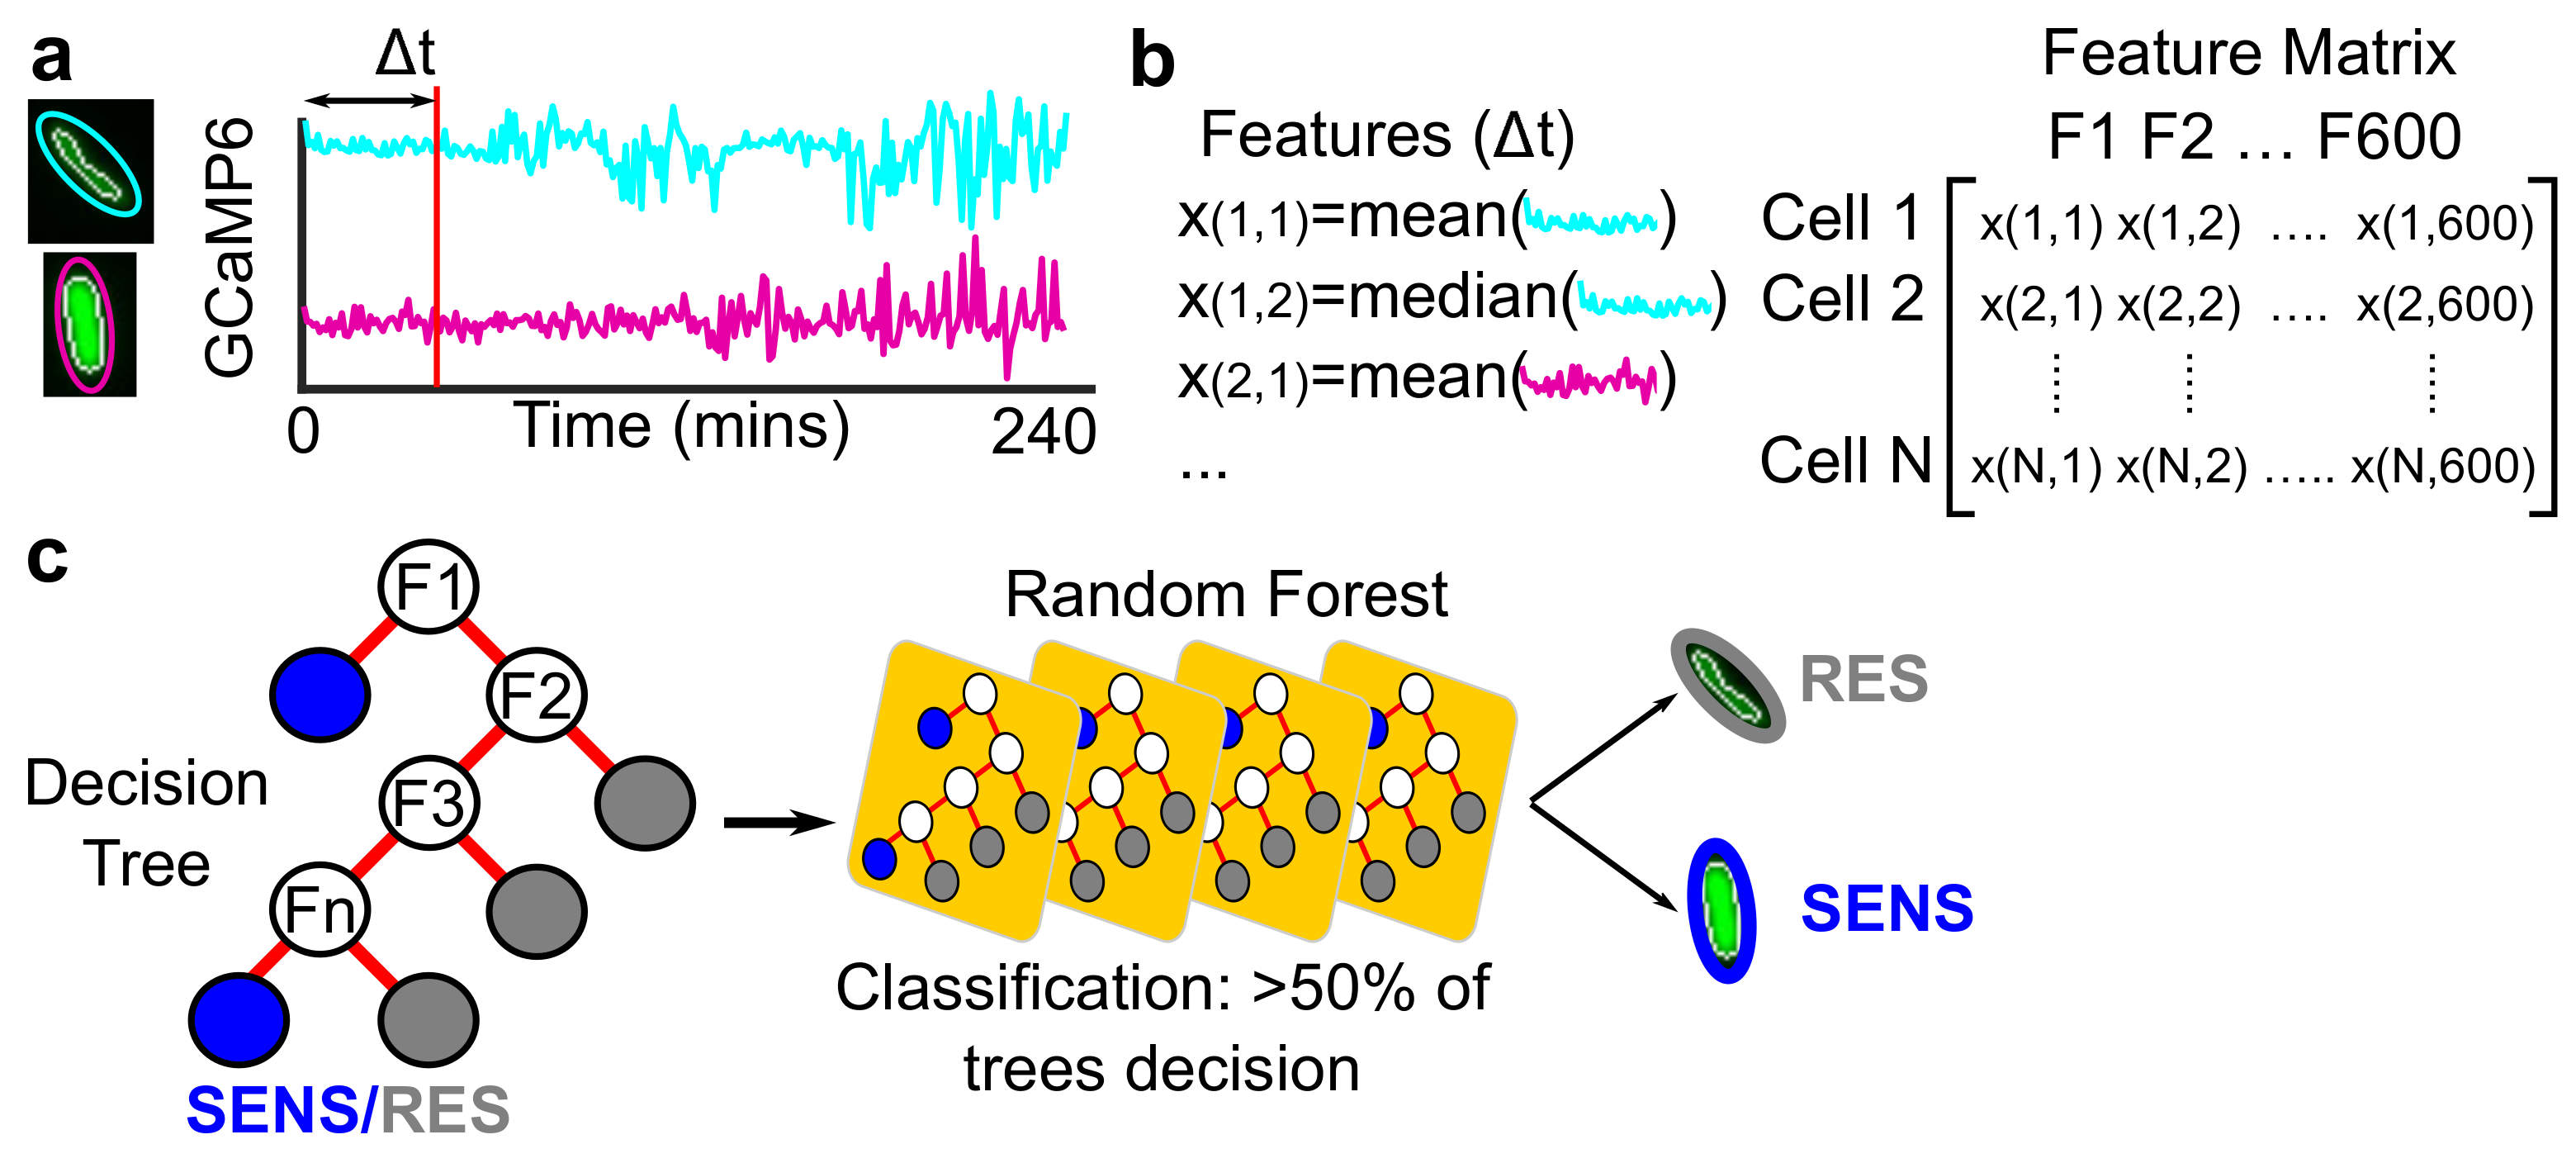
2.3. Machine Learning Classifier
2.4. CFU Assays
3. Results
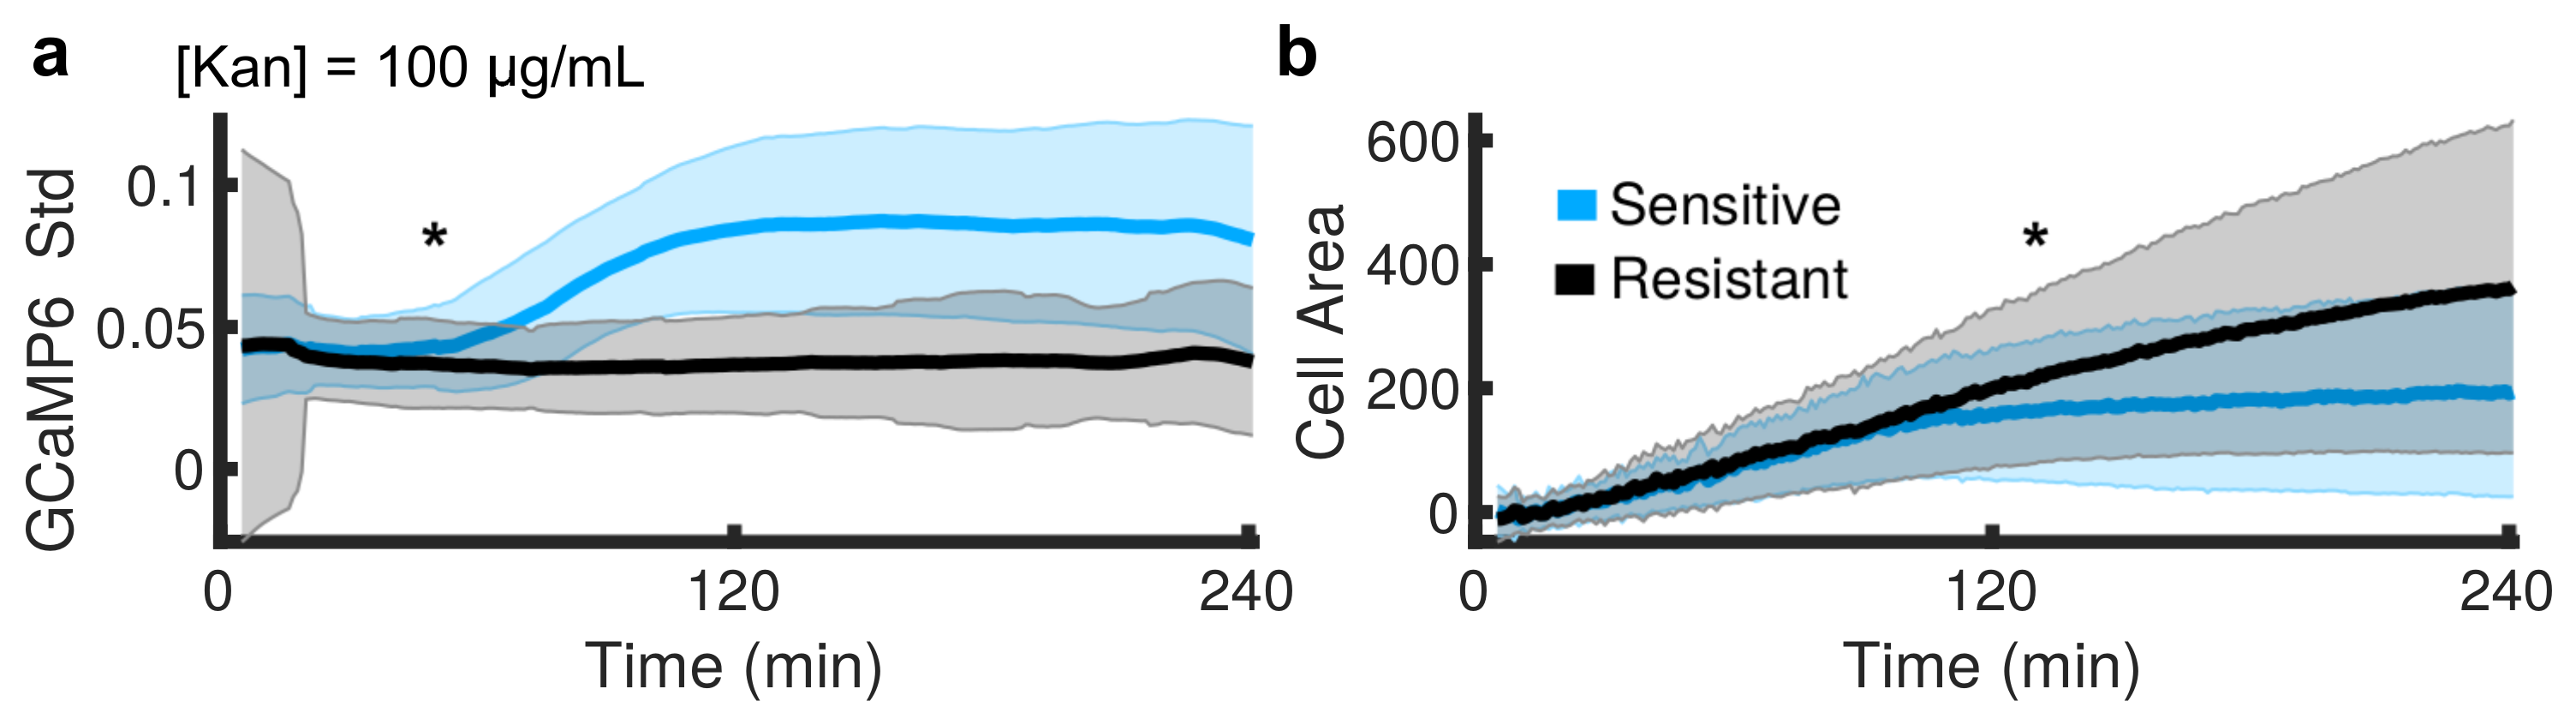
3.1. Ca Transients Are a Dose- and Time-Dependent Indication of Sensitivity to Aminoglycosides, Preceding Changes in Cell Growth, in a Bacterial Population
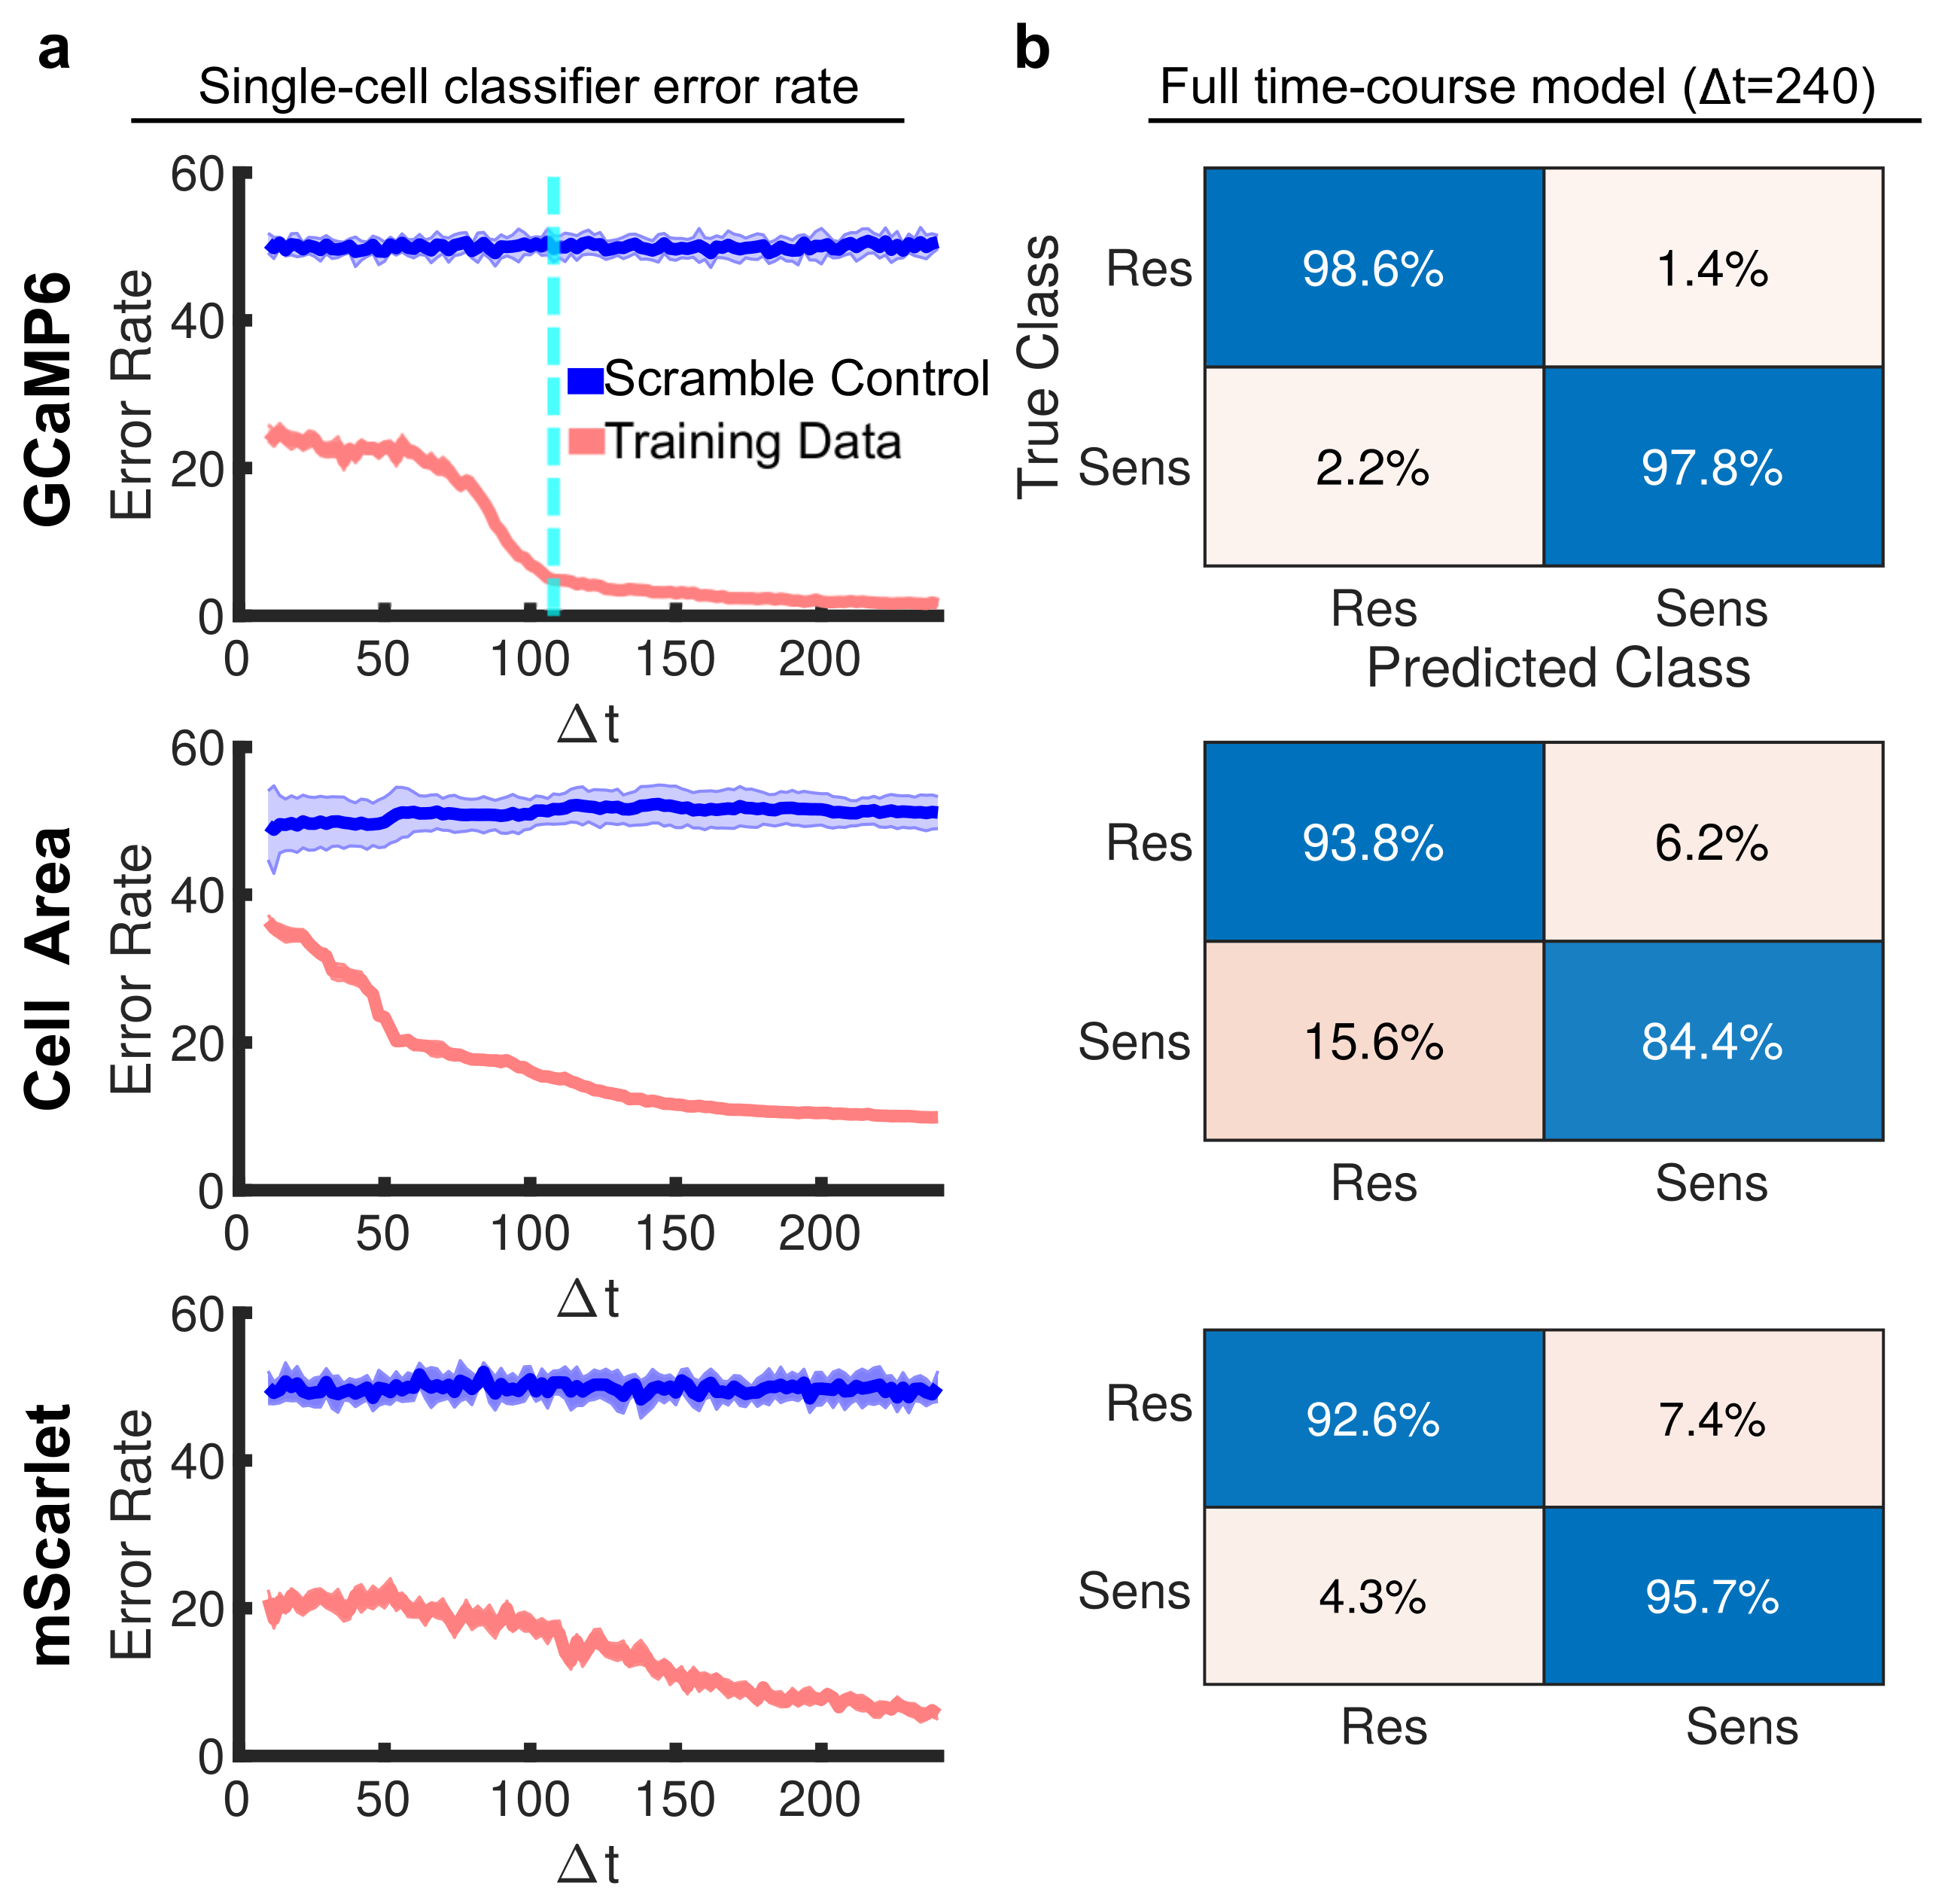
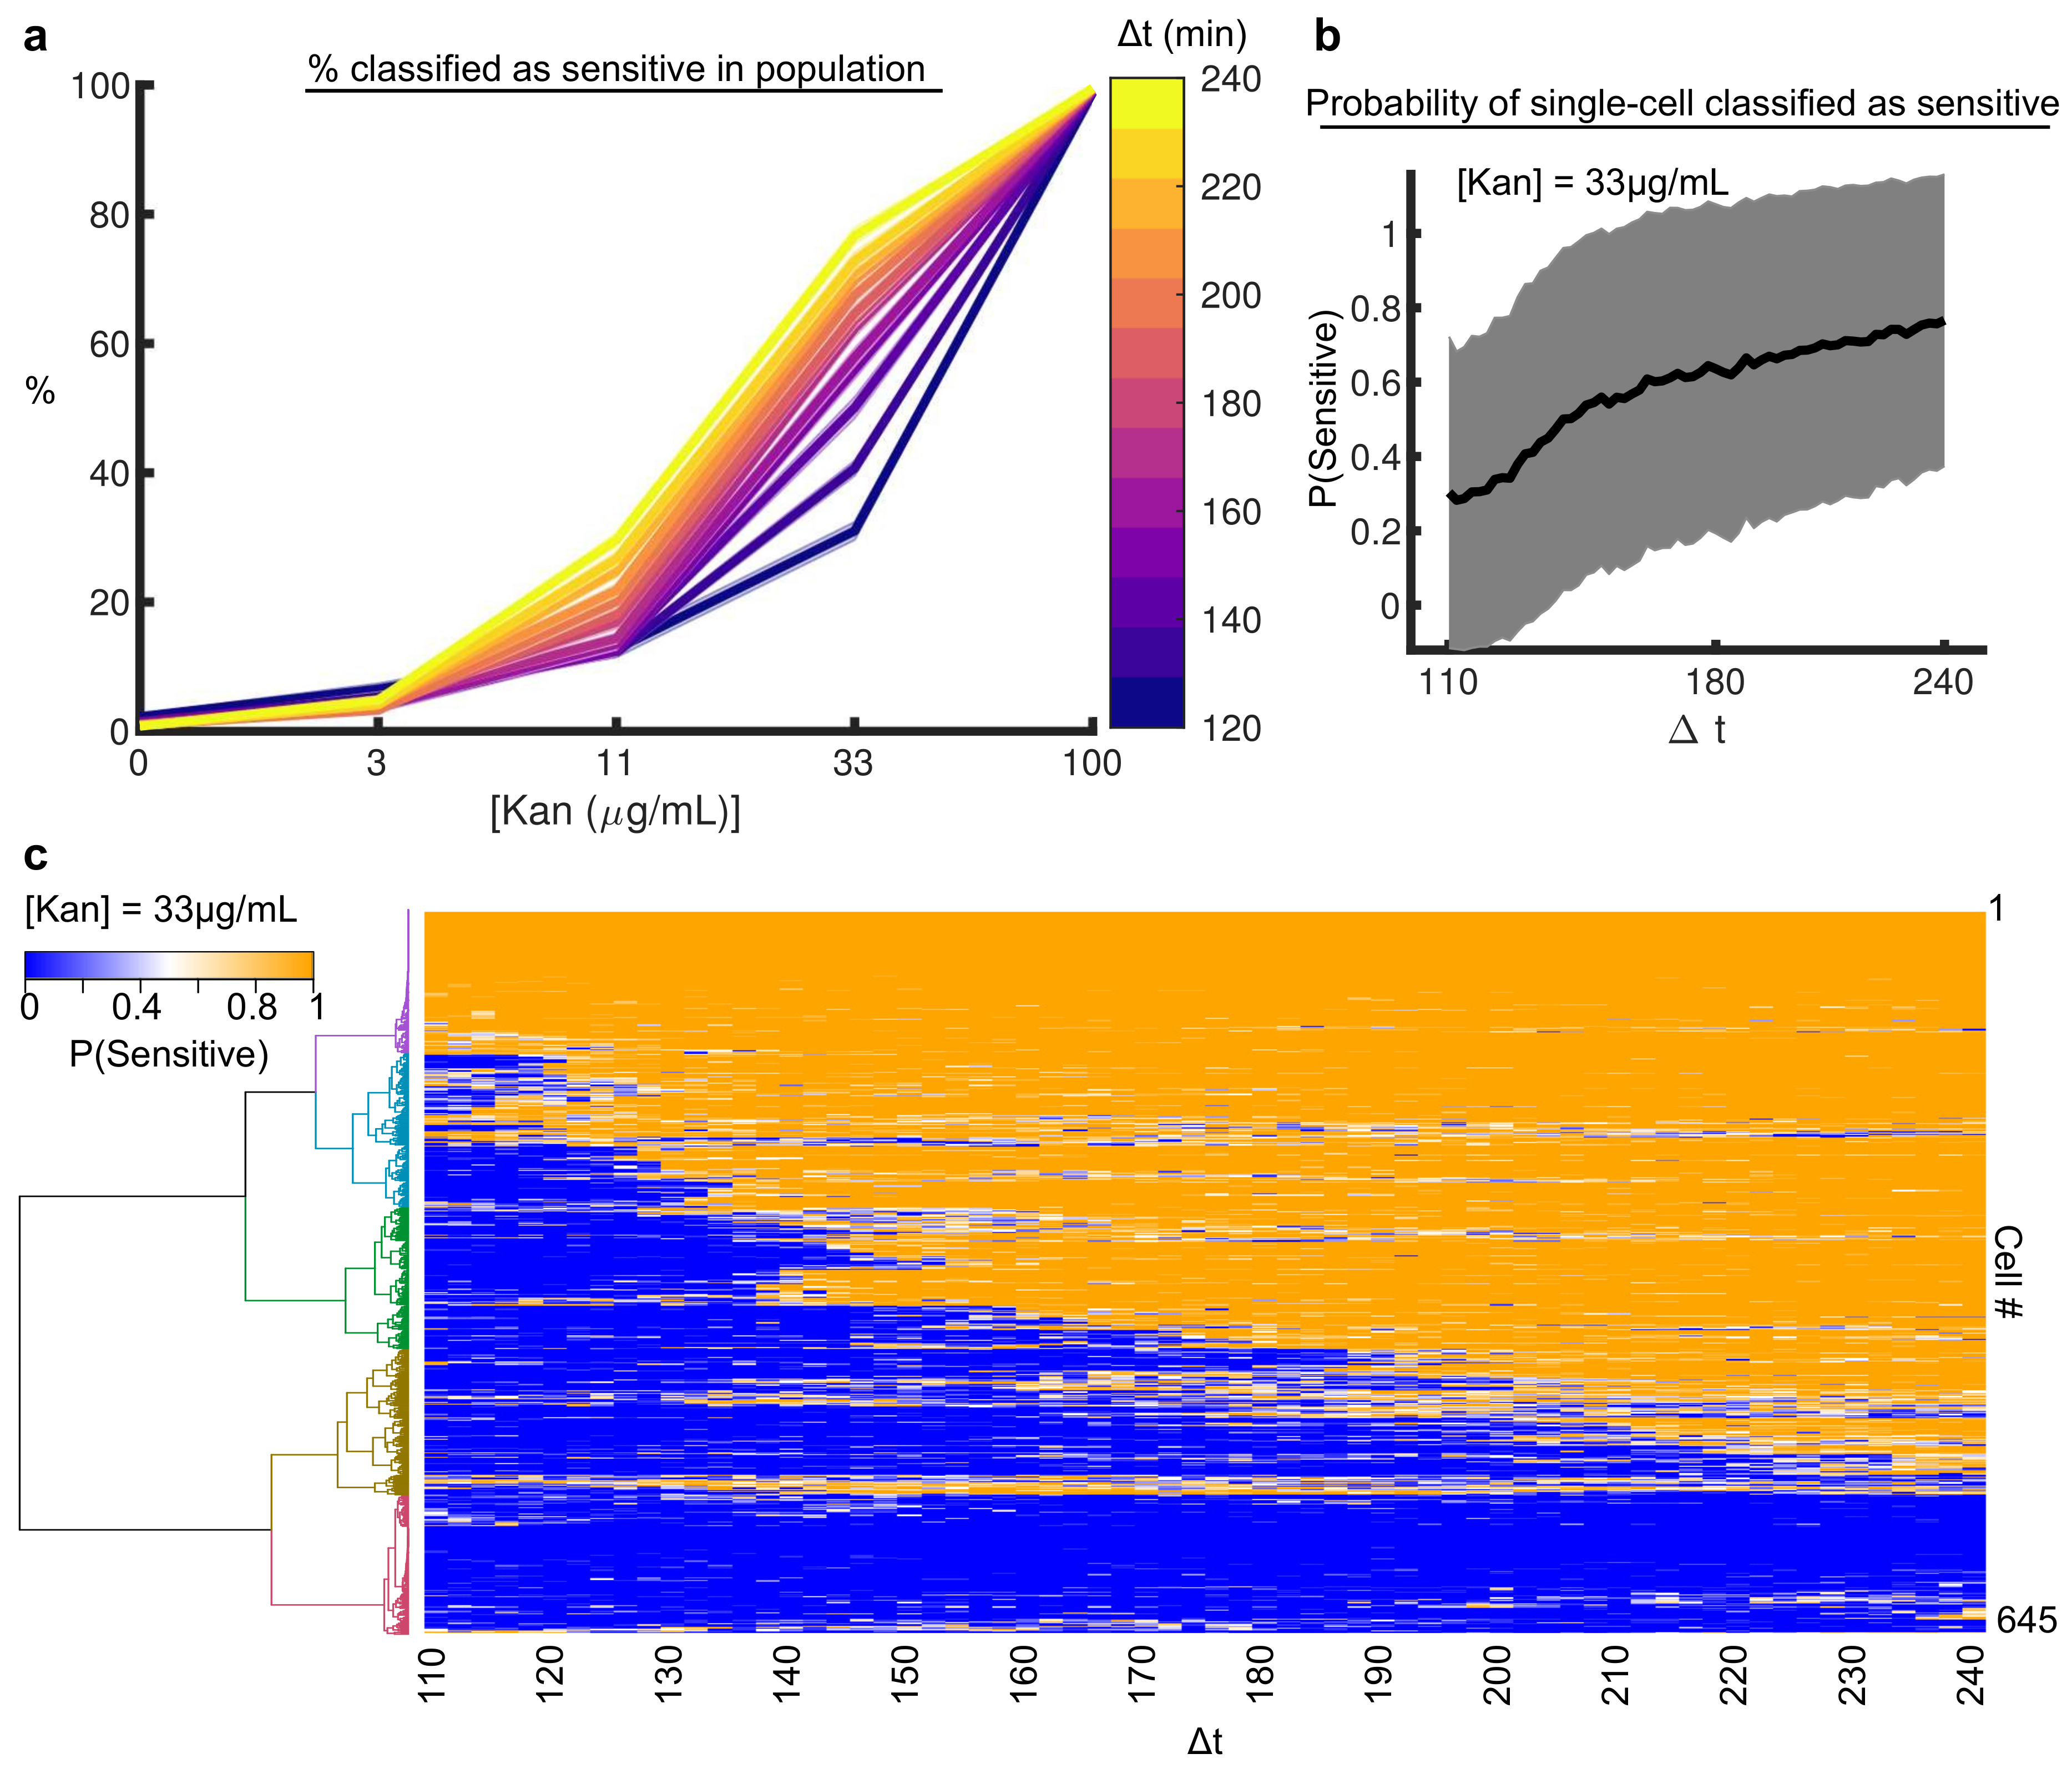
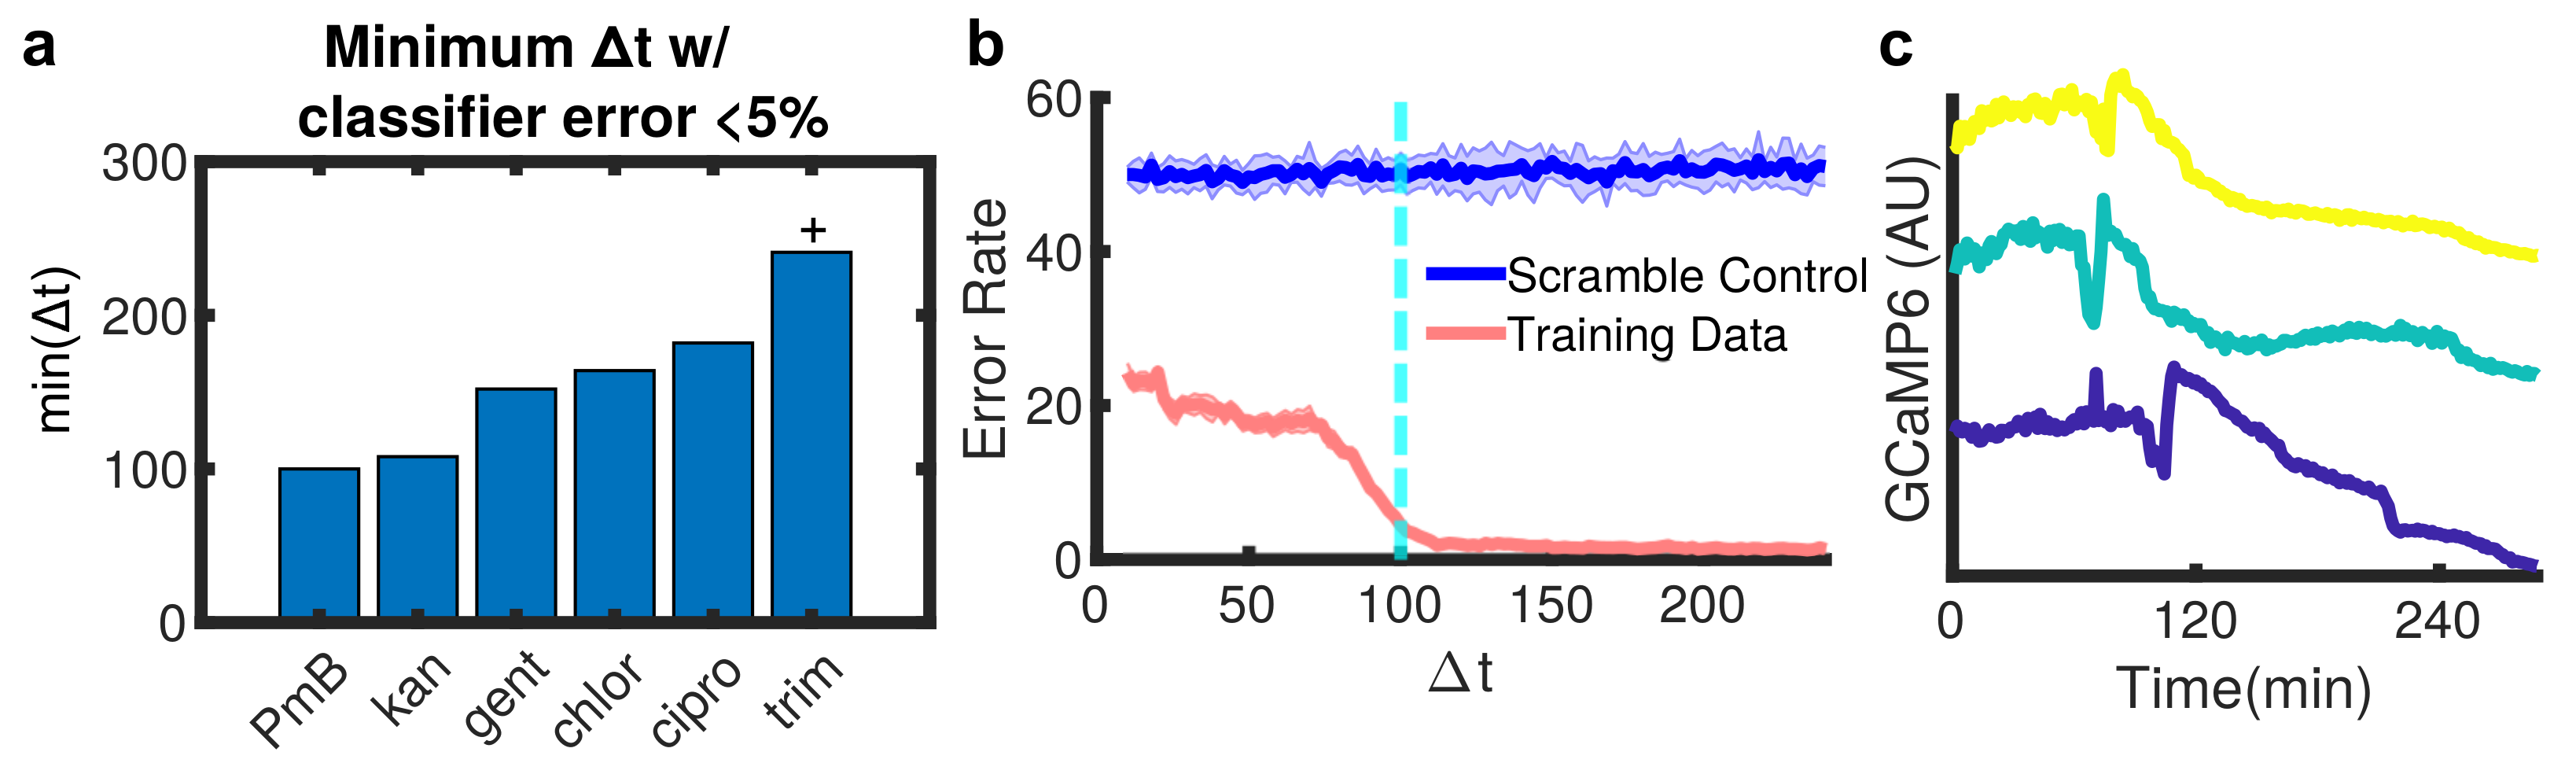
3.2. Machine Learning Reveals Single-Cell Ca Dynamics Are an Early and Reliable Marker of Kanamycin Activity
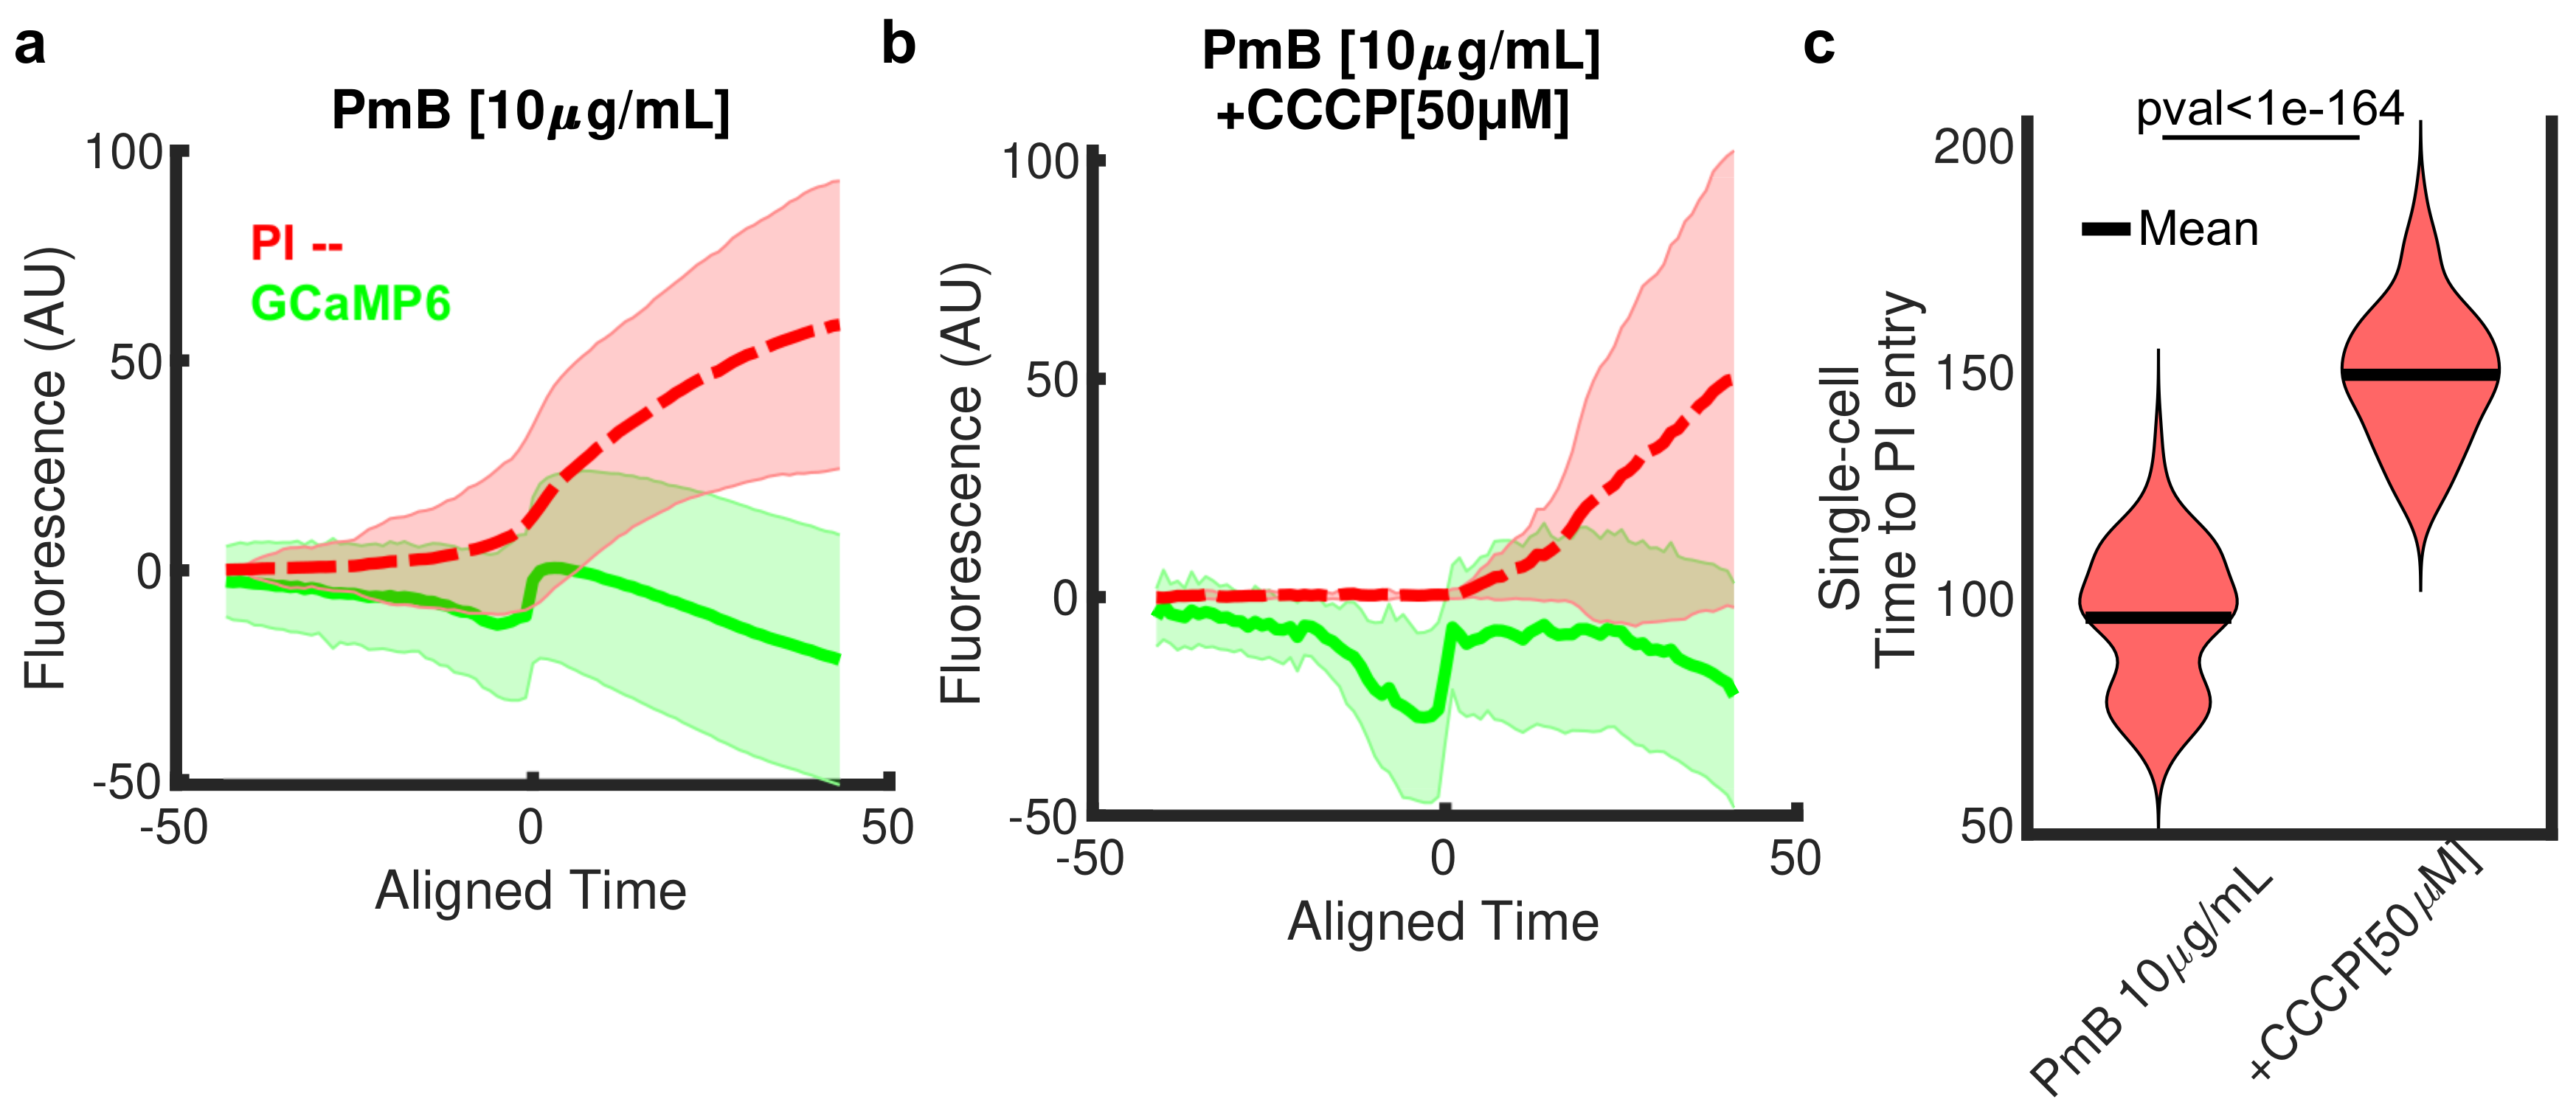
3.3. Ca Dynamics Resolves Multiple Phases of Polymyxin B Activity
4. Discussion
Supplementary Materials
Author Contributions
Funding
Data Availability Statement
Acknowledgments
Conflicts of Interest
References
- Clapham, D.E. Calcium signaling. Cell 2007, 131, 1047–1058. [Google Scholar] [CrossRef] [Green Version]
- Frankenhaeuser, B.; Hodgkin, A.L. The action of calcium on the electrical properties of squid axons. J. Physiol. 1957, 137, 218–244. [Google Scholar] [CrossRef]
- Toyota, M.; Spencer, D.; Sawai-Toyota, S.; Jiaqi, W.; Zhang, T.; Koo, A.J.; Howe, G.A.; Gilroy, S. Glutamate triggers long-distance, calcium-based plant defense signaling. Science 2018, 361, 1112–1115. [Google Scholar] [CrossRef]
- Domínguez, D.C.; Guragain, M.; Patrauchan, M. Calcium binding proteins and calcium signaling in prokaryotes. Cell Calcium 2015, 57, 151–165. [Google Scholar] [CrossRef]
- Domínguez, D.C. Calcium signaling in prokaryotes. In Calcium and Signal Transduction; InTech: London, UK, 2018. [Google Scholar] [CrossRef] [Green Version]
- Nava, A.R.; Mauricio, N.; Sanca, A.J.; Domínguez, D.C. Evidence of Calcium Signaling and Modulation of the LmrS Multidrug Resistant Efflux Pump Activity by Ca2 + Ions in S. aureus. Front. Microbiol. 2020, 11, 2463. [Google Scholar] [CrossRef] [PubMed]
- Campbell, A. Intracellular Ca2+ and microorganisms. In Intracellular Calcium; John Wiley & Sons, Ltd.: Chichester, UK, 2014; pp. 389–441. [Google Scholar] [CrossRef]
- Herbaud, M.L.; Guiseppi, A.; Denizot, F.; Haiech, J.; Kilhoffer, M.C. Calcium signalling in Bacillus subtilis. Biochim. Biophys. Acta 1998, 1448, 212–226. [Google Scholar] [CrossRef] [Green Version]
- Guragain, M.; Lenaburg, D.L.; Moore, F.S.; Reutlinger, I.; Patrauchan, M.A. Calcium homeostasis in Pseudomonas aeruginosa requires multiple transporters and modulates swarming motility. Cell Calcium 2013, 54. [Google Scholar] [CrossRef] [PubMed] [Green Version]
- Rosch, J.W.; Sublett, J.; Gao, G.; Wang, Y.D.; Tuomanen, E.I. Calcium efflux is essential for bacterial survival in the eukaryotic host. Mol. Microbiol. 2008, 70, 435–444. [Google Scholar] [CrossRef] [Green Version]
- Tisa, L.S.; Adler, J. Calcium ions are involved in Escherichia coli chemotaxis. Proc. Natl. Acad. Sci. USA 1992, 89, 11804–11808. [Google Scholar] [CrossRef] [PubMed] [Green Version]
- Bruni, G.N.; Weekley, R.A.; Dodd, B.J.T.; Kralj, J.M. Voltage-gated calcium flux mediates Escherichia coli mechanosensation. Proc. Natl. Acad. Sci. USA 2017, 114, 9445–9450. [Google Scholar] [CrossRef] [Green Version]
- Larkin, J.W.; Zhai, X.; Kikuchi, K.; Redford, S.E.; Prindle, A.; Liu, J.; Greenfield, S.; Walczak, A.M.; Garcia-Ojalvo, J.; Mugler, A.; et al. Signal Percolation within a Bacterial Community. Cell Syst. 2018, 7. [Google Scholar] [CrossRef] [PubMed] [Green Version]
- Zhai, X.; Larkin, J.W.; Kikuchi, K.; Redford, S.E.; Roy, U.; Süel, G.M.; Mugler, A. Statistics of correlated percolation in a bacterial community. PLoS Comput. Biol. 2019, 15. [Google Scholar] [CrossRef] [PubMed] [Green Version]
- Humphries, J.; Xiong, L.; Liu, J.; Prindle, A.; Yuan, F.; Arjes, H.A.; Tsimring, L.; Süel, G.M. Species-Independent Attraction to Biofilms through Electrical Signaling. Cell 2017, 168, 200–209. [Google Scholar] [CrossRef] [Green Version]
- Prindle, A.; Liu, J.; Asally, M.; Ly, S.; Garcia-Ojalvo, J.; Süel, G.M. Ion channels enable electrical communication in bacterial communities. Nature 2015, 527, 59–63. [Google Scholar] [CrossRef] [Green Version]
- Liu, J.; Han, Q.; Peng, T.; Peng, M.; Wei, B.; Li, D.; Wang, X.; Yu, S.; Yang, J.; Cao, S.; et al. The oncogene c-Jun impedes somatic cell reprogramming. Nat. Cell Biol. 2015, 17, 856–867. [Google Scholar] [CrossRef]
- Naseem, R.; Holland, I.B.; Jacq, A.; Wann, K.T.; Campbell, A.K. pH and monovalent cations regulate cytosolic free Ca(2+) in E. coli. Biochim. Biophys. Acta 2008, 1778, 1415–1422. [Google Scholar] [CrossRef]
- Naseem, R.; Wann, K.T.; Holland, I.B.; Campbell, A.K. ATP regulates calcium efflux and growth in E. coli. J. Mol. Biol. 2009, 391, 42–56. [Google Scholar] [CrossRef] [PubMed]
- Zhou, Y.; Yang, W.; Kirberger, M.; Lee, H.W.; Ayalasomayajula, G.; Yang, J.J. Prediction of EF-hand calcium-binding proteins and analysis of bacterial EF-hand proteins. Proteins Struct. Funct. Genet. 2006, 65. [Google Scholar] [CrossRef]
- Zhao, Y.; Shi, Y.; Zhao, W.; Huang, X.; Wang, D.; Brown, N.; Brand, J.; Zhao, J. CcbP, a calcium-binding protein from Anabaena sp. PCC 7120, provides evidence that calcium ions regulate heterocyst differentiation. Proc. Natl. Acad. Sci. USA 2005, 102, 5744–5748. [Google Scholar] [CrossRef] [Green Version]
- Domniguez, D.C.; Lopes, R.; Holl, I.B.; Campbell, A.K. Proteome Analysis of B. subtilis in Response to Calcium. J. Anal. Bioanal. Tech. 2011. [Google Scholar] [CrossRef]
- Aravind, P.; Mishra, A.; Suman, S.K.; Jobby, M.K.; Sankaranarayanan, R.; Sharma, Y. The betagamma-crystallin superfamily contains a universal motif for binding calcium. Biochemistry 2009, 48, 12180–12190. [Google Scholar] [CrossRef]
- Rigden, D.J.; Jedrzejas, M.J.; Galperin, M.Y. An extracellular calcium-binding domain in bacteria with a distant relationship to EF-hands. FEMS Microbiol. Lett. 2003, 221, 103–110. [Google Scholar] [CrossRef] [Green Version]
- Kass, G.E.; Orrenius, S. Calcium signaling and cytotoxicity. Environ. Health Perspect. 1999, 107, 25–35. [Google Scholar] [CrossRef] [Green Version]
- Bellomo, G.; Carafoli, E.; Heizmann, C.W.; Horton, A.; Orrenius, S. Calcium-dependent mechanisms in drug toxicity and cell killing. In Pharmacological Sciences: Perspectives for Research and Therapy in the Late 1990s; Birkhäuser Basel: Basel, Switzerland, 1995; pp. 453–460. [Google Scholar] [CrossRef]
- Chen, X.; Khambu, B.; Zhang, H.; Gao, W.; Li, M.; Chen, X.; Yoshimori, T.; Yin, X.M. Autophagy induced by calcium phosphate precipitates targets damaged endosomes. J. Biol. Chem. 2014, 289. [Google Scholar] [CrossRef] [PubMed] [Green Version]
- Sorimachi, H.; Hata, S.; Ono, Y. Calpain. Encycl. Biol. Chem. 2013, 353–361. [Google Scholar] [CrossRef]
- Putney, J.W.; Tomita, T. Phospholipase C signaling and calcium influx. Adv. Biol. Regul. 2012, 52. [Google Scholar] [CrossRef] [PubMed] [Green Version]
- Yakovlev, A.G.; Wang, G.; Stoica, B.A.; Boulares, H.A.; Spoonde, A.Y.; Yoshihara, K.; Smulson, M.E. A role of the Ca2+Mg2+ -dependent endonuclease in apoptosis and its inhibition by poly(ADP-ribose) polymerase. J. Biol. Chem. 2000, 275. [Google Scholar] [CrossRef] [PubMed] [Green Version]
- Zamponi, G.W.; Striessnig, J.; Koschak, A.; Dolphin, A.C. The physiology, pathology, and pharmacology of voltage-gated calcium channels and their future therapeutic potential. Pharmacol. Rev. 2015, 67. [Google Scholar] [CrossRef] [Green Version]
- Raffaello, A.; Mammucari, C.; Gherardi, G.; Rizzuto, R. Calcium at the Center of Cell Signaling: Interplay between Endoplasmic Reticulum, Mitochondria, and Lysosomes. Trends Biochem. Sci. 2016. [Google Scholar] [CrossRef] [Green Version]
- Ashby, M.C.; Tepikin, A.V. ER calcium and the functions of intracellular organelles. Semin. Cell Dev. Biol. 2001, 12. [Google Scholar] [CrossRef] [PubMed]
- Shimomura, T.; Yonekawa, Y.; Nagura, H.; Tateyama, M.; Fujiyoshi, Y.; Irie, K. A native prokaryotic voltage-dependent calcium channel with a novel selectivity filter sequence. eLife 2020, 9. [Google Scholar] [CrossRef]
- Bruni, G.N.; Kralj, J.M. Membrane voltage dysregulation driven by metabolic dysfunction underlies bactericidal activity of aminoglycosides. eLife 2020, 9. [Google Scholar] [CrossRef] [PubMed]
- Ezraty, B.; Vergnes, A.; Banzhaf, M.; Duverger, Y.; Huguenot, A.; Brochado, A.R.; Su, S.Y.; Espinosa, L.; Loiseau, L.; Py, B.; et al. Fe-S cluster biosynthesis controls uptake of aminoglycosides in a ROS-less death pathway. Science 2013, 340. [Google Scholar] [CrossRef]
- Foti, J.J.; Devadoss, B.; Winkler, J.A.; Collins, J.J.; Walker, G.C. Oxidation of the guanine nucleotide pool underlies cell death by bactericidal antibiotics. Science 2012, 336. [Google Scholar] [CrossRef] [Green Version]
- Kohanski, M.A.; Dwyer, D.J.; Hayete, B.; Lawrence, C.A.; Collins, J.J. A Common Mechanism of Cellular Death Induced by Bactericidal Antibiotics. Cell 2007, 130. [Google Scholar] [CrossRef] [PubMed] [Green Version]
- Lee, D.Y.D.; Galera-Laporta, L.; Bialecka-Fornal, M.; Moon, E.C.; Shen, Z.; Briggs, S.P.; Garcia-Ojalvo, J.; Süel, G.M. Magnesium Flux Modulates Ribosomes to Increase Bacterial Survival. Cell 2019, 177, 352–360. [Google Scholar] [CrossRef] [Green Version]
- Hover, B.M.; Kim, S.H.; Katz, M.; Charlop-Powers, Z.; Owen, J.G.; Ternei, M.A.; Maniko, J.; Estrela, A.B.; Molina, H.; Park, S.; et al. Culture-independent discovery of the malacidins as calcium-dependent antibiotics with activity against multidrug-resistant Gram-positive pathogens. Nat. Microbiol. 2018, 3. [Google Scholar] [CrossRef] [Green Version]
- Chen, T.W.; Wardill, T.J.; Sun, Y.; Pulver, S.R.; Renninger, S.L.; Baohan, A.; Schreiter, E.R.; Kerr, R.A.; Orger, M.B.; Jayaraman, V.; et al. Ultrasensitive fluorescent proteins for imaging neuronal activity. Nature 2013, 499, 295–300. [Google Scholar] [CrossRef] [PubMed] [Green Version]
- Kralj, J.M.; Hochbaum, D.R.; Douglass, A.D.; Cohen, A.E. Electrical spiking in Escherichia coli probed with a fluorescent voltage-indicating protein. Science 2011, 333, 345–348. [Google Scholar] [CrossRef]
- Schoenmakers, T.J.; Visser, G.J.; Flik, G.; Theuvenet, A.P. CHELATOR: An improved method for computing metal ion concentrations in physiological solutions. BioTechniques 1992, 12, 870–874. [Google Scholar]
- Freund, Y.; Schapire, R.E. A Decision-Theoretic Generalization of On-Line Learning and an Application to Boosting. J. Comput. Syst. Sci. 1997, 55. [Google Scholar] [CrossRef] [Green Version]
- Duttagupta, I.; Ghosh, K.C.; Sinha, S. Synthetic studies toward nonribosomal peptides. In Studies in Natural Products Chemistry; Elsevier: Amsterdam, The Netherlands, 2016; Volume 48. [Google Scholar] [CrossRef]
- Zavascki, A.P.; Goldani, L.Z.; Li, J.; Nation, R.L. Polymyxin B for the treatment of multidrug-resistant pathogens: A critical review. J. Antimicrob. Chemother. 2007. [Google Scholar] [CrossRef] [Green Version]
- D’Amato, R.F.; Thornsberry, C.; Baker, C.N.; Kirven, L.A. Effect of calcium and magnesium ions on the susceptibility of Pseudomonas species to tetracycline, gentamicin polymyxin B, and carbenicillin. Antimicrob. Agents Chemother. 1975, 7. [Google Scholar] [CrossRef] [PubMed] [Green Version]
- Girardello, R.; Bispo, P.J.; Yamanaka, T.M.; Gales, A.C. Cation concentration variability of four distinct Mueller-Hinton agar brands influences polymyxin B susceptibility results. J. Clin. Microbiol. 2012, 50. [Google Scholar] [CrossRef] [PubMed] [Green Version]
- CLSI. Methods for Dilution Antimicrobial Susceptibility Tests for Bacteria that Grow Aerobically, 11th ed.; CLSI standards M07; Clinical and Laboratory Standards Institute: Wayne, PA, USA, 2018. [Google Scholar]
- Poirel, L.; Jayol, A.; Nordmanna, P. Polymyxins: Antibacterial activity, susceptibility testing, and resistance mechanisms encoded by plasmids or chromosomes. Clin. Microbiol. Rev. 2017. [Google Scholar] [CrossRef] [Green Version]
- Ni, W.; Li, Y.; Guan, J.; Zhao, J.; Cui, J.; Wang, R.; Liu, Y. Effects of efflux pump inhibitors on colistin resistance in multidrug-resistant Gram negative bacteria. Antimicrob. Agents Chemother. 2016, 60. [Google Scholar] [CrossRef] [Green Version]
- Balaban, N.Q.; Helaine, S.; Lewis, K.; Ackermann, M.; Aldridge, B.; Andersson, D.I.; Brynildsen, M.P.; Bumann, D.; Camilli, A.; Collins, J.J.; et al. Definitions and guidelines for research on antibiotic persistence. Nat. Rev. Microbiol. 2019, 17, 441–448. [Google Scholar] [CrossRef] [Green Version]
- Liu, J.; Gefen, O.; Ronin, I.; Bar-Meir, M.; Balaban, N.Q. Effect of tolerance on the evolution of antibiotic resistance under drug combinations. Science 2020, 367, 200–204. [Google Scholar] [CrossRef]
- Jones, H.E.; Holland, I.B.; Campbell, A.K. Direct measurement of free Ca(2+) shows different regulation of Ca(2+) between the periplasm and the cytosol of Escherichia coli. Cell Calcium 2002, 32, 183–192. [Google Scholar] [CrossRef]
- Jung, D.; Rozek, A.; Okon, M.; Hancock, R.E. Structural transitions as determinants of the action of the calcium-dependent antibiotic daptomycin. Chem. Biol. 2004, 11. [Google Scholar] [CrossRef] [Green Version]
- Carpenter, C.F.; Chambers, H.F. Daptomycin: Another novel agent for treating infections due to drug-resistant Gram positive pathogens. Clin. Infect. Dis. 2004. [Google Scholar] [CrossRef] [PubMed] [Green Version]
- Sader, H.S.; Streit, J.M.; Fritsche, T.R.; Jones, R.N. Antimicrobial activity of daptomycin against multidrug-resistant Gram-positive strains collected worldwide. Diagn. Microbiol. Infect. Dis. 2004, 50. [Google Scholar] [CrossRef] [PubMed]
- Baltekin, O.; Boucharin, A.; Tano, E.; Andersson, D.I.; Elf, J. Antibiotic susceptibility testing in less than 30 min using direct single-cell imaging. Proc. Natl. Acad. Sci. USA 2017, 114. [Google Scholar] [CrossRef] [PubMed] [Green Version]
- Yu, H.; Jing, W.; Iriya, R.; Yang, Y.; Syal, K.; Mo, M.; Grys, T.E.; Haydel, S.E.; Wang, S.; Tao, N. Phenotypic Antimicrobial Susceptibility Testing with Deep Learning Video Microscopy. Anal. Chem. 2018, 90, 6314–6322. [Google Scholar] [CrossRef]
- Zhang, C.; Song, W.; Ma, H.R.; Peng, X.; Anderson, D.J.; Fowler, V.G.; Thaden, J.T.; Xiao, M.; You, L. Temporal encoding of bacterial identity and traits in growth dynamics. Proc. Natl. Acad. Sci. USA 2020. [Google Scholar] [CrossRef] [PubMed]
- Brown, C.; Tseng, D.; Larkin, P.M.; Realegeno, S.; Mortimer, L.; Subramonian, A.; Di Carlo, D.; Garner, O.B.; Ozcan, A. Automated, Cost-Effective Optical System for Accelerated Antimicrobial Susceptibility Testing (AST) Using Deep Learning. ACS Photonics 2020, 7. [Google Scholar] [CrossRef]
- Charnot-Katsikas, A.; Tesic, V.; Love, N.; Hill, B.; Bethel, C.; Boonlayangoor, S.; Beavisa, K.G. Use of the accelerate pheno system for identification and antimicrobial susceptibility testing of pathogens in positive blood cultures and impact on time to results and workflow. J. Clin. Microbiol. 2018, 56. [Google Scholar] [CrossRef] [PubMed] [Green Version]
- Garcia-Garrote, F.; Cercenado, E.; Bouza, E. Evaluation of a new system, VITEK 2, for identification and antimicrobial susceptibility testing of enterococci. J. Clin. Microbiol. 2000, 38. [Google Scholar] [CrossRef]
- Savela, E.S.; Schoepp, N.G.; Cooper, M.M.; Rolando, J.C.; Klausner, J.D.; Soge, O.O.; Ismagilov, R.F. Surfactant-enhanced DNA accessibility to nuclease accelerates phenotypic ß-lactam antibiotic susceptibility testing of Neisseria gonorrhoeae. PLoS Biol. 2020, 18. [Google Scholar] [CrossRef] [Green Version]
- Bray, M.A.; Singh, S.; Han, H.; Davis, C.T.; Borgeson, B.; Hartland, C.; Kost-Alimova, M.; Gustafsdottir, S.M.; Gibson, C.C.; Carpenter, A.E. Cell Painting, a high-content image-based assay for morphological profiling using multiplexed fluorescent dyes. Nat. Protoc. 2016, 11. [Google Scholar] [CrossRef] [PubMed] [Green Version]


Publisher’s Note: MDPI stays neutral with regard to jurisdictional claims in published maps and institutional affiliations. |
© 2021 by the authors. Licensee MDPI, Basel, Switzerland. This article is an open access article distributed under the terms and conditions of the Creative Commons Attribution (CC BY) license (https://creativecommons.org/licenses/by/4.0/).
Share and Cite
Meyer, C.T.; Jewell, M.P.; Miller, E.J.; Kralj, J.M. Machine Learning Establishes Single-Cell Calcium Dynamics as an Early Indicator of Antibiotic Response. Microorganisms 2021, 9, 1000. https://doi.org/10.3390/microorganisms9051000
Meyer CT, Jewell MP, Miller EJ, Kralj JM. Machine Learning Establishes Single-Cell Calcium Dynamics as an Early Indicator of Antibiotic Response. Microorganisms. 2021; 9(5):1000. https://doi.org/10.3390/microorganisms9051000
Chicago/Turabian StyleMeyer, Christian T., Megan P. Jewell, Eugene J. Miller, and Joel M. Kralj. 2021. "Machine Learning Establishes Single-Cell Calcium Dynamics as an Early Indicator of Antibiotic Response" Microorganisms 9, no. 5: 1000. https://doi.org/10.3390/microorganisms9051000