Article

Lipid Production from Sugarcane Top Hydrolysate and Crude Glycerol with Rhodosporidiobolus fluvialis Using a Two-Stage Batch-Cultivation Strategy with Separate Optimization of Each Stage

1
Department of Microbiology, Faculty of Science, Kasetsart University, Bangkok 10900, Thailand
2
Rattanakosin College for Sustainable Energy and Environment (RCSEE), Rajamangala University of Technology Rattanakosin, Nakhon Pathom 73170, Thailand
3
Department of Microbiology, Faculty of Science, Srinakharinwirot University, Bangkok 10110, Thailand
4
Division of Biotechnology, Dalian Institute of Chemical Physics, CAS, Dalian 116023, China
5
Academy of Science, Royal Society of Thailand, Bangkok 10300, Thailand
*
Author to whom correspondence should be addressed.
Microorganisms 2020, 8(3), 453; https://doi.org/10.3390/microorganisms8030453
Submission received: 29 February 2020 / Revised: 19 March 2020 / Accepted: 21 March 2020 / Published: 23 March 2020
(This article belongs to the Section Microbial Biotechnology)

Abstract

:
Lipids from oleaginous microorganisms, including oleaginous yeasts, are recognized as feedstock for biodiesel production. A production process development of these organisms is necessary to bring lipid feedstock production up to the industrial scale. This study aimed to enhance lipid production of low-cost substrates, namely sugarcane top and biodiesel-derived crude glycerol, by using a two-stage cultivation process with Rhodosporidiobolus fluvialis DMKU-SP314. In the first stage, sugarcane top hydrolysate was used for cell propagation, and in the second stage, cells were suspended in a crude glycerol solution for lipid production. Optimization for high cell mass production in the first stage, and for high lipid production in the second stage, were performed separately using a one-factor-at-a-time methodology together with response surface methodology. Under optimum conditions in the first stage (sugarcane top hydrolysate broth containing; 43.18 g/L total reducing sugars, 2.58 g/L soy bean powder, 0.94 g/L (NH4)2SO4, 0.39 g/L KH2PO4 and 2.5 g/L MgSO4 7H2O, pH 6, 200 rpm, 28 °C and 48 h) and second stage (81.54 g/L crude glycerol, pH 5, 180 rpm, 27 °C and 196 h), a high lipid concentration of 15.85 g/L, a high cell mass of 21.07 g/L and a high lipid content of 73.04% dry cell mass were obtained.

1. Introduction

Biodiesel has largely been accepted as an alternative energy source to fossil fuel, as it is renewable and less toxic. The combustion of biodiesel is very similar to fossil-fuel combustion, but it produces fewer harmful gases, such as sulfur oxide, sulfur dioxide, and sulfur trioxide [1] which can reduce air pollution from mass transportation. Currently, biodiesel is being used worldwide as the main source of fuel for diesel engine machinery without the need for major modifications to the mechanics of these machines [2]. Biodiesel can be divided into three generations based on the feedstock which generates the fuel. First-generation biodiesel is produced from edible plant oils, such as palm oil, soybean oil, and coconut oil, and second-generation biodiesel is produced from nonedible plant oils, such as jatropha, animal fats and waste oils [3]. The most recent generation of biodiesel is derived from microbial lipids. Using recovered animal fats and frying oils of the second generation as feedstock for biodiesel can efficiently reduce the price of the fuel; however, the amount of these fats and oils is limited on an industrial scale and cannot meet the increasing needs of biodiesel production [4]. Recently, microbial lipids that are produced by oleaginous microorganisms have been getting increased attention as an oil feedstock [5]. In terms of obtainability and sustainability, lipids from oleaginous microorganisms are recognized as opportunity feedstocks for biodiesel production and provide a promising route to food and energy security in the current energy crisis [6].
Oleaginous yeasts are a yeast species that can accumulate more than 20% of their biomass in lipids during lipid production. Strains of this species include Cryptococcus albidus, Lipomyces starkeyi, Rhodosporidium toruloides, Rhodotorula glutinis, and Yarrowia lipolytica [7], and are all considered suitable microorganisms for lipid production because of their ability to use a wide range of low-cost substrates. These substrates are able to promote yeast growth to accumulate considerable quantities of lipids [8]; however, further development of the production process is necessary to bring these lipid feedstocks up to the industrial scale. A reduction in the production costs by using robust yeast strains, low-cost substrates, and optimizing the yeast cultures used during production are topics of great interest in this effort [9].
An advantage of the lipid production of oleaginous yeasts is that the growth rate of the yeast decelerates when the nitrogen source is exhausted. Then, the carbon source is channeled toward lipid synthesis leading to the accumulation of triacylglycerols (TAGs) within intracellular lipid bodies [10]. Many studies have reported that oleaginous yeasts synthesize and store greater quantities of TAGs when cultured in a nitrogen-limited medium containing an excess of carbon substrates [9,10,11,12,13]. The limited nitrogen condition blocks cell division and initiates lipid accumulation in oleaginous yeasts [14]. It has been reported that a high cell mass was not obtained when the oleaginous yeast was cultivated in an extremely high C/N ratio condition [15]. This demonstrated that consideration of only the initial high C/N ratio is not always sufficient for high lipid production. Various cultivation processes have been reported for lipid production in yeast; i.e., batch [16,17,18], fed-batch [19,20,21] and two-stage cultivations [22,23]. In two-stage cultivation strategies, cell division and lipid accumulation modes are spatially and/or temporally separated to achieve a high cell mass and high lipid productivity. In the first stage, cells are cultivated in a nutrient-rich medium for propagation, and in the second stage, cells are re-suspended in a limited medium containing little to no nitrogen sources, and an excess of carbon without auxiliary nutrients for the production of lipids [24,25]. Moreover, a high cell density can be obtained when yeast is cultivated in a nitrogen-rich medium with a low carbon concentration, which has shown high lipid yields as well [26].
Recent studies have focused on the use of inexpensive materials such as agricultural residues and industrial byproducts as raw materials for lipid production. Various oleaginous yeast strains haven shown the ability to use sugars derived from a wide range of lignocellulosic biomass carbon sources, which aid in sample growth and lipid accumulation [27]. Sugarcane top (ST) is an agricultural lignocellulosic waste which is annually produced in large quantities because sugarcane is one of the most widely grown crops around the world. After harvesting, the ST remains in the field where it is sometimes destroyed through burning, thus heavily polluting the surrounding environment [28]. This qualifies ST as an appropriate feedstock, due to it is abundance and ready availability. The composition of dry ST includes 42.7% cellulose, 25.5% hemicellulose and 5.8% lignin [29]. However, pretreatment and hydrolysis of lignocellulosic biomasses usually produce inhibitory compounds, such as acetic acid, furfural, and 5-hydroxymethylfurfural, formic acid, and vanillin, which could have negative effects on growth, metabolism, and product formation of microorganisms [30]. Crude glycerol (CG), a byproduct from biodiesel production plants which has been shown to have some inhibitory compounds to microorganism growth, is currently being explored as a possible large-scale carbon source in lipid production by many researchers. Many studies have demonstrated that various oleaginous yeasts have a great capacity to convert CG into lipids with high yields [23,31,32,33,34].
In this present study we are testing the potential of Rhodosporidiobolus fluvialis DMKU-SP314, which is reported to possess the ability to produce high lipid yields from lignocellulosic hydrolysate, and to grow in the presence of inhibitory compounds from sugarcane top hydrolysate (STH) [29]. In a recent study, R. fluvialis DMKU-SP314 was used for lipid production from STH and CG in a two-stage fed-batch cultivation processes [21]. The results of this study found that STH and CG can be used as carbon sources for growth and lipid production, respectively. Therefore, in this current study, we decided to test if enhancing lipid production from low-cost substrates in a two-stage cultivation process using R. fluvialis DMKU-SP314 was possible. In the first stage, cell mass was produced from STH; in the second stage these cells produced lipids from CG. Optimization for high cell mass production in the first stage for lipid production in the second stage was carried out separately by one-factor-at-a-time technique together with response surface methodology (RSM).

2. Materials and Methods

2.1. Yeast Strain and Inoculum Preparation

The R. fluvialis DMKU-SP314 used in this study was reported to accumulate a high lipid content (55% of dry cell mass) in nitrogen-limited medium II containing a 70 g/L mixture of glucose and xylose in a ratio of 2:1 by shaking flask cultivation at 150 rpm and 28 °C for 240 h, and, in an optimized lipid production medium for shaking flask cultivation containing STH supplemented with 59 g/L CG, 66.6% of dry cell mass was obtained [29]. The strain is still maintained on slants of yeast extract-malt extract (YM) agar (3 g/L malt extract, 3 g/L yeast extract, 5 g/L peptone, 10 g/L glucose and 20 g/L agar) at 8 °C.
The inoculum was prepared by transferring one loopful of a 48 h culture grown on a YM agar slant to 50 mL YM broth in a 250 mL Erlenmeyer flask and incubating the culture on a rotary shaker (Lab Companion IS-971R, Seoul, Korea) at 150 rpm and 28 °C for 24 h. A pre-calculated volume of inoculum was transferred to the STH medium to give an initial cell concentration determined by optical density (OD) at 600 nm of 1.

2.2. Substrates Used for Lipid Production

For preparation of STH, ST harvested from the field was washed with tap water to remove dirt and then dried under the sun for 2 days. Dried ST was milled and passed through a 40–60 mesh sized screen (Sieve size 0.389–0.231 mm). The milled ST was pretreated by alkaline oxidation using the method of Liu, et al. [26] and hydrolyzed by Accellerase® 1500 (DuPont, Itasco, IL, USA) as described by Poontawee, et al. [30]. The total reducing sugar (TRS) in the original hydrolysate was 43.18 g/L and, to raise the TRS to a higher value, D-glucose was added to the hydrolysate.
The CG used in this study was a byproduct from the biodiesel production plant, Thai Oleochemicals Co. Ltd., Bangkok, Thailand. It contained 82.06% glycerol, 0.10% methanol, 3.52% ash, 5.43% non-glycerol organic matter and 8.89% water [23]. The CG was used as the sole carbon source in the second stage of cultivation.
Soybean powder (SBP) used in this study was purchased from Doi Kham Food Products Co. Ltd., Bangkok, Thailand and consisted of 38.7% protein that was calculated to have a total nitrogen content of 7%, 5% fat, 1% carbohydrate, 8% iron and 6% calcium.

2.3. Lipid Production from STH and CG by Two-Stage Batch Cultivation

In this study, a two-stage cultivation process was used. In the first stage, optimization of cell mass production from STH was performed. In the second stage, optimization for lipid production from CG was carried out. Cells at the end of the first stage of cultivation were collected by centrifugation and re-suspended in a CG solution in the second stage.

2.3.1. Optimization of Cell Mass Production from STH in the First Stage

Effect of Additional Nitrogen Source

Various nitrogen compounds consisting of inorganic nitrogen compounds, such ammonium sulfate [(NH4)2SO4] and ammonium chloride (NH4Cl), and organic nitrogen compounds, such as corn steep liquor (CSL), monosodium glutamate (C5H8NaO4), soybean powder (SBP), and urea [CO(NH2)2], were used as additional nitrogen sources in comparison with the yeast extract (YE). Cultivation was performed in a 500 mL Erlenmeyer flask which contained 100 mL of the STH medium, the composition of which was modified from the nitrogen-limited medium II [35]. The STH medium was composed of STH giving 40 g/L TRS, 0.55 g/L (NH4)2SO4, 0.4 g/L KH2PO4, 2.0 g/L MgSO4 7H2O and an individual additional nitrogen source at the equivalent nitrogen content of 0.6 g/L (C/N ratio was 6.67) with an initial pH of 5.5.
In the second stage, cells from the first stage were harvested by centrifugation at 8000 rpm for 5 min and re-suspended in 70 g/L of CG solution adjusted to pH 5.5. The incubation was performed on a rotary shaker (Lab Companion IS-971 R, Seoul, Korea) at 150 rpm and 28 °C for 120 h of each stage. In both stages, every 24 h cells were harvested for analysis of cell mass and lipid concentration. The additional nitrogen source that provided a high cell mass concentration with the highest lipid accumulation was selected for further studies.

Screening of Significant Factors for Cell Mass

In this study, eight factors consisting of medium component parameters (X1; concentration of TRS, X2; additional nitrogen sources, X3; (NH4)2SO4, X4; KH2PO4, and X5; MgSO4 7H2O) and physical parameters (X6; initial pH, X7; temperature and X8; shaking speed) were selected. The Plackett–Burman design (PBD) was used to screen important medium components and conditions with respect to their effects on cell mass production. The significant factors for cell mass and lipid production with levels of confidence higher than 90%, and the levels that gave the highest concentration of cell mass and lipid yield, were selected for further studies.

Optimization Temperature by the One-Factor-At-a-Time Methodology

Optimal temperature for biomass production was determined by the one-factor-at-a-time methodology experiment using a temperature gradient incubator (Toyo Kagaku Sangyo Co. Ltd., Tokyo, Japan). The temperature was set between 15.0 and 35.5 °C and an L-shaped tube containing 10 mL STH medium with the selected additional nitrogen source was used. Cultivation was performed in duplicates. After 120 h, cells were harvested for analysis of cell mass and lipid concentration. The optimal temperature for growth in hydrolysate medium was selected for further studies.

Optimization of the Concentration of (NH4)2SO4 and KH2PO4, and Shaking Speed by Box-Behnken Design

The Box-Behnken design (BBD) was applied to further identify the optimal medium components and conditions for cell mass production cultivated in the STH medium during the first stage of the two-stage cultivation process. Three factors, the concentration of (NH4)2SO4, of KH2PO4, and the shaking speed, were used to determine the response pattern and synergy of the factors. The 17 experimental runs of the BBD matrix were conducted in 500 mL Erlenmeyer flasks containing 100 mL of the STH medium with different concentrations of (NH4)2SO4 at 0.1–1.7 g/L and KH2PO4 at 0.01–0.39 g/L. The temperature and shaking speed were controlled at 28 °C and 180–200 rpm, respectively. The average cell mass production was taken as a dependent or response factor (Y1). Design-Expert Software evaluated the integrity of the regression model using the coefficient of determination (R2) and the analysis of variance (ANOVA).

Shift Time Improvement

The effect of the different shift times on cell mass production in the first stage was studied using the optimal STH medium and conditions determined by the RSM. Cells were harvested by centrifugation after cultivation for 48, 72, 96, and 120 h and resuspension in CG solution.

Initial TRS Concentration

To obtain the appropriate concentration of initial TRS of the STH medium after testing the effect of shift time, the initial TRS concentration was adjusted to 40, 50, 60, 70 and 80 g/L.

2.3.2. Optimization of Lipid Production from CG in the Second Stage

The optimization of lipid production from CG in the second stage was performed by the one-factor-at-a-time methodology and BBD. The optimal temperature for lipid production was determined by using a temperature gradient incubator with a temperature range between 17.0 and 37.8 °C. The cells were cultivated in 10 mL of optimal STH medium and, under optimal cultivation conditions, were collected and re-suspended in a 10 mL of 70 g/L CG solution with an initial pH of 5.5 in an L-shaped tube.
To identify the optimal conditions for the lipid concentration and lipid content of R. fluvialis DMKU-SP314 cultivated in the CG in the second stage of the two-stage cultivation process, a BBD was employed. Three factors, namely CG concentration, initial pH and shaking speed, were used to investigate the interactive effects of each variable on lipid production by using the experimental design. The first stage of cultivation was performed in STH with the optimal nutrients and cultivation conditions set from previous experiments. Then the cells were harvested and re-suspended in a CG solution in the second stage of cultivation. The 17 experimental runs from the BBD were conducted in 500 mL Erlenmeyer flasks containing 100 mL of different CG concentrations ranging between 70–130 g/L, with the initial pH adjusted to 5 or 6. The temperature and shaking speed were controlled at 27 °C and 180–200 rpm, respectively.
The average cell mass production, lipid concentration, and lipid content were taken as dependent or response factors (Y1, Y2, and Y3, respectively). The integrity of the regression model was evaluated using the coefficient of determination (R2) and the ANOVA.

2.4. Analytical Methods

To analyze the cell mass concentration (g/L), cells were harvested by centrifugation from a culture broth and washed twice with distilled water. The harvested cells were dried at 80 °C until they reached a constant weight of the cell mass.
To determine the lipid concentrations (g/L), lipids were extracted from the harvested cells by modification of the method of Bligh and Dyer [36]. Fatty acids were transformed into methyl ester through transesterification through the method of Holub and Skeaff [37]. The fatty acid methyl ester was analyzed using a gas chromatograph (GC14-A, Shimadzu, Kyoto, Japan) with a flame ionization detector and a silica megabore capillary column (30 m × 0.52 mm × 1 μm, Durabond 225, J and W Scientific, Texas, TX, USA). Lipid concentration was expressed as grams of the lipid (the sum of fatty acid concentration) per milliliter of the culture broth (g/L). Lipid content was expressed as the percentage of grams of lipid concentration per grams of dry cell mass (% of dry cell mass).
The TRS was measured by the dinitrosalicylic acid (DNS) method [38]. Glycerol concentration (g/L) was analyzed by using a Glycerol Colorimetric Assay Kit (Sigma-Aldrich, St. Louis, MO, USA).

3. Results and Discussion

To enhance lipid production from two low-cost substrates i.e., STH and CG by the selected oleaginous strain, R. fluvialis DMKU-SP314, a two-stage batch cultivation process was used. Separate optimizations of cell mass production in the first stage and lipid production in the second stage were performed. In the first stage, optimization of cell mass production was performed in enzymatic hydrolysis STH containing 43.18 g/L TRS. In the second stage, lipids were produced by cultivation in a CG solution.

3.1. Optimization of Cell Mass Production from STH in the First Stage

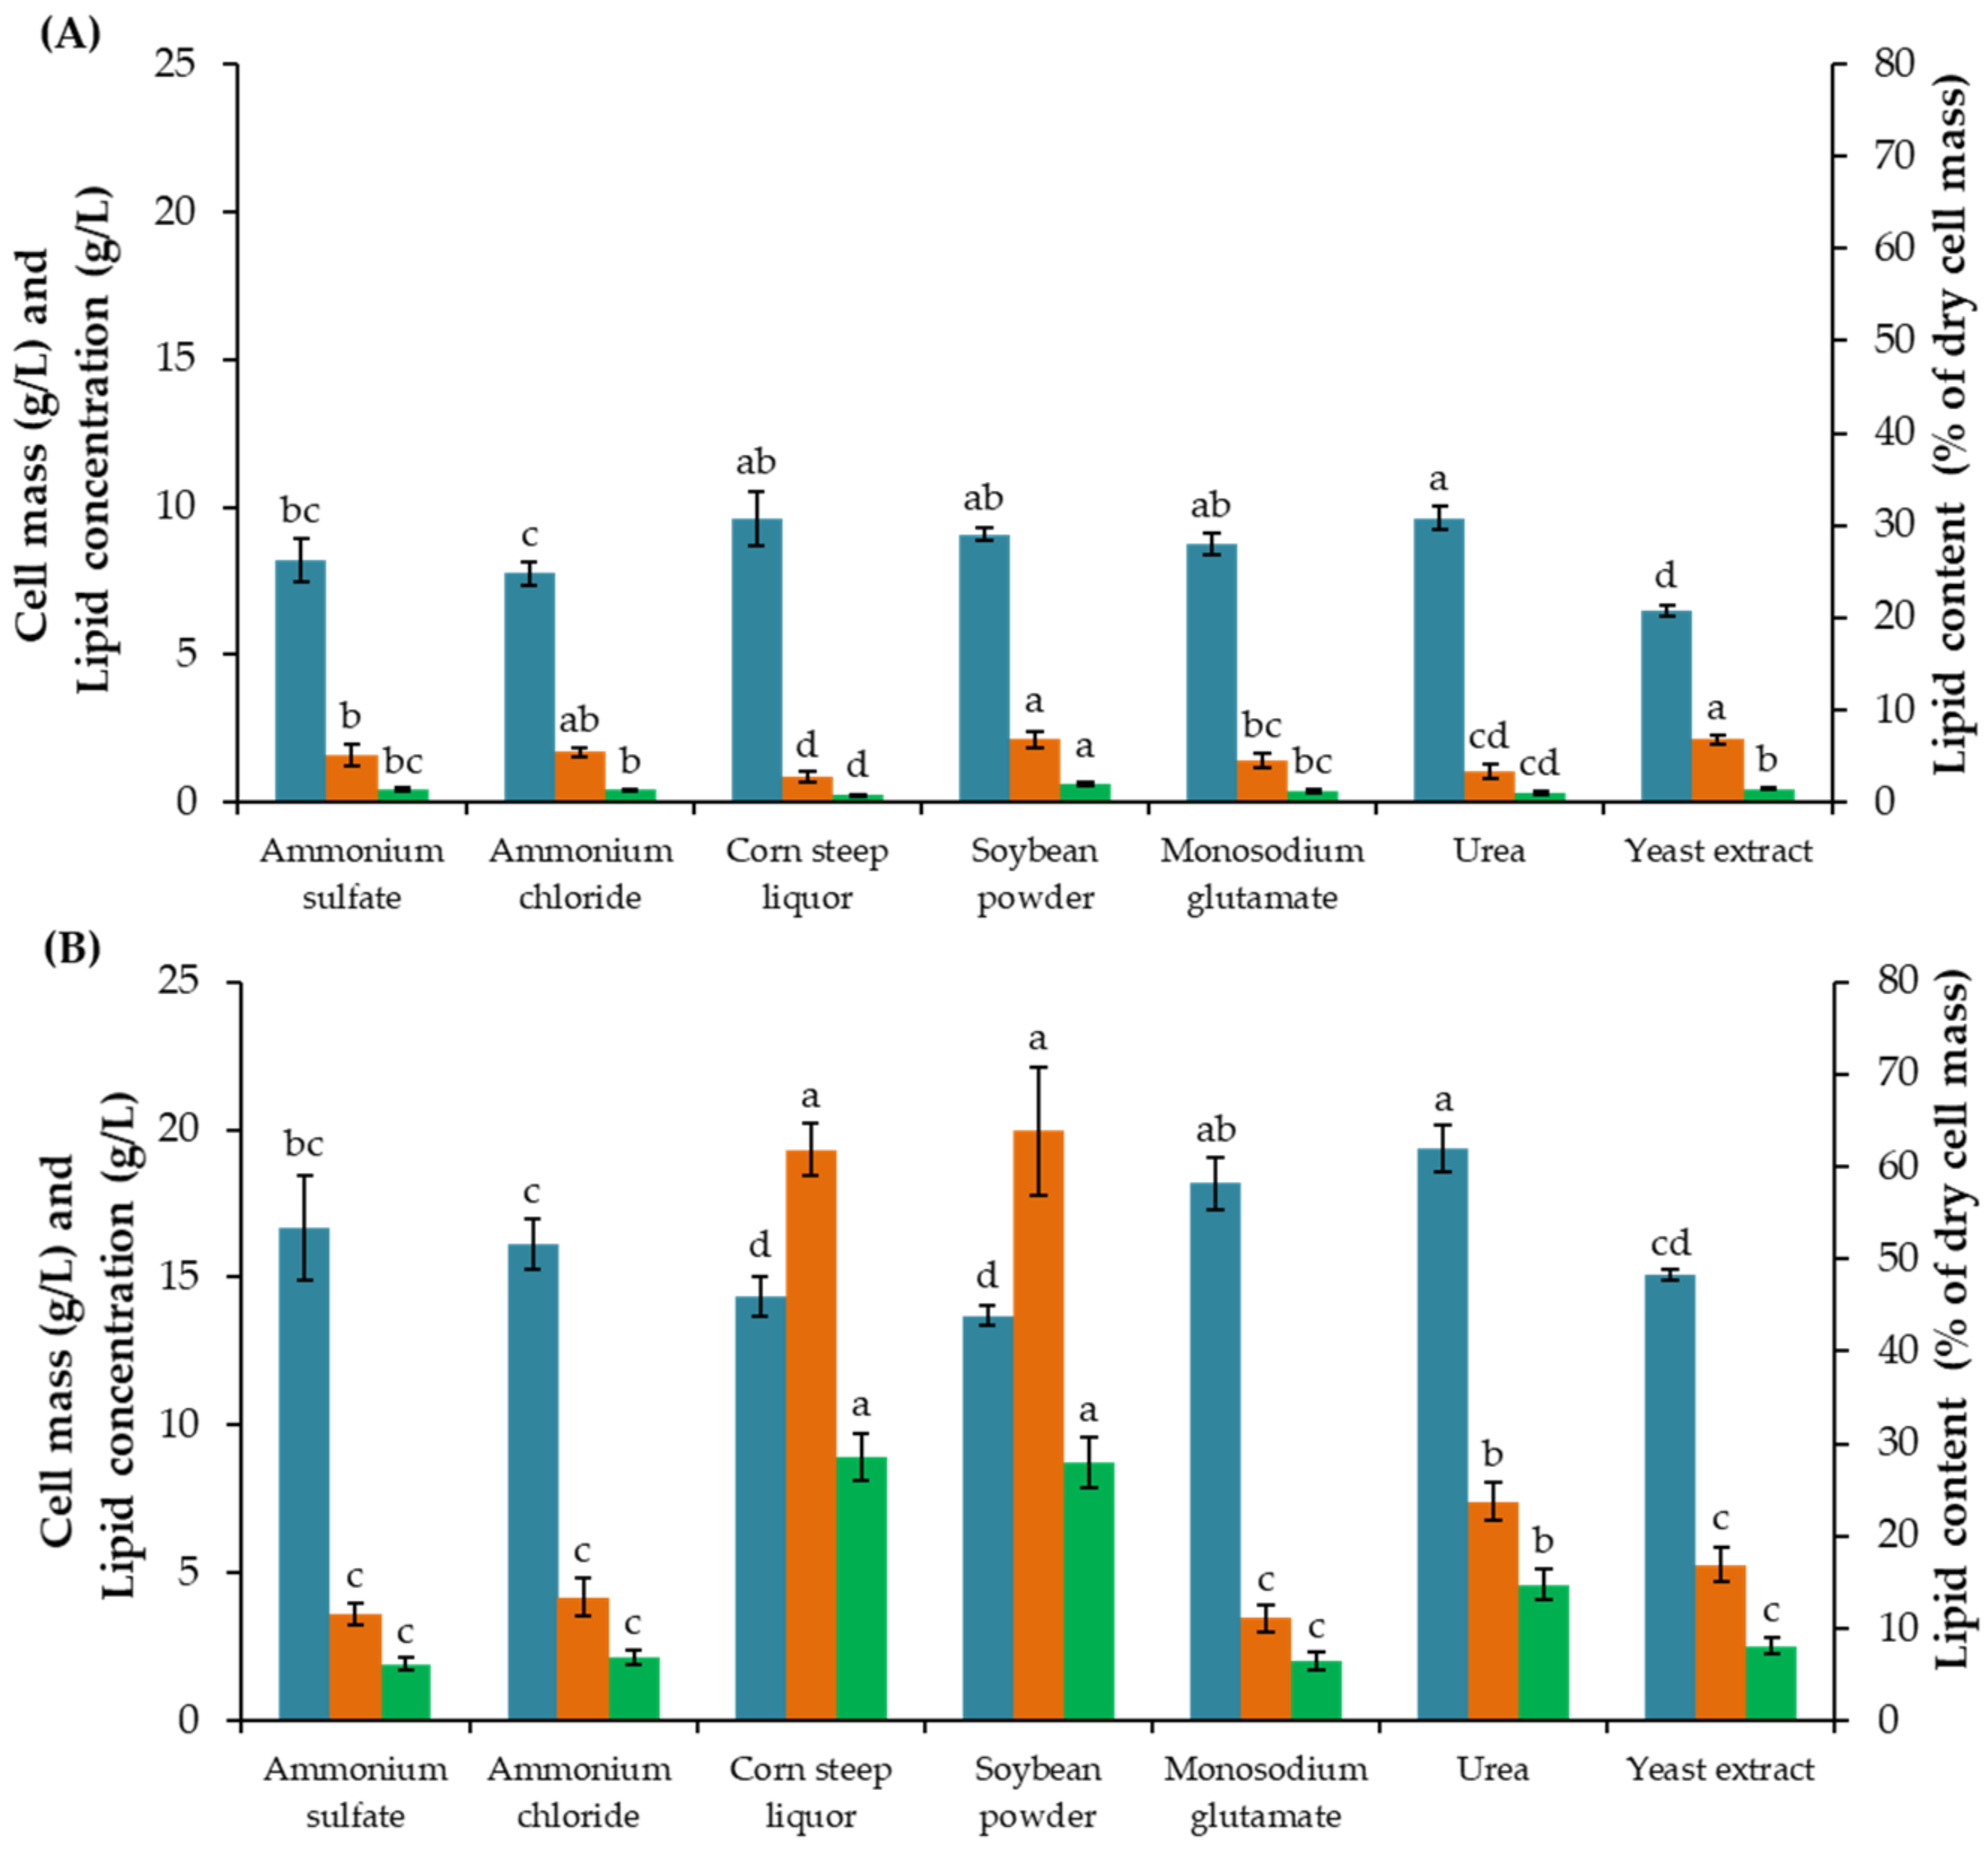
3.1.1. Effect of Additional Nitrogen Source

To find the most appropriate nitrogen source for cell mass production, inorganic nitrogen compounds i.e., (NH4)2SO4 and NH4Cl, and organic nitrogen compounds i.e., CSL, C5H8NNaO4, SBP, CO(NH2)2 and YE were individually tested at the same nitrogen concentration. At the end of the first stage, the highest cell masses of 9.62, 9.60, 9.08 and 8.74 g/L were obtained in the STH medium supplemented with CO(NH2)2, CSL, SBP, and C5H8NNaO4, respectively (Figure 1).
Considering lipid concentration and lipid content after the second stage, cells obtained when cultivated in the STH medium supplemented with CSL and SBP were much higher than the other combinations at 8.90 g/L and 61.85%, and 8.74 g/L and 63.83%, respectively. YE provided the lowest cell mass (6.48 g/L) at the end of first stage and relatively low lipid concentration and content (2.54 g/L and 16.87%) after the second stage. Low cell mass production in the first stage and lipid production in the second stage resulted from using inorganic nitrogen compounds. The results revealed that either CSL or SBP could be used as additional nitrogen sources. According to the results, SBP provided a higher lipid content than CSL, which indicate a higher potential of yeast cells obtained for lipid accumulation. This result corresponded to the report of Poontawee, et al. [30], where lipid concentration was significantly increased when the cultivation medium was supplemented with SBP. Therefore, SBP was selected as the additional nitrogen source for further studies.

3.1.2. Screening of Significant Factors

Eight factors (including the concentration of TRS, the additional nitrogen source, (NH4)2SO4, KH2PO4, MgSO4 7H2O, the initial pH, temperature and shaking speed) were analyzed with regard to their effect on cell mass production at the end of the first stage by RSM using PBD. The coefficient values from the regression analysis are shown in Table 1.
Generally, factors with a higher T-value and lesser p-value were considered to be significant model terms [39]. Factors with levels of confidence higher than 90% were considered to have a significant effect on the response. The results showed that four factors, X3 ((NH4)2SO4 concentration), X4 (KH2PO4 concentration), X7 (temperature) and X8 (shaking speed), most affected cell mass production. The factors i.e., (NH4)2SO4 concentration and shaking speed showed significant positive effects, while KH2PO4 concentration and temperature showed significant negative effects. Shaking speed, with a probability value of 0.022, was found to be the factor with the highest influence on cell mass production.

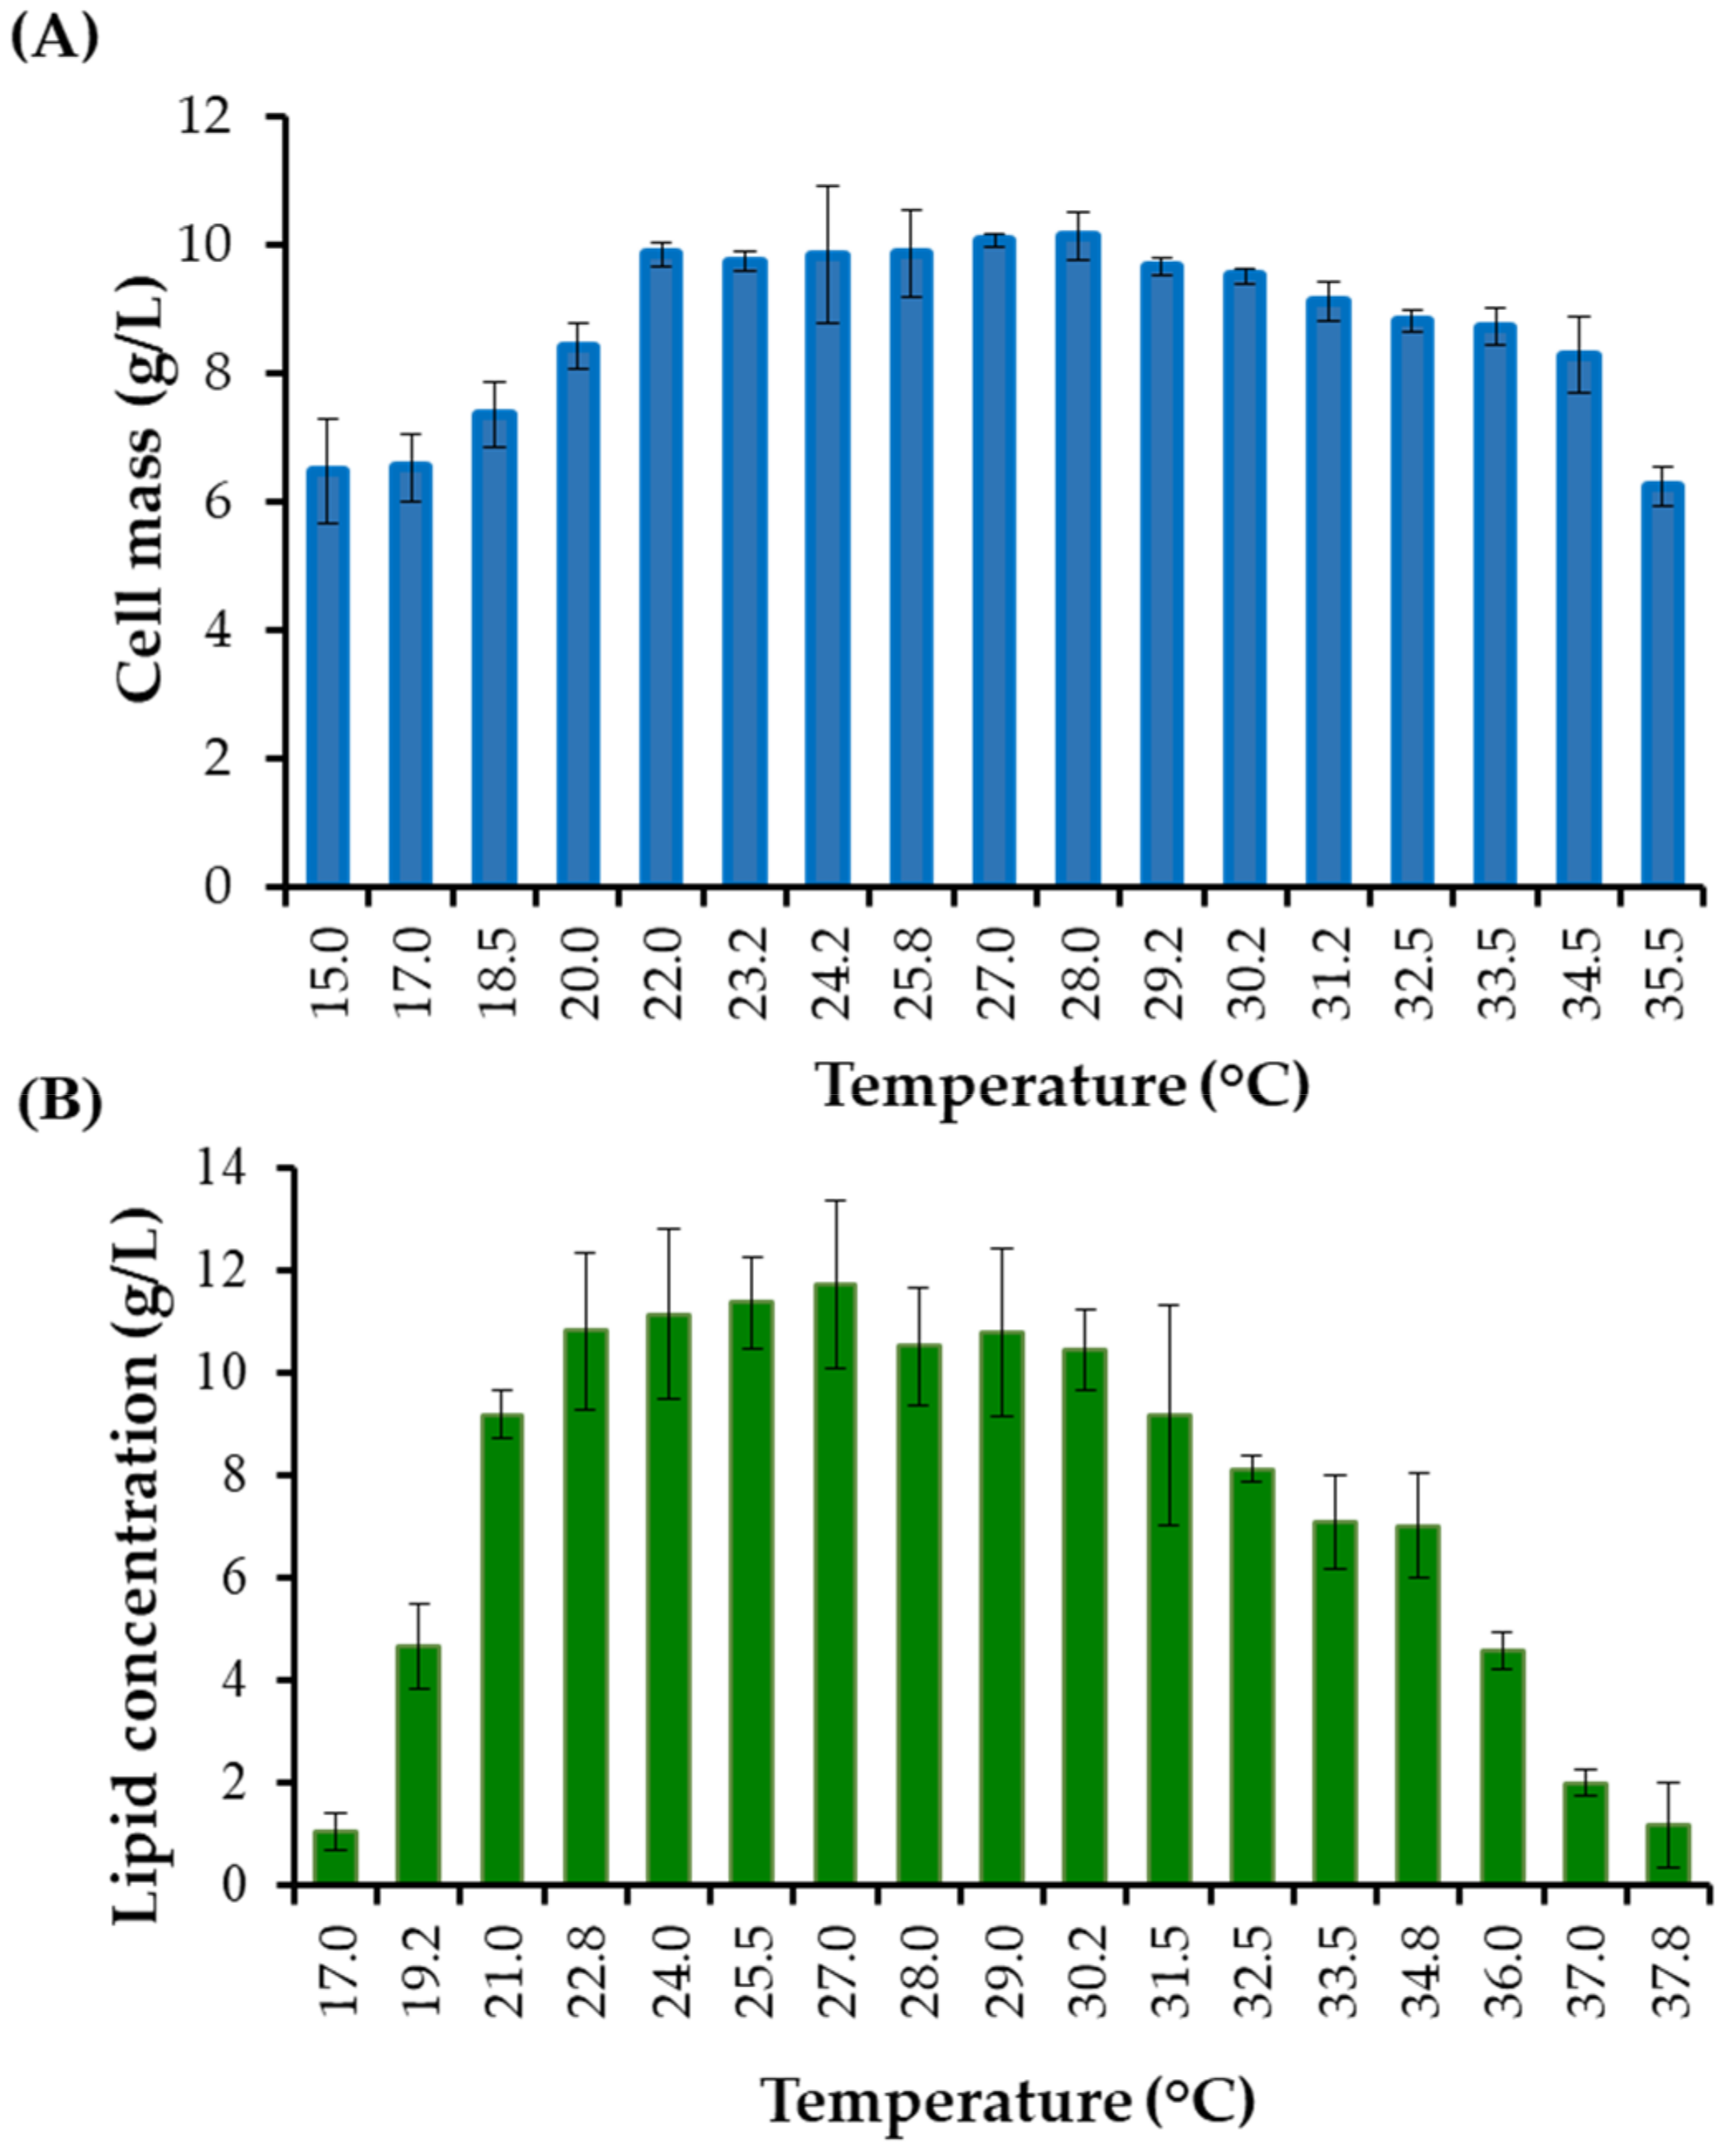
3.1.3. Optimization of Temperature by the One-Factor-At-a-Time Method

Temperature was found to be an important significant factor in the PBD experiment. To obtain an accurate optimal temperature of yeast growth, temperature optimization was conducted separately using a temperature gradient incubator. The statistical analysis showed the optimal temperature for growth of this strain was between 27 and 28 °C (data not shown). In this experiment, the highest cell mass was achieved when cultivation was conducted at 28 °C for 120 h.
In the previous study conducted by Poontawee, et al. [30], a temperature of 28 °C was also used with this strain, R. fluvialis DMKU-SP314, and the same species, R. fluvialis DMKU-RK253, to provide high cell mass and lipid concentrations [30]. Moreover, this temperature was also used for cultivation of other yeast species Rhodotorula toruloides, R. glutinis, T. coremiiforme and Y. lipolytica for growth and lipid production [12,35,40,41]. Therefore, 28 °C was selected for further studies.

3.1.4. Optimization of the Concentration of (NH4)2SO4, KH2PO4, and Shaking Speed by BBD

Optimization was performed by the construction of a quadratic model using BBD. The influence of the three factors, X1 ((NH4)2SO4 concentration), X2 (KH2PO4 concentration) and X3 (shaking speed) on cell mass production with R. fluvialis DMKU-SP314 were determined at the optimal temperature, 28 °C. To design the three significant factors used in the present study, the middle point values of factors were set at the levels that gave maximal yield of cell mass based on the results of the PBD experiment, except for shaking speed. The shaking speed was set as 160, 180, and 200 rpm. For the insignificant factors, the levels that gave the maximal cell mass concentration from the PBD experiment were used (including 70 g/L TRS, 2.58 g/L SBP, 2.5 g/L MgSO4 7H2O and an initial pH of 6). After an incubation period of 120 h, the maximal cell mass of 16.73 g/L was obtained. The data were analyzed by multiple regression analyses, and the regression coefficients were determined (Table 2).
The quadratic model was highly significant, with a very high model F-value (69.42) and a very low p-value (p < 0.0001). In addition, any lack of integrity in the F-value of the model was not significant (0.1636). Furthermore, the value of the correlation coefficient (R2) for cell mass was 0.9889, and the adjusted R2 was 0.9747. These values indicate that the quadratic model was significant and there was a high correlation between the actual results and the values predicted by the model equation. The ANOVA of the optimization of cell mass production indicated that among the three factors selected by the PBD experiment, shaking speed (X4) and (NH4)2SO4 concentration (X1) had significant effect on cell mass production, contrary to the KH2PO4 concentration (X2) (Table 2). Moreover, the interaction between shaking speed and the (NH4)2SO4 concentration (X1X3) were also significant. However, the interaction between the (NH4)2SO4 concentration and KH2PO4 concentration (X1X2), and the interaction between shaking speed and the KH2PO4 concentration (X2X3) were not significant, indicating that the KH2PO4 concentration had no significant influence on the response.
The BBD gave the following second-order polynomial equation for the cell mass (Y) production as a function of X1 [(NH4)2SO4 concentration], X2 (KH2PO4 concentration) and X3 (shaking speed).
Y = + 13.77 + 2.72 X 1 + 0.15 X 2 + 1.40 X 3 + 0.025 X 1 X 2   + 1.72 X 1 X 3   0.047 X 2 X 3   2.63 X 1 2 + 0.077 X 2 2   0.25 X 3 2
A significant positive effect of the (NH4)2SO4 concentration with respect to cell mass production was also found in Candida sp. and R. glutinis [42]. According to the ANOVA results, the (NH4)2SO4 concentration showed a significant negative effect on lipid concentration and lipid content (data not shown). This was also observed by Bandhu et al. [43] who found from BBD that (NH4)2SO4 concentration had significant negative effect on lipid concentration. Consequently, a decrease of the (NH4)2SO4 concentration led to enhanced lipid concentration together with lipid content.
This experiment aimed to optimize cell mass production; thus, the significant factors that provided the highest cell mass concentration were selected for validation according to the computational model. The model predicted values of 15.34 g/L cell mass, 5.11 g/L lipid concentration and 33.31% lipid content when cultivated in a hydrolysate medium composed of 0.94 g/L (NH4)2SO4 and 0.39 g/L KH2PO4 on a rotary shaker at 200 rpm and 28 °C. The solution was tested in a shaking flask using the values depicted as optimal, which resulted in cell mass and lipid concentrations of 15.60 g/L and 6.18 g/L, respectively, calculated at a lipid content of 40.06% of dry cell mass at the end of the first stage (120 h).

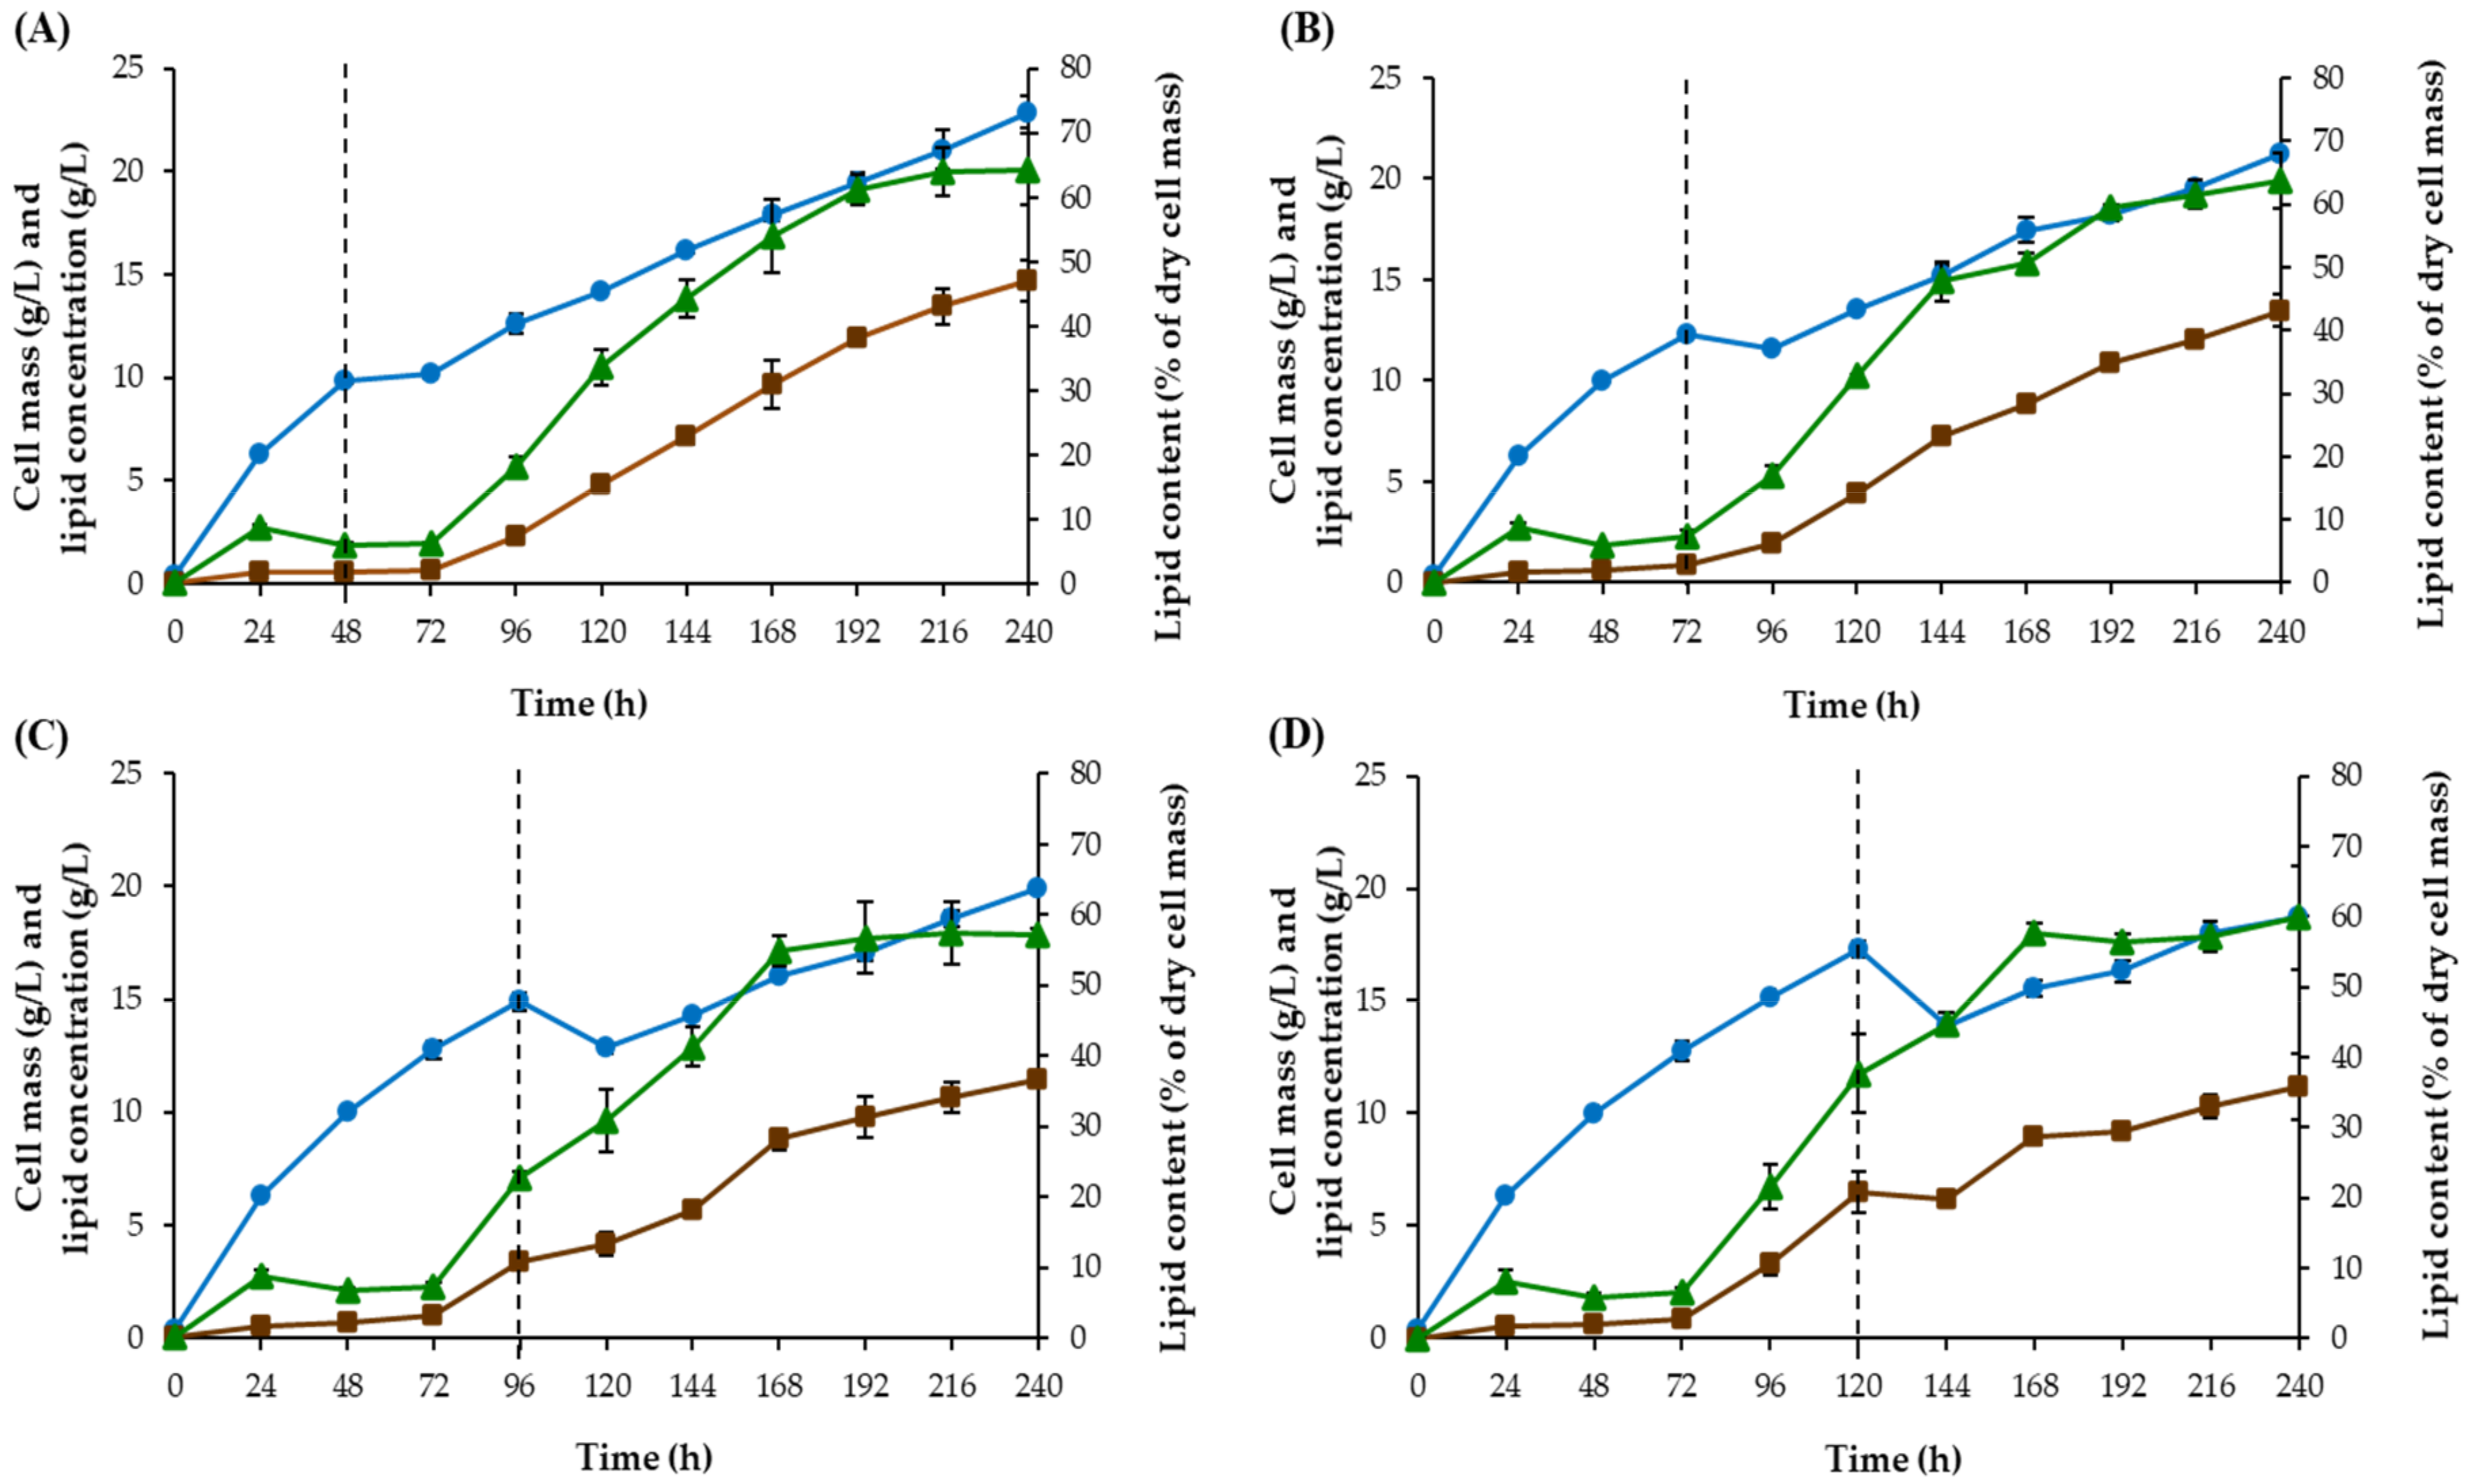
3.1.5. Shift Time Improvement

In two-stage cultivation, the shift from the first stage to the second stage may influence lipid production. Therefore, we investigated the effect of shift time on lipid production. In all the previous experiments cited in this study, the first stage was carried out for 120 h and then cells were collected and re-suspended in the CG solution in the second stage. During the first stage, we observed a reduction in growth after 48 h (data not shown). To identify the most suitable cell stage for the shift to the second stage, the effect of shift time on cell growth and lipid production were studied at 48, 72, 96, and 120 h. The highest cell mass of 22.87 g/L, lipid concentration of 14.69 g/L and lipid content of 64.33% of dry cell mass were obtained at the end of the second stage (240 h) when the shift time was 48 h (Figure 2). Growth characteristics of this yeast demonstrated that at 48 h of cultivation, cells were in the exponential phase (data not shown). Thus, the most suitable cell stage for the shift to the second stage is indicated to be the exponential phase. For this result, the shift time of 48h in the two-stage cultivation was selected for further study.

3.1.6. TRS Concentration

An initial reducing sugar concentration of 70 g/L was used for BBD optimization with the shift time at 120 h; however, the result of shift time experiments showed that 48 h was the most suitable, therefore, initial TRS of 70 g/L was probably excessive for cell propagation in the first stage. Thus, a study of the effect of initial TRS concentration ranging from approximately 40 g/L (only natural TRS in STH) to 80 g/L (TRS in STH supplemented with glucose) on cell mass and lipid production in the first stage was performed. The results in Table 3 revealed that increasing the initial TRS concentration between 43.18 and 80.40 g/L did not increased of TRS consumption or cell mass production, but rather an increase in lipid concentration and lipid content was shown. The result indicated that only TRS in STH (43.18 g/L) without the addition of sugar was sufficient for cell propagation for 48 h in the first stage of cultivation.
This result was in line with the results observed in R. toruloides Y4, which showed that cultivation in 40 g/L initial glucose resulted in the highest specific growth rate [44]. It is well known that initial carbon concentration affects the specific growth rate. The expression of a large number of genes that are required for the metabolism of alternative carbon sources were repressed when cells were grown in an inopportune glucose concentration [45].
In summary, the optimal hydrolysate medium for cell growth in the first stage consisted of original STH (43.18 g/L TRS), 2.58 g/L SBP, 0.94 g/L (NH4)2SO4, 0.39 g/L KH2PO4, 2.5 g/L MgSO4 7H2O and an initial pH of 6. The optimal cultivation conditions were shaking on a rotary shaker at 200 rpm and 28 °C for 48 h. Under these optimal STH medium and cultivation conditions, cell mass reached 10.61 g/L with a lipid content of 5.66%.

3.2. Optimization of Lipid Production from CG in the Second Stage by the One-Factor-At-a-Time Technique and BBD

It has been reported that lipid production is influenced by cultivation temperature [46]. The effect of temperature on the lipid production of R. fluvialis DMKU-SP314 was determined by a temperature gradient incubator. The results showed that the highest lipid concentration was achieved after the second stage of cultivation, and when incubated at 27 °C (Figure 3). However, the lipid concentrations obtained when R. fluvialis DMKU-SP314 was cultivated at 24–27 °C were not statistically different from cultivation at 28–37.8 °C which decreased with the increase of temperature. Our results were similar to results reported by Zhang, et al. [22], which found that lipid production with R. glutinis CGMCC 2258 at 24 °C was higher than at 30 °C [46]. Oleaginous yeasts attained the highest cell mass and lipid accumulation under certain conditions, which included temperatures maintained between 25 and 30 °C [14].
Three important factors, namely CG concentration, initial pH, and shaking speed were used for optimization of lipid concentration and lipid content in the second stage of two-stage cultivation. When the R. fluvialis DMKU-SP314 was cultivated under optimum conditions in the first stage, and within various conditions during the second stage according to the BBD, 17 experimental runs were conducted. The results show cell mass concentrations ranging between 20.99–26.07 g/L, lipid concentrations between 10.84–14.16 g/L and lipid content between 41.64–57.39% of dry cell mass. The ANOVA for the response surface quadratic model for cell mass production, lipid production, and lipid content are presented below in Table 4.
Based on the ANOVA analysis that gave the level of response as a function of the four independents factors by employing multiple regression analysis, the following regression equations were obtained:
Y 1 = 743.0128   0.42994 X 1   11.0167 X 2   7.04754 X 3 + 0.042333 X 1 X 2 + 0.000246 X 1 X 3 + 0.000005 X 2 X 3   0.000115 X 1 2   + 0.58167 X 2 2 + 0.017779 X 3 2
Y 2 = 407.0596   0.54304 X 1 62.0692 X 2 2.064 X 3   + 0.000617 X 1 X 2 + 0.00027 X 1 X 3 + 0.324 X 2 X 3
Y 3 = 249.98662   1.09622   X 1   187.2125 X 2 + 9.27508 X 3 0.068333 X 1 X 2   + 0.000616 X 1 X 3 + 1.2615 X 2 X 3   0.000114 X 1 2   4.20333 X 2 2   0.044333 X 3 2
The relationships among the three factors X1 (CG concentration), X2 (initial pH), and X3 (shaking speed) were determined using the response surface for the quadratic model as cell mass production, lipid concentration, and lipid content. The regression models accurately described the experimental data, which indicated a correlation among the three factors which affected the three responses as discussed above. This statement is supported by the fact that the values of the correlation coefficient (R2) for cell mass production, lipid concentration, and lipid content were 0.94, 0.92, and 0.95, respectively, which in turn suggests that most of the errors/variation in the model can be explained [47]. It is known that the R2 value is always between 0 and 1 and that a value closer to 1 indicates stronger models and better predictions of the responses. The R2 values in this study suggested a satisfactory representation of the process model and a good correlation between the experimental results and the theoretical values predicted by the model equation. The results of the regression coefficients revealed that cell mass production, lipid concentration, and lipid content were clearly affected by interactions between the shaking speed and CG concentration.
The significant influence of CG and shaking speed in relation to the cell mass and lipid concentration resulting in a higher lipid content was also observed in R. fluvialis by DMKU-RK253 [23]. Shaking speed has an effect on the glycerol concentration due to the fact that the oxygen supplied by shaking is required as the final electron acceptor for glycerol oxidation [48]. The dissolved oxygen concentration in the culture medium is correlated with the activity of glycerol use enzymes, which leads to high lipid production.
The shaking speed supplies the oxygen required for yeast growth in the culture broth, and, as a result, different speeds resulted in different levels of oxygen dissolution. As mentioned previously when discussing the PBD experiment, shaking speed was found to be the factor with the highest influence on cell mass and lipid concentration (Table 1). This relationship was also found in the BBD experiment (Table 2 and Table 4). Both the PBD and the BBD experiments indicated that shaking speed strongly influenced not only cell mass concentration, but also lipid concentration. This suggested that the cell mass and lipid production of R. fluvialis DMKU-SP314 required high oxygen availability. The effect of oxygen availability on cell mass production was also observed in Rhodosporidium azoricum, where oxygen was limited; the final cell mass was lower than when oxygen was not limited. Likewise, a negative effect on the lipid production of R. azoricum and T. oleaginosus was found when the aeration rate decreased [49].
Based on the high statistical significance of the regression, an RSM mathematical model was used to calculate the conditions under which the lipid production could be optimized. According to the analysis by Design-Expert software, five experimental designs were selected for validating the model and predicting optimal conditions (Table 4). The results showed that the optimal conditions for lipid production with R. fluvialis DMKU-SP314 corresponded to 87.54 g/L CG with an initial pH of 5 and a shaking speed of 180 rpm. These conditions are likely to provide the best process response, leading to a maximum lipid content of 58.04% of dry cell mass when the cell mass and lipid concentrations were 25.12 g/L and 14.66 g/L, respectively. The validation of the prediction experiment was carried out using the above optimal conditions, resulting in a lipid content of 73.04% of dry cell mass when the cell mass and lipid concentration were 21.70 g/L and 15.85 g/L, respectively.
The two-stage cultivation under the optimal nutrient and cultural conditions in this study could enhance lipid biosynthesis (Table 5).
In the first stage, when STH was used as a feedstock, there was a cell mass yield of up to 0.35 g/g TRS with only a low lipid yield of 0.02 g/g. This supported STH as a suitable carbon source for cell growth. Then, high lipid yield was observed in the second stage using a CG solution without auxiliary nutrients. A higher lipid yield of 0.23 g/g and cell mass yield of 0.17 g/g glycerol was obtained. These results therefore demonstrate that the two-stage cultivation process, in which STH was used in the first stage and CG was used in the second stage, produced optimal cell growth and lipid production. This provided the highest lipid content (73% of dry cell mass) when compared with other investigations, as shown in Table 6. Comparing this result with the same yeast strain and substrate revealed that using a two stage batch cultivation could enhance lipid content better than a two-stage fed-batch cultivation that was used in the previous study [21]. Although lipid concentration produced in this study was lower than that produced by Cryptococcus curvatus ATCC 20509, using a two-stage fed-batch process in a 1.5 L bioreactor cultivated in only CG [31]. However, nearly the same lipid concentration was obtained when the production was carried out by another strain of R. fluvialis using only CG and a two stage batch, shaking flask cultivation [23]. In addition, lipid concentration in this study was higher than those reported in many investigations also using a two-stage cultivation process with various yeast species and various carbon substrates, as shown in Table 6. This demonstrated that STH is a suitable substrate for cell mass production with R. fluvialis DMKU–SP314. The use of a two-stage cultivation process led to high cell density and an increase in a high quantity of lipids. Moreover, CG was found to be an effective carbon source for lipid production in the second stage of cultivation with R. fluvialis DMKU–SP314.

3.3. Fatty Acid Compositions

The fatty acid compositions of lipids produced by R. fluvialis DMKU-SP314 in this study was determined by gas chromatography after a transesterification step. The highest fatty acid was found to be oleic acid (C18:1), followed by palmitic acid (C16:0), linoleic acid (C18:2), stearic acid (C18:0), linolenic acid (C18:3) and myristic (C14:0). Similar fatty acid compositions were reported for R. fluvialis DMKU-SP314 in previous study [21], for R. fluvialis DMKU-RK253 grown on CG [23], and R. toruloides grown on corn stover hydrolysate [53]. Increased concentrations of unsaturated fatty acids are essentially required to improve the cold-flowing properties of biodiesel (FAMEs). However, they are undesirable for Green-diesel production due to elevated hydrogen consumption [54]. The fatty acid composition of lipids produced by this yeast species is qualitatively similar to that of common plant oils used in biodiesel production [55] as shown in Table 7.

4. Conclusions

This study demonstrated that STH is a suitable substrate for cell mass production by R. fluvialis DMKU–SP314. The use of a two-stage batch cultivation led to high cell density and an increase in a high quantity of lipids. Moreover, CG was found to be an effective carbon source for lipid production in the second stage of cultivation with R. fluvialis DMKU–SP314. The lipid volume produced by this yeast species exhibited a fatty acid composition similar to that of major plant oils commonly used in biodiesel production currently. Therefore, R. fluvialis DMKU–SP314 has a promising ability to convert agricultural residues and hydrolysates into microbial lipids with no additional nitrogen source needed in the lipid accumulation stage in order to produce lipid content viable as a renewable biodiesel fuel.

Author Contributions

J.B., methodology, investigation, formal analysis, and writing—original draft preparation. P.P., methodology, investigation, formal analysis, and writing—original draft preparation. B.K., investigation and formal analysis. Z.K.Z. writing—review and editing. S.L., Funding acquisition, project administration, conceptualization, supervision, and writing—review and editing. All authors have read and agreed to the published version of the manuscript.

Funding

This work was supported by the National Research Council of Thailand (NRCT); the National Natural Science Foundation of China (NSFC) grant no. 51761145014; and the Development and Promotion of Science and Technology Talents Project (Royal Government of Thailand scholarship); and the Thailand Research Fund through the TRF Research-Team Promotion Grant through the project “Yeast Biodiversity and Biotechnology” grant no. RTA6080004.

Conflicts of Interest

The authors declare no conflict of interest.

References

  1. Knothe, G.; Razon, L.F. Biodiesel fuels. Prog. Energy Combust. Sci. 2017, 58, 36–59. [Google Scholar] [CrossRef]
  2. Mohd Noor, C.W.; Noor, M.M.; Mamat, R. Biodiesel as alternative fuel for marine diesel engine applications: A review. Renew. Sustain. Energy Rev. 2018, 94, 127–142. [Google Scholar] [CrossRef]
  3. Knothe, G.; Krahl, J.; Van Gerpen, J. The Biodiesel Handbook, Second Edition; Elsevier Inc., Academic Press and AOCS Press: Cambridge, MA, USA, 2010; Current Status of the Biodiesel Industry, 494; pp. 299–399. [Google Scholar]
  4. Mata, T.M.; Martins, A.A.; Caetano, N.S. Valorization of Waste Frying Oils and Animal Fats for Biodiesel Production. In Advanced Biofuels and Bioproducts; Lee, J.W., Ed.; Springer: New York, NY, USA, 2013; pp. 671–693. [Google Scholar] [CrossRef]
  5. Parsons, S.; Raikova, S.; Chuck, C.J. The viability and desirability of replacing palm oil. Nat. Sustain. 2020. [Google Scholar] [CrossRef]
  6. Magdouli, S.; Yan, S.; Tyagi, R.D.; Surampalli, R.Y. Heterotrophic microorganisms: A promising source for biodiesel production. Crit. Rev. Environ. Sci. Technol. 2014, 44, 416–453. [Google Scholar] [CrossRef]
  7. Sitepu, I.R.; Garay, L.A.; Sestric, R.; Levin, D.; Block, D.E.; German, J.B.; Boundy-Mills, K.L. Oleaginous yeasts for biodiesel: Current and future trends in biology and production. Biotechnol. Adv. 2014, 32, 1336–1360. [Google Scholar] [CrossRef] [PubMed] [Green Version]
  8. Patel, A.; Arora, N.; Sartaj, K.; Pruthi, V.; Pruthi, P.A. Sustainable biodiesel production from oleaginous yeasts utilizing hydrolysates of various non-edible lignocellulosic biomasses. Renew. Sustain. Energy Rev. 2016, 62, 836–855. [Google Scholar] [CrossRef]
  9. Sitepu, I.R.; Sestric, R.; Ignatia, L.; Levin, D.; German, J.B.; Gillies, L.A.; Almada, L.A.G.; Boundy-Mills, K.L. Manipulation of culture conditions alters lipid content and fatty acid profiles of a wide variety of known and new oleaginous yeast species. Bioresour. Technol. 2013, 144, 360–369. [Google Scholar] [CrossRef] [Green Version]
  10. Amaretti, A.; Raimondi, S.; Sala, M.; Roncaglia, L.; De Lucia, M.; Leonardi, A.; Rossi, M. Single cell oils of the cold-adapted oleaginous yeast Rhodotorula glacialis DBVPG 4785. Microb. Cell Fact. 2010, 9, 73. [Google Scholar] [CrossRef] [Green Version]
  11. Beopoulos, A.; Chardot, T.; Nicaud, J.-M. Yarrowia lipolytica: A model and a tool to understand the mechanisms implicated in lipid accumulation. Biochimie 2009, 91, 692–696. [Google Scholar] [CrossRef]
  12. Bellou, S.; Triantaphyllidou, I.E.; Mizerakis, P.; Aggelis, G. High lipid accumulation in Yarrowia lipolytica cultivated under double limitation of nitrogen and magnesium. J. Biotechnol. 2016, 234, 116–126. [Google Scholar] [CrossRef]
  13. Jiru, T.M.; Groenewald, M.; Pohl, C.; Steyn, L.; Kiggundu, N.; Abate, D. Optimization of cultivation conditions for biotechnological production of lipid by Rhodotorula kratochvilovae (syn, Rhodosporidium kratochvilovae) SY89 for biodiesel preparation. 3 Biotech 2017, 7, 145. [Google Scholar] [CrossRef] [PubMed] [Green Version]
  14. Ageitos, J.M.; Vallejo, J.A.; Veiga-Crespo, P.; Villa, T.G. Oily yeasts as oleaginous cell factories. Appl. Microbiol. Biotechnol. 2011, 90, 1219–1227. [Google Scholar] [CrossRef] [PubMed]
  15. Chang, Y.-H.; Chang, K.-S.; Lee, C.-F.; Hsu, C.-L.; Huang, C.-W.; Jang, H.-D. Microbial lipid production by oleaginous yeast Cryptococcus sp. in the batch cultures using corncob hydrolysate as carbon source. Biomass Bioenergy 2015, 72, 95–103. [Google Scholar] [CrossRef]
  16. Xiong, L.; Huang, C.; Yang, X.-Y.; Lin, X.-Q.; Chen, X.-F.; Wang, C.; Wang, B.; Zeng, X.-A.; Chen, X.-D. Beneficial effect of corncob acid hydrolysate on the lipid production by oleaginous yeast Trichosporon dermatis. Prep. Biochem. Biotechnol. 2015, 45, 421–429. [Google Scholar] [CrossRef] [PubMed]
  17. Matsakas, L.; Bonturi, N.; Miranda, E.A.; Rova, U.; Christakopoulos, P. High concentrations of dried sorghum stalks as a biomass feedstock for single cell oil production by Rhodosporidium toruloides. Biotechnol. Biofuels 2015, 8, 6. [Google Scholar] [CrossRef] [PubMed] [Green Version]
  18. Duarte, S.H.; de Andrade, C.C.P.; Ghiselli, G.; Maugeri, F. Exploration of Brazilian biodiversity and selection of a new oleaginous yeast strain cultivated in raw glycerol. Bioresour. Technol. 2013, 138, 377–381. [Google Scholar] [CrossRef] [PubMed] [Green Version]
  19. Chang, Y.-H.; Chang, K.-S.; Hsu, C.-L.; Chuang, L.-T.; Chen, C.-Y.; Huang, F.-Y.; Jang, H.-D. A comparative study on batch and fed-batch cultures of oleaginous yeast Cryptococcus sp. in glucose-based media and corncob hydrolysate for microbial oil production. Fuel 2013, 105, 711–717. [Google Scholar] [CrossRef]
  20. Leiva-Candia, D.E.; Tsakona, S.; Kopsahelis, N.; García, I.L.; Papanikolaou, S.; Dorado, M.P.; Koutinas, A.A. Biorefining of by-product streams from sunflower-based biodiesel production plants for integrated synthesis of microbial oil and value-added co-products. Bioresour. Technol. 2015, 190, 57–65. [Google Scholar] [CrossRef]
  21. Poontawee, R.; Limtong, S. Feeding strategies of two-stage fed-batch cultivation processes for microbial lipid production from sugarcane top hydrolysate and crude glycerol by the oleaginous red yeast Rhodosporidiobolus fluvialis. Microorganisms 2020, 8. [Google Scholar] [CrossRef] [Green Version]
  22. Zhang, Z.; Zhang, X.; Tan, T. Lipid and carotenoid production by Rhodotorula glutinis under irradiation/high-temperature and dark/low-temperature cultivation. Bioresour. Technol. 2014, 157, 149–153. [Google Scholar] [CrossRef]
  23. Polburee, P.; Yongmanitchai, W.; Honda, K.; Ohashi, T.; Yoshida, T.; Fujiyama, K.; Limtong, S. Lipid production from biodiesel-derived crude glycerol by Rhodosporidium fluviale DMKU-RK253 using temperature shift with high cell density. Biochem. Eng. J. 2016, 112, 208–218. [Google Scholar] [CrossRef]
  24. Lin, J.; Shen, H.; Tan, H.; Zhao, X.; Wu, S.; Hu, C.; Zhao, Z.K. Lipid production by Lipomyces starkeyi cells in glucose solution without auxiliary nutrients. J. Biotechnol. 2011, 152, 184–188. [Google Scholar] [CrossRef] [PubMed]
  25. Calvey, C.H.; Su, Y.-K.; Willis, L.B.; McGee, M.; Jeffries, T.W. Nitrogen limitation, oxygen limitation, and lipid accumulation in Lipomyces starkeyi. Bioresour. Technol. 2016, 200, 780–788. [Google Scholar] [CrossRef] [PubMed] [Green Version]
  26. Liu, Y.; Wang, Y.; Liu, H.; Zhang, J.a. Enhanced lipid production with undetoxified corncob hydrolysate by Rhodotorula glutinis using a high cell density culture strategy. Bioresour. Technol. 2015, 180, 32–39. [Google Scholar] [CrossRef]
  27. Kumar, D.; Singh, B.; Korstad, J. Utilization of lignocellulosic biomass by oleaginous yeast and bacteria for production of biodiesel and renewable diesel. Renew. Sustain. Energy Rev. 2017, 73, 654–671. [Google Scholar] [CrossRef]
  28. López, I.; Aranda, E.M.; Juárez, J.A.R.; Mendoza, G.D. Nutritional evaluation of eight sugarcane varieties with forage potential. Cuban J. Agric. Sci. 2003, 36, 375–380. [Google Scholar]
  29. Poontawee, R.; Yongmanitchai, W.; Limtong, S. Efficient oleaginous yeasts for lipid production from lignocellulosic sugars and effects of lignocellulose degradation compounds on growth and lipid production. Process Biochem. 2017, 53, 44–60. [Google Scholar] [CrossRef]
  30. Poontawee, R.; Yongmanitchai, W.; Limtong, S. Lipid production from a mixture of sugarcane top hydrolysate and biodiesel-derived crude glycerol by the oleaginous red yeast, Rhodosporidiobolus fluvialis. Process Biochem. 2018, 66, 150–161. [Google Scholar] [CrossRef]
  31. Liang, Y.; Cui, Y.; Trushenski, J.; Blackburn, J.W. Converting crude glycerol derived from yellow grease to lipids through yeast fermentation. Bioresour. Technol. 2010, 101, 7581–7586. [Google Scholar] [CrossRef]
  32. Cheirsilp, B.; Louhasakul, Y. Industrial wastes as a promising renewable source for production of microbial lipid and direct transesterification of the lipid into biodiesel. Bioresour. Technol. 2013, 142, 329–337. [Google Scholar] [CrossRef]
  33. Kitcha, S.; Cheirsilp, B. Enhancing lipid production from crude glycerol by newly isolated oleaginous yeasts: Strain selection, process optimization, and fed-batch strategy. Bioenergy Res. 2013, 6, 300–310. [Google Scholar] [CrossRef]
  34. Yang, X.; Jin, G.; Gong, Z.; Shen, H.; Bai, F.; Zhao, Z.K. Recycling biodiesel-derived glycerol by the oleaginous yeast Rhodosporidium toruloides Y4 through the two-stage lipid production process. Biochem. Eng. J. 2014, 91, 86–91. [Google Scholar] [CrossRef]
  35. Kraisintu, P.; Yongmanitchai, W.; Limtong, S. Selection and optimization for lipid production of a newly isolated oleaginous yeast, Rhodosporidium toruloides DMKU3-TK16. Kasetsart J. 2010, 44, 436–445. [Google Scholar]
  36. Bligh, E.G.; Dyer, W.J. A rapid method of total lipid extraction and purification. Can. J. Biochem. Physiol. 1959, 37, 911–917. [Google Scholar] [CrossRef] [Green Version]
  37. Holub, B.J.; Skeaff, C.M. Nutritional regulation of cellular phosphatidylinositol. In Methods in Enzymology; Academic Press: Chambridge, MA, USA, 1987; Volume 141, pp. 234–244. [Google Scholar]
  38. Miller, G.L. Use of dinitrosalicylic acid reagent for determination of reducing sugar. Anal. Chem. 1959, 31, 426–428. [Google Scholar] [CrossRef]
  39. Sushma, C.; Anand, A.P.; Veeranki, V.D. Enhanced production of glutaminase free L-asparaginase II by Bacillus subtilis WB800N through media optimization. Korean J. Chem. Eng. 2017, 34, 2901–2915. [Google Scholar] [CrossRef]
  40. Dai, C.-c.; Tao, J.; Xie, F.; Dai, Y.-j.; Zhao, M. Biodiesel generation from oleaginous yeast Rhodotorula glutinis with xylose assimilating capacity. Afr. J. Biotechnol. 2007, 6, 2130–2134. [Google Scholar]
  41. Huang, C.; Chen, X.-f.; Xiong, L.; Yang, X.-y.; Chen, X.-d.; Ma, L.-l.; Chen, Y. Microbial oil production from corncob acid hydrolysate by oleaginous yeast Trichosporon coremiiforme. Biomass Bioenergy 2013, 49, 273–278. [Google Scholar] [CrossRef]
  42. Kolouchová, I.; Maťátková, O.; Sigler, K.; Masák, J.; Řezanka, T. Lipid accumulation by oleaginous and non-oleaginous yeast strains in nitrogen and phosphate limitation. Folia Microbiol. 2016, 61, 431–438. [Google Scholar] [CrossRef]
  43. Bandhu, S.; Dasgupta, D.; Akhter, J.; Kanaujia, P.; Suman, S.K.; Agrawal, D.; Kaul, S.; Adhikari, D.K.; Ghosh, D. Statistical design and optimization of single cell oil production from sugarcane bagasse hydrolysate by an oleaginous yeast Rhodotorula sp. IIP-33 using response surface methodology. SpringerPlus 2014, 3, 691. [Google Scholar] [CrossRef] [Green Version]
  44. Li, Y.; Zhao, Z.; Bai, F. High-density cultivation of oleaginous yeast Rhodosporidium toruloides Y4 in fed-batch culture. Enzyme Microb. Technol. 2007, 41, 312–317. [Google Scholar] [CrossRef]
  45. Trumbly, R.J. Glucose repression in the yeast Saccharomyces cerevisiae. Mol. Microbiol. 1992, 6, 15–21. [Google Scholar] [CrossRef] [PubMed]
  46. Papanikolaou, S.; Aggelis, G. Lipids of oleaginous yeasts. Part I: Biochemistry of single cell oil production. Eur. J. Lipid Sci. Technol. 2011, 113, 1031–1051. [Google Scholar] [CrossRef]
  47. Prabhu, A.A.; Gadela, R.; Bharali, B.; Deshavath, N.N.; Dasu, V.V. Development of high biomass and lipid yielding medium for newly isolated Rhodotorula mucilaginosa. Fuel 2019, 239, 874–885. [Google Scholar] [CrossRef]
  48. Fakas, S.; Makri, A.; Bellou, S.; Aggelis, G. Pathways to aerobic glycerol catabolism and their regulation. In Microbial Conversions of Raw Glycerol; Aggelis, G., Ed.; Nova Science Publishers Inc: New York, NY, USA, 2009; pp. 9–18. [Google Scholar]
  49. Capusoni, C.; Rodighiero, V.; Cucchetti, D.; Galafassi, S.; Bianchi, D.; Franzosi, G.; Compagno, C. Characterization of lipid accumulation and lipidome analysis in the oleaginous yeasts Rhodosporidium azoricum and Trichosporon oleaginosus. Bioresour. Technol. 2017, 238, 281–289. [Google Scholar] [CrossRef]
  50. Christophe, G.; Deo, J.L.; Kumar, V.; Nouaille, R.; Fontanille, P.; Larroche, C. Production of oils from acetic acid by the oleaginous yeast Cryptococcus curvatus. Appl. Biochem. Biotechnol. 2012, 167, 1270–1279. [Google Scholar] [CrossRef]
  51. Saenge, C.; Cheirsilp, B.; Suksaroge, T.T.; Bourtoom, T. Potential use of oleaginous red yeast Rhodotorula glutinis for the bioconversion of crude glycerol from biodiesel plant to lipids and carotenoids. Process Biochem. 2011, 46, 210–218. [Google Scholar] [CrossRef]
  52. Huang, X.-F.; Liu, J.-N.; Lu, L.-J.; Peng, K.-M.; Yang, G.-X.; Liu, J. Culture strategies for lipid production using acetic acid as sole carbon source by Rhodosporidium toruloides. Bioresour. Technol. 2016, 206, 141–149. [Google Scholar] [CrossRef]
  53. Fei, Q.; O’Brien, M.; Nelson, R.; Chen, X.; Lowell, A.; Dowe, N. Enhanced lipid production by Rhodosporidium toruloides using different fed-batch feeding strategies with lignocellulosic hydrolysate as the sole carbon source. Biotechnol. Biofuels 2016, 9, 130. [Google Scholar] [CrossRef] [Green Version]
  54. Awad, D.; Bohnen, F.; Mehlmer, N.; Brueck, T. Multi-factorial-guided media optimization for enhanced biomass and lipid formation by the oleaginous yeast Cutaneotrichosporon oleaginosus. Front. Bioeng. Biotechnol. 2019, 7, 54. [Google Scholar] [CrossRef] [Green Version]
  55. Giakoumis, E.G. Analysis of 22 vegetable oils’ physico-chemical properties and fatty acid composition on a statistical basis, and correlation with the degree of unsaturation. Renew. Energy 2018, 126, 403–419. [Google Scholar] [CrossRef]
Figure 1. Cell mass (), lipid content () and lipid concentration () by R. fluvialis DMKU-SP314 cultivated in a STH medium in various additional nitrogen compounds (A) at the end of the first stage (120 h) and (B) at the end of the second stage (240 h) in 70 g/L of CG solution with a pH of 5.5 while incubated at 150 rpm and 28 °C throughout the cultivation. Data are presented as mean value ± standard deviation. The different, same and overlapping lower-case letters mean significantly different, no-significantly different, and on-significantly different of their overlapping according to Duncan’s multiple range test at p ≤ 0.05.
Microorganisms 08 00453 g001
Figure 2. Time-course of cell mass (), lipid content () and lipid concentration () of R. fluvialis DMKU-SP314 cultivated in a STH medium consisting of 70 g/L TRS, 2.58 g/L SBP, 0.94 g/L (NH4)2SO4, 0.39 g/L KH2PO4, 2.5 g/L MgSO4 7H2O, with an initial pH of 6, a temperature of 28 °C and a shaking speed of 200 rpm in the first stage. In the second stage, the cells were re-suspended in 70 g/L of a CG solution with a pH of 5.5 and incubated at 150 rpm and 28 °C at different shift times (A) 48 h (B) 72 h (C) 96 h and (D) 120 h. Data are presented as mean value ± standard deviation.
Microorganisms 08 00453 g002
Figure 3. The effect of temperature on (A) cell mass production (g/L) when cultivated in a STH medium supplemented with SBP at 120 h in a temperature gradient incubator (15.0–35.5 °C). The effect of temperature on (B) lipid concentration (g/L) when cultivated in a CG solution for 196 h (after cultivation in the first stage for 48 h) in a temperature gradient incubator (17.0–37.8 °C). Data were presented as mean value ± standard deviation.
Microorganisms 08 00453 g003
Table 1. Statistical analysis of factors using Plackett–Burman Design.
SourceCell MassLipid Concentration Lipid Content
T-Valuep-ValueT-Valuep-ValueT-Valuep-Value
X11.81510.16712.04910.13291.84850.1617
X21.32600.27672.20910.11422.35410.0999
X32.77220.0694−1.08010.3592−4.38450.0220
X4−2.69630.0740−2.60910.0797−2.67700.0752
X5−0.16230.8814−0.97340.4021−1.46970.2380
X6−0.90860.43050.33340.76080.61940.5795
X7−2.66260.0762−1.44460.2443−0.69700.5359
X84.36600.02224.18260.02493.93070.0293
X1 = TRS, X2 = Soybean powder, X3 = (NH4)2SO4, X4 = KH2PO4, X5 = MgSO4 7H2O, X6 = Initial pH, X7 = Temperature and X8 = Shaking speed. R2 = 0.9400 for cell mass, R2 = 0.9263 for lipid concentration, R2 = 0.9472 for lipid content.
Table 2. Analysis of variance for the quadratic response surface model on first-stage cultivation process.
SourceSSDFMSCell Mass
F-Valuep-Value
Model116.85912.9869.42<0.0001
X159.34159.34317.30<0.0001
X20.1710.170.930.3677
X315.71115.7184.00<0.0001
X1X20.0010.000.010.9112
X1X311.79111.7963.03<0.0001
X2X30.0110.010.050.8334
X1229.15129.15155.85<0.0001
X220.0310.030.130.7249
X320.2710.271.440.2684
Lack of Fit0.9030.302.920.1636
R2 0.9889
Adjust R2 0.9747
SS = sum of squares, DF = degree of freedom, MS = mean square, 95% significant level. X1 = (NH4)2SO4 (g/L), X2 = KH2PO4 (g/L) and X3 = Shaking speed (rpm).
Table 3. Total reducing sugar consumption, cell mass, lipid concentration, and lipid content by R. fluvialis DMKU-SP314 at 48 h of first-stage cultivation.
TRS (g/L)TRSC (% of Initial TRS)Cell Mass (g/L)Lipid Concentration (g/L)Lipid Content (% of Dry Cell Mass)
43.1869.54 a10.61 ± 0.22 a0.65 ± 0.09 b5.66 ± 0.71 c
52.2154.22 b10.54 ± 0.16 a0.76 ± 0.08 a7.21 ± 0.82 b
62.8745.55 ab10.46 ± 0.13 a0.81 ± 0.08 a7.70 ± 0.69 ab
72.2639.05 b9.94 ± 0.22 b0.85 ± 0.05 a8.58 ± 0.65 a
80.4034.21 b9.93 ± 0.28 b0.87 ± 0.02 a8.70 ± 0.40 a
a TRS = initial total reducing sugar concentration (g/L). b TRSC = Percentage of total reducing sugar consumption (% of initial TRS). c Data followed by difference letters show significant difference according to Duncan’s Multiple Range Test (p < 0.05).
Table 4. Analysis of variance for the quadratic response surface model in the second stage cultivation process.
SourceDFCell Mass Production (Y1)Lipid Concentration (Y2)Lipid Content (Y3)
F-Valuep-ValueF-Valuep-ValueF-Valuep-Value
Model98.440.015114.660.000610.980.0084
X1127.080.00350.710.424013.140.0151
X211.450.28170.150.70710.240.6480
X310.600.4740.760.40980.080.7876
X1 X213.680.11330.220.64821.390.2920
X1 X314.960.076517.230.00324.500.0873
X2 X310.00570.942868.91<0.000152.490.0008
X1218.960.0303--1.280.3097
X2210.180.6907--1.340.2985
X32126.600.0036--23.940.0045
Lack of Fit32.720.28060.910.60794.850.1758
R2 0.93830.91670.9519
Adjust R2 0.82720.85410.8652
DF = degree of freedom, 95% significant level. X1 = CG concentration (g/L), X2 = initial pH, X3 = Shaking speed (rpm).
Table 5. Total reducing sugars consumption, glycerol consumption, cell mass yield, and lipid yield by R. fluvialis DMKU-SP314.
Stage (Cultivation Time)TRSC (% of Initial TRS)CGC (% of Initial CG)Cell Mass (g/L)Lipid Concentration (g/L)Yx (g/g)YL (g/g)
1st stage (48 h)69.54-10.61 ± 0.220.65 ± 0.090.350.02
2nd stage (192 h)-76.4311.09 ± 0.2315.20 ± 0.540.170.23
TRSC = Percentage of total reducing sugar consumption (g/L), CGC = Percentage of crude glycerol consumption (g/L).
Table 6. Comparative study of lipid productivity by oleaginous yeasts cultivated in various substrates using two-stage cultivation.
YeastCarbon SourcesCell Mass (g/L)Lipid Concentration (g/L)Lipid Content (% of Dry Cell Mass)Lipid Productivity (g/L/h)Culture Mode (Volume)References
Rhodosporidiobolus fluvialis
DMKU-SP314
sugarcane top hydrolysate and crude glycerol21.715.873.00.066Two-stage batch flasks (100 mL)This study
Rhodosporidiobolus fluvialis
DMKU-SP314
sugarcane top hydrolysate and crude glycerol38.523.661.90.098Two-stage fed-batch bioreactor (3 L)[21]
Cryptococcus curvatus
ATCC 20509
crude glycerol32.917.453.00.060Two-stage fed-batch bioreactor (1.5 L)[31]
Cryptococcus curvatus
MUCL 29819
glucose and acetate4.01.047.30.011Two-stage batch flasks (250 mL)[50]
Rhodosporidiobolus fluvialis
DMKU-RK253
crude glycerol22.416.070.00.074Two-stage batch flasks (100 mL)[23]
Rhodotorula glutinis
TISTR 5159
palm oil mill effluent8.84.651.90.064Two-stage semi-continuous bioreactor (1 L)[51]
Rhodosporidium toruloides
AS 2.1389
glucose and acetate6.82.150.10.011Two-stage batch flasks (50 mL)[52]
Rhodosporidium toruloides
Y4
glucose and glycerol20.38.642.50.051Two-stage batch flasks (50 mL)[34]
Trichosporonoides spathulata
JU4–57
crude glycerol13.87.856.40.065Two-stage fed-batch bioreactor (2 L)[33]
Yarrowia lipolytica
TISTR 5151
serum latex and glycerol7–83.444.50.024Two-stage batch flasks (50 mL)[32]
Table 7. The fatty acids composition (%) produced by R. fluvialis DMKU-SP314 when grown on STH and its comparison with other plant oils.
SourceC14:0C16:0C18:0C18:1C18:2C18:3
Rhodosporidiobolus fluvialis DMKU-SP3141.731.05.436.720.74.4
Canola-4.52.060.421.29.4
Castor-1.41.13.44.80.6
Olive0.111.32.874.59.80.5
Palm1.142.34.340.910.10.3
Peanut-10.32.849.631.50.6
Rapeseed-4.11.562.320.68.7
Soybean0.111.54.123.553.36.8
Sunflower-6.43.920.967.60.2
C14:0; myristic acid, C16:0; palmitic acid, C18:0; stearic acid, C18:1; oleic acid, C18:2; linoleic acid and C18:3; α-linolenic acid.

