Article

Transcriptomic and Phenotypic Analyses of the Sigma B-Dependent Characteristics and the Synergism between Sigma B and Sigma L in Listeria monocytogenes EGD-e

1
Department of Food Hygiene and Environmental Health, Faculty of Veterinary Medicine, University of Helsinki, P.O. Box 66, 00014 Helsinki, Finland
2
Institute for Food Safety and Hygiene, Vetsuisse Faculty, University of Zurich, Winterthurerstr. 272, CH-8057 Zurich, Switzerland
*
Author to whom correspondence should be addressed.
Microorganisms 2020, 8(11), 1644; https://doi.org/10.3390/microorganisms8111644
Submission received: 28 September 2020 / Revised: 20 October 2020 / Accepted: 21 October 2020 / Published: 23 October 2020
(This article belongs to the Special Issue Microbial Stress Response in Food-Related Environments)

Abstract

:
Numerous gene expression and stress adaptation responses in L. monocytogenes are regulated through alternative sigma factors σB and σL. Stress response phenotypes and transcriptomes were compared between L. monocytogenes EGD-e and its ΔsigB and ΔsigBL mutants. Targeted growth phenotypic analysis revealed that the ΔsigB and ΔsigBL mutants are impaired during growth under cold and organic-acid stress conditions. Phenotypic microarrays revealed increased sensitivity in both mutants to various antimicrobial compounds. Genes de-regulated in these two mutants were identified by genome-wide transcriptome analysis during exponential growth in BHI. The ΔsigB and ΔsigBL strains repressed 198 and 254 genes, respectively, compared to the parent EGD-e strain at 3 °C, whereas 86 and 139 genes, respectively, were repressed in these mutants during growth at 37 °C. Genes repressed in these mutants are involved in various cellular functions including transcription regulation, energy metabolism and nutrient transport functions, and viral-associated processes. Exposure to cold stress induced a significant increase in σB and σL co-dependent genes of L. monocytogenes EGD-e since most (62%) of the down-regulated genes uncovered at 3 °C were detected in the ΔsigBL double-deletion mutant but not in ΔsigB or ΔsigL single-deletion mutants. Overall, the current study provides an expanded insight into σB and σL phenotypic roles and functional interactions in L. monocytogenes. Besides previously known σB- and σL-dependent genes, the transcriptomes defined in ΔsigB and ΔsigBL mutants reveal several new genes that are positively regulated by σB alone, as well as those co-regulated through σB- and σL-dependent mechanisms during L. monocytogenes growth under optimal and cold-stress temperature conditions.

1. Introduction

The Gram-positive, facultatively intracellular food-borne pathogen Listeria monocytogenes is the causative agent of serious food-borne illness, listeriosis. L. monocytogenes can survive and proliferate at refrigeration temperatures and also under alkaline, acid, and osmotic stresses [1,2,3]. Since L. monocytogenes is widespread in the environment and can be found in soil, water, and decaying vegetation, it can easily access raw materials used by the food industry causing a significant microbial control challenge in food-processing facilities [4,5,6,7,8,9,10,11].
Food-borne pathogens need to possess various types of strategies at the molecular level to tolerate different environmental conditions in foods and also inside the host. Transcriptional regulation of genes essential for growth under stress conditions that the bacteria have encountered, is among the most central mechanisms. Bacteria can regulate the transcription of genes through alternative sigma factors which control the function and promoter selectivity of bacterial RNA polymerase. L. monocytogenes has four known alternative sigma factors: σB, σC, σH, and σL. The primary sigma factor σD is involved in housekeeping gene expression control. In L. monocytogenes, sigma-70 family comprises σB, σC, σD, and σH, while σL is the only member in the sigma-54 family [12]. σB is the most extensively characterized sigma factor and is regarded as the major stress response regulator of L. monocytogenes, while in many other pathogenic bacteria, σL (rpoN) is considered central to regulation of the bacterial cell exterior [13].
The general stress responsive σB has been shown to play a role in adaptation to diverse stress conditions and in virulence responses of L. monocytogenes. Previous studies have illustrated σB to be part of response mechanisms involved in tolerance of osmotic, acid, alkaline, oxidative, extreme temperature, and bile salt stresses [14,15,16,17,18,19,20,21]. σB contributes to virulence by co-regulating genes that are critical for L. monocytogenes entry into host cells with the positive regulatory factor A protein (PrfA) [22,23,24]. Studies that have explored σB-mediated gene expression and protein production in L. monocytogenes in different environmental conditions have shown that this alternative sigma factor has a large and diverse regulon [17,18,25,26,27,28,29,30,31,32]. Although a great number of genome-wide expression analysis studies have been made using L. monocytogenes sigB null mutant, a whole genome transcription analysis of L. monocytogenes sigB null mutant at low growth temperature has not been reported to date.
σL has not been as extensively characterized as σB in L. monocytogenes, although it has been shown to be involved in L. monocytogenes salt, acid, ethanol, and low temperature stress tolerance [33,34,35,36]. Liu et al. [37] were the first to detect elevated rpoN transcript levels in bacteria grown at 10 °C compared with 37 °C, whereas Arous et al. [38] were the first to study the σL regulon using a global gene-expression analysis and a rpoN mutant of L. monocytogenes. Genes regulated by σL at different growth temperatures were further studied in our previous work [36]. Genome-wide expression analysis revealed 237 and 203 genes as positively regulated by σL at 3 and 37 °C, respectively.
Previous studies [28,29] proposed considerable overlap between σB and σL regulons. Nevertheless, both of the studies were conducted at 37 °C. Consequently, the possible regulon overlaps between σB and σL at low growth temperature still remain undescribed.
In this study, we employed DNA-microarray based whole-genome expression analysis to investigate the role of σB in the growth of L. monocytogenes at 3 and 37 °C and identified the components of the σB regulon that participate in cold stress tolerance of L. monocytogenes. We also identified differentially expressed genes at 3 and 37 °C in L. monocytogenes EGD-e wild-type strain and its ΔsigBL mutant. Furthermore, we evaluated the possible regulon overlaps and synergism between σB and σL at low growth temperature using deletion mutant strains ΔsigB and ΔsigBL. Phenotypic microarrays, growth-curve analysis under different stress conditions, motility assays, and electron microscopy were used for the phenotypic characterization of the wild-type strain and its null mutants at 3 and 37 °C.

2. Materials and Methods

2.1. Bacterial Strains and Growth Conditions

Bacterial strains used in this study are listed in Table S1. Strains were grown on blood agar plates (bioTRADING, Mijdrecht, The Netherlands; Difco Laboratories, Detroit, MI, USA), in brain heart infusion (BHI) broth (Difco Laboratories) or defined minimal medium (DM) [39]. Growth media for testing the stress tolerance of the strains were generated as previously described [36]. Briefly, acid stress was generated by supplementation of 2.5% of lactic acid, 0.35% of acetic acid, or 0.35% of citric acid to normal BHI, and adjusting pH values to 6.0, 5.5, and 5.5, respectively [40]. Ethanol stress was generated by addition of 100% ethanol to a final concentration of 5% (v/v) into DM. Inocula were prepared from frozen stocks by streaking the strains onto blood agar and incubating plates overnight at 37 °C. Single colonies were inoculated into 10 mL BHI broth and grown to stationary growth phase (approximately 109 CFU/mL) by incubating the tubes for 16 h at 37 °C with shaking (150 rpm). The bacterial cultures were then used to inoculate either normal or modified BHI or DM broths at approximately 103 CFU/mL, and the cultures were incubated at 3 or 4 °C without agitation or at 37 °C with shaking at 150 rpm. Growth of the strains was monitored by viable cell counts as previously described [41]. Four independent experiments and two replicates per experiment were conducted. Lag phases and growth rates were calculated using the DMFit program (version 2.1, Institute of Food Research, Reading, UK) [42]. The statistical significance of differences between the mutant strains and the wild-type strain in growth parameters were calculated using a Student’s t-test where p-values < 0.05 were considered significant. Global phenotypic analysis of the strains was performed using BIOLOG phenotypic microarrays (PMs) [43] according to the manufacturer’s protocol.

2.2. Motility Assays and Electron Microscopy

Swarming motility was determined by transferring 5 µL of an overnight culture of each strain onto the surface of trypticase soy broth (Difco Laboratories) solidified with 0.25% agar [44]. The plates were incubated at 3 and 37 °C for 6 weeks and 24 h, respectively.
The presence of flagella was examined using a Tecnai 12 transmission electron microscope (Philips Electron Optics, Eindhoven, The Netherlands) on BHI cultures grown to mid-logarithmic growth phase at 3 and 37 °C. Cells from 1 ml of each culture were fixed with 5% glutaraldehyde (Sigma-Aldrich, St. Louis, MO, USA), incubated at room temperature for 2 h and washed with 1 ml autoclaved water. The cells were then prepared on carbon-coated grids and negatively stained with 1% phosphotungstic acid hydrate (Sigma-Aldrich).

2.3. DNA Manipulation and Construction of the ΔsigB and ΔsigBL Strains

The ΔsigB and ΔsigBL mutants were constructed in this study based on previously described protocols [35,45]. Briefly, in-frame deleted copies of sigB and sigL genes were constructed using the splicing-by-overlap extension (SOE) PCR method [46] and primers listed in Table S1, and cloned into the temperature sensitive pKSV7 plasmid [47]. The pKSV7ΔsigB and pKSV7ΔsigL constructs were subsequently used in homologous-recombination-based replacement of the chromosomal copies of sigB and sigL genes, respectively, in the EGD-e and EGD-eΔsigL strains using previously described experimental protocols [45]. Deletion mutants were confirmed through PCR amplification and subsequent sequencing of the targeted EGD-e DNA regions.

2.4. RNA Isolation and Gene-Expression Analysis

RNA isolation and gene-expression analysis using DNA microarrays and reverse transcription real-time PCR (RT-qPCR) were performed as previously described [36]. Primers used for gene expression by qRT-PCR are listed in Table S1. The differentially expressed genes in microarrays were defined as those with a ≥ 2.5-fold change in expression and a moderated t-test statistical significance of p ≤ 0.01. These genes were divided into functional categories based on annotations provided through the Comprehensive Microbial Resource of the J. Craig Venter Institute (Rockville, MD, USA) (http://cmr.jcvi.org). The microarray data described in this study were deposited in NCBI’s Gene Expression Omnibus (GEO accession number GSE32434) [48].

3. Results

3.1. Phenotypic Characterization of ΔsigB and ΔsigBL

We previously showed that the ΔsigL mutant impaired cold, salt, and organic acid stress growth phenotypes [36]. Growth phenotypes between ΔsigB and ΔsigBL mutants and their parental strain were compared (see Table 1). Both mutants were diminished during cold growth in DM but not in BHI compared to the EGD-e WT parent strain. In DM at 4 °C, the ΔsigB mutant displayed a prolonged lag phase. The ΔsigBL mutant displayed an even more prolonged lag phase as well as a slower growth rate compared to the parent strain under cold stress (Table 1 and Figure S1). The ΔsigB and ΔsigBL mutants were also altered in growth under different types of organic-acid stress. In the presence of lactic-acid stress, both ΔsigB and ΔsigBL grew with a lag phase delay compared to the parent strain (Table 1 and Figure S1). The prolonged lag phase in ΔsigBL was also accompanied by a slower growth rate compared to the parent strain under lactic-acid stress in BHI at 4 °C. Assessing growth under acetic-acid stress revealed that the ΔsigB mutant had a prolonged lag phase compared to the parent strain, whereas the ΔsigBL mutant completely failed to grow. Although the ΔsigB mutant had similar growth to the parent strain, the ΔsigBL mutant was unable to grow under citric-acid stress in BHI at 4 °C. Moreover, both mutants were characterized by longer lag phases and slower growth rates than the parent EGD-e WT strain when exposed to ethanol stress (5%) in DM at 37 °C (Table 1 and Figure S1).
On PMs, we previously showed diminished growth of the ΔsigL mutant on N-acetyl-D-Glucosamine as carbon sources, as well as under low pH (pH 5.0) and osmotic stress conditions [32]. The ΔsigB mutant displayed no phenotypic growth differences on carbon source utilization PMs (PM01 and PM02), whereas the ΔsigBL mutant had diminished growth compared to the parent strain on N-Acetyl-D-Glucosamine (PM01) and 3-0-b-D-Galactopyranosyl-D-Arabinose (PM02). Even though osmotic and acid stress tolerance are known to be sigB-dependent traits in L. monocytogenes, there were no phenotypic growth defects detected between the ΔsigB and WT strains under conditions of the osmotic or low pH stress sensitivity PMs (PM09–PM10) applied. The ΔsigBL mutant, on the other hand, displayed increased sensitivity compared to the parental strain under such osmotic and low pH stress conditions. Apart from that, both ΔsigB and ΔsigBL mutants displayed increased sensitivity to various chemical compounds when compared to the parental EGD-e strain on chemical sensitivity PMs (PM11–20). The ΔsigB strain exhibited increased sensitivity to seven chemical compounds (Table S2), whereas the ΔsigBL strains showed increased sensitivity to several compounds including those targeting cell-wall and protein synthesis, respiration, and DNA and RNA metabolism (Table S3). Notably, there were several additional chemical sensitivity phenotypes detected in the ∆sigBL mutant that were undetected in ΔsigB or ΔsigL single deletion mutants (Table S4).
The swarming motilities of the ΔsigB and ΔsigBL mutants and the parent strain were determined on semisolid swarming agar and compared to those of the ΔsigL mutant. In contrast to the sigL null mutant, which was non-motile, both sigB and sigBL null mutants displayed similar zones of swarming motility to the parental EGD-e strain during incubation on soft agar surface at 3 °C. At 37 °C, the wild-type EGD-e strain and both mutant strains were non-motile. Further electron microscopic examination of these strains revealed that the parent strain and the ΔsigB and ΔsigBL mutants are flagellated, whereas the ΔsigL strain in contrast was non-flagellated in cold growth at 3 °C. Although flagellation patterns in ΔsigB and the parent EGD-e strain were similar, the amount of flagella per cell observed in the ΔsigBL strain was lower. At 37 °C, none of the strains formed flagella (Figure S2).

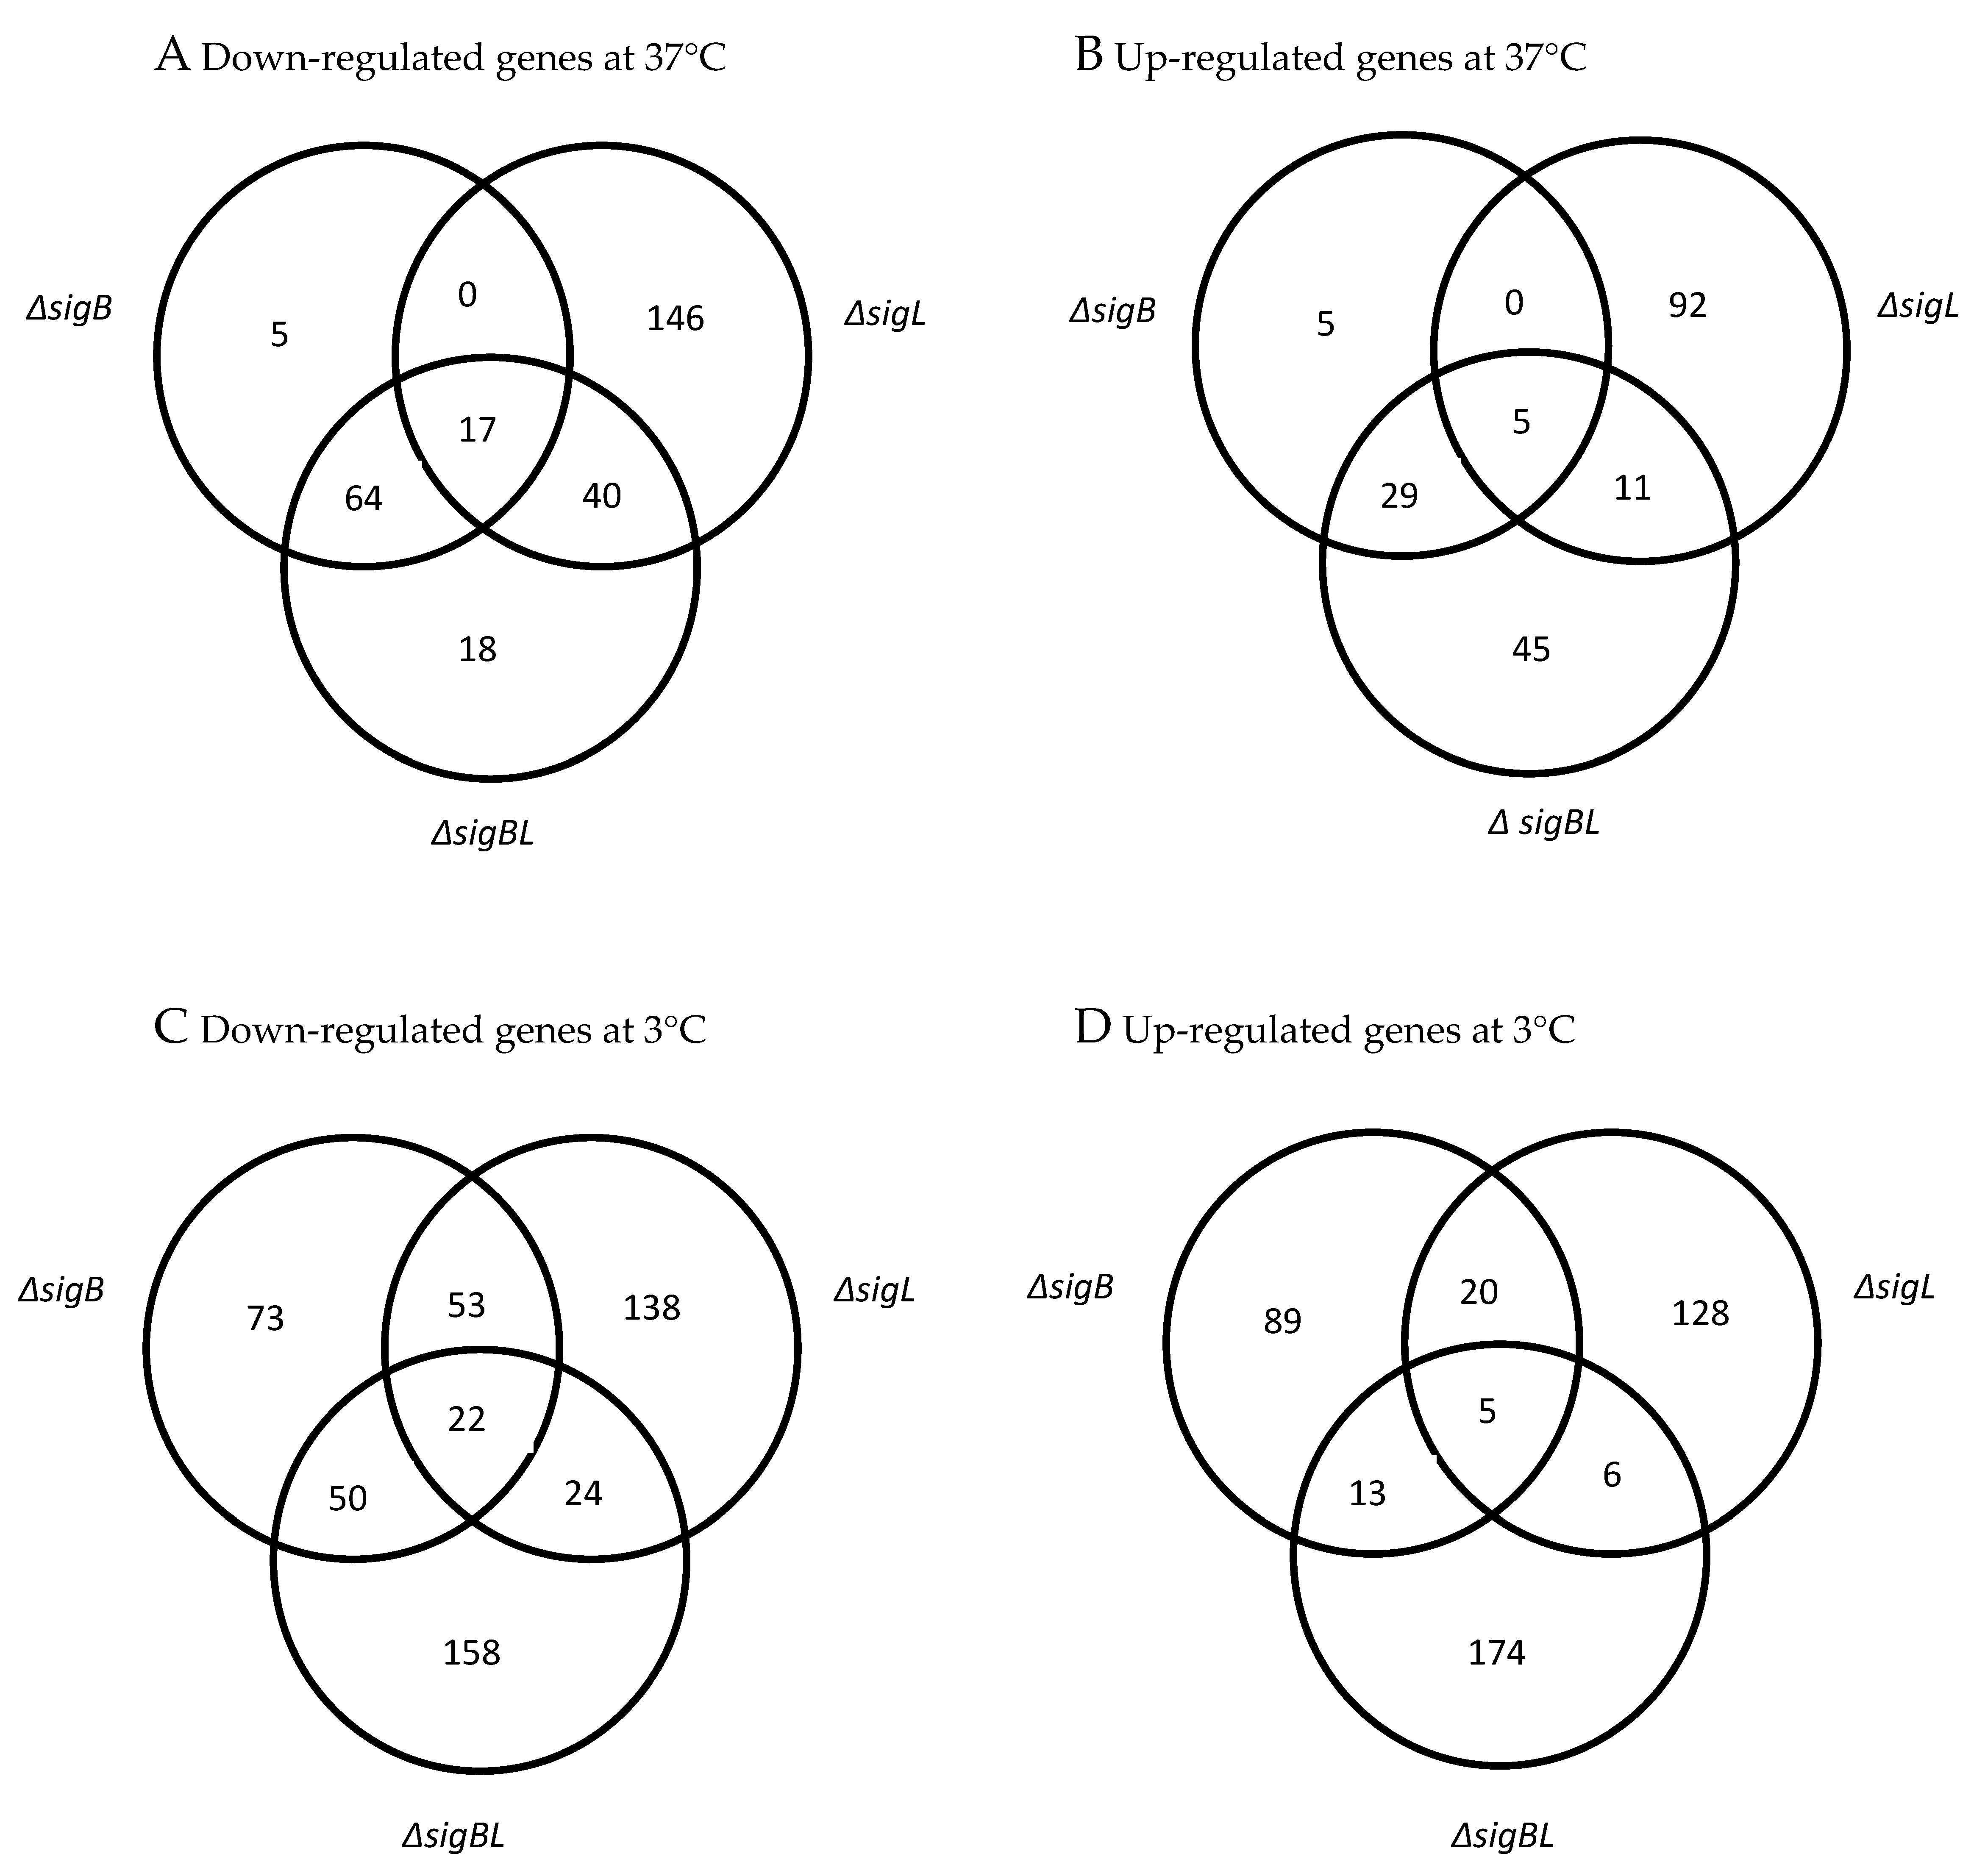
3.2. Identification of Genes de-Regulated in ΔsigB and ΔsigBL Mutants

Genome-wide microarrays were used to determine genes whose transcripts are de-regulated in ΔsigB and ΔsigBL mutants during exponential growth in BHI under cold (3 °C) and optimized (37 °C) temperature conditions. Based on an assigned p-value of ≤ 0.01 and 2.5-fold cutoff, 787 genes were considered differentially expressed in these two mutants compared to the parental strain (Figure 1). Of these differentially expressed genes, those deregulated in the ΔsigB mutant comprised 325 (127 up- and 198 down-regulated) at 3 °C and 125 (39 up- and 86 down-regulated) at 37 °C. Those deregulated in ΔsigBL compared to the parental EGD-e strain included 452 (198 up- and 254 down-regulated) at 3 °C, and 229 (90 up- and 139 down-regulated) at 37 °C. The transcriptome microarray data were validated on a selection of genes (lmo0096, lmo0137, lmo0685, and lmo2625) using quantitative real-time reverse-transcription PCR (RT-qPCR). The expression levels of this gene selection in the microarray data were in line with the results obtained with RT-qPCR (Table 2). The current study focuses on the set of those genes that were found down-regulated in ΔsigB and ΔsigBL mutant strains. This group comprises 284 (198 at 3 °C and 86 genes at 37 °C) genes identified in ΔsigB and 393 (254 at 3 °C and 139 at 37 °C) genes identified in ΔsigBL. Genes in this set with known functions were assigned biological functional categories showing that loss of σB and σL functions is associated with decreased transcription of genes that are involved in various cellular functions (Figure 2 and Tables S5–S8).

3.3. Genes Down-Regulated in ∆sigB During Exponential Growth in BHI at 3 °C

Altogether, 198 genes were down-regulated in the ∆sigB mutant during exponential cold growth including 80 (40.4%) hypothetical and 118 (59.6%) functionally classified genes. The majority of these genes are involved in transcription regulation (12%), cellular processes (11%), energy metabolism (9%), and viral-associated functions (6%). The viral functions (52%), cellular processes (15%), regulatory functions (11%), and energy metabolism (8%) were categories with the largest percentage of down-regulated genes (Figure 2).
Genes showing the largest down-regulation during exponential cold growth in the ∆sigB mutant were lmo2158 and lmo0433, which code for a conserved domain protein and internalin A, respectively. Meanwhile, there were 22 EGD-e polycistronic operons that had all their genes down-regulated in ∆sigB during exponential cold growth [49]. These include: operons 123 and 124 comprising lmo0781–lmo0784 genes, which encode a mannose-specific phosphotransferase system (PTS), and operons 168 and 169 comprising lmo1041–lmo1048 genes, which are predicted to code for molybdenum transport and molybdenum and molybdopterin biosynthesis proteins. Other genes also found among those down-regulated in this mutant include lmo1172–lmo1173, and lmo2582–lmo2583, which code for bacterial two-component signaling system proteins. Furthermore, operon 415, consisting of 15 bacteriophage A118-associated protein encoding genes lmo2278–lmo2301, had 13 genes that were down-regulated during cold growth in the sigB null mutant.

3.4. Genes Down-Regulated in ∆sigB During Exponential Growth in BHI at 37 °C

There were 86 genes down-regulated in ∆sigB relative to the parental strain during exponential growth at 37 °C. Of these genes, 50 (58.1%) encode functionally classified proteins, whereas 36 (41.9%) encode hypothetical proteins (Table S6). Genes from the categories of transport and binding (12%), cellular processes (9%), energy metabolism (9%) and amino acid biosynthesis (7%) predominated. The biological function categories of cellular processes (5%), amino acid biosynthesis (4%), energy metabolism (4%), protein fate (4%), and transport and binding proteins (4%) had relatively the largest percentages of genes in this set (Figure 2).
In 10 of the EGD-e polycistronic operons, all genes were repressed in the ∆sigB mutant including operons 016, consisting of genes lmo0096–lmo0098, 123, and 124; consisting of genes lmo0781–lmo0784 that code fructose and mannose specific PTS systems; and operon 022 consists of genes lmo0135–lmo0137, which encodes ABC transport-system proteins. Operon 461 that comprises genes lmo2570–lmo2573, which is predicted to encode proteins that are part of the nicotinate and nicotinamide metabolism pathway, was also down-regulated. Genes lmo0263 and lmo2158, which code for internalin H and a conserved domain protein, respectively, were the most down-regulated in this set.
There were 29 genes subjected to positive σB transcriptional regulation during EGD-e exponential growth in BHI at 3 and 37 °C that were unveiled in the current study. These genes include those coding for PTS components, internalin H, universal stress, and pyruvate metabolism proteins (Table 3).

3.5. Genes Down−Regulated in ∆sigBL during Exponential Growth in BHI at 3 °C

There were 254 down−regulated genes detected in ∆sigBL during exponential cold growth (Table S7). Eighty (31.5%) such genes encode hypothetical proteins, whereas 174 (68.5%) encode proteins with confirmed or predicted functions, the majority of which belong to transport and binding proteins (13%), protein synthesis (13%), energy metabolism (8%), and cellular processes (7%) categories. Protein synthesis (28%), purines, pyrimidines, nucleosides and nucleotides (18%), fatty acid and phospholipid metabolism (14%), cellular processes (13%), and transport and binding proteins (13%) were the categories with the largest percentages of down−regulated genes found in this group (Figure 2).
In 20 EGD−e polycistronic operons, all genes were down−regulated in the ∆sigBL mutant during exponential cold growth. These included operons 022 comprising lmo0135–lmo0137, 305 comprising lmo1738–lmo1740, and 326 consisting of genes lmo1847–lmo1849, all encoding ABC transport−system proteins. Operons 068 comprising lmo0398–lmo0402 genes, and 123 1nd 124 consisting of genes lmo0781–0784 that encode fructose− and mannose−specific PTS system components were also down−regulated. Genes lmo1406–lmo1407 in the down−regulated operon 229 encode for the pyruvate formate−lyase (PflB) and pyruvate formate−lyase activating enzyme (PflC), which are part of the pyruvate metabolism pathway. Genes lmo1538–lmo1539 in down−regulated operon 258 encode glycerol kinase and glycerol uptake facilitator protein needed in glycerolipid metabolism. The lmo1983–lmo1991 genes in down−regulated operon 360 encode ilvD, ilvB, ilvH, ilvC, leuA, leuB, leuC, leuD, and ilvA, which are all part of the pyruvate gene−family. Genes lmo2201–lmo2202 in down−regulated operon 399 encode 3−oxoacyl synthase II and 3−oxoacyl synthase III, which are needed in fatty acid metabolism and biosynthesis. The down−regulated operons 042 (lmo0248–lmo0248), 043 (lmo0250–lmo0251), and 315 (lmo1796–lmo1797) consist of ribosomal protein encoding genes. Overall, 27 of the 57 known ribosomal genes in L. monocytogenes EGD−e genome were down−regulated in ∆sigBL.
The genes showing the largest down−regulation in ∆sigBL compared to the wild−type strain during exponential growth in BHI at 3 °C were lmo1634, which encodes aldehyde−alcohol dehydrogenase and lmo1847, which encodes endocarditis specific antigen.
Genes that were down−regulated during exponential cold growth in ∆sigBL, but not in ∆sigB or ∆sigL [32] single deletion mutants, are shown in Table S9.

3.6. Genes Down−Regulated in ∆sigBL During Exponential Growth in BHI at 37 °C

Altogether 139 genes were down−regulated in ∆sigBL during exponential growth in BHI at 37 °C (Table S8). Of these genes, 43 (30.9%) encode hypothetical proteins and 96 (69.1%) code for proteins with confirmed or predicted functional roles. Most down−regulated genes belonged to protein synthesis (15%), transport and binding proteins (11%), energy metabolism (8%), and cellular processes (8%) functional categories. The largest percentages of down−regulated genes per functional category were detected in protein synthesis (17%), transcription (12%), cellular processes (7%), amino acid biosynthesis (6%), and transport and binding proteins (6%) (Figure 2).
Down−regulated genes included 12 polycistronic operons in which all genes were down−regulated. Besides previously described operons 016, 123, 124, and 022 comprising genes coding PTS and ABC transport−system proteins, other operons among these were 077 consisting of genes lmo0433–lmo0434, internalin A encoding gene inlA, and internalin B encoding inlB. Operon 461, which also had all genes down−regulated, comprises lmo2570–lmo2573 genes that are predicted to play a role in nicotinate and nicotinamide metabolism. Similar to cold growth at 3 °C, 22 of the 57 EGD−e ribosomal genes were down−regulated in ∆sigBL during exponential growth at 37 °C. Genes lmo0098 and lmo0096 encoding PTS−system components were the most down−regulated genes detected in ∆sigBL during exponential growth at 37 °C.
Sixty−three genes were down−regulated during exponential growth of L.monocytogenes ΔsigBL in BHI at both 3 and 37°C. These genes are presented in Table 4. Genes down−regulated in L.monocytogenes ∆sigBL, but not in ∆sigB or ∆sigL [32], during exponential growth in BHI at 37 °C are shown in Table S10.

4. Discussion

Alternative sigma factors are used as transcriptional regulators of various gene−expression responses in bacteria. They are used to regulate various cellular processes needed for survival and growth of bacteria under favorable and non−favorable conditions [50,51,52,53,54]. Since σB and σL are important regulators of stress adaptation responses in L. monocytogenes, we have further investigated their functional contributions to growth under stress conditions and gene expression regulation in L. monocytogenes EGD−e. Phenotypic evaluation of the ∆sigB and ∆sigBL mutants revealed impaired growth in the presence of organic acids and ethanol, as well as altered flagellation at low growth temperatures. In addition, significant differences in growth of the sigB and sigBL null mutant strains compared to the parent strain on different carbon sources and in the presence of various chemical compounds were revealed. A transcriptome comparison between the ∆sigB and ∆sigBL mutants and the parental EGD−e strain during exponential cold (3 °C) and optimal (37 °C) temperature growth established that the expression of many of genes are de−regulated in these mutants.

4.1. Identification of σB Positively Regulated Genes during Exponential Growth in BHI at 3 and 37 °C

The current study identified 284 genes that are positively regulated in a σB−dependent manner during exponential growth of L. monocytogenes EGD−e—198 at 3 °C and 86 at 37 °C. These genes were compared to previously identified σB positively regulated genes. Kazmierczak et al. [14] identified 55 and Raengpradub et al. [17] 168 σB positively regulated genes in L. monocytogenes 10403S cells grown to stationary phase or under salt stress. Thirty three (17 at 3 °C and 16 at 37 °C) genes detected here overlapped with those reported by Kazmierczak et al. [16], whereas 103 (45 at 3 °C and 58 at 37 °C) genes were among those identified by Raengpradub et al. [19]. Ninety−one genes (40 at 3 °C and 51 at 37 °C) detected here were among the 105 genes of the σB regulon described by Hain et al. [50] in EGD−e grown in BHI at 37 °C. Oliver et al. [27] described a σB core regulon that consists of at least 63 genes using lineage I, II, IIIA, and IIIB strains. Out of these, there were 27 and 38 genes that were also detected in our study at 3 and 37 °C, respectively. All 15 σB positively regulated genes, recently identified by combining microarray, proteomics, and RNA−sequencing [30], were also detected in our study.
The mannose−specific phosphotransferase system (PTS) operon (lmo0781–lmo0784) that was shown to be positively regulated by σB at both growth temperatures in this study was among σB−dependent genes described by Kazmierczak et al. [16], Raengpradub et al. [19], and Hain et al. [55]. The lmo2570–lmo2573 genes belonging to the nicotinate and nicotinamide metabolism pathway detected in our study at 37 °C were previously also detected among σB–dependent genes reported by Kazmierczak et al. [16] and Hain et al. [55]. Among other genes, our study found that genes from the fructose− and mannose−specific PTS−encoding operon 016 (lmo0096–lmo0098) are also positively regulated through σB during cold growth at 3 °C, which had not been previously reported from other studies.
Operons 168 and 169, which encode molybdenum transport and molybdenum and molybdopterin biosynthesis proteins, were shown by the current study to be positively regulated through σB during L. monocytogenes cold growth. Transcription from the moa locus that encodes enzymes required for molybdopterin biosynthesis in Escherichia coli is enhanced under anaerobic conditions [56]. Our transcriptome findings suggest that molybdopterin genes in L. monocytogenes may be involved in cold−growth functions, but additional future experiments are needed to examine such a role.
σB−dependent positive control of operon 415 comprising bacteriophage A118 associated protein−encoding genes was detected during cold growth at 3 °C. Similar regulation of these phage genes in a σL−dependent manner was detected in our previous study with the sigL null mutant [36]. Overall, the comparison of our data to previously described σB regulons is limited by differences in the cut−off criteria used to define σB−regulated genes as well as the use of different strains and growth conditions.

4.2. Stress Response Phenotypic Traits Associated with a ∆sigB Mutation in L. Monocytogenes EGD−e

A comparison of growth phenotypes between parental and ∆sigB EGD−e strain revealed that this mutant has compromised growth under lactic−acid, acetic−acid, and ethanol stresses. Our observations here are in agreement with previous studies describing reduced acid−stress tolerance in L. monocytogenes sigB null mutants [15,17,57,58]. Ferreira et al. [57] previously showed that σB is not essential for L. monocytogenes viability under lethal ethanol (16.5%) stress. Our study shows, however, that σB is essential for optimal growth of this bacterium in the presence of sublethal ethanol (5%) stress under restricted nutrient conditions in minimal defined medium.
Although osmotic and acid stress resistance are well established as sigB−dependent traits in L. monocytogenes, we detected no phenotypic defects between ∆sigB and the parental strain on the osmotic or low−pH stress sensitivity arrays in phenotypic microarray analysis. Reasons for these observations are not yet known, but it is possible that there are differences between PM assay conditions and those previously used in other studies, and the conditions in the PM array might have masked the osmotic and acid stress defects in the ∆sigB mutant in the present study.
No differences were detected in flagellation and swarming ability between the ∆sigB mutant and its parent strain during cold growth at 3 °C. Consistent with this, transcriptomic analysis also showed that the ∆sigB mutation does not substantially affect the expression of flagella− and motility−associated genes during cold growth. Hu et al. [59] previously reported similar observations concerning the swarming ability of L. monocytogenes strain 10403S and its ∆sigB mutant grown at room temperature.

4.3. Impact of the ∆sigBL Mutation on the L. Monocytogenes EGD−e Transcriptome

In comparison to the parental strain, at 3 °C, 254 genes were down−regulated and 198 genes were up−regulated in the exponentially growing ΔsigBL strain cultivated in BHI. Comparatively, at 37 °C, this mutant had 139 genes down−regulated and 90 genes up−regulated compared to the parent strain.
Of the 254 genes down−regulated in ΔsigBL at 3 °C, 158 (62%) were not detected under similar conditions in a ∆sigB mutant during this study or the ∆sigL mutant we previously analyzed [36]. On the other hand, 18 (13%) of 139 down−regulated genes were exclusively detected in ΔsigBL at 37 °C. Our observations thus indicate that while cold growth stress expands the specialized expression profile of ΔsigBL, the expression profile of this mutant resembles more those of the ΔsigB and ΔsigL mutants during growth at optimal temperature.
Genes lmo1152–lmo1167 encoded by the putative propanediol utilization (pdu) operon were amongst genes exclusively down−regulated in ΔsigBL during exponential cold growth. Apart from that, the predicted ilv−leu operon 360 coding for IlvD, IlvB, IlvH, IlvC, LeuA, LeuB, LeuC, LeuD, and IlvA, involved in the synthesis of branched−chain amino acids (valine, isoleucine, and leucine), was also exclusively down−regulated in the ΔsigBL background but not in ΔsigB or ΔsigL single deletion mutants at 3 °C. Garmyn et al. [60] previously compared the L. monocytogenes EGD−e transcriptomes at 25 and 37 °C and found that genes in both pdu and ilv−leu operons were up−regulated at 25 °C compared to 37 °C. Recent studies have suggested that the Pdu cluster may support the growth of this pathogen in specific stress conditions along the food chain [61,62]. Tojo et al. [63] reported repression expression from the ilv−leu operon during growth under nitrogen−limited conditions in Bacillus subtilis. Individual or co−regulatory effects of σB and σL in transcription of pdu and ilv−leu operons in L. monocytogenes have not been previously investigated.
Nine of the 12 genes in operon 310 comprising purine ribonucleotide biosynthesis genes purD, purG, purN, purM, purF, purQ, purl, lmo1771, purC, purB, purK, and purE were repressed in ∆sigBL at 3 °C but not at 37 °C or in ΔsigB or ΔsigL. To our knowledge, the link between σB and σL in temperature−dependent regulation of the pur operon in L. monocytogenes has not been described previously.
Other genes we found to be down−regulated at both 3 and 37 °C in the sigBL null mutant background included inlH and inlA, 17 ribosomal genes, operons 123− and 124−encoding proteins belonging in the PTS system, and fructose and mannose metabolic pathway and operon 022 encoding protein parts of the ABC transport system. All these genes are assumed to be down−regulated in a temperature−independent manner in the sigBL null mutant.
Operon 068, encoding PTS−system related and fructose− and mannose−specific genes, was down−regulated in ∆sigBL at 3 °C but not at 37 °C in this study, and it was also recently reported to be co−regulated through multiple transcription factors, including σB and σL [28]. Operon 305, which encodes predicted ABC transport−system proteins, showed a similar temperature−dependent expression profile in both ∆sigL and ∆sigBL mutant strains.
Several ribosomal genes were down−regulated in the ∆sigBL mutant at both growth temperatures while in the ∆sigL mutant these genes were down−regulated only at 37 °C. Several transcripts of bacteriophage A118 associated protein encoding genes were down−regulated in the sigB null mutant at 3 °C and in the sigL null mutant at both growth temperatures. Repression of these genes was lost at both 3 and 37 °C in the sigBL null mutant background.
The number of studies performed to date using L. monocytogenes ∆sigBL mutant strains remains low, and as such, knowledge on the gene expression profile in this alternative sigma factor double−mutant strain is also limited. Palmer et al. [64] studied the contributions of σB and σL to L. monocytogenes response to antimicrobial substance—nisin—and to transcription of putative bacteriocin immunity gene lmo2570. The gene lmo2570 was found to be regulated by σB but not by σL. In line with these observations, our studies found that the gene lmo2570 was down−regulated in ∆sigB and ∆sigBL mutants at 37 °C but not in ∆sigL mutant.

4.4. Stress Response Phenotypic Traits Associated with σBand σL Inactivation in L. Monocytogenes EGD−e

Growth phenotypes in ∆sigBL were compared to the parental strain as well as ∆sigB and ∆sigL strains under different environmental stress conditions. Growth of the ∆sigBL mutant was drastically compromised in the presence of cold, lactic−acid, acetic−acid, citric−acid, and ethanol stress conditions relative to the parent strain. In our previous study [36], the ΔsigL strain showed similar growth phenotype defects exposed to cold, lactic−acid, acetic−acid, citric−acid, and ethanol stresses. Overall, the growth of the ΔsigBL mutant in acid, ethanol, and cold stresses better resembled the phenotype of the ΔsigL than the phenotype of ΔsigB. In a previous study [64], the ∆sigB∆sigL mutant of L. monocytogenes 10403S showed a significantly slower growth rate after exposure to nisin compared to the wild−type strain and ∆sigB and ∆sigL mutants. Apart from this, to our knowledge, no other studies on environmental stress growth with L. monocytogenes ΔsigBL mutants have yet been reported.
Phenotypic microarray analysis revealed 24 different compounds that impaired growth of the ∆sigBL strain compared with the wild−type, and that did not affect the growth of the ∆sigB or ∆sigL [36]. Most of these chemical compounds were antibiotics targeting cell wall, membrane, DNA, or protein synthesis (Table S4). Consistent with some of these phenotypes, there was a down−regulation in expression of transcripts encoding cell−membrane and protein−synthesis−associated proteins detected in the ∆sigBL at 37 °C.
The transcriptomic analysis also showed that deletion in both sigB and sigL affected the expression of four flagella−associated genes in cells grown at 3 °C. The flagellin coding gene lmo0690 showed the largest down−regulation, 12.3−fold decrease compared to the parent strain, while the flgC, fliE, and flgB all showed modest down−regulation with fold decreases ranging between 2.0 and 2.6.
Although the zone of swarming displayed by the ∆sigBL strain did not differ significantly from that of the parent strain, electron microscopy showed that the number of flagella per cells in this mutant was reduced compared to the parent strain. Evidently, the swarming ability of the ∆sigBL strain is unaffected by discreet down−regulation of these four genes, but flagella formation is nevertheless reduced.
In the ΔsigL mutant strain [36], neither flagellation nor swarming motility were detected. Interestingly, the double deletion of sigB and sigL restores both flagellation and motility in the ΔsigBL strain. These phenotypic observations are supported by the transcriptomic data since the deletion in both sigB and sigL affected the expression of only four flagella−associated genes in cells grown at 3 °C compared to the parent strain, whereas in the ΔsigL strain, 19 genes related to flagella biosynthesis, chemotaxis, and motility processes were down−regulated. Chaturongakul et al. [28] also discussed the coordinated and differential regulation of L. monocytogenes motility and chemotaxis genes under different growth conditions by multiple regulators, including σB and σL. A ΔsigB mutation increases flagella expression and motility in part due to decreased mogR expression, which relieves the repression of flagella expression. The mogR repressor is controlled by two promoters, including the P1 promoter, which is σB−dependent [44].
Deletion in both sigB and sigL increases the sensitivity of the L. monocytogenes EGD−e towards different stress conditions and chemical compounds, and promotes phenotypic characteristics absent in either the sigB or sigL null mutant strain. The interactive effect detected after the loss of both sigB and sigL may indicate that at least some genes needed for a sufficient stress response of L. monocytogenes EGD−e are co−regulated either directly or indirectly by these alternative sigma factors. As such, it appears the stress response mechanisms that are positively regulated through σB and σL co−regulation might be more relevant in L. monocytogenes stress protection than what has been known to date.
The present study provides an expanded insight into σB and σL phenotypic roles and functional interactions in L. monocytogenes. Besides previously known σB− and σL−dependent genes, the transcriptomes defined in ΔsigB and ΔsigBL mutants reveal several new genes that are positively regulated by σB alone, as well as those co−regulated through σB− and σL−dependent mechanisms during L. monocytogenes growth under optimal and cold−stress temperature conditions. Future studies in this area should include validation of the σB and σL co−regulation of such genes as well as their functional characterization through deletion mutagenesis and phenotypic analysis of these mutants. Moreover, the mechanistic aspects of how σB− and σL−dependent co−regulation of such target genes is achieved will be essential in providing insights into the σB and σL regulatory networks in L. monocytogenes.

Supplementary Materials

The following are available online at https://www.mdpi.com/2076-2607/8/11/1644/s1, Figure S1: Growth of Listeria monocytogenes EGD−e wild−type strain and ∆sigB and ∆sigBL mutant strains in BHI broth at 4 °C, in DM at 4 °C, in BHI supplemented with lactic acid at 4 °C, in DM at 37 °C, in BHI supplemented with acetic acid at 4 °C, in DM supplemented with ethanol at 37 °C, and in BHI supplemented with citric acid at 4 °C; Figure S2: Electron micrographs of Listeria monocytogenes EGD−e wild−type and ΔsigB, ΔsigL, and ΔsigBL mutant strains grown in BHI at 37 and 3 °C to mid−logarithmic growth phase, fixed with 5% glutaraldehyde, applied on carbon−coated grids, negatively stained with 1% phosphotungstic acid hydrate, and examined under a transmission electron microscope; Table S1: Bacterial strains, plasmids, and oligonucleotides used in this study; Table S2: Results from the BIOLOG phenotypic microarray comparative analysis of the Listeria monocytogenessigB and parental strains; Table S3: Results from the BIOLOG phenotypic microarray comparative analysis of the Listeria monocytogenes ∆sigBL and parental strains; Table S4: BIOLOG PM phenotypes detected in Listeria monocytogenes ∆sigBL but not in ∆sigB and ∆sigL strains; Table S5: Genes down−regulated in Listeria monocytogenes ∆sigB during exponential growth in BHI at 3 °C; Table S6: Genes down−regulated in Listeria monocytogenes ∆sigB during exponential growth in BHI at 37 °C; Table S7: Genes down−regulated in Listeria monocytogenes ∆sigBL during exponential growth in BHI at 3 °C; Table S8: Genes down−regulated in Listeria monocytogenes ∆sigBL during exponential growth in BHI at 37 °C; Table S9: Genes down−regulated in Listeria monocytogenes ∆sigBL but not in ∆sigB or ∆sigL during exponential growth in BHI at 3 °C; Table S10: Genes down−regulated in Listeria monocytogenes ∆sigBL but not in ∆sigB or ∆sigL during exponential growth in BHI at 37 °C.

Author Contributions

Conceptualization, H.K., R.S. and T.T.; Data curation, P.S.; Formal analysis, M.M., P.S. and T.T.; Funding acquisition, H.K., R.S. and T.T.; Investigation, M.M. and T.T.; Methodology, H.K., R.S. and T.T.; Project administration, T.T.; Resources, H.K. and T.T.; Software, P.S. and R.S.; Supervision, H.K. and R.S.; Validation, T.T.; Visualization, M.M., P.S. and T.T.; Writing—original draft, M.M.; Writing—review and editing, P.S., H.K., R.S. and T.T. All authors have read and agreed to the published version of the manuscript.

Funding

This research was funded by Academy of Finland (Grants 118602, 141140).

Conflicts of Interest

The authors declare no conflict of interest. The funders had no role in the design of the study; in the collection, analyses, or interpretation of data; in the writing of the manuscript, or in the decision to publish the results.

References

  1. Junttila, J.R.; Niemelä, S.I.; Hirn, J. Minimum growth temperatures of Listeria monocytogenes and non−haemolytic Listeria. J. Appl. Bacteriol. 1988, 65, 321–327. [Google Scholar] [CrossRef]
  2. Cole, M.B.; Jones, M.V.; Holyoak, C. The effect of pH, salt concentration and temperature on the survival and growth of Listeria monocytogenes. J. Appl. Bacteriol. 1990, 69, 63–72. [Google Scholar] [CrossRef]
  3. Vasseur, C.; Baverel, L.; Hébraud, M.; Labadie, J. Effect of osmotic, alkaline, acid or thermal stresses on the growth and inhibition of Listeria monocytogenes. J. Appl. Microbiol. 1999, 86, 469–476. [Google Scholar] [CrossRef]
  4. Farber, J.M.; Peterkin, P.I. Listeria monocytogenes, a food−borne pathogen. Microbiol. Rev. 1991, 55, 476–511. [Google Scholar] [CrossRef] [Green Version]
  5. Autio, T.; Hielm, S.; Miettinen, M.; Sjöberg, A.M.; Aarnisalo, K.; Björkroth, J.; Mattila−Sandholm, T.; Korkeala, H. Sources of Listeria monocytogenes contamination in a cold−smoked rainbow trout processing plant detected by pulsed−field gel electrophoresis typing. Appl. Environ. Microbiol. 1999, 65, 150–155. [Google Scholar] [CrossRef] [Green Version]
  6. Tompkin, R.B. Control of Listeria monocytogenes in the food−processing environment. J. Food Prot. 2002, 65, 709–725. [Google Scholar] [CrossRef]
  7. Lundén, J.M.; Autio, T.J.; Sjöberg, A.M.; Korkeala, H.J. Persistent and nonpersistent Listeria monocytogenes contamination in meat and poultry processing plants. J. Food Prot. 2003, 66, 2062–2069. [Google Scholar] [CrossRef] [Green Version]
  8. Keto−Timonen, R.; Tolvanen, R.; Lundén, J.; Korkeala, H. An 8−year surveillance of the diversity and persistence of Listeria monocytogenes in a chilled food processing plant analyzed by amplified fragment length polymorphism. J. Food Prot. 2007, 70, 1866–1873. [Google Scholar] [CrossRef] [PubMed] [Green Version]
  9. Lianou, A.; Sofos, J.N. A review of the incidence and transmission of Listeria monocytogenes in ready−to−eat products in retail and food service environments. J. Food Prot. 2007, 70, 2172–2198. [Google Scholar] [CrossRef]
  10. Kurpas, M.; Wieczorek, K.; Osek, J. Ready−to−eat meat products as a source of Listeria monocytogenes. J. Vet. Res. 2018, 62, 49–55. [Google Scholar] [CrossRef] [Green Version]
  11. Koutsoumanis, K.; Alvarez−Ordóñez, A.; Bolton, D.; Bover−Cid, S.; Chemaly, M.; Davies, R.; De Cesare, A.; Herman, L.; Hilbert, F.; Lindqvist, R. The public health risk posed by Listeria monocytogenes in frozen fruit and vegetables including herbs, blanched during processing. EFSA J. 2020, 18, e06092. [Google Scholar] [PubMed] [Green Version]
  12. Glaser, P.; Frangeul, L.; Buchrieser, C.; Rusniok, C.; Amend, A.; Baquero, F.; Berche, P.; Bloecker, H.; Brandt, P.; Chakraborty, T.; et al. Comparative genomics of Listeria species. Science 2001, 294, 849–852. [Google Scholar]
  13. Francke, C.; Groot Kormelink, T.; Hagemeijer, Y.; Overmars, L.; Sluijter, V.; Moezelaar, R.; Siezen, R.J. Comparative analyses imply that the enigmatic Sigma factor 54 is a central controller of the bacterial exterior. BMC Genom. 2011, 12, 385. [Google Scholar] [CrossRef] [Green Version]
  14. Becker, L.A.; Cetin, M.S.; Hutkins, R.W.; Benson, A.K. Identification of the gene encoding the alternative sigma factor sigmaB from Listeria monocytogenes and its role in osmotolerance. J. Bacteriol. 1998, 180, 4547–4554. [Google Scholar] [CrossRef] [Green Version]
  15. Wiedmann, M.; Arvik, T.J.; Hurley, R.J.; Boor, K.J. General stress transcription factor sigmaB and its role in acid tolerance and virulence of Listeria monocytogenes. J. Bacteriol. 1998, 180, 3650–3656. [Google Scholar] [CrossRef] [Green Version]
  16. Kazmierczak, M.J.; Mithoe, S.C.; Boor, K.J.; Wiedmann, M. Listeria monocytogenes sigma B regulates stress response and virulence functions. J. Bacteriol. 2003, 185, 5722–5734. [Google Scholar] [CrossRef] [Green Version]
  17. Wemekamp−Kamphuis, H.H.; Wouters, J.A.; de Leeuw, P.P.; Hain, T.; Chakraborty, T.; Abee, T. Identification of sigma factor sigma B−controlled genes and their impact on acid stress, high hydrostatic pressure, and freeze survival in Listeria monocytogenes EGD−e. Appl. Environ. Microbiol. 2004, 70, 3457–3466. [Google Scholar] [CrossRef] [Green Version]
  18. Chan, Y.C.; Boor, K.J.; Wiedmann, M. SigmaB−dependent and sigmaB−independent mechanisms contribute to transcription of Listeria monocytogenes cold stress genes during cold shock and cold growth. Appl. Environ. Microbiol. 2007, 73, 6019–6029. [Google Scholar] [CrossRef] [Green Version]
  19. Raengpradub, S.; Wiedmann, M.; Boor, K.J. Comparative analysis of the sigma B−dependent stress responses in Listeria monocytogenes and Listeria innocua strains exposed to selected stress conditions. Appl. Environ. Microbiol. 2008, 74, 158–171. [Google Scholar] [CrossRef] [Green Version]
  20. Somolinos, M.; Espina, L.; Pagán, R.; Garcia, D. sigB absence decreased Listeria monocytogenes EGD−e heat resistance but not its Pulsed Electric Fields resistance. Int. J. Food Microbiol. 2010, 141, 32–38. [Google Scholar] [CrossRef]
  21. Guerreiro, D.N.; Arcari, T.; O’Byrne, C.P. The σB−Mediated General Stress Response of Listeria monocytogenes: Life and Death Decision Making in a Pathogen. Front. Microbiol. 2020, 11, 1505. [Google Scholar] [CrossRef] [PubMed]
  22. Nadon, C.A.; Bowen, B.M.; Wiedmann, M.; Boor, K.J. Sigma B contributes to PrfA−mediated virulence in Listeria monocytogenes. Infect. Immun. 2002, 70, 3948–3952. [Google Scholar] [CrossRef] [Green Version]
  23. McGann, P.; Wiedmann, M.; Boor, K.J. The alternative sigma factor sigma B and the virulence gene regulator PrfA both regulate transcription of Listeria monocytogenes internalins. Appl. Environ. Microbiol. 2007, 73, 2919–2930. [Google Scholar] [CrossRef] [PubMed] [Green Version]
  24. Ollinger, J.; Wiedmann, M.; Boor, K.J. SigmaB− and PrfA−dependent transcription of genes previously classified as putative constituents of the Listeria monocytogenes PrfA regulon. Foodborne Pathog. Dis. 2008, 5, 281–293. [Google Scholar] [CrossRef] [PubMed] [Green Version]
  25. Fraser, K.R.; Sue, D.; Wiedmann, M.; Boor, K.; O’Byrne, C.P. Role of SigmaB in regulating the compatible solute uptake systems of Listeria monocytogenes: Osmotic induction of opuC is SigmaB dependent. Appl. Environ. Microbiol. 2003, 69, 2015–2022. [Google Scholar] [CrossRef] [Green Version]
  26. Abram, F.; Starr, E.; Karatzas, K.A.; Matlawska−Wasowska, K.; Boyd, A.; Wiedmann, M.; Boor, K.J.; Connally, D.; O’Byrne, C.P. Identification of components of the Sigma B regulon in Listeria monocytogenes that contribute to acid and salt tolerance. Appl. Environ. Microbiol 2008, 74, 6848–6858. [Google Scholar] [CrossRef] [PubMed] [Green Version]
  27. Oliver, H.F.; Orsi, R.H.; Wiedmann, M.; Boor, K.J. Listeria monocytogenes {Sigma}B has a small core regulon and a conserved role in virulence but makes differential contributions to stress tolerance across a diverse collection of strains. Appl. Environ. Microbiol. 2010, 76, 4216–4232. [Google Scholar] [CrossRef] [Green Version]
  28. Chaturongakul, S.; Raengpradub, S.; Palmer, M.E.; Bergholz, T.M.; Orsi, R.H.; Hu, Y.; Ollinger, J.; Wiedmann, M.; Boor, K.J. Transcriptomic and phenotypic analyses identify coregulated, overlapping regulons among PrfA, CtsR, HrcA, and the alternative sigma factors SigmaB, SigmaC, SigmaH, and SigmaL in Listeria monocytogenes. Appl. Environ. Microbiol. 2011, 77, 187–200. [Google Scholar] [CrossRef] [Green Version]
  29. Mujahid, S.; Orsi, R.H.; Boor, K.J.; Wiedmann, M. Protein level identification of the Listeria monocytogenes sigma H, sigma L, and sigma C regulons. BMC Microbiol. 2013, 10, 156. [Google Scholar] [CrossRef] [Green Version]
  30. Mujahid, S.; Orsi, R.H.; Vangay, P.; Boor, K.J.; Wiedmann, M. Refinement of the Listeria monocytogenes σB regulon through quantitative proteomic analysis. Microbiology 2013, 159, 1109–1119. [Google Scholar] [CrossRef] [Green Version]
  31. Liu, Y.; Orsi, R.H.; Boor, K.J.; Wiedmann, M.; Guariglia−Oropeza, V. Home alone: Elimination of all but one alternative sigma factor in Listeria monocytogenes allows prediction of new roles for σB. Front. Microbiol. 2017, 8, 1910. [Google Scholar] [CrossRef] [Green Version]
  32. Liu, Y.; Orsi, R.H.; Gaballa, A.; Wiedmann, M.; Boor, K.J.; Guariglia−Oropeza, V. Systematic review of the Listeria monocytogenes σB regulon supports a role in stress response, virulence and metabolism. Future Microbiol. 2019, 14, 801–828. [Google Scholar] [CrossRef] [Green Version]
  33. Okada, Y.; Okada, N.; Makino, S.; Asakura, H.; Yamamoto, S.; Igimi, S. The sigma factor RpoN (sigma54) is involved in osmotolerance in Listeria monocytogenes. FEMS Microbiol. Lett. 2006, 263, 54–60. [Google Scholar] [CrossRef] [PubMed] [Green Version]
  34. Chan, Y.C.; Hu, Y.; Chaturongakul, S.; Files, K.D.; Bowen, B.M.; Boor, K.J.; Wiedmann, M. Contributions of two−component regulatory systems, alternative sigma factors, and negative regulators to Listeria monocytogenes cold adaptation and cold growth. J. Food Prot. 2008, 71, 420–425. [Google Scholar] [CrossRef] [PubMed]
  35. Raimann, E.; Schmid, B.; Stephan, R.; Tasara, T. The alternative sigma factor Sigma(L) of L. monocytogenes promotes growth under diverse environmental stresses. Foodborne Pathog. Dis. 2009, 6, 583–591. [Google Scholar] [CrossRef] [PubMed]
  36. Mattila, M.; Somervuo, P.; Rattei, T.; Korkeala, H.; Stephan, R.; Tasara, T. Phenotypic and transcriptomic analyses of Sigma L−dependent characteristics in Listeria monocytogenes EGD−e. Food Microbiol. 2012, 32, 152–164. [Google Scholar] [CrossRef]
  37. Liu, S.; Graham, J.E.; Bigelow, L.; Morse, P.D.; Wilkinson, B.J. Identification of Listeria monocytogenes genes expressed in response to growth at low temperature. Appl. Environ. Microbiol. 2002, 68, 1697–1705. [Google Scholar] [CrossRef] [PubMed] [Green Version]
  38. Arous, S.; Buchrieser, C.; Folio, P.; Glaser, P.; Namane, A.; Hébraud, M.; Héchard, Y. Global analysis of gene expression in an rpoN mutant of Listeria monocytogenes. Microbiology 2004, 150, 1581–1590. [Google Scholar] [CrossRef] [PubMed] [Green Version]
  39. Premaratne, R.J.; Lin, W.J.; Johnson, E.A. Development of an improved chemically defined minimal medium for Listeria monocytogenes. Appl. Environ. Microbiol. 1991, 57, 3046–3048. [Google Scholar] [CrossRef] [Green Version]
  40. Michel, E.; Stephan, R.; Tasara, T. The lmo0501 gene coding for a putative transcription activator protein in Listeria monocytogenes promotes growth under cold, osmotic and acid stress conditions. Food Microbiol. 2011, 28, 1261–1265. [Google Scholar] [CrossRef] [Green Version]
  41. Loepfe, C.; Raimann, E.; Stephan, R.; Tasara, T. Reduced host cell invasiveness and oxidative stress tolerance in double and triple csp gene family deletion mutants of Listeria monocytogenes. Foodborne Pathog. Dis. 2010, 7, 775–783. [Google Scholar] [CrossRef] [PubMed] [Green Version]
  42. Baranyi, J.; Roberts, T.A. A dynamic approach to predicting bacterial growth in food. Int. J. Food Microbiol. 1994, 23, 277–294. [Google Scholar] [CrossRef]
  43. Bochner, B.R.; Gadzinski, P.; Panomitros, E. Phenotype microarrays for high−throughput phenotypic testing and assay of gene function. Genome Res. 2001, 11, 1246–1255. [Google Scholar] [CrossRef] [Green Version]
  44. Kathariou, S.; Mizumoto, C.; Kanenaka, R.; Allen, R.D.; Fok, A.K. Repression of motility and flagellin production at 37 C is stronger in Listeria monocytogenes than in the nonpathogenic species Listeria innocua. Can. J. Microbiol. 1995, 41, 572–577. [Google Scholar] [CrossRef]
  45. Schmid, B.; Klumpp, J.; Raimann, E.; Loessner, M.J.; Stephan, R.; Tasara, T. Role of cold shock proteins in growth of Listeria monocytogenes under cold and osmotic stress conditions. Appl. Environ. Microbiol. 2009, 75, 1621–1627. [Google Scholar] [CrossRef] [PubMed] [Green Version]
  46. Horton, R.M.; Cai, Z.L.; Ho, S.N.; Pease, L.R. Gene splicing by overlap extension: Tailor−made genes using the polymerase chain reaction. Biotechniques 1990, 8, 528–535. [Google Scholar] [CrossRef] [PubMed] [Green Version]
  47. Smith, K.; Youngman, P. Use of a new integrational vector to investigate compartment−specific expression of the Bacillus subtilis spoIIM gene. Biochimie 1992, 74, 705–711. [Google Scholar] [CrossRef]
  48. Edgar, R.; Domrachev, M.; Lash, A.E. Gene Expression Omnibus: NCBI gene expression and hybridization array data repository. Nucleic Acids Res. 2002, 30, 207–210. [Google Scholar] [CrossRef] [Green Version]
  49. Toledo−Arana, A.; Dussurget, O.; Nikitas, G.; Sesto, N.; Guet−Revillet, H.; Balestrino, D.; Loh, E.; Gripenland, J.; Tiensuu, T.; Vaitkevicius, K.; et al. The Listeria transcriptional landscape from saprophytism to virulence. Nature 2009, 459, 950–956. [Google Scholar] [CrossRef]
  50. van Schaik, W.; Abee, T. The role of sigmaB in the stress response of Gram–positive bacteria–targets for food preservation and safety. Curr. Opin. Biotechnol. 2005, 16, 218–224. [Google Scholar] [CrossRef]
  51. Marles−Wright, J.; Lewis, R.J. Stress responses of bacteria. Curr. Opin. Struct. Biol. 2007, 17, 755–760. [Google Scholar] [CrossRef]
  52. Chaturongakul, S.; Raengpradub, S.; Wiedmann, M.; Boor, K.J. Modulation of stress and virulence in Listeria monocytogenes. Trends Microbiol. 2008, 16, 388–396. [Google Scholar] [CrossRef] [PubMed] [Green Version]
  53. Gorski, L.; Duhé, J.M.; Flaherty, D. The Sigma B operon is a determinant of fitness for a Listeria monocytogenes serotype 4b strain in soil. Foodborne Pathog. Dis. 2011, 8, 699–704. [Google Scholar] [CrossRef] [PubMed]
  54. Palonen, E.; Lindström, M.; Somervuo, P.; Korkeala, H. Alternative sigma factor σE has an important role in stress tolerance of Yersinia pseudotuberculosis IP32953. Appl. Environ. Microbiol. 2013, 79, 5970–5977. [Google Scholar] [CrossRef] [PubMed] [Green Version]
  55. Hain, T.; Hossain, H.; Chatterjee, S.S.; Machata, S.; Volk, U.; Wagner, S.; Brors, B.; Haas, S.; Kuenne, C.T.; Billion, A.; et al. Temporal transcriptomic analysis of the Listeria monocytogenes EGD−e sigmaB regulon. BMC Microbiol. 2008, 28, 20. [Google Scholar]
  56. Anderson, L.A.; McNairn, E.; Lubke, T.; Pau, R.N.; Boxer, D.H. ModE−dependent molybdate regulation of the molybdenum cofactor operon moa in Escherichia coli. J. Bacteriol. 2000, 182, 7035–7043. [Google Scholar] [CrossRef] [Green Version]
  57. Ferreira, A.; O’Byrne, C.P.; Boor, K.J. Role of sigma(B) in heat, ethanol, acid, and oxidative stress resistance and during carbon starvation in Listeria monocytogenes. Appl. Environ. Microbiol. 2001, 67, 4454–4457. [Google Scholar] [CrossRef] [Green Version]
  58. Moorhead, S.M.; Dykes, G.A. The role of the sigB gene in the general stress response of Listeria monocytogenes varies between a strain of serotype 1/2a and a strain of serotype 4c. Curr. Microbiol. 2003, 46, 461–466. [Google Scholar] [CrossRef]
  59. Hu, Y.; Raengpradub, S.; Schwab, U.; Loss, C.; Orsi, R.H.; Wiedmann, M.; Boor, K.J. Phenotypic and transcriptomic analyses demonstrate interactions between the transcriptional regulators CtsR and Sigma B in Listeria monocytogenes. Appl. Environ. Microbiol. 2007, 73, 7967–7980. [Google Scholar] [CrossRef] [Green Version]
  60. Garmyn, D.; Augagneur, Y.; Gal, L.; Vivant, A.L.; Piveteau, P. Listeria monocytogenes differential transcriptome analysis reveals temperature−dependent Agr regulation and suggests overlaps with other regulons. PLoS ONE 2012, 7, e43154. [Google Scholar] [CrossRef]
  61. Tang, S.; Orsi, R.H.; den Bakker, H.C.; Wiedmann, M.; Boor, K.J.; Bergholz, T.M. Transcriptomic analysis of the adaptation of Listeria monocytogenes to growth on vacuum−packed cold smoked salmon. Appl. Environ. Microbiol. 2015, 81, 6812–6824. [Google Scholar] [CrossRef] [PubMed] [Green Version]
  62. Zeng, Z.; Smid, E.J.; Boeren, S.; Notebaart, R.A.; Abee, T. Bacterial Microcompartment−Dependent 1,2−Propanediol Utilization Stimulates Anaerobic Growth of Listeria monocytogenes EGDe. Front. Microbiol. 2019, 10, 2660. [Google Scholar] [CrossRef] [PubMed]
  63. Tojo, S.; Satomura, T.; Morisaki, K.; Yoshida, K.; Hirooka, K.; Fujita, Y. Negative transcriptional regulation of the ilv−leu operon for biosynthesis of branched−chain amino acids through the Bacillus subtilis global regulator TnrA. J. Bacteriol. 2004, 186, 7971–7979. [Google Scholar] [CrossRef] [Green Version]
  64. Palmer, M.E.; Wiedmann, M.; Boor, K.J. Sigma(B) and sigma(L) contribute to Listeria monocytogenes 10403S response to the antimicrobial peptides SdpC and nisin. Foodborne Pathog Dis. 2009, 6, 1057–1065. [Google Scholar] [CrossRef] [PubMed] [Green Version]
Figure 1. Overview of down- and up-regulated genes in Listeria monocytogenes ΔsigB, ΔsigL [36] and ΔsigBL compared to the wild-type EGD-e strain detected during exponential growth in BHI at 37°(A) and (B) and 3 °C (C) and (D). Genes showing 2.5-fold change (p-value ≤ 0.01) in transcript abundance were considered differentially expressed.
Microorganisms 08 01644 g001
Figure 2. Distribution of significantly down-regulated genes in Listeria monocytogenes ∆sigB (A) and ∆sigBL (B) during exponential growth in BHI at 3 and 37 °C in functional categories. The bar lengths represent the percentage of affected and unaffected genes assigned to each functional category. The genes were grouped into functional categories based on the annotations provided by the Comprehensive Microbial Resource of the J. Craig Venter Institute (CMR-JVCI) (http://cmr.jcvi.org).
Microorganisms 08 01644 g002
Table 1. Growth parameters determined for Listeria monocytogenes ΔsigB, ΔsigBL, and parental EGD-e strain under different conditions in brain heart infusion broth (BHI) and defined medium (DM) at 4 and 37 °C.
Growth ConditionGrowth ParameterWTΔsigBΔsigBLStatistical
Significance
4 °C
BHI (pH 7.4)
LPD (wk)
GR (Log10(CFU/mL)/wk)
0.00
0.89 ± 0.03
0.00
0.88 ± 0.04
0.00
0.85 ± 0.04
NS a
NS
BHI plus 2.5% lactic acid (pH 6.0)LPD (wk)
GR (Log10(CFU/mL)/wk)
3.84 ± 0.10
1.01 ± 0.01
4.51 ± 0.15
1.10 ± 0.02
5.48 ± 0.67
0.32 ± 0.01
S b,c
S
BHI plus 0.35% acetic acid (pH 5.5)LPD (wk)
GR (Log10(CFU/mL)/wk)
2.10 ± 1.32
0.13 ± 0.01
7.33 ± 0.47
0.23 ± 0.03
NG
NG
S
S
BHI plus 0.35% citric acid (pH 5.5)LPD (wk)
GR (Log10(CFU/mL)/wk)
3.98 ± 0.96
1.11 ± 0.15
2.82 ± 0.10
1.21 ± 0.11
NG
NG
S
S
DMLPD (wk)
GR (Log10(CFU/mL)/wk)
2.44 ± 0.18
1.27 ± 0.07
2.87 ± 0.05
1.63 ± 0.11
4.60 ± 0.27
0.49 ± 0.17
S
S
37 °C
DM
LPD (wk)
GR (Log10(CFU/mL)/wk)
0.00
0.14 ± 0.01
0.00
0.12 ± 0.01
0.00
0.11 ± 0.03
NS
NS
DM plus 5% EthanolLPD (wk)
GR (Log10(CFU/mL)/wk)
5.87 ± 2.51
0.12 ± 0.02
17.79 ± 1.78
0.04 ± 0.05
14.27 ± 1.58
0.03 ± 0.02
S
S
The lag phases (LPD) and growth rates (GR) of the strains were estimated using the Dmfit program (version 2.1), which is based on the Baranyi model. NG—no exponential growth detected. a NS—No statistically significant differences between ΔsigB and ΔsigBL compared to the EGD-e WT strain. b S—Statistically significant differences (p < 0.05) between ΔsigB and ΔsigBL compared to the EGD-e WT strain are indicated in bold. c S—Statistically significant differences (p < 0.05) between ΔsigB and ΔsigBL strains are indicated in bold and italics. The statistical significance information is based on one-way ANOVA comparison of the mutants to the parental WT strain.
Table 2. Validation of selected DNA-microarray results with real-time RT-qPCR.
Gene37 °C3 °C
ΔsigBΔsigBLΔsigBΔsigBL
MicroarrayRT-qPCRMicroarrayRT-qPCRMicroarrayRT-qPCRMicroarrayRT-qPCR
lmo0096NSNS
lmo0137NSNS
lmo0685NS aNSNSNSNSNS
lmo2625NSNS
Relative gene expression levels in deletion mutant strains ΔsigB, ΔsigL, and ΔsigBL compared with the EGD-e parent strain. ▼ indicates down-regulation and ▲ up-regulation of the gene in the mutant strain compared with the wild-type. a No statistical difference in the gene expression levels in the mutant strains compared with the parent strain.
Table 3. Genes that were down-regulated during exponential growth of Listeria monocytogenes ΔsigB in BHI at 3 and 37 °C a.
GeneFunctional Category and Protein bDifferential Expression
(∆sigB vs. WT)
Fold Change at 3 °C
Differential Expression
(∆sigB vs. WT)
Fold Change at 37 °C
Amino acid biosynthesis
lmo0781PTS system component−1.5−2.3
Cell envelope
lmo1079membrane protein, putative−1.4−2.1
Cellular processes
lmo0263internalin H−3−4.1
lmo0515universal stress protein family−2.9−2.5
lmo0669general stress protein 39−1.8−3.5
lmo1694cell division inhibitor−1.5−2.4
lmo2230arsenate reductase, putative−4−3.9
lmo2673universal stress protein family−2.4−2.8
Central intermediary metabolism
lmo0134acetyltransferase, GNAT family−2.4−1.4
lmo2434glutamate decarboxylase−3.2−3.1
Energy metabolism
lmo0722pyruvate oxidase−2.3−2.4
lmo0913succinate−semialdehyde dehydrogenase−2.5−1.6
lmo2674ribose 5−phosphate isomerase B−1.8−1.6
Protein fate
lmo1407pyruvate formate−lyase activating enzyme−1.4−1.5
lmo2157secretory protein (sepA)−1.4−2.2
Regulatory functions
lmo2085Gram positive anchor domain protein−3.3−3
Transcription
lmo0895RNA polymerase sigma factor B−5.8−5.3
Transport and binding proteins
lmo0169transporter, putative−2.1−2.4
lmo0782PTS system component−3−3.4
lmo0783PTS system component−3.3−2.8
lmo0784PTS system component−3.7 −3.2
Hypothetical and unclassified proteins
lmo0265peptidase, M20/M25/M40 family−2.2−2.4
lmo0602protease synthase and sporulation negative regulatory protein pai 1, putative−1.3−2.8
lmo0937hypothetical protein−3.2−2.8
lmo1241conserved hypothetical protein−2.5−3.9
lmo2067choloylglycine hydrolase−3.1−3.5
lmo2158conserved domain protein−6.2−3.9
lmo2213conserved hypothetical protein−1.6−2.6
lmo2748conserved hypothetical protein−1.9−3
a The log2−transformed mean fold change values were calculated from three biological replicates. Genes listed are those displaying ≥ 2.5 fold (equivalent to ± 1.3 log2) change in transcript abundance between the ΔsigB and its parental EGD−e strain with a moderated t−test statistical significance of p−value ≤ 0.01. b Gene functional categories are based on the annotations provided by the Comprehensive Microbial Resource of the J. Craig Venter Institute (CMR-JCVI) (http://cmr.jcvi.org).
Table 4. Genes that were down−regulated during exponential growth of Listeria monocytogenes ΔsigBL in BHI at 3 and 37 °C a.
GeneFunctional Category and Protein bDifferential Expression
(∆sigBL vs. WT)
Fold Change at 3 °C
Differential Expression
(∆sigBL vs. WT)
Fold Change at 37 °C
Biosynthesis of cofactors, prosthetic groups, and carriers
lmo2571pyrazinamidase/nicotinamidase, putative−1.4−3.4
Cellular processes
lmo0263internalin H−2.7−4.1
lmo0433internalin A−3.8−1.3
lmo0515universal stress protein family−3.5−2.2
lmo0669general stress protein 39−1.7−3.6
lmo1694cell division inhibitor−1.9−3
lmo2230arsenate reductase, putative−3.1−4.2
lmo2673universal stress protein family−1.4−3.3
Central intermediary metabolism
lmo0134acetyltransferase, GNAT family−2.5−3
lmo2434glutamate decarboxylase−3.1−3.4
Energy metabolism
lmo0210L−lactate dehydrogenase−3.2−1.3
lmo0913succinate−semialdehyde dehydrogenase−2.1−1.6
lmo1634aldehyde−alcohol dehydrogenase−6.1−1.7
lmo2674ribose 5−phosphate isomerase B−2−1.6
Protein fate
lmo1407pyruvate formate−lyase activating enzyme−3.3−1.5
Protein synthesis
lmo0250ribosomal protein L10−2.2−1.3
lmo0251ribosomal protein L7/L12−2.6−1.4
lmo1783ribosomal protein L20−1.5−1.3
lmo2605ribosomal protein L17−1.4−1.6
lmo2613ribosomal protein L15−1.3−1.4
lmo2614ribosomal protein L30−1.5−2
lmo2615ribosomal protein S5−1.8−2
lmo2616ribosomal protein L18−1.6−1.9
lmo2617ribosomal protein L6−1.7−1.7
lmo2618ribosomal protein S8−1.8−1.7
lmo2619ribosomal protein S14p/S29e−1.6−1.6
lmo2620ribosomal protein L5−1.9−1.7
lmo2621ribosomal protein L24−1.7−1.5
lmo2622ribosomal protein L14−1.5−1.6
lmo2624ribosomal protein L29−1.9−1.5
lmo2625ribosomal protein L16−1.8−1.5
lmo2626ribosomal protein S3−1.6−1.5
Purines, pyrimidines, nucleosides, and nucleotides
lmo2611adenylate kinase−1.5−1.9
Regulatory functions
lmo1956transcriptional regulator, Fur family−1.5−1.4
lmo2085Gram positive anchor domain protein−3.2−3.6
Transcription
lmo0895RNA polymerase sigma factor B−2.3−5.3
lmo2461Sigma−54 factors family−2.7−3.7
Transport and binding proteins
lmo0135oligopeptide−binding protein appa precursor, putative−2.2−2.8
lmo0136peptide ABC transporter, permease protein−1.8−2.4
lmo0137oligopeptide transport permease protein appc−1.6−2.6
lmo0169transporter, putative−1.3−2.7
lmo0781PTS system component−2−2.3
lmo0782PTS system component−2.2−3.9
lmo0783PTS system component−2.1−2.9
lmo0784PTS system component−2.1−3.8
Hypothetical and unclassified proteins
lmo0265peptidase, M20/M25/M40 family
lmo0355succinate dehydrogenase/fumarate reductase, flavoprotein −2.2−2.4
lmo0602subunit −1.9−1.9
lmo2067protease synthase and sporulation negative regulatory protein pai 1, putative−2.1−3
lmo2158choloylglycine hydrolase
lmo0170conserved domain protein−3−3.6
lmo0596conserved hypothetical protein−4.7−3.8
lmo0911conserved hypothetical protein−1.7−1.5
lmo0995conserved hypothetical protein−1.6−3.9
lmo1241conserved hypothetical protein−2−1.6
lmo1776conserved hypothetical protein−2.3−1.9
lmo2213conserved hypothetical protein−1.4−4.2
lmo2572conserved hypothetical protein−2.8−1.4
lmo2748conserved hypothetical protein−1.5−2.8
lmo0654conserved hypothetical protein−1.4−3.5
lmo0937hypothetical protein−2.5−3.1
lmo0994hypothetical protein−1.3−1.6
lmo2454hypothetical protein−3.3−2.6
a The log2−transformed mean fold change values were calculated from three biological replicates. Genes listed are those displaying ≥ 2.5 fold (equivalent to ± 1.3 log2) change in transcript abundance between the ΔsigBL and its parental EGD−e strain with a moderated t−test statistical significance of p−value ≤ 0.01. b Functional category—genes are functionally categorized based on the annotations provided by the Comprehensive Microbial Resource of the J. Craig Venter Institute (CMR−JCVI) (http://cmr.jcvi.org).
Publisher’s Note: MDPI stays neutral with regard to jurisdictional claims in published maps and institutional affiliations.

