Article

Metagenomic Analysis of the Species Composition and Seasonal Distribution of Marine Dinoflagellate Communities in Four Korean Coastal Regions

1
West Sea Fisheries Research Institute, National Institute of Fisheries Science, Incheon 22383, Korea
2
Environment and Resource Convergence Center, Advanced Institute of Convergence Technology, Suwon 16229, Korea
*
Author to whom correspondence should be addressed.
Microorganisms 2022, 10(7), 1459; https://doi.org/10.3390/microorganisms10071459
Submission received: 29 April 2022 / Revised: 14 July 2022 / Accepted: 18 July 2022 / Published: 19 July 2022

Abstract

:
Biomonitoring of dinoflagellate communities in marine ecosystems is essential for efficient water quality management and limiting ecosystem disturbances. Current identification and monitoring of toxic dinoflagellates, which cause harmful algal blooms, primarily involves light or scanning electron microscopy; however, these techniques are limited in their ability to monitor dinoflagellates and plankton, leaving an incomplete analysis. In this study, we analyzed the species composition and seasonal distribution of the dinoflagellate communities in four Korean coastal regions using 18S rRNA amplicon sequencing. The results showed significantly high diversity in the dinoflagellate communities in all regions and seasons. Furthermore, we found seasonally dominant species and causative species of harmful algal blooms (Cochlodinium sp., Alexandrium sp., Dinophysis sp., and Gymnodinium sp.). Moreover, dominant species were classified by region and season according to the difference in geographical and environmental parameters. The molecular analysis of the dinoflagellate community based on metagenomics revealed more diverse species compositions that could not be identified by microscopy and revealed potentially harmful or recently introduced dinoflagellate species. In conclusion, metagenomic analysis of dinoflagellate communities was more precise and obtained results faster than microscopic analysis, and could improve the existing monitoring techniques for community analysis.

1. Introduction

Marine dinoflagellates are ubiquitous and play diverse roles in marine ecosystems [1,2]. Some dinoflagellate species can grow out of control due to various environmental factors, such as excessive inorganic nutrients (nitrogen (N) and phosphorus (P)) introduced from the land, forming a bloom [3,4]. Blooms from dinoflagellates have detrimental effects on a variety of aquatic animals, including fish and aquatic mammals, and can even be harmful to humans through toxin production [5,6]. Therefore, continuous monitoring of dinoflagellate communities is essential, as they can affect the diversity of surrounding aquatic life and cause ecosystem disturbance.
To date, monitoring of dinoflagellates in the aquatic environment has generally involved morphological identification using light microscopy observations. Recent advances in microscopy, including scanning electron microscopy (SEM), have enabled more precise identification [7,8]. However, the morphological classification of plankton via microscopy is still challenging, as plankton are difficult to observe with SEM due to the lack of an outer shell in dinoflagellates or the extremely small size of plankton. Recently, many types of species identification technology to distinguish dinoflagellates and molecular technology targeting species-specific genes have been developed [9,10]. In particular, next-generation sequencing (NGS) has greatly expanded our understanding of the diversity and function of dinoflagellates in the aquatic environment. This technique allows for rapid, high-resolution analysis of microbial and dinoflagellate communities [11,12]. In addition, it is possible to accurately identify nano- and pico-sized plankton, which are difficult to distinguish with a conventional microscope, facilitating the identification of various plankton that have been overlooked because they do not appear or are difficult to distinguish in local environmental conditions [13]. Although the QIIME or USEARCH pipeline has been widely used to analyze 16S rRNA gene sequencing reads from microbial communities [14,15,16], many metagenomics studies examining the profile of marine dinoflagellates have been carried out using the CLC Genomics Workbench [17,18,19,20]. In this study, we analyzed taxonomic profiling and seasonal distribution of the dinoflagellate communities in four Korean coastal regions based on the reading of 18S rRNA sequences using the CLC Workbench. To verify the results calculated using the CLC tool, those results were compared with abundance measured by direct counting of cells using microscopy.
Outbreaks of harmful dinoflagellates have traditionally occurred in tropical or temperate regions which have the potential for enhancing the growth rate of phytoplankton cells under the appropriate environmental conditions. Jeju Island, located along the southern coast of Korea, is a temperate region, and the occurrence of benthic dinoflagellates producing phytotoxins has been frequently reported in Jeju [21]. Understanding the spatial and seasonal dynamics of the toxic dinoflagellates in this region is essential, and many researchers have continuously monitored the cell abundance around Jeju Island using microscopic identification [22,23,24]. In this study, we investigated the spatial and seasonal variation of dinoflagellate communities in four different sites in Korean coastal waters, including Jeju Island, using NGS-based (18S rRNA amplicon) metagenomics. For precise bioinformatics analyses, we established a reference database of dinoflagellates and analyzed the precision of NGS compared to conventional microscopic observation. Thus, the reference data for the dinoflagellate community classified based on the NGS findings in this study will provide a better understanding of the occurrence of toxic dinoflagellates in Korea.

2. Materials and Methods

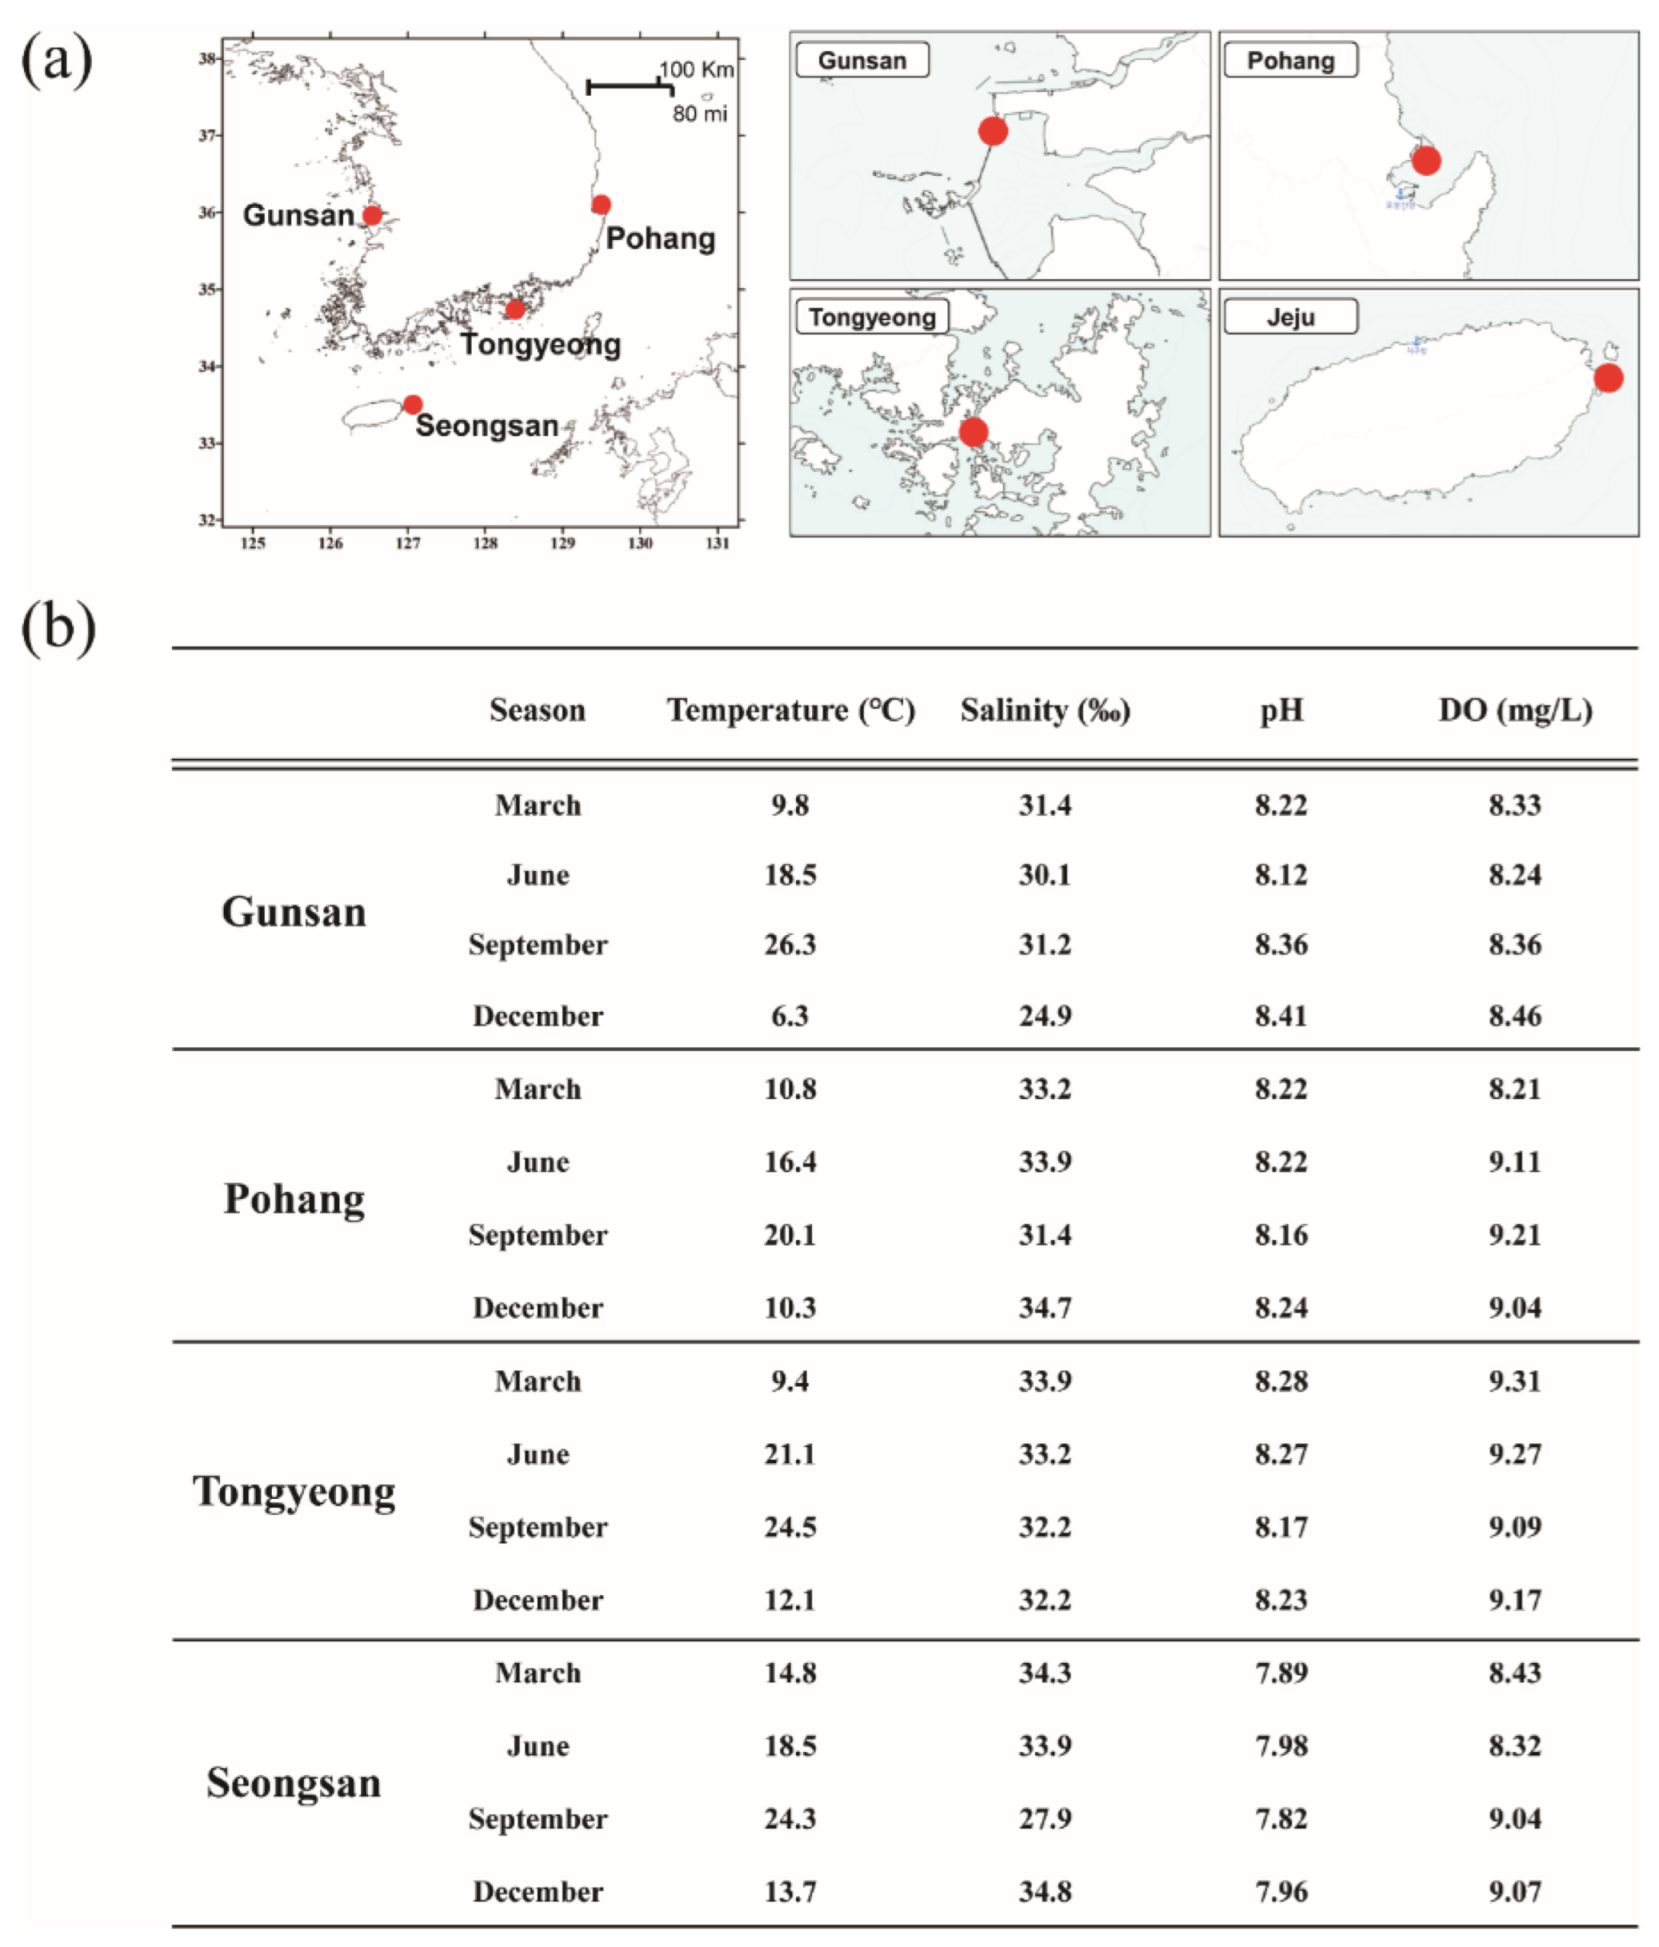
2.1. Study Areas and Seawater Sample Collecting

Seawater samples for metagenomic analysis were collected from four coastal waters (Gunsan, Pohang, Tongyeong, and Seongsan) in March, June, September, and December 2019. The four selected sampling sites have different geological and environmental characteristics, representing the eastern coast (Pohang), southern coast (Tongyeong), western coast (Gunsan), and Jeju island (Seongsan), and all four locations are near a port with considerable human activity (Figure 1a). To remove large zooplankton and foreign substances in the sample, surface seawater at each region was sieved using meshes with pore sizes of 80 µm. Four liters of seawater samples for metagenomics analysis were filtered through a polycarbonate filter membrane (0.8 µm Millipore; MilliporeSigma, Burlington, MA, USA) to obtain environmental DNA samples, then transferred to the laboratory on dry ice. For microscopic analysis, 500 mL of seawater samples was fixed with Lugol’s solution, and phytoplankton cells were identified to at least the genus level using an optical microscope (Axioskop; Zeiss, Oberkochen, Germany). The dinoflagellate cells were counted directly using a Sedgwick-Rafter counting chamber by light microscopy (BX53; Olympus, Tokyo, Japan). Environmental data, such as water temperature, pH, dissolved oxygen, and conductivity, were measured at each location using a YSI 566 Multi Probe System (YSI Inc., Yellow Springs, OH, USA).

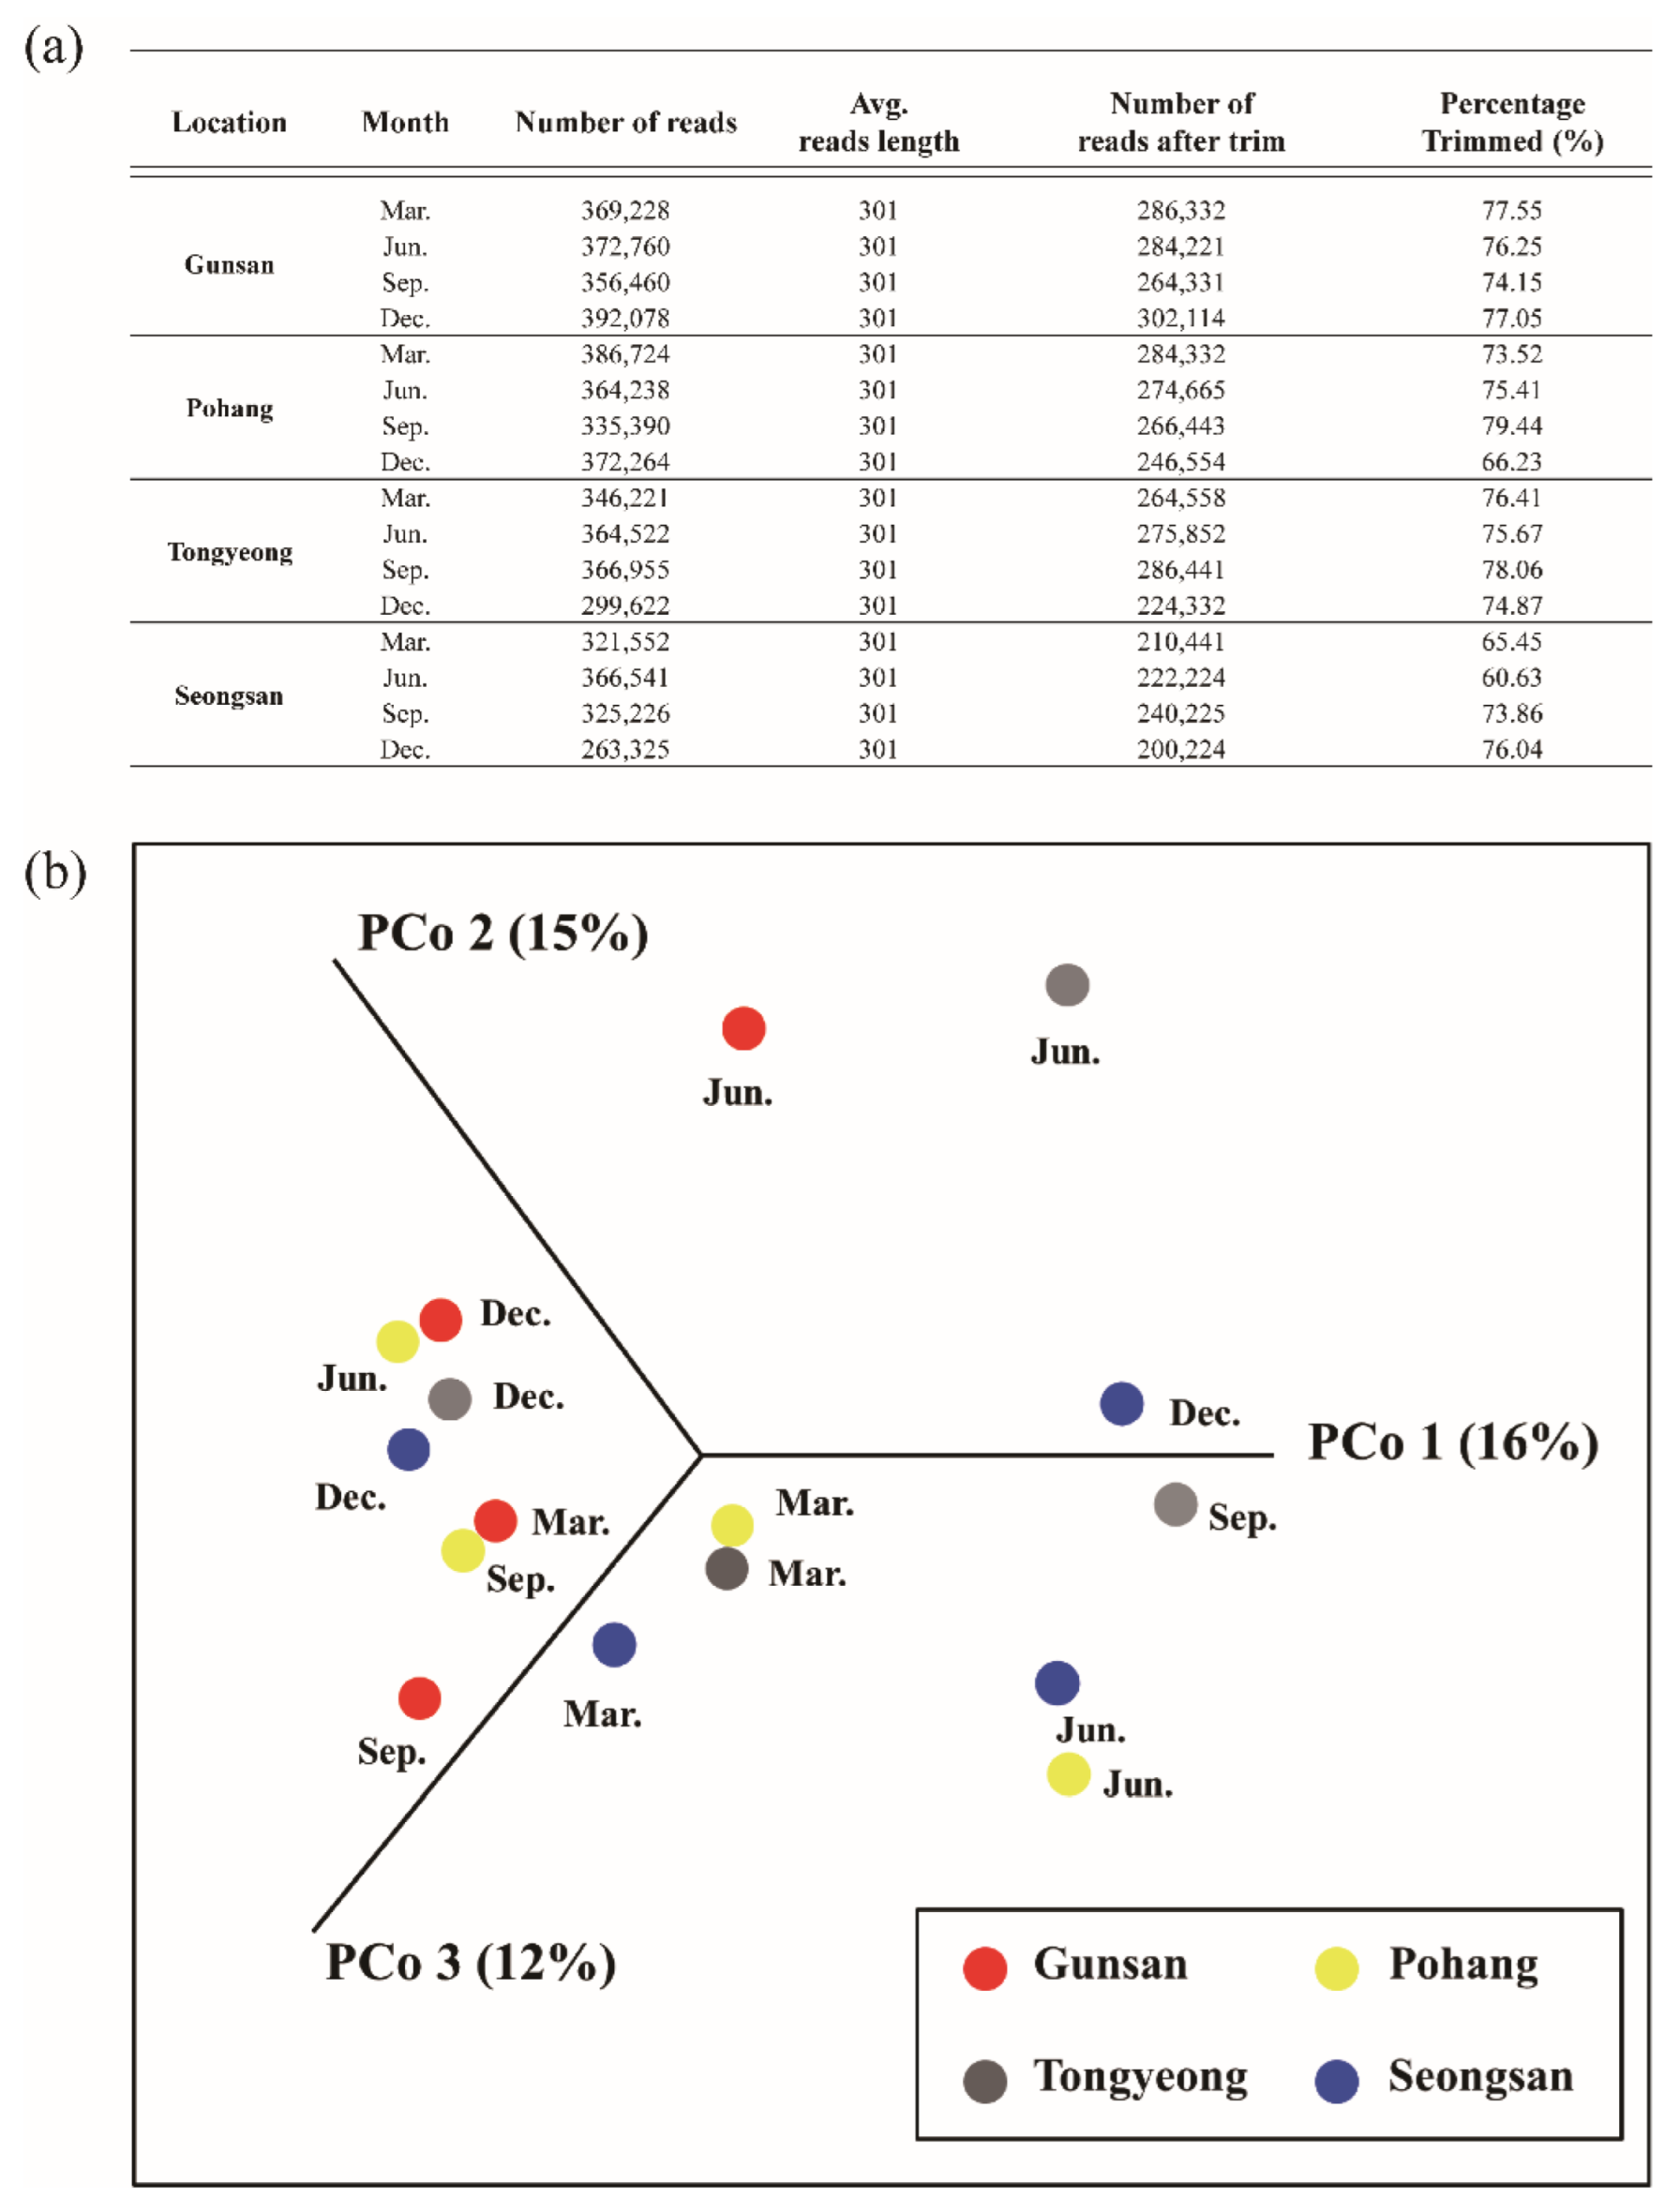
2.2. DNA Extraction, Library Preparation, and NGS

DNA was extracted from the filtered membranes containing dinoflagellates and microbial cells using a DNeasy PowerSoil Kit (Qiagen, Hilden, Germany) following the manufacturer’s instructions. The amount of double-stranded DNA and the purity in the extracted DNA samples was measured by PicoGreen (Promega, Madison, WI, USA) using VICTOR Nivo (PerkinElmer, Waltham, MA, USA). Per the Illumina 16S Metagenomic Sequencing Library protocols, the V3-V4 region of 18S ribosomal DNA (rDNA) gene in each sample was amplified by PCR using the following primers: 18S amplicon PCR forward primer, 5′–TCGTCGGCAGCGTCAGATGTGTATAAGAGACAGCCAGCASCYGC GGTAATTCC-3′, reverse primer, 5′–GTCTCGTGGGCTCGGAGATGTGTATAAG -AGACAGACTTTCGTTCTTGATYRA-3′ [25]. A subsequent amplification step with limited-cycle reaction was performed to add multiplexing indices and Illumina sequencing adapters. The PCR products were pooled, cleaned, and normalized using the PicoGreen, and the size of libraries was measured using a TapeStation DNA screen tape D1000 (Agilent Technologies, Santa Clara, CA, USA). Sequence libraries in the sample were verified using the MiSeq™ platform (Illumina, San Diego, CA, USA).

2.3. Customized Dinoflagellate Reference Databases for CLC Workflows

For the DNA reference databases of dinoflagellates, a list of 1555 species of dinoflagellates named in a previous study [26] was prepared in the form of Excel data, and the reference database deposited in the NCBI was additionally downloaded. A total of approximately 5000 dinoflagellate reference databases were retrieved. The files were imported into CLC and customized for use as databases specified for analyzing dinoflagellate species. The analysis program used in this study was CLC Genomics Workbench 21.0.4 with CLC Microbial Genomics Module 21.0 (CLC Bio, Qiagen Company, Aarhus, Denmark) and was used for future species identification (Figure S1).

2.4. Data Quality Control and Taxonomic Profiling

Data quality control and taxonomic profiling were performed using the CLC Microbial Genomics Module (MGM). First, Reads were trimmed using the Trim Reads tool. The percentage of trimmed from approximately 300,000 reads per sample was 71% (n = 16). We trimmed the 5′ and 3′ terminal nucleotides of the reads, and discarded unqualified reads showing that the quality limit was less than 0.001 or ambiguous nucleotides were more than two. The average length of reads after trimming was between 217–234 bp. Samples with less than 100 reads (minimum percent from the median = 50.0) were removed. Second, the remaining qualified reads were used for operational taxonomic unit (OTU) clustering based on SILVA 18s v132 Database including 1555 dinoflagellates at a 97% sequence similarity. The detected chimeric sequences and singletons (Chimera crossover cost = 3, K-mer size = 6) were discarded. A phylogenetic tree using the neighbor-joining method with 100 replicates was constructed based on the aligned OTU sequences by the MUSCLE tool v3.8.425. The phylogeny was applied for alpha and beta diversity measures. The beta diversity was measured using the Euclidean distance, and principal coordinate analysis (PCoA) based on a Bray–Curtis dissimilarity matrix was performed to illustrate a hierarchical clustering heat map showing the correlation between the examined samples.

3. Results

3.1. Environmental Characteristics of Sampling Sites

The four selected sampling sites had different geological and environmental characteristics. All the regions showed four distinct seasons; however, there was a regional difference in water temperature. The month of March showed the lowest water temperature (6.4–14.3 °C) throughout the region, and September (20.1–26.3 °C) showed the highest water temperature. On average, the water temperature at Jeju Island (Seongsan) was higher than that of the land. The salinity did not show a significant difference by region (31.4–33.7‰), and the pH and dissolved oxygen amount also did not show significant regional changes (Figure 1b).

3.2. Metagenome Comparisons

A pipeline for metagenomics analysis of environmental DNA samples was developed to address the identification of dinoflagellates species. On average, over 300,000 reads were acquired from each region using the MiSeq™ platform (Illumina, San Diego, CA, USA), with a read length of 301 bp. After quality trimming and filtering of reads, 70.3% of the raw reads remained (Figure 2a), with an overall higher G+C content for reads obtained from the library.
The nucleotide sequence similarity of the dinoflagellate genes was expressed by region using PCoA to illustrate the overall regional similarity according to the season. The December samples for Gunsan, Tongyeong, and Seongsan showed similarities, and the March samples of Pohang, Tongyeong, and Seongsan were also similar. The June and September samples of Tongyeong, in which a single species bloomed and became dominant, showed no similarity with the other samples. Furthermore, low similarity was found at Gunsan in June compared with the other samples (Figure 2b).

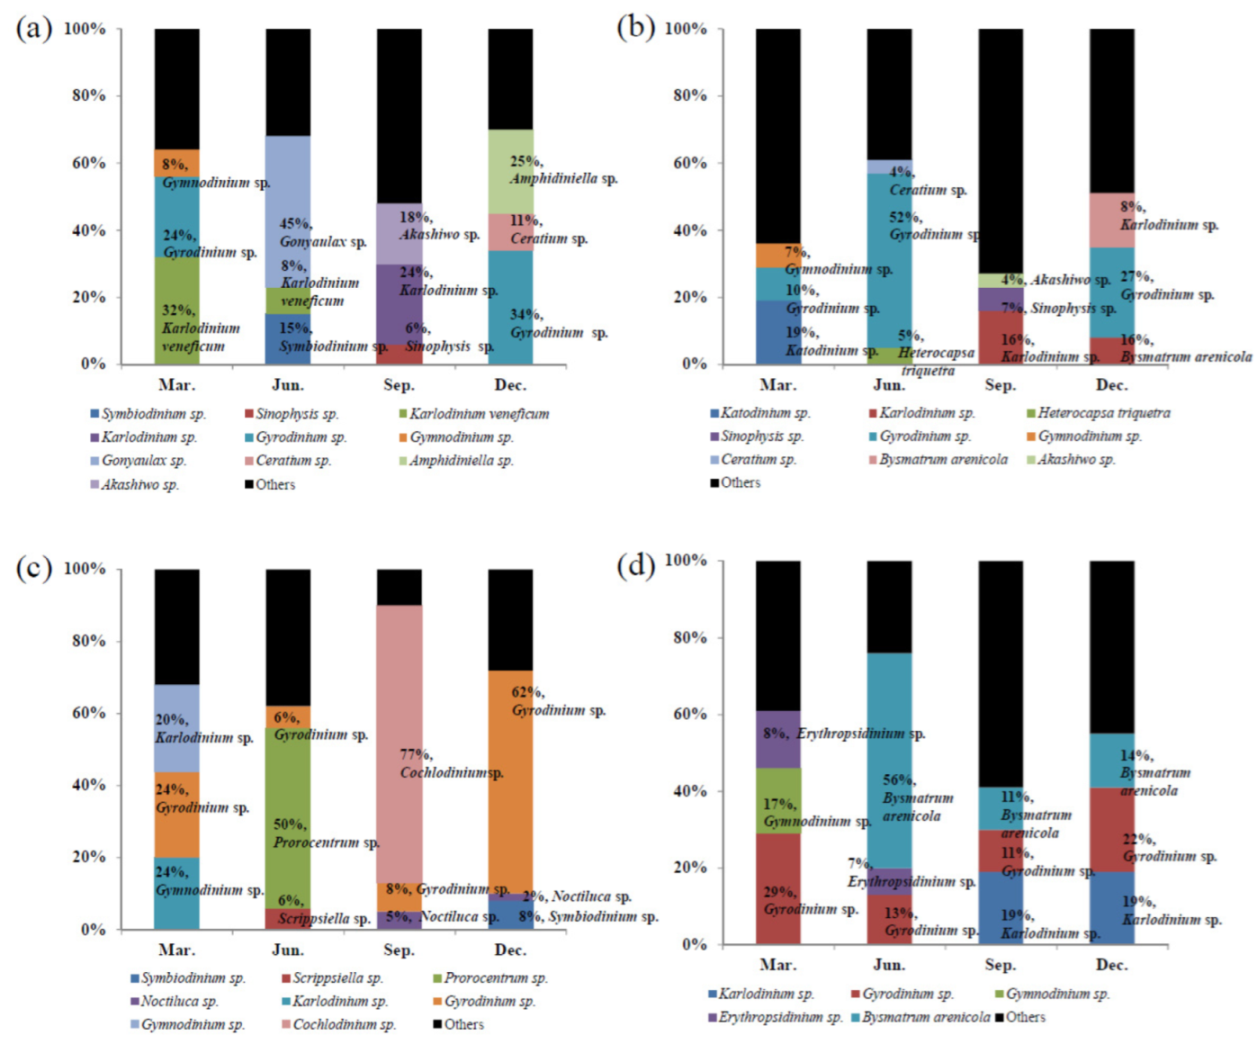
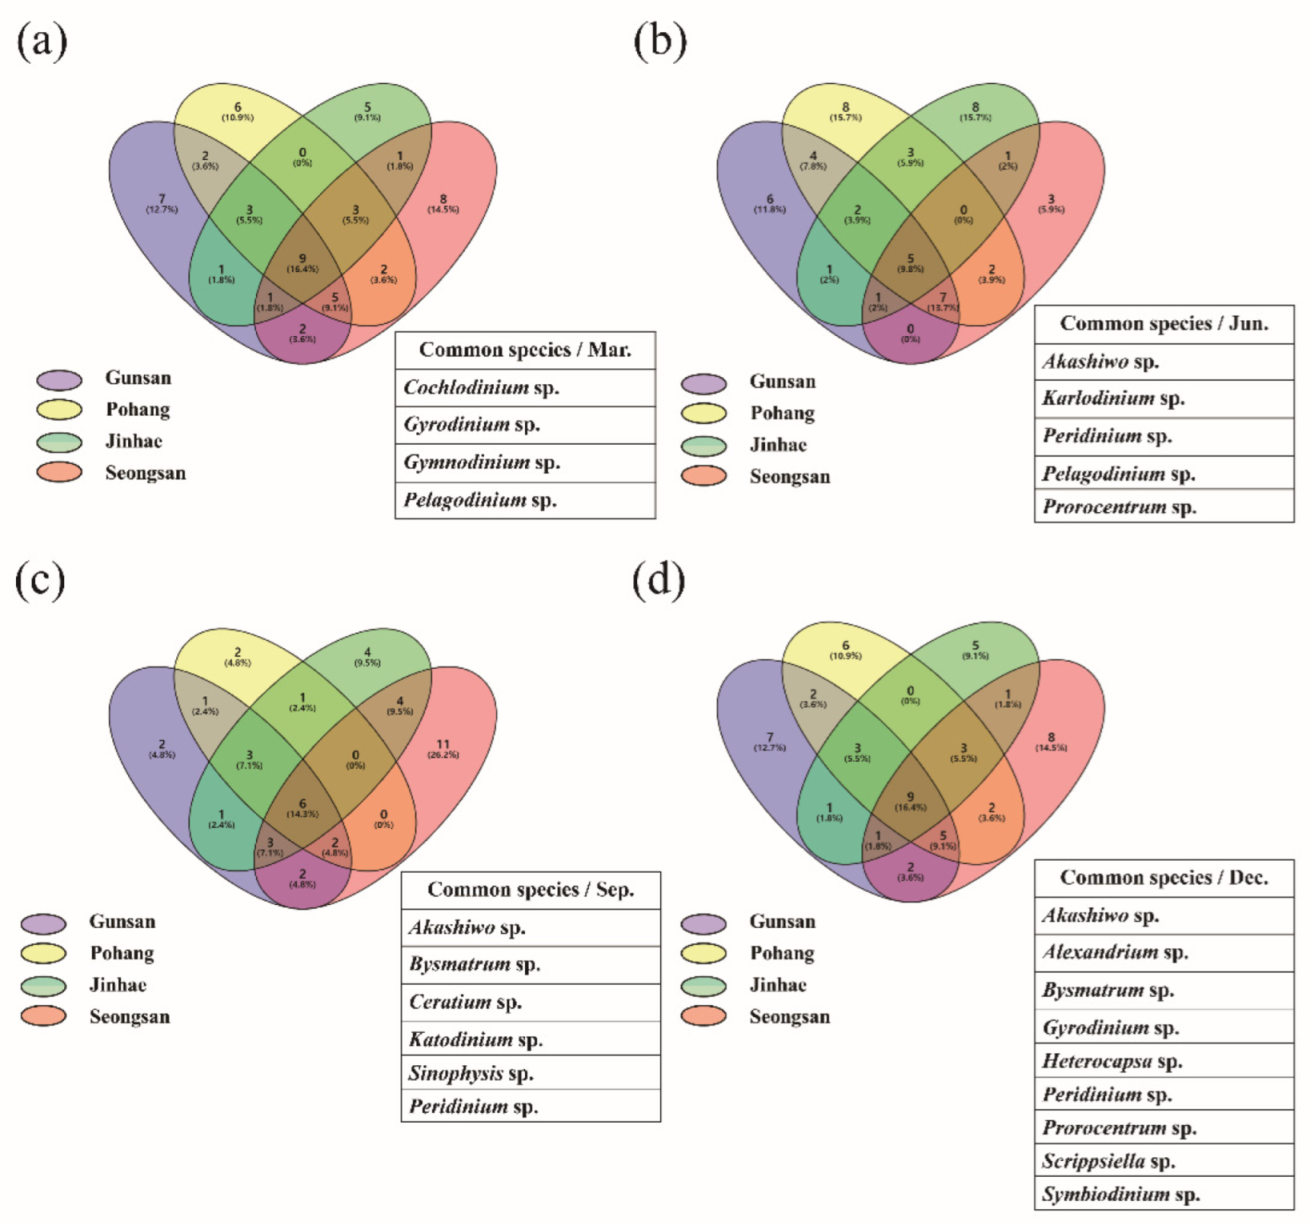
3.3. Metagenomic Analysis of the Dinoflagellate Species Composition

To identify marine dinoflagellates, we used the CLC genomics workbench program (CLC Microbial Genomics Module) on the assembled read sequences, followed by BLAST searches on the NCBI database and the newly created database of 1555 dinoflagellate species. Following the metagenomic analysis, 64 species of dinoflagellate were found in all regions on average. The top 10 dinoflagellates were selected based on the analyzed reads (Table 1).
In Gunsan, the western coast, the highest number of reads detected by metagenomics data was seen in December (Table 1a). In March, two species (Karlodinium veneficum and Gyrodinium sp.) were dominant. When the ratio (%) of the top 10 species was calculated based on the total reads matched with dinoflagellate sequence, Karlodinium veneficum was the most dominant species, approximately 32%. Next, Gyrodinium sp. (24%) and Gymnodinium sp. (8%). In June, the composition of Gonyaulax sp. showed approximately 45%, followed by that of Symbiodinium sp. (15%) and Karlodinium veneficum (8%). Similar to March, the dominant species in September was Karlodinium sp., which accounted for 24%. In December, Gyrodinium sp. (34%) and Amphidiniella sp. (25%) were dominant as well as Ceratium sp. which accounted for 11% (Table 1b, Figure 3a).
In Pohang, the eastern coast, Gyrodinium sp. was dominant in June and December, Katodinium sp. was dominant in March, and Karlodinium sp. was dominant in September. (Table 1, Figure 3b). In Tongyeong, the southern coast, the appearance of Gyrodinium sp. was high in March and December, and was dominant at 24% and 62%, respectively. In particular, Cochlodinium sp. formed a red tide and dominated over 77%, and in June, the dominance of Prorocentrum sp. was more than 50%. The diversity was the highest in December, when 28 species of dinoflagellate reads were detected (Table 1, Figure 3c). In Seongsan, Gyrodinium sp. appeared at a high rate in all seasons, while Bysmatrum arenicola and Karlodinium veneficum dominated in June (56%) and September (19%), respectively. The sand-dwelling dinoflagellate Bysmatrum arenicola was dominant at Seongsan, except in March (Table 1, Figure 3d).
Figure 4 illustrates the most common species in the four coastal waters. In March, there were three common species at all sampling sites: Cochlodinium sp., Gyrodinium sp. Gymnodinium sp., and Pelagodinium sp. The most common species in June were Akashiwo sp., Karlodinium sp., Peridinium sp., Pelagodinium sp., and Prorocentrum sp. In September, Akashiwo sp., Bysmatrum sp., Ceratium sp., Katodinium sp., Sinophysis sp., and Peridinium sp. were common. The common species in December were Akashiwo sp., Alexandrium sp., Bysmatrum sp., Gyrodinium sp., Hetrocapsa sp., Peridiniopsis sp., Prorocentrum sp., Scrippsiella sp., and Symbiodinium sp.

3.4. Comparison of Metagenomic Analysis and Microscopic Observation

When the abundance of dinoflagellates was analyzed by microscopic observation, the number of species composition was mostly lower than from metagenomic analysis (Table 2). Overall, the number of species in December was lower than in other seasons, as the biomass was considerably low and mainly dominated by diatoms. At Gunsan, the abundance of Gyrodinium sp. species was 0.8–2.9 cells mL−1 in March, September, and December, which showed similar patterns to the metagenomic analysis. In Pohang, the species composition in June was more diverse than in the other seasons, and two species of Heterocapsa rotundata (77.8 cells mL−1) and Heterocapsa triquetra (12.1 cells mL−1) were dominant. Similarly, the number of reads of Heterocapsa triquetra detected by the metagenomic analysis in the same sample were high. In Tongyeong, cell abundance of Prorocentrum triestinum (June) and Cochlodinium polykrikoides (September) was 341.1 and 2034 cells mL−1, respectively, which was similar to the metagenome result that the number of reads of Prorocentrum sp. and Cochlodinium sp. was 11,335, and 53,412, respectively. Small thecated dinoflagellate species, such as Azadinium sp. and Bysmatrum sp., occurred in the Seongsan region, located at Jeju Island. Some small nano-planktonic dinoflagellates, which are difficult to identify by microscopy, were easily found at Seongsan and Tongyeong using the metagenomic analysis (Table 2).
Although not all species of dinoflagellates identified by microscopic observation were included in the metagenomic analysis, the appearance of dominant species was found to be quite similar (Table 2).

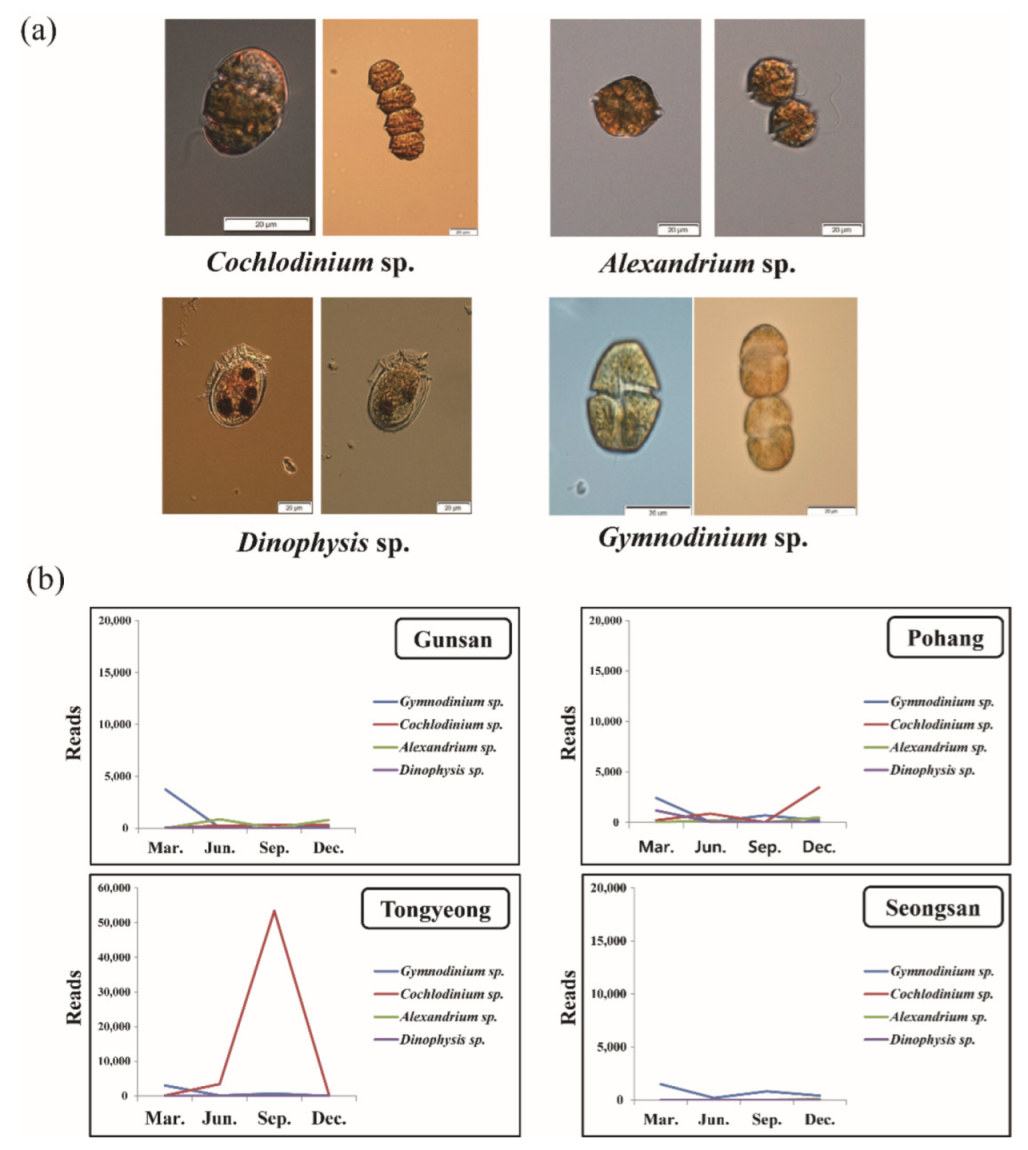
3.5. Seasonal Distribution of Harmful Species Based on Metagenomic Analysis

Four species of dinoflagellates (Cochlodinium sp., Alexandrium spp., Dinophysis spp., and Gymnodinium sp.) were selected as the causative species of red tide formation or toxin production in Korean waters (Figure 5a), and their seasonal distribution characteristics based on the number of reads through metagenomic analysis was confirmed by region. In Gunsan, the reads of Gymnodinium sp. were considerable in March, and Dinophysis spp. appeared in June and September. In Pohang, Gymnodinium sp. was relatively high in March, and Cochlodinium sp. was also detected at a high distribution in December. In Tongyeong, the abundance of Cochlodinium sp. was especially high in September, when a red tide from this species was occurring. In Seongsan, the appearance of Gymnodinium sp. in March and September was revealed by microscopic observation (Figure 5b). Based on these findings, the seasonal distribution of red tide-causing species, which was not confirmed by microscopic observation, was confirmed using metagenomic analysis.

4. Discussion

Approximately 300 dinoflagellate species are known to cause red tides and produce toxins worldwide, and these harmful events are increasing with changes in human activities and the environment [4]. Toxic dinoflagellate blooms frequently occur in the southern coastal waters of Korea, where many cage fish farms are located. As shown in Table 1, Cochlodinium sp. were dominant at Tongyeong in September according to NGS, which corresponds to the cell abundance counted by microscopic observation. In June, the NGS result that Prorocentrum sp. were mainly observed at Tongyeong was similar to the occurrence detected by microscopy analysis at this location. In addition, Karlodinium sp., which produces Karlotoxin and induces hemolytic and cytotoxic activity associated with fish mortality, appeared in our NGS results [27].
In a situation where the morphological analysis method is the dominant method for diagnosing harmful dinoflagellates off Korean coasts, diagnosis using molecular biology is considered to be a more objective number, and the development of technology through this method can lead to the development of new monitoring techniques [28]. Moreover, if NGS technology has been developed and applied to the monitoring of marine organisms, it is possible to simultaneously analyze a large amount of mixed samples and save the effort and time of long-term monitoring and research analysis [29,30,31].
Monitoring of marine microalgae using NGS has been used by many researchers because of its various advantages [11]. Metagenomic analysis using NGS has revealed a significant number of phytoplankton taxa previously missed by microscopy in recent efforts to sequence marine microorganisms [32]. Our study also revealed a significant number of dinoflagellate communities that could not be distinguished microscopically. The genetic analysis method used in this study, especially high-throughput sequencing, has shown effectiveness in the study of phytoplankton diversity and ecology, and it is considered that it can potentially replace the microscopic identification and population quantification methods currently used.
Light microscopy, which has been used for morphological classification and population evaluation, requires an extensive amount of consideration. Underestimation of phytoplankton, including dinoflagellates, in microscopic samples results in cell loss of taxa during preservation, storage, and handling, preferentially after treatment of samples with fixing fluid. Further, when counting cells, a sedimentation chamber is commonly used, which means that smaller cells that do not sink sufficiently are less counted or missed [33]. Moreover, identification of small dinoflagellates using microscopy is not easy when their cell size is under 20 µm with similar morphologies when fixed with Lugol’s solution [34]. We found that a significant number of dinoflagellate species were confirmed by metagenomic analysis compared to that by microscopic analysis. The small dinoflagellate cells which were classified as ‘small naked dinoflagellate’ were positively identified as species belonging to the genera Amphidiniopsis, Biecheleria, Gymnodinium, Gyrodiniellum, Paragymnodinium, Pelagodinium, and Symbidinium, while ‘small thecated dinoflagellate’ included Apicoporus, Azadinium, Crypthecodinium, Durinskia, Heterocapsa, and Pfiesteria. In particular, the sand-dwelling dinoflagellate Bysmatrum arenicola, which is easily confused with Scrippsiella [35] in microscopic analysis, was found in the metagenomic analysis in June at Seongsan (Figure 3d). This suggests that the metagenomic analysis was more extensive.
Although the NGS technique showed a high resolution for species identification compared to that with conventional microscopic analysis, further studies are required for development of an understanding of the spatial and seasonal dynamics of the dinoflagellate community using NGS-based metagenomics. Thus far, molecular markers based on ribosomal DNA have usually been used to identify the species, even among relatives [36]. However, this approach is limited by interspecific divergence, while it is difficult to distinguish intraspecific variation. As the reference database of dinoflagellates via the NGS method in this study was established based on 18S rDNA sequences, the relative proportions of some dinoflagellates in field samples could be misidentified in the presence of other dinoflagellates which were similar. Large subunit (LSU) rDNA sequences of Prorocentrum species containing P. rhathymum, P. mexicanum, and P. cf. rhathymum, which are toxic, were closer to the relatives, showing 0.1–0.9% dissimilarity, and small subunit rDNA (SSU) sequences of most of these are nearly identical [37]. Edvardsen et al. [38] reported that SSU rDNA sequences among Dinophysis acuminata, Dinophysis acuta, and Dinophysis norvegica show approximately 0.3% distance, and differences of LSU rDNA sequences among these species show 0.4–1.6% distance. Moreover, species whose sequences are not available in the GenBank are hardly detected despite their potential presence in the sample analyzed by the NGS technique because of the absence of deposited sequences. To distinguish intraspecific similarity of the above-mentioned species, establishment of a reference database via the NGS technique based on biomarkers such as cytochrome c oxidase I (COX1) and the cytochrome b (COB) gene which allows for the unambiguous identification of the species should be developed.
Metagenomic analysis of marine biodiversity and abundance based on NGS will provide precise indicators for understanding biological patterns and characteristics of species in different habitats. Given the lack of molecular reference library databases, it is necessary to collect vast amounts of sequence information targeting biomarkers such as SSU, LSU, COX1, and COB genes. However, in this study, we established a reference database of dinoflagellates that occur in the coastal waters of Korea based on SSU rDNA sequences using the NGS technique and analyzed field samples in the presence of this NGS reference database library. We expect that the newly established reference database via the NGS will provide a better understanding of the seasonal dynamics of toxic dinoflagellates, as well as a complementary approach to conventional microscopic analysis for monitoring dinoflagellate community compositions.

5. Conclusions

This study integrated analyses of high-resolution dinoflagellate community composition and distribution in South Korea. Altogether, the results presented here reveal a complex dinoflagellate community pattern. The NGS-based (18S rRNA amplicon) metagenomics were able to detect dinoflagellates with low abundance, and allow continuous monitoring of the phytoplankton community in environmental samples even though numerous DNA samples were simultaneously collected compared to the conventional microscopic analysis. Our analysis suggested that NGS-based characterization of the 18S rRNA gene holds great promise as a tool for phytoplankton monitoring, as it allows for simultaneous regional cluster analysis monitoring in a high-throughput, reproducible, and cost-effective manner.
In today’s world, which requires advances in environmental monitoring due to large-scale blooming of toxic algae and international regulations regarding their toxic substances, this study provides a technique for the rapid evaluation of environmental samples for existing taxa of major dinoflagellates and potentially harmful/invasive species. In addition, the extension of the reference database presented in this study and addition of the species list can further expand the taxonomic scope so it can be applied to real-time monitoring of temporal dynamics and species diversity problems of harmful algal blooms in a wide range of waters.

Supplementary Materials

The following supporting information can be downloaded at: https://www.mdpi.com/article/10.3390/microorganisms10071459/s1, Figure S1: Workflow chart for metagenome analysis, Using CLC Genomics Workbench program. Supplementary Table S1.

Author Contributions

Conceptualization, J.H., H.W.K. and. J.P.; field investigation, S.J.M., J.-H.H., and E.S.L.; software, J.H.; validation and formal analysis, J.H. and J.-H.H.; data curation, J.P; writing—original draft preparation, J.H.; writing—review and editing, J.H. and J.P. All authors have read and agreed to the published version of the manuscript.

Funding

This study was supported by the project ‘Development of aquaculture technology for pomfrets as an endemic fish species on West Sea’ (R2022005) of National Institute of Fisheries Science (NIFS), Incheon, South Korea, and supported by the National Research Foundation of Korea (NRF) grant funded by the Korea government (MSIT)(NRF-2021R1A2C1005943).

Data Availability Statement

Not applicable.

Acknowledgments

We thank E.J.K. for field sampling. We thank the reviewers for their comments.

Conflicts of Interest

The authors declare no conflict of interest.

References

  1. Lessard, E.J. Oceanic Heterotrophic Dinoflagellates: Distribution, Abundance, and Role as Microzooplankton; Rhode Island University: Kingston, NY, USA, 1984. [Google Scholar]
  2. Jeong, H.J.; Yoo, Y.D.; Kim, J.S.; Seong, K.A.; Kang, N.S.; Kim, T.H. Growth, feeding and ecological roles of the mixotrophic and heterotrophic dinoflagellates in marine planktonic food webs. Ocean Sci. J. 2010, 45, 65–91. [Google Scholar] [CrossRef] [Green Version]
  3. Kwon, H.-K.; Ortiz, L.C.; Vukasin, G.D.; Chen, Y.; Shin, D.D.; Kenny, T.W. An oven-controlled MEMS oscillator (OCMO) with sub 10 MW, ±1.5 ppb stability over temperature. In Proceedings of the 2019 20th International Conference on Solid-State Sensors, Actuators and Microsystems & Eurosensors XXXIII (TRANSDUCERS & EUROSENSORS XXXIII), Berlin, Germany, 23–27 June 2019; pp. 2072–2075. [Google Scholar]
  4. Zohdi, E.; Abbaspour, M. Harmful algal blooms (red tide): A review of causes, impacts and approaches to monitoring and prediction. Int. J. Environ. Sci. Technol. 2019, 16, 1789–1806. [Google Scholar] [CrossRef]
  5. Couet, D.; Pringault, O.; Bancon-Montigny, C.; Briant, N.; Poulichet, F.E.; Delpoux, S.; Yahia, O.K.-D.; Hela, B.; Herve, F.; Rovillon, G. Effects of copper and butyltin compounds on the growth, photosynthetic activity and toxin production of two HAB dinoflagellates: The planktonic Alexandrium catenella and the benthic Ostreopsis cf ovata. Aquat. Toxicol. 2018, 196, 154–167. [Google Scholar] [CrossRef] [PubMed] [Green Version]
  6. Chakraborty, S.; Pančić, M.; Andersen, K.H.; Kiørboe, T. The cost of toxin production in phytoplankton: The case of PST producing dinoflagellates. ISME J. 2019, 13, 64–75. [Google Scholar] [CrossRef]
  7. Jantschke, A.; Pinkas, I.; Schertel, A.; Addadi, L.; Weiner, S. Biomineralization pathways in calcifying dinoflagellates: Uptake, storage in MgCaP-rich bodies and formation of the shell. Acta Biomater. 2020, 102, 427–439. [Google Scholar] [CrossRef]
  8. Choi, H.; Liu, X.; Kim, H.I.; Kim, D.; Park, T.; Song, S. A Facile Surface Passivation Enables Thermally Stable and Efficient Planar Perovskite Solar Cells Using a Novel IDTT-Based Small Molecule Additive. Adv. Energy Mater. 2021, 11, 2003829. [Google Scholar] [CrossRef]
  9. Chan, K.K.; Tan, T.J.; Narayanan, K.K.; Procko, E. An engineered decoy receptor for SARS-CoV-2 broadly binds protein S sequence variants. Sci. Adv. 2021, 7, eabf1738. [Google Scholar] [CrossRef]
  10. Lee, E.S.; Kim, E.-K.; Choi, Y.-H.; Jung, Y.H.; Kim, S.Y.; Koh, J.W.; Choi, E.K.; Cheon, J.-E.; Kim, H.-S. Factors associated with neurodevelopment in preterm infants with systematic inflammation. BMC Pediatrics 2021, 21, 114. [Google Scholar] [CrossRef]
  11. Muhammad, B.L.; Kim, T.; Ki, J.-S. 18S rRNA analysis reveals high diversity of phytoplankton with emphasis on a naked Dinoflagellate Gymnodinium sp. at the Han river (Korea). Diversity 2021, 13, 73. [Google Scholar] [CrossRef]
  12. Akbar, M.A.; Sang, J.; Khan, A.A.; Amin, F.-E.; Hussain, S.; Sohail, M.K.; Xiang, H.; Cai, B. Statistical analysis of the effects of heavyweight and lightweight methodologies on the six-pointed star model. IEEE Access 2018, 6, 8066–8079. [Google Scholar] [CrossRef]
  13. Gran-Stadniczeñko, S.; Egge, E.; Hostyeva, V.; Logares, R.; Eikrem, W.; Edvardsen, B. Protist diversity and seasonal dynamics in Skagerrak plankton communities as revealed by metabarcoding and microscopy. J. Eukaryot. Microbiol. 2019, 66, 494–513. [Google Scholar] [CrossRef] [PubMed]
  14. Caporaso, J.G.; Kuczynski, J.; Stombaugh, J.; Bittinger, K.; Bushman, F.D.; Costello, E.K.; Fierer, N.; Peña, A.G.; Goodrich, J.K.; Gordon, J.I.; et al. QIIME allows analysis of high-throughput community sequencing data. Nat. Methods 2010, 7, 335–336. [Google Scholar] [CrossRef] [Green Version]
  15. Kuczynski, J.; Stombaugh, J.; Walters, W.A.; González, A.; Caporaso, J.G.; Knight, R. Using QIIME to analyze 16S rRNA gene sequences from microbial communities. Curr. Protoc. Microbiol. 2012, S27, 1E.5.1–1E.5.20. [Google Scholar] [CrossRef] [PubMed] [Green Version]
  16. Osman, E.O.; Suggett, D.J.; Voolstra, C.R.; Pettay, D.T.; Clark, D.R.; Pogoreutz, C.; Sampayo, E.M.; Warner, M.E.; Smith, D.J. Coral microbiome composition along the northern Red Sea suggests high plasticity of bacterial and specificity of endosymbiotic dinoflagellate communities. Microbiome 2020, 8, 1–16. [Google Scholar]
  17. Jaeckisch, N.; Yang, I.; Wohlrab, S.; Glöckner, G.; Kroymann, J.; Vogel, H.; Cembella, A.; John, U. Comparative genomic and transcriptomic characterization of the toxigenic marine dinoflagellate Alexandrium ostenfeldii. PLoS ONE 2011, 6, e28012. [Google Scholar] [CrossRef] [Green Version]
  18. Eichholz, K.; Beszteri, B.; John, U. Putative monofunctional type I polyketide synthase units: A dinoflagellate-specific feature? PLoS ONE 2012, 7, e48624. [Google Scholar] [CrossRef] [PubMed] [Green Version]
  19. Price, D.C.; Farinholt, N.; Gates, C.; Shumaker, A.; Wagner, N.E.; Bienfang, P.; Bhattacharya, D. Analysis of G. ambierdiscus transcriptome data supports ancient origins of mixotrophic pathways in dinoflagellates. Environ. Microbiol. 2016, 18, 4501–4510. [Google Scholar] [CrossRef]
  20. Liu, H.; Stephens, T.G.; González-Pech, R.A.; Beltran, V.H.; Lapeyre, B.; Bongaerts, P.; Cooke, I.; Aranda, M.; Bourne, D.G.; Forêt, S.; et al. Symbiodinium genomes reveal adaptive evolution of functions related to coral-dinoflagellate symbiosis. Commun. Biol. 2018, 1, 95. [Google Scholar] [CrossRef] [Green Version]
  21. Lim, A.S.; Jeong, H.J. Benthic dinoflagellates in Korean waters. Algae 2021, 36, 91–109. [Google Scholar] [CrossRef]
  22. Kim, H.S.; Yih, W.; Kim, J.H.; Myung, G.; Jeong, H.J. Abundance of epiphytic dinoflagellates from coastal waters off Jeju Island, Korea during autumn 2009. Ocean Sci. J. 2021, 46, 205–209. [Google Scholar] [CrossRef] [Green Version]
  23. Kim, H.S.; Kim, S.H.; Jung, M.M.; Lee, J.B. New record of dinoflagellates around Jeju Island. J. Ecol. Environ. 2013, 36, 273–291. [Google Scholar] [CrossRef] [Green Version]
  24. Shah, M.; Rahman, M.; An, S.J.; Lee, J.B. Seasonal abundance of epiphytic dinoflagellates around coastal waters of Jeju Island, Korea. J. Mar. Sci. Technol. 2013, 21, 20. [Google Scholar]
  25. Stoeck, T.; Bass, D.; Nebel, M.; Christen, R.; Jones, M.D.; Breiner, H.W.; Richards, T.A. Multiple marker parallel tag environmental DNA sequencing reveals a highly complex eukaryotic community in marine anoxic water. Mol. Ecol. 2010, 19, 21–31. [Google Scholar] [CrossRef] [PubMed]
  26. Gómez, F. A list of free-living dinoflagellate species in the world’s oceans. Acta Bot. Croat. 2005, 64, 129–212. [Google Scholar]
  27. Llanos-Rivera, A.; Álvarez-Muñoz, K.; Astuya-Villalón, A.; López-Rosales, L.; García-Camacho, F.; Sánchez-Mirón, A.; Rodriguez, J. Sublethal Effects of the Toxic Alga Karlodinium veneficum on Fish. Res. Sq. 2021, 1, e1021203. [Google Scholar]
  28. Elleuch, J.; Ben Amor, F.; Barkallah, M.; Haj Salah, J.; Smith, K.F.; Aleya, L.; Fendri, I.; Abdelkafi, S. q-PCR-based assay for the toxic dinoflagellate Karenia selliformis monitoring along the Tunisian coasts. Environ. Sci. Pollut. Res. 2021, 28, 57486–57498. [Google Scholar] [CrossRef]
  29. Abad, D.; Albaina, A.; Aguirre, M.; Laza-Martínez, A.; Uriarte, I.; Iriarte, A.; Villate, F.; Estonba, A. Is metabarcoding suitable for estuarine plankton monitoring? A comparative study with microscopy. Mar. Biol. 2016, 163, 149. [Google Scholar] [CrossRef]
  30. Metfies, K.; von Appen, W.-J.; Kilias, E.; Nicolaus, A.; Nöthig, E.-M. Biogeography and photosynthetic biomass of arctic marine pico-eukaroytes during summer of the record sea ice minimum 2012. PLoS ONE 2016, 11, e0148512. [Google Scholar] [CrossRef] [Green Version]
  31. Langer, J.A.; Sharma, R.; Schmidt, S.I.; Bahrdt, S.; Horn, H.G.; Algueró-Muñiz, M.; Nam, B.; Achterberg, E.P.; Riebesell, U.; Boersma, M. Community barcoding reveals little effect of ocean acidification on the composition of coastal plankton communities: Evidence from a long-term mesocosm study in the Gullmar Fjord, Skagerrak. PLoS ONE 2017, 12, e0175808. [Google Scholar] [CrossRef]
  32. Chai, Z.Y.; He, Z.L.; Deng, Y.Y.; Yang, Y.F.; Tang, Y.Z. Cultivation of seaweed Gracilaria lemaneiformis enhanced biodiversity in a eukaryotic plankton community as revealed via metagenomic analyses. Mol. Ecol. 2018, 27, 1081–1093. [Google Scholar] [CrossRef]
  33. Loeffler, C.R.; Richlen, M.L.; Brandt, M.E.; Smith, T.B. Effects of grazing, nutrients, and depth on the ciguatera-causing dinoflagellate Gambierdiscus in the US Virgin Islands. Mar. Ecol. Prog. Ser. 2015, 531, 91–104. [Google Scholar] [CrossRef]
  34. Lee, S.Y.; Jeong, H.J.; Ok, J.H.; Kang, H.C.; You, J.H. Spatial-temporal distributions of the newly described mixotrophic dinoflagellate Gymnodinium smaydae in Korean coastal waters. Algae 2020, 35, 225–236. [Google Scholar] [CrossRef]
  35. Horiguchi, T.; Pienaar, R.N. Validation of Bysmatrum arenicola horiguchi et pienaar, sp. nov.(dinophyceae)(Note). J. Phycol. 2000, 36, 237. [Google Scholar] [CrossRef]
  36. Shearer, T.L.; Coffroth, M.A. DNA BARCODING: Barcoding corals: Limited by interspecific divergence, not intraspecific variation. Mol. Ecol. Resour. 2008, 8, 247–255. [Google Scholar] [CrossRef] [PubMed]
  37. Lim, A.S.; Jeong, H.J.; Jang, T.Y.; Kang, N.S.; Lee, S.Y.; Yoo, Y.D.; Kim, H.S. Morphology and molecular characterization of the epiphytic dinoflagellate Prorocentrum cf. rhathymum in temperate waters off Jeju Island, Korea. Ocean Sci. J. 2013, 48, 1–17. [Google Scholar] [CrossRef]
  38. Edvardsen, B.; Shalchian-Tabrizi, K.; Jakobsen, K.S.; Medlin, L.K.; Dahl, E.; Brubak, S.; Paasche, E. Genetic variability and molecular phylogeny of dinophysis species (dinophyceae) from norwegian waters inferred from single cell analyses of rDNA 1. J. Phycol. 2003, 39, 395–408. [Google Scholar] [CrossRef]
Figure 1. Location of sample sites and environmental indices at these sites (a) in four regions of Korean coastal waters (b).
Microorganisms 10 01459 g001
Figure 2. Comparison of metagenome libraries. Next-generation sequencing metadata including number of reads and trimmed reads (a), β-diversity (principal coordinate analysis (PCoA), dinoflagellate genotype composition (proportions) was measured by Bray–Curtis distances (b).
Microorganisms 10 01459 g002
Figure 3. Proportion of top 3 most abundant species in each coastal seawater by metagenome analysis. Gunsan (a), Pohang (b), Tongyeong (c), Seongsan (d).
Microorganisms 10 01459 g003
Figure 4. Seasonal common dinoflagellate species in 4 coastal waters by metagenome analysis. March (a), June (b), September (c), and December (d).
Microorganisms 10 01459 g004
Figure 5. Seasonal distribution of red-tide-causing species through metagenome analysis. Photo of red-tide-causing species (Cochlodinium sp., Alexandrium sp., Dinophysis sp., Gymnodinium sp.) taken under a light microscope (a), seasonal changes in red-tide-causing species (b).
Microorganisms 10 01459 g005
Table 1. Seasonal variations and distribution of dinoflagellates in four coastal waters (Gunsan, Pohang, Tongyeong, and Seongsan) by metagenomic analysis. Total dinoflagellate reads and unidentified reads (a), and proportion(%) of the 10 most common dinoflagellate species (b).
(a)
LocationMarchJuneSeptemberDecember
Dinoflagellate
Reads
UnidentifiedDinoflagellate
Reads
UnidentifiedDinoflagellate
Reads
UnidentifiedDinoflagellate ReadsUnidentified
Gunsan47,58816,26336,787308439,78014,26587,27311,245
Pohang34,64116,44576,43912,3047222462175,12114,332
Tongyeong12,397360622,549285569,468142569,81914,224
Seongsan8924206060,769899430,197496242,9278644
(b)
LocationMarchJuneSeptemberDecember
Proportion (%)SpeciesProportion (%)SpeciesProportion (%)SpeciesProportion (%)Species
Gunsan32.1Karlodinium veneficum45.2Gonyaulax sp.24.1Karlodinium sp.34.2Gyrodinium sp.
24.2Gyrodinium sp.15.3Symbiodinium sp.17.6Akashiwo sp.24.8Amphidiniella sp.
7.9Gymnodinium sp.7.9Karlodinium veneficum5.5Sinophysis sp.10.5Ceratium sp.
0.4Noctiluca scintillans6.3Ceratium sp.4.2Peridinium sp.4.5Heterocapsa triquetra
0.3Symbiodinium sp.3.1Pelagodinium sp.2.9Scrippsiella trochoidea2.5Karlodinium sp.
0.3Protoperidinium sp.2.4Dissodinium pseudolunula2.5Katodinium sp.2.4Peridinium sp.
0.3Pelagodinium sp.2.4Alexandrium sp.1.7Pelagodinium sp.2.1Noctiluca scintillans
0.2Scrippsiella sp.1.7Gyrodinium sp.1.3Gyrodinium sp.1.3Katodinium sp.
0.2Dinophysis sp.1.2Azadinium sp.0.8Cochlodinium sp.0.9Akashiwo sp.
0.2Ceratium sp.1.1Amphidiniopsis sp.0.5Ceratium sp.0.7Gonyaulax sp.
Pohang19.0Katodinium sp.52.1Gyrodinium sp.16.0Karlodinium sp.27.2Gyrodinium sp.
10.1Gyrodinium sp.4.9Heterocapsa triquetra6.8Sinophysis sp.16.2Bysmatrum arenicola
6.9Gymnodinium sp.4.0Ceratium sp.4.1Akashiwo sp.7.7Karlodinium veneficum
5.4Azadinium sp.3.7Karlodinium sp.1.5Paragymnodinium sp.7.4Akashiwo sp.
3.3Dinophysis sp.2.8Heterocapsa circularisquama1.5Peridinium sp.7.3Ceratium sp.
1.5Pelagodinium sp.2.1Gonyaulax sp.1.0Amphidiniella sp.4.6Cochlodinium sp.
1.4Ceratium sp.1.9Pelagodinium sp.1.0Ceratium sp.2.9Azadinium sp.
0.9Gonyaulax spinifera1.1Prorocentrum sp.0.5Bysmatrum arenicola1.5Katodinium sp.
0.9Gonyaulax sp.0.9Peridinium sp.0.4Pelagodinium sp.0.6Alexandrium sp.
0.8Erythropsidinium sp.0.6Cochlodinium sp.0.4Scrippsiella trochoidea0.6Peridinium sp.
Tong-yeong23.9Gyrodinium sp.50.2Prorocentrum sp.77.3Cochlodinium sp.62.3Gyrodinium sp.
23.6Gymnodinium sp.5.9Gyrodinium sp.7.9Gyrodinium sp.7.5Symbiodinium sp.
19.7Karlodinium veneficum5.6Scrippsiella sp.5.0Noctiluca scintillans1.5Noctiluca scintillans
0.9Cochlodinium sp.5.3Karlodinium sp.3.7Bysmatrum arenicola0.6Karlodinium sp.
0.9Pelagodinium sp.3.8Noctiluca sp.1.7Protoperidinium sp.0.6Alexandrium sp.
0.6Noctiluca scintillans3.5Neoceratium sp.0.9Karlodinium sp.0.6Peridinium sp.
0.3Akashiwo sp.1.3Heterocapsa sp.0.5Ceratium sp.0.6Amphidiniopsis sp.
0.2Paragymnodinium sp.1.1Blastodinium sp.0.4Erythropsidinium sp.0.5Heterocapsa triquetra
0.2Pfiesteria piscicida1.1Protodinium sp.0.4Akashiwo sp.0.4Cochlodinium sp.
1.0Chytriodinium sp.0.3Heterocapsa triquetra0.2Scrippsiella trochoidea
Seong-san29.1Gyrodinium sp.56.1Bysmatrum arenicola19.2Karlodinium veneficum22.4Gyrodinium sp.
16.6Gymnodinium sp.13.2Gyrodinium sp.11.1Bysmatrum arenicola19.3Karlodinium sp.
8.4Erythropsidinium sp.7.4Erythropsidinium sp. 11.0Gyrodinium sp.13.9Bysmatrum arenicola
3.9Karlodinium sp.5.6Karlodinium sp.10.4Ceratium sp.6.8Ceratium sp.
1.7Heterocapsa sp.1.6Ceratium sp.8.2Peridinium sp.5.5Akashiwo sp.
0.7Paragymnodinium sp. 1.3Pelagodinium sp.1217Akashiwo sp.2.3Heterocapsa sp.
0.3Azadinium sp.1.2Heterocapsa triquetra4.9Peridiniopsis sp.1.7Peridinium sp.
0.3Akashiwo sp.0.9Azadinium sp.4.0Gymnodinium catenatum1.5Azadinium sp.
0.2Cochlodinium sp.0.4Akashiwo sp.3.7Azadinium sp.1.1Noctiluca scintillans
0.2Pelagodinium sp.0.4Symbiodinium sp.2.6Heterocapsa circularisquama1.0Peridiniopsis sp.
Table 2. Species composition and cell number of dinoflagellates analyzed by microscopic observation. Seasonal (March, June, September, December) species composition in four coastal regions (Gunsan, Pohang, Tongyeong, Seongsan).
LocationMarchJuneSeptemberDecember
Cell/mLSpeciesCell/mLSpeciesCell/mLSpeciesCell/mLSpecies
Gunsan2.7Heterocapsa triquetra2.7Scrippsiella sp.0.8Gyrodinium sp.2.9Gymnodinium sp.
0.9Gyrodinium sp.2.5Ceratium fusus0.1Peridiniopsis sp. 2.9Gyrodinium sp.
0.9Prorocentrum micans2.5Heterocapsa rotundata0.1Protoperidinium divergence
0.9Pyrocystis lunula1.8Gonyaulax sp.
1.2Prorocentrum sp.
0.9Dissodinium pseudolunula
0.6Ceratium sp.
0.6Ceratium tripos
0.6Karlodinium sp.
0.6Prorocentrum micans
Pohang3.6Gymnodinium sp.77.8Heterocapsa rotundata1.7Heterocapsa rotundata0.4Gymnodinium sp.
1.8Gyrodinium sp.12.1Heterocapsa triquetra1.7Scrippsiella sp.
1.4Ceratium kofoidii7.8Gymnodinium sp.0.8Prorocentrum triestinum
1.2Alexandrium sp.4.3Protopeidinium pyriforme0.8Gymnodinium sp.
0.5Heterocapsa rotundata2.6Gyrodinium sp.0.8Gyrodinium sp.
2.6Ceratium kofoidii
1.7Alexandrium sp.
0.9Amphidinium operculatum
Tongyeong1.6*Small thecated dinoflagellate341.1Prorocentrum triestinum2034Cochlodinium polykrikoides1.6Gymnodinium sp.
0.7*Small naked dinoflagellate 18.0*Small naked dinoflagellate 28.8Karlodinium sp.
0.1Alexandrium sp.17.0*Small thecated dinoflagellate18.0Gyrodinium sp.
0.1Gymnodinium sp. 14.9Scrippsiella sp.5.4Prorocentrum sp.
0.1Karlodinium sp. 11.7Peridinium sp. 3.6Bysmatrum sp.
10.6Alexandrium sp.3.6Ceratium sp.
3.2Heterocapsa sp.1.8Alexandrium sp.
3.2Scrippsiella trochoidea1.8Heterocapsa sp.
2.1Protoperidinium sp.
1.1Gonyaulax sp.
1.1Gymnodinium sp.
Seongsan0.6*Small naked dinoflagellate5.8Azadinium sp.0.6*Small naked dinoflagellate1.3Bysmatrum sp.
0.2Bysmatrum sp.5.8Bysmatrum sp.0.5Peridiniopsis sp. 1.0Gymnodinium sp.
0.2Katodinium sp.5.4*Small naked dinoflagellate 0.3Gymnodinium sp. 0.3Gyrodinium sp.
0.2Prorocentrum sp. 2.4*Small thecated dinoflagellate 0.3Prorocentrum minimum
1.4Gymnodinium sp.
1.0Protoperidinium pellucidum
0.3Heterocapsa sp.
0.3Peridiniopsis sp.
0.3Prorocentrum sp.
0.3Protoperidinium sp.
0.3Woloszynskia sp.
*Small thecated dinoflagellates: Apicoporus, Azadinium, Crypthecodinium, Durinskia, Heterocapsa, Pfiesteria. *Small naked dinoflagellates: Amphidiniopsis, Biecheleria, Karlodinium, Gymnodinium, Gyrodiniellum, Paragymnodinium, Pelagodinium, Symbidinium.
Publisher’s Note: MDPI stays neutral with regard to jurisdictional claims in published maps and institutional affiliations.

