Article

Host Cyanobacteria Killing by Novel Lytic Cyanophage YongM: A Protein Profiling Analysis

1
College of Life Science, Hebei Normal University, Shijiazhuang 050024, China
2
College of Life Science and Technology, Beijing University of Chemical Technology, Beijing 100029, China
3
Department of Scientific Research Management, National Vaccine and Serum Institute, Beijing 100176, China
*
Author to whom correspondence should be addressed.
Microorganisms 2022, 10(2), 257; https://doi.org/10.3390/microorganisms10020257
Submission received: 13 December 2021 / Revised: 18 January 2022 / Accepted: 22 January 2022 / Published: 24 January 2022
(This article belongs to the Special Issue Phototrophic Bacteria)

Abstract

:
Cyanobacteria are autotrophic prokaryotes that can proliferate robustly in eutrophic waters through photosynthesis. This can lead to outbreaks of lake “water blooms”, which result in water quality reduction and environmental pollution that seriously affect fisheries and aquaculture. The use of cyanophages to control the growth of cyanobacteria is an important strategy to tackle annual cyanobacterial blooms. YongM is a novel lytic cyanophage with a broad host spectrum and high efficiency in killing its host, cyanobacteria FACHB-596. However, changes in cyanophage protein profile during infestation and killing of the host remains unknown. To characterize the proteins and its regulation networks involved in the killing of host cyanobacteria by YongM and evaluate whether this strain YongM could be used as a chassis for further engineering to be a powerful tool in dealing with cyanobacterial blooms, we herein applied 4D label-free high-throughput quantitative proteomics to analyze differentially expressed proteins (DEPs) involved in cyanobacteria host response infected 1 and 8 h with YongM cyanophage. Metabolic pathways, such as photosynthesis, photosynthesis-antennal protein, oxidative phosphorylation, ribosome, carbon fixation, and glycolysis/glycol-isomerization were significantly altered in the infested host, whereas DEPs were associated with the metabolic processes of photosynthesis, precursor metabolites, energy production, and organic nitrogen compounds. Among these DEPs, key proteins involved in YongM-host interaction may be photosystem I P700 chlorophyll-a apolipoprotein, carbon dioxide concentration mechanism protein, cytochrome B, and some YongM infection lysis-related enzymes. Our results provide comprehensive information of protein profiles during the invasion and killing of host cyanobacteria by its cyanophage, which may shed light on future design and manipulation of artificial cyanophages against water blooms.

1. Introduction

Water eutrophication is a global water pollution problem that causes massive production of cyanobacteria [1,2]. The latter can lead to a cyanobacteria bloom, causing huge economic and environmental losses [3,4,5]. Cyanophages are a group of viruses that specifically infect prokaryotic cyanobacteria [6,7,8,9], playing a very important role in the regulation of the population and influencing evolution [10]. These viruses are biological control agents and have great potential for controlling harmful blooms of cyanobacteria [11]. However, most reported cyanophages have strong host specificity, a narrow cyanobacteria-killing spectrum, and a long lysis cycle [12,13]. For example, MA-LMM01, isolated from Lake Mikata, Japan [14], could only infect a toxic strain of Microcystis aeruginosa and had a long incubation period [15,16]. The Podoviridae cyanophages Pf-WMP3 [17] and Pf-WMP4 [18] can infect the same host cyanobacteria, but with a narrow algaecidal spectrum. Infection experiments have shown that S-LBS1 takes about four days to induce cyanobacterial lysis, and only in strain TCC793 of Synechococcus sp. [19]. In addition, newly discovered cyanophages in the last 2–3 years, such as PA-SR01, only lysed Pseudanabaena sp. KCZY-C8 [20]. Mic1 was only infective to its host, Microcystis wesenbergii FACHB-1339 [21]. Cyanophages S-H68 and S-B68, isolated from Bohai Sea waters, had incubation periods as long as 41 and 49 h, respectively [22,23]. Cyanobacterial blooms are usually formed by mixed outbreaks of multiple cyanobacteria with a rapid reproduction rate [24,25]. Therefore, application of existing cyanophages to treat cyanobacterial blooms is limited [26,27].
Cyanophage infection of cyanobacteria involves multiple proteins, and conventional methods cannot systematically analyze their mechanisms of action in a high throughput fashion. The quantitative proteomics system is a powerful approach in investigating the pivotal proteins involved in the cyanophage’s infection of host cyanobacteria and deciphering the cyanobacteria-killing mechanism of cyanophages. Studies on Prochlorococcus sp. MED4 and its cyanophage P-SSP7 have shown that infection is followed by complex gene expression dynamics, but little is known about the initial cyanophage-host interactions [28]. The infection of the cyanophage S-SM1 with polycoccus WH8102 has been studied with an isotope-labeled proteomic approach to determine the uptake of extracellular nitrogen and its use in biosynthesis of viral and host proteins [29]. The effect on photosynthesis of the cyanophage P-TIM68 carrying PSI and PSII-related genes during infection of the Prochlorococcus host MIT9515 in tropical oceans showed that P-TIM68 may maintain or even manipulate host photosynthesis [30]. Genomics, proteomics, and transcriptomics have been used to trace Shine–Dalgarno sequence differences in Synechocystis sp., Microcystis aeruginosa, cyanophage, tobacco chloroplasts, and Arabidopsis chloroplasts [31]. However, off-label quantitative proteomics have not been used to investigate the mechanism of cyanophage infestation of host cyanobacteria. Also, further research is needed on the kinetics, phagocytosis pattern, and mechanism of interaction between the cyanophage and host [32].
The newly isolated Myoviridae cyanophage from water samples of Kunming Dianchi Lake, YongM, has efficient lysis characteristics and can rapidly infest and lyse its host Nostoc sp. FACHB-596 within 24 h. YongM was able to lyse 18 of 33 tested cyanobacteria strains, indicating a broad spectrum of lysis hosts. The lysis characteristics of YongM have been studied by exposure experiments and absorbance measurements. The color change of the host solution was not obvious 1 h after YongM infestation, but it turned yellow after 8 h, representing the lysis phase. This lysis efficiency is more rapid and efficient than any strain reported so far and it can be potentially applied to control cyanobacterial blooms. Therefore, the host cyanobacteria 1 and 8 h after YongM infestation were used for quantitative proteomic comparison. DEPs in the host were screened and the expression characteristics were bioinformatically analyzed. GO analysis revealed that after infection, most of the DEPs were associated with photosynthesis, light response, precursor metabolites and energy production, and metabolic processes of organic nitrogen compounds. KEGG pathway enrichment results indicated that metabolic pathways, such as photosynthesis, photosynthesis-antenna protein, oxidative phosphorylation, ribosome, carbon fixation, and glycolysis/glycoisomerization were significantly altered in the infested host cyanobacteria. In addition, there were several key, differentially expressed proteins, such as photosystem I P700 chlorophyll-a apolipoprotein, carbon dioxide concentration mechanism protein, and cytochrome B. These may serve as hotspots for the study of the YongM-host interaction mechanism. They can also provide genetic resources and a theoretical basis for future cyanophage transformation to produce efficient and broad-spectrum cyanophages, and to understand their interaction with the hosts.

2. Materials and Methods

2.1. Materials

The strain of host cyanobacteria FACHB-596 was obtained from a freshwater cyanobacteria culture bank at the Institute of Hydrobiology, Wuhan Academy of Sciences, China. Cyanophage YongM was isolated from water samples of the Dianchi Lake in Kunming, Yunnan. It was preserved in the Center for General Microbiology of Microbial Culture Collection Management Committee, Conservation Number: CGMCC No.18383.
BG-11 medium was purchased from Qingdao Hope Bio-Technology Co., Ltd, Qingdao, China. (product number: HB8793). Its ingredients include sodium nitrate, potassium hydrogen phosphate trihydrate, magnesium sulfate heptahydrate, calcium chloride dihydrate, citric acid, ammonium ferric citrate, EDTA, sodium carbonate, boric acid, manganese chloride monohydrate, zinc sulfate heptahydrate, copper sulfate pentahydrate, sodium molybdate dihydrate, and cobalt nitrate hexahydrate. A GXZ intelligent light incubator was purchased from Ningbo Jiangnan Instrument Factory, Ningbo, China (model number: GXZ-280B).

2.2. Separation, Purification, and Suspension Preparation

Samples of surface water were collected from Yunnan Dianchi (latitude: 24.964616, longitude: 102.666303) and centrifuged at 12,000× g for 20 min at 4 °C. The supernatant was filtered through 0.45 μm and 0.22 μm pore-sized nitrocellulose membranes (Merck Millipore Ltd., Shanghai, China). The filtrate was added to a volume ten times larger of FACHB-596 cyanobacteria in logarithmic growth solution. The solution was mixed and incubated until yellowing was evident. The procedure was repeated three times. The produced lysate was then serially diluted ten-fold with BG-11 medium and used in double-layer agar plate spread experiments. After the growth of phagocytic spots were observed, several individual spots were dug up and suspended in 5 mL of FACHB-596 growth suspension in logarithmic phase. The above phagocytic spot experiment was repeated after yellowing, until phagocytic spots of uniform shape and size were formed on the plate. The purified lysate was centrifuged at 5000× g for 10 min at 4 °C, producing a suspension of purified YongM in the supernatant.

2.3. Genome Enrichment and Extraction

High titer cyanophage-cyanobacteria culture lysate (30 mL) was centrifuged at 6000× g for 20 min, and the supernatant was sequentially filtered through 0.45 μm and 0.22 μm pore size nitrocellulose membranes. The filtrate was centrifuged in a density gradient at 4 °C for 1 h at 35,000× g using 20% (w/v) and 40% (w/v) sucrose solution freshly prepared within a week. After discarding the supernatant, the precipitate was resuspended with 200 µL of PBS (0.01 M, PH7.4) and the cyanophage genome was extracted using the Roche High Pure Viral Nucleic Acid Kit (Roche, Basel, Switzerland).

2.4. Infection and Sample Collection

The host culture, in logarithmic phase, was inoculated with a YongM suspension at an optimal MOI = 0.1 (experimental group T) whereas another sample was inoculated only with BG-11 medium (control group C). Each group was placed in a light incubator at 25 °C with a light intensity of 2000 lx and exposed to 12 h light-dark cycles. After 1 h and 8 h of inoculation, the cultures in both groups were gently shaken and a sample (3 mL) was taken immediately from each group. These samples were centrifuged at 6000× g for 15 min at 4 °C. The sediments were washed twice with PBS and stored at −80 °C for protein extraction and proteome sequencing.

2.5. Protein Extraction and Digestion

For extraction, lysis buffer (500 μL, 8 mM urea, 30 mM HEPES, 1 mM PMSF, 2 mM EDTA and 10 mM DTT) was added to alga cells, followed by a 5 min ultrasonic ice bath treatment (pulse on 2 s, pulse off 3 s, power 230 W). The supernatant was centrifuged at 2000× g for 30 min. DTT was added until the final concentration was 10 mM. After the samples were incubated at 56 °C for 1 h, IAM was quickly added to a final concentration of 55 mM and the solution was incubated in the dark for 1 h. The protein concentration was quantified by the Bradford method.
For digestion, 40 μg protein from each sample was centrifuged in ultrafiltration tubes with 3 K MCWO at 14,000× g (4 °C, 40 min) and the supernatant was discarded. The pellet was solubilized with 200 μL of 50 mM NH4HCO3 and was centrifuged at 4 °C for 40 min at 14,000× g, discarding the supernatant. The process was repeated twice. Trypsin (1 μg/μL) was added to the samples at a protein substrate to enzyme ratio of 30. The samples were incubated in water at 37 °C for 24 h. The digested samples were lyophilized and solubilized with 25 mM NH4HCO3 (30 μL per tube).

2.6. Proteome Sequencing

Desalted peptide mixtures were loaded onto a Acclaim PePmap C18-reversed phase column (75 μm × 2 cm, 3 μm, 100 Ǻ thermo scientific) and separated with a reversed phase C18 column (75 μm × 10 cm, 5 μm, 300 Ǻ, Agela Technologies, Tianjin, China) mounted on a Dionex ultimate 3000 nano LC system. Peptides were eluted using a gradient of 5–80% (v/v) acetonitrile in 0.1% formic acid over 45min at a flow rate of 300 nL min−1 combined with a Q Exactive mass spectrometer (Thermo Fisher Scientific, Waltham, MA, USA). The eluates were directly entered using Q—Exactive MS (Thermo Fisher Scientific, Waltham, MA, USA), setting in positive ion mode and data-dependent manner with full MS scan from 350–2000 m/z, full scan resolution at 70,000, MS/MS scan resolution at 17500.MS/MS, scan with minimum signal threshold 1 × 10⁵, isolation width at 2 Da. To evaluate the performance of this mass spectrometry on the Label-free samples, two dd-MS2 acquisition modes was used, AGC target 1 × 10⁵, normalized collision energy (NCE) was systemically examined 30, stepped 27%.

2.7. Data Analysis

The free software MaxQuant (version 1.6.0.1) (developed by Jürgen Cox & Matthias Mann in Max-Planck Institute for Biochemistry, Martinsried, Germany) was used for mass spectrometry data acquisition and quantitative processing. MSstats ANOVA in R software was used to assess the significance of differences. DEPs were defined as those with fold change (FC) greater than or equal to 1.2, or less than 0.833, between experimental and control groups by t-test p < 0.05. The PCA analysis, volcanic maps, heat map of DEPs clustering, and associated variance data were analyzed by GraphPad Prism (8.0.2) and R Package (V.2.0.3). To determine the biological role of DEPs, we used Gene Ontology (GO) analysis with the Gene Ontology database and the annotation and classification of proteins according to the three aspects of GO analysis, namely biological processes, cellular components, and molecular functions. The Kyoto Encyclopedia of Genes and Genomes database (KEGG) was used to identify DEP-related metabolic and signal transduction pathways.

3. Results and Analysis

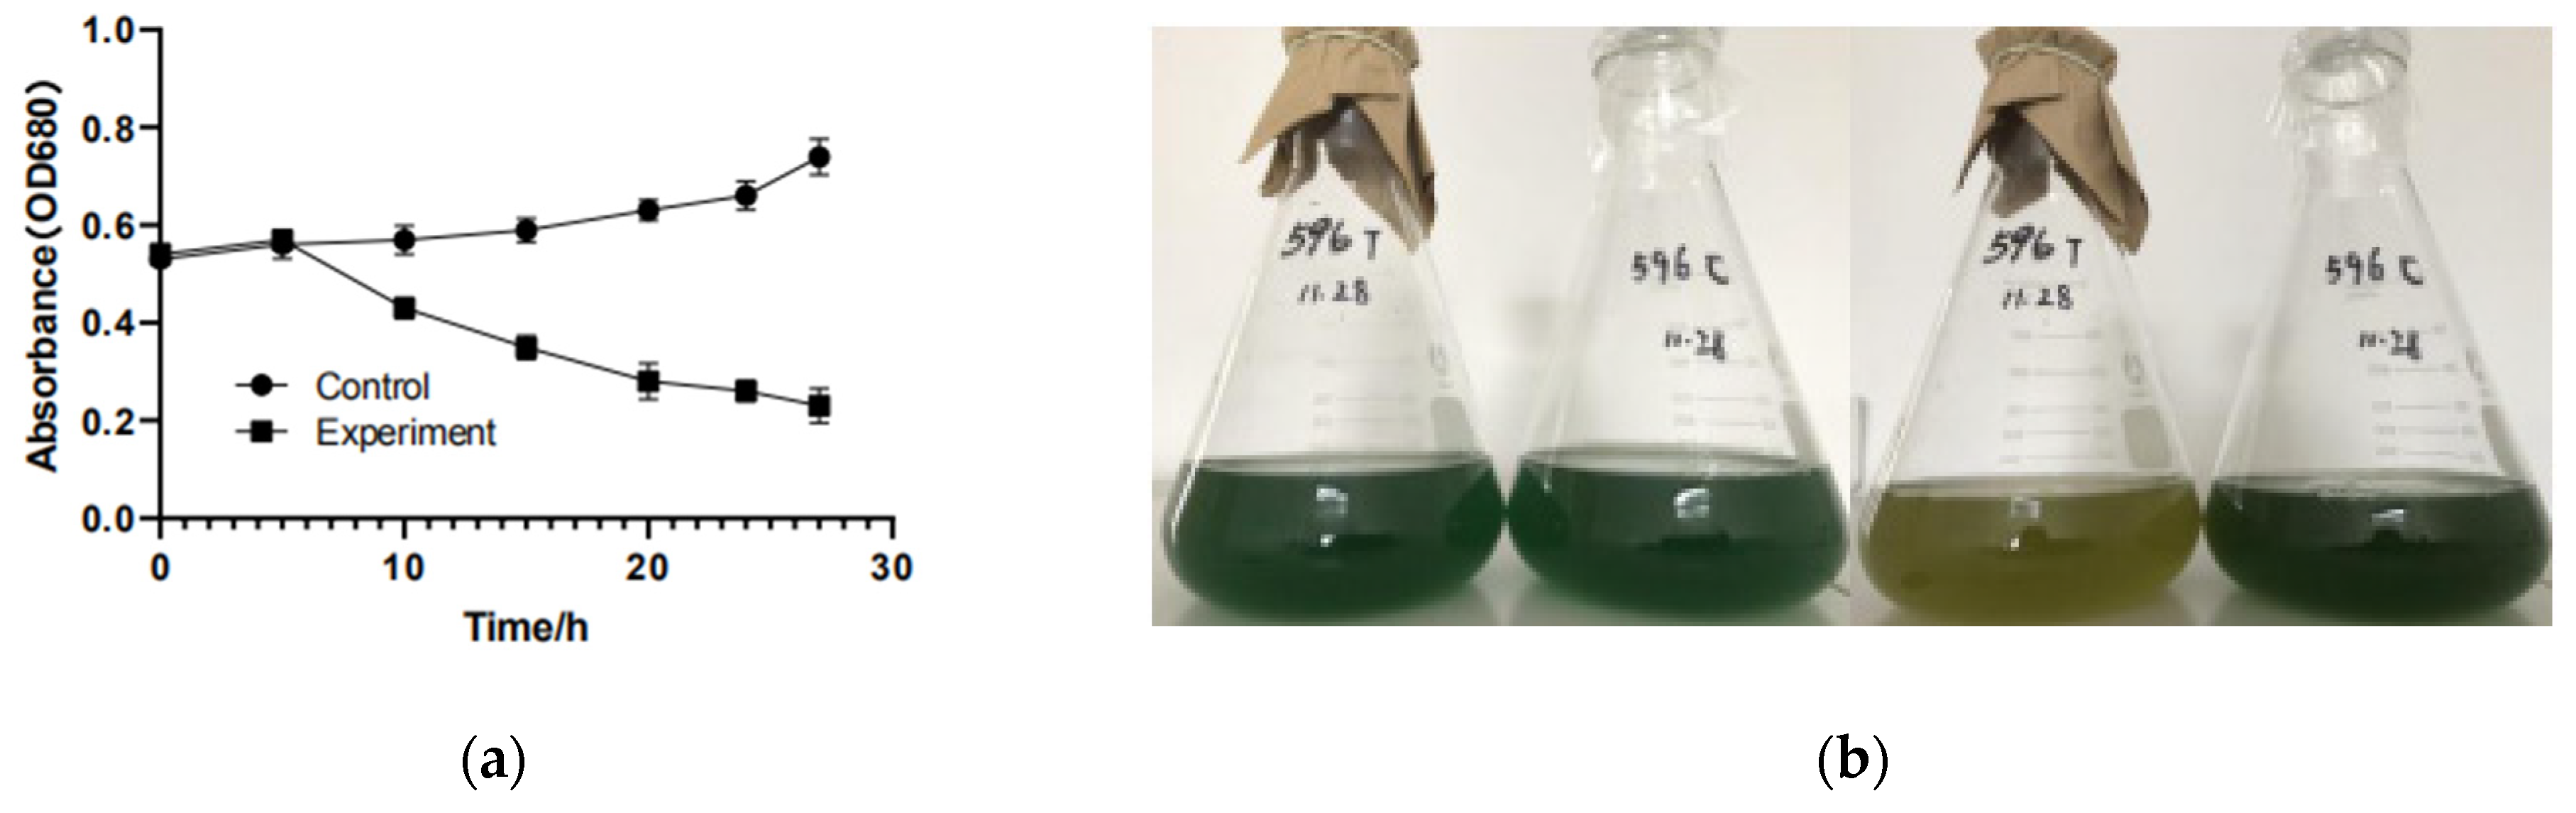
3.1. Effect of YongM Infection on Host Growth

YongM was added to log-phase host cyanobacteria FACHB-596 cells and was incubated under a circadian rhythm (alternate 12 h dark and light periods). The color change of the cyanobacteria solution is not obvious after 1 h, where YongM is still in the latent phase, but the solution turned yellow after 8 h (Figure 1), indicating that the phagosome was in lysis phase. The susceptibility of 33 cyanobacterial strains to YongM is shown in Table 1.

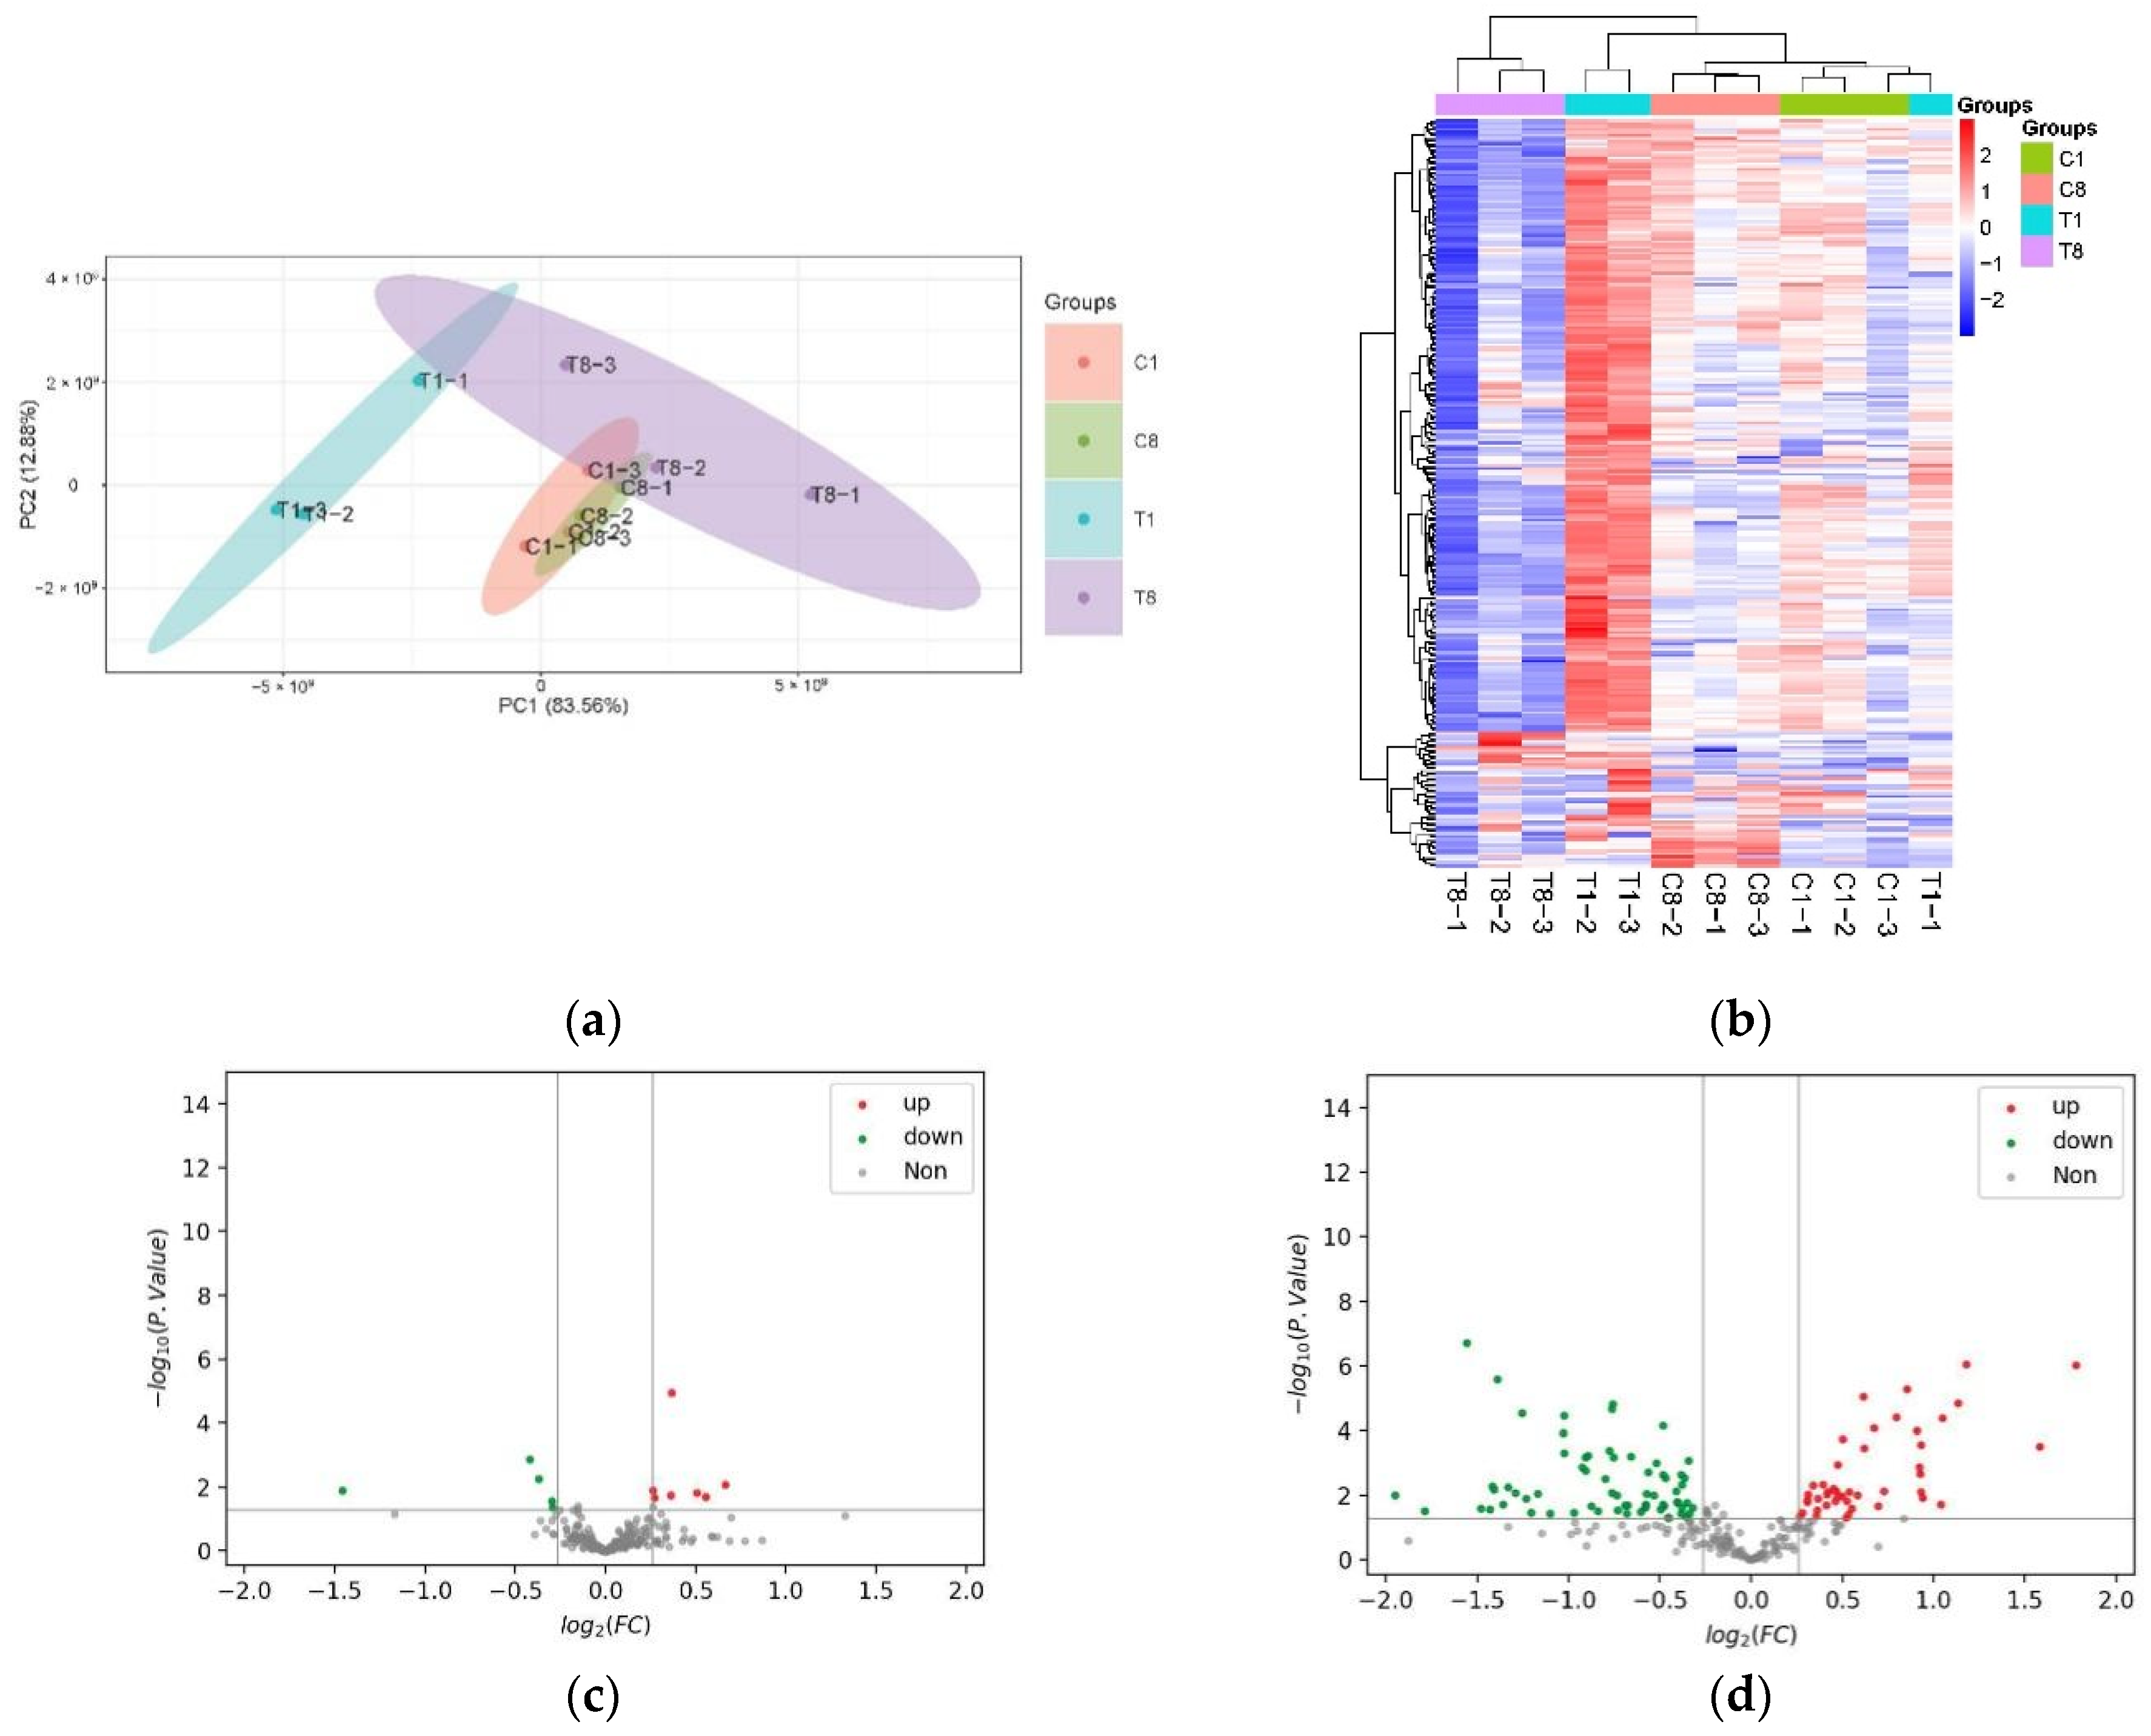
3.2. Altered FACHB-596 Protein Expression Profile Caused by YongM Infection

Logarithmic stage host cyanobacteria FACHB-596 infested with YongM after 1 h and 8 h were used as experimental groups (T1 and T8, respectively), whereas cells not exposed to the cyanophage were used as control (C1 and C8, respectively). Proteomic and bioinformatic analyses showed up to 573 proteins differentially expressed after cyanophage infection. Principal component analysis (PCA) of these DEPs (Figure 2a) showed a small separation between the samples in the same group, but a large separation for samples belonging to different groups. This indicates that the experiments were reproducible, and the data was reliable. This also suggests that there are protein expression changes between experimental and control groups.
To visualize the changes in the FACHB-596 cyanobacteria cells altered proteome caused by YongM infection, DEPs were clustered and heatmaps were drawn (Figure 2b). A total of 12 DEPs (5 down-regulated and 7 up-regulated) were significantly altered after 1 h of infection compared to the control (Figure 2c). The most down-regulated protein was the 50S ribosomal protein L23 (A0A1Z4KLJ5_ANAVA), whereas the most up-regulated protein was the ATP-dependent zinc metalloproteinase FtsH (Q8YXF2_NOSS1). After 8 h, 112 DEPs (67 down-regulated and 45 up-regulated) were altered (Figure 2d). The most down-regulated protein being peroxidase 2 family protein/glutaminase (Q8YWR3_NOSS1) and the most up-regulated protein being photosystem I P700 chlorophyll-a apolipoprotein A1 (A0A1Z4M5R2_MICDP).

3.3. Functional Analysis of DEPs

The number of DEPs individually expressed during 1 h and 8 h after infection in the YongM-infected and uninfected host cells were 127, 74, 74 and 43, respectively. The top 3 statistics of DEPs (Table 2) show that after 1 h of infection, only the membrane-bound, ATP-dependent zinc metalloproteinase FtsH, generally conserved in prokaryotes, was significantly up-regulated. This protein degrades proteins with low thermodynamic stability and lacks unfolding enzyme activity. This suggests that it may be part of a prokaryotic self-protection mechanism to check whether proteins are folded correctly. Ribosomal protein S14, one of the major constituent proteins of small subunit 30 S, is significantly up-regulated in bacteria, cyanobacteria, and plants, indicating enhanced translational activity and high protein synthesis. An additional All4042 protein of unknown function was also significantly up-regulated. The significantly down-regulated outer membrane efflux protein (Alr2887 protein) forms a trimeric channel that can export a variety of substrates in Gram-negative bacteria. After 8 h of infection, photosystem I P700 chlorophyll-a apolipoprotein A1 was significantly up-regulated. This is a membrane protein complex that uses light energy to mediate the transfer of electrons from plastid proteins to ferric oxide reducing proteins and is primarily involved in cyanobacterial photosynthesis. Carbon dioxide concentration mechanism protein is present in a number of autotrophic and non-autotrophic multiple polyhedral shell proteins (CcmK), therefore it may be related to CO2 utilization. A significantly down-regulated protein was the late competence development protein (A0A1Z4IAM0) that produces an adaptive response to external stimuli and is required for cellular uptake of exogenous DNA from the environment leading to transforming capacity. The latter is prevalent in bacteria and may be involved in gene transfer. The significantly down-regulated photosystem I reaction center subunit IV, present on the matrix side of the cystoid membrane, can form complexes with ferricoxigenin and ferricoxigenin oxidoreductase at the photosystem I reaction center and is associated with cyanobacterial photosynthesis. The phycocyanin β subunit, a phycobilisome protein, collects light energy through water-soluble complexes of the phycobilisome, which are attached to the outer surface of the cystoid membrane and can transfer absorbed energy to the photosynthetic reaction center with >95% efficiency.
In summary, after 8 h of infection, host cells showed a weakened defense against exogenous nucleic acid. Expression of argininosuccinate synthase was reduced, resulting in the inhibition of the penultimate step in arginine biosynthesis. This makes it impossible to form argininosuccinate, AMP, and pyrophosphate from citrulline and aspartate.

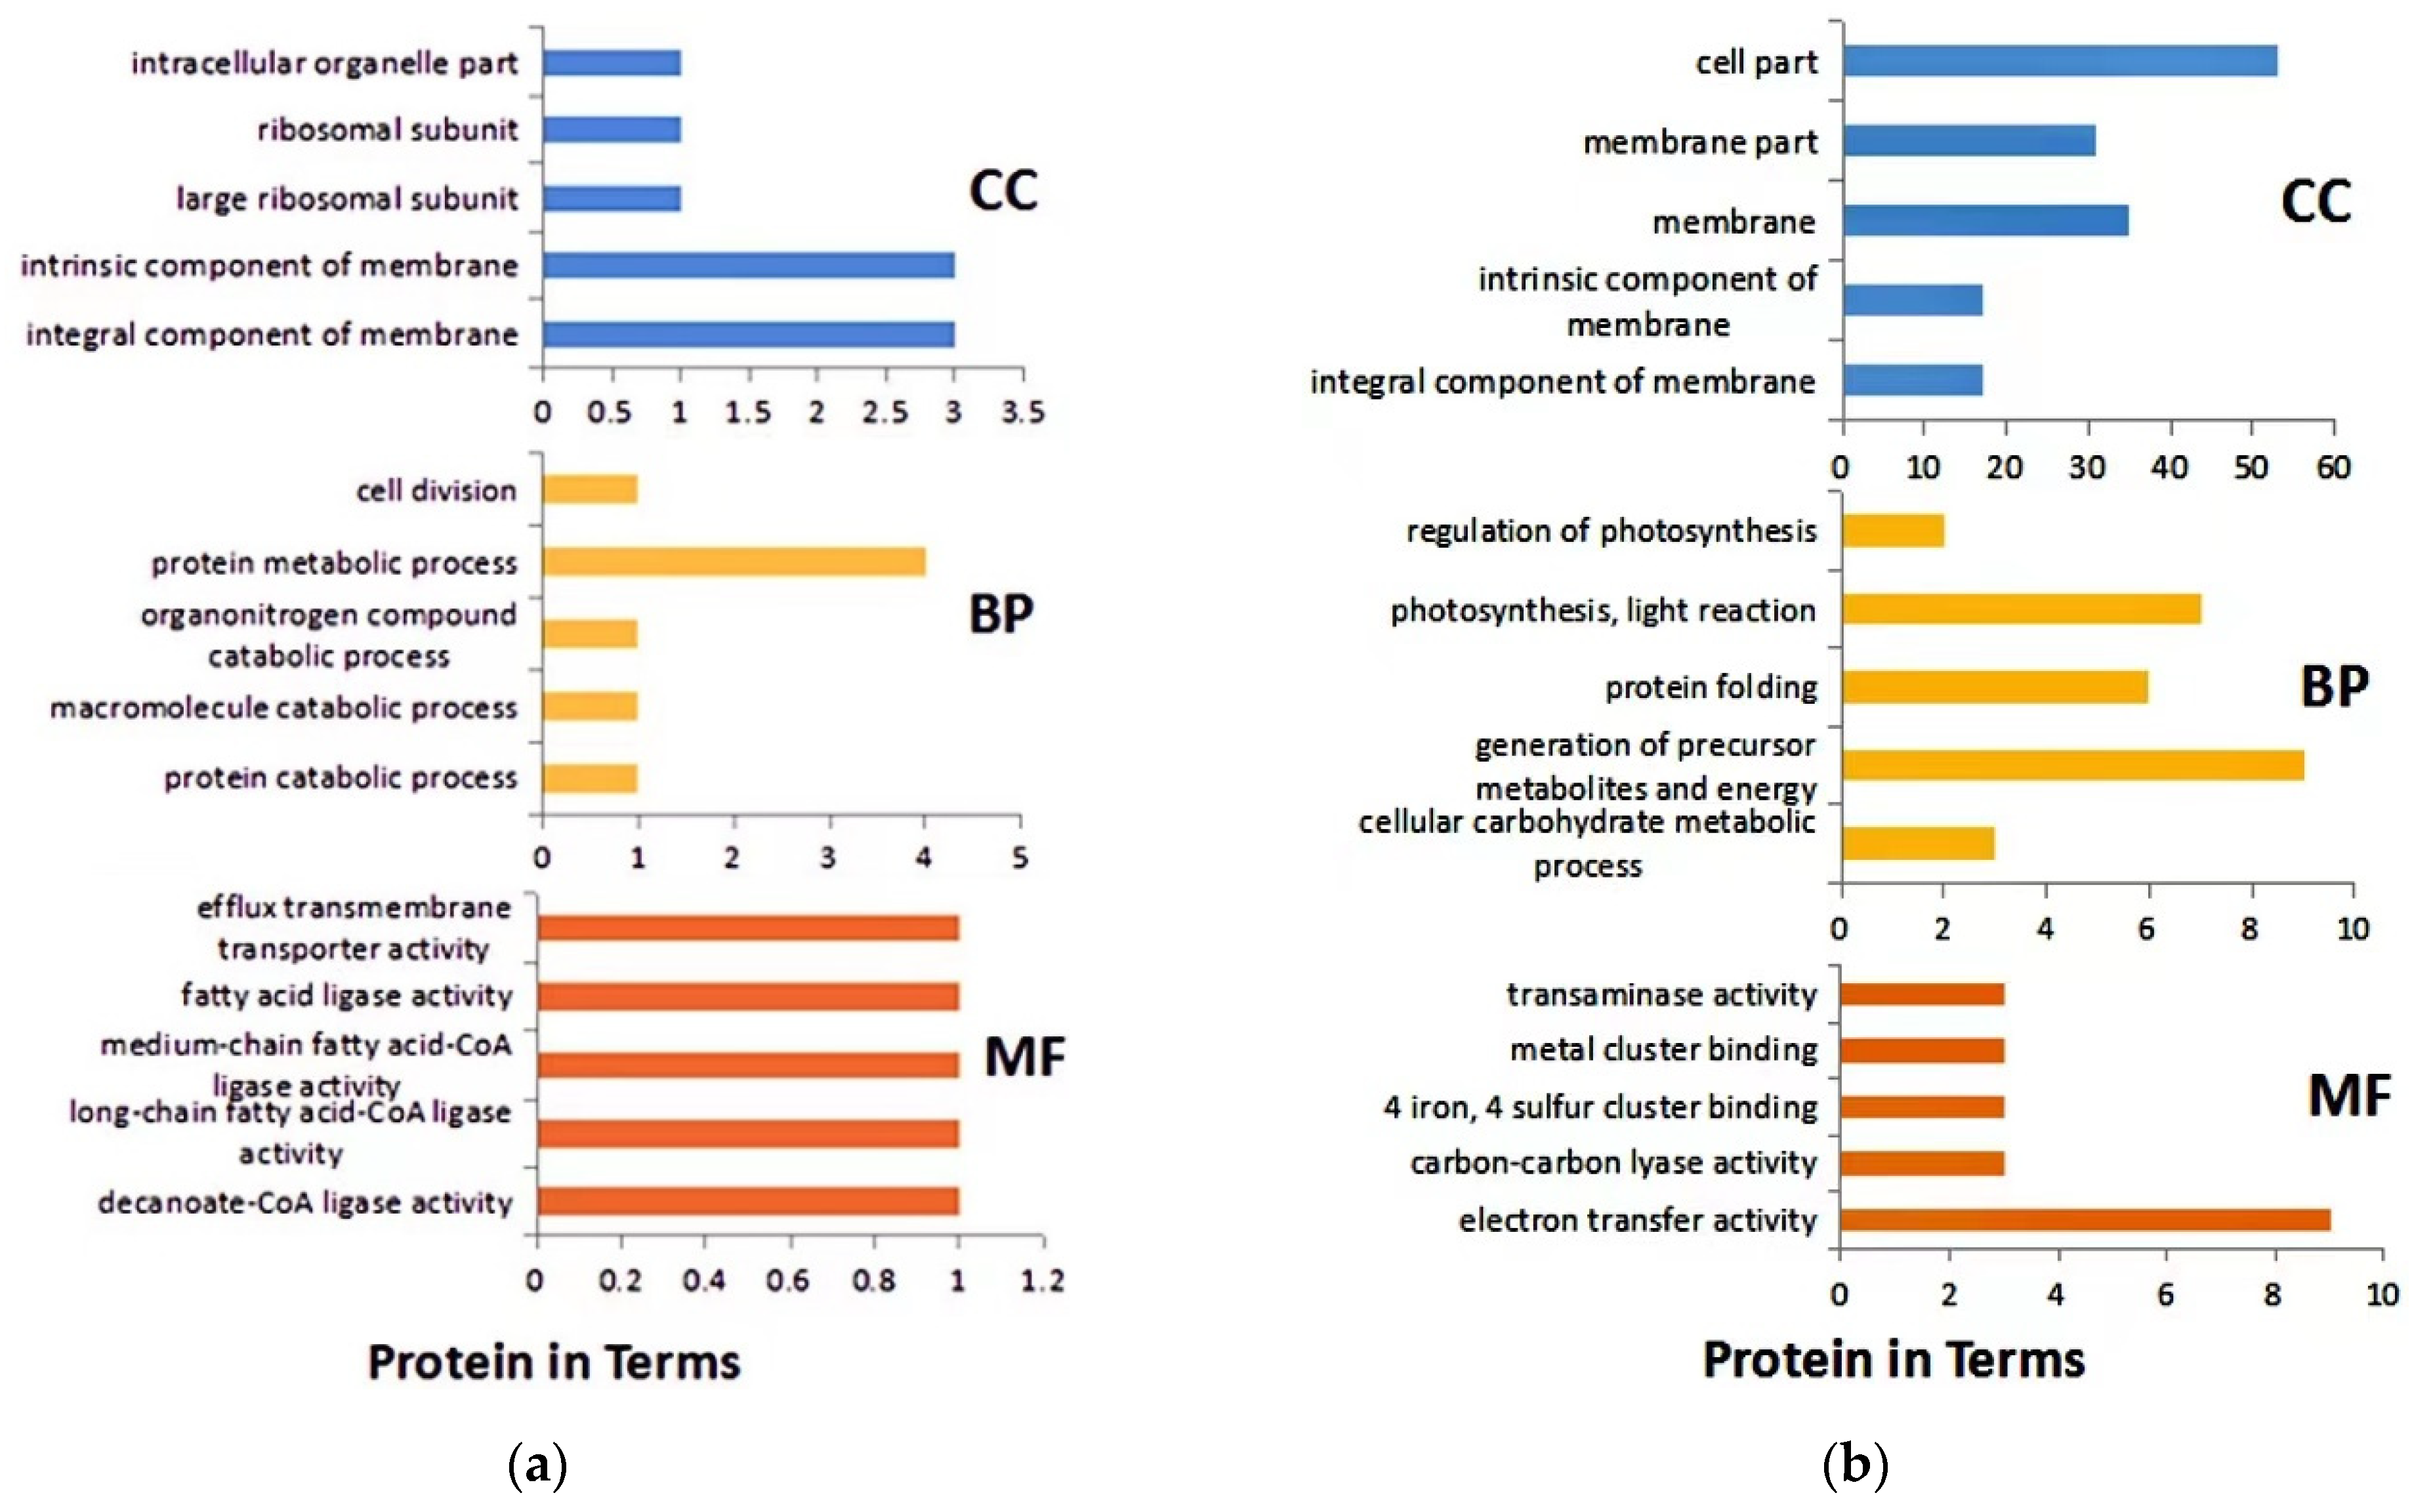
3.4. GO Analysis of DEPs

GO analysis revealed that the main biological process of DEPs after 1 h of infection was protein metabolism. Cellular components were mainly intrinsic to the membrane, and molecular functions were mainly long- and medium-chain fatty acid-coenzyme ligase activity and fatty acid ligase activity (Figure 3a). After 8 h of infection, the main biological processes of DEPs were precursor metabolites and energy production, photosynthesis, and light reaction. The cellular components were mainly cells and their cell membrane parts. The molecular functions were mainly related to electron transfer activity (Figure 3b). In addition, DEPs were also involved in carbon fixation in photosynthesis, amino acid synthesis, and biosynthesis of antibiotics.

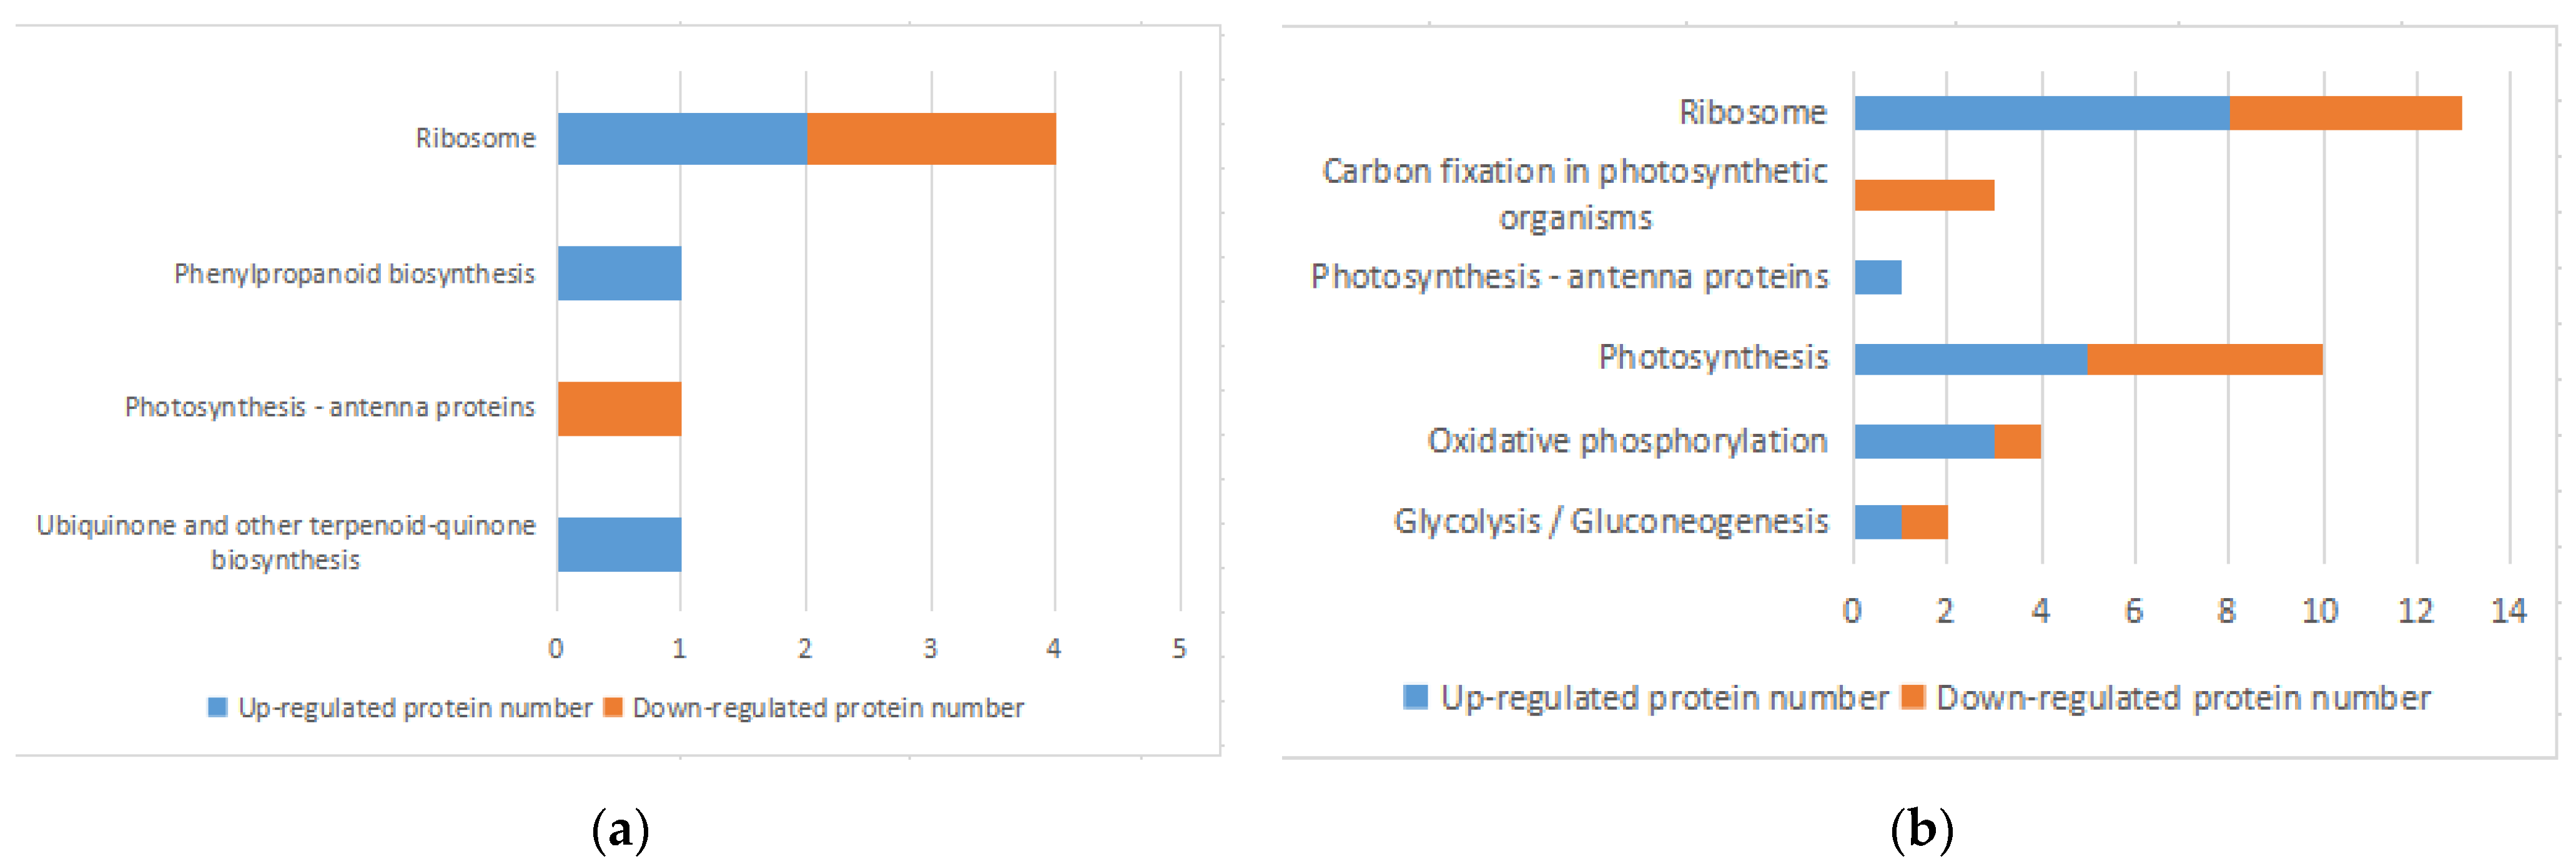
3.5. KEGG Pathway Analysis of DEPs

KEGG Pathway analysis is the analysis of information networks connecting known molecular interactions, such as metabolic pathways, complexes, and biochemical reactions. The KEGG Pathway was used to analyze DEPs through the MaxQuant Cloud Platform for Integrative Analysis of Genomic Data Collection. Four metabolic pathways, involving 7 DEPs, were significantly enriched 1 h after infections, and 4 of them showed elevated DEPs, accounting for 57.1% (Figure 4a). A total of 41 pathways involving 141 DEPs were enriched 8 h after infection, and six metabolic pathways were significantly enriched with DEPs common to all of them. For example, the photosynthesis-related protein (A0A5Q0GEQ2) was involved in both photosynthesis-related and oxidative phosphorylation metabolic pathways (Figure 4b). Six metabolic pathways were significantly enriched after 1 h and 8 h containing 39 DEPs (Table 3). Among the DEPs found in all pathways, 116 DEPs down-regulated (82.3%), suggesting that 8 h after infection most protein expression in the host cyanobacteria was inhibited, resulting in a significant decrease in metabolic activity and a weakening of the vital processes. Enriched pathways (Figure 4) included those directly related to cyanobacteria pigment synthesis and energy supply, such as ribosome metabolism, carbon fixation, oxidative phosphorylation, energy metabolism, photosynthesis, and secondary metabolites (e.g., phenylpropanoids and dicarboxylic acids).

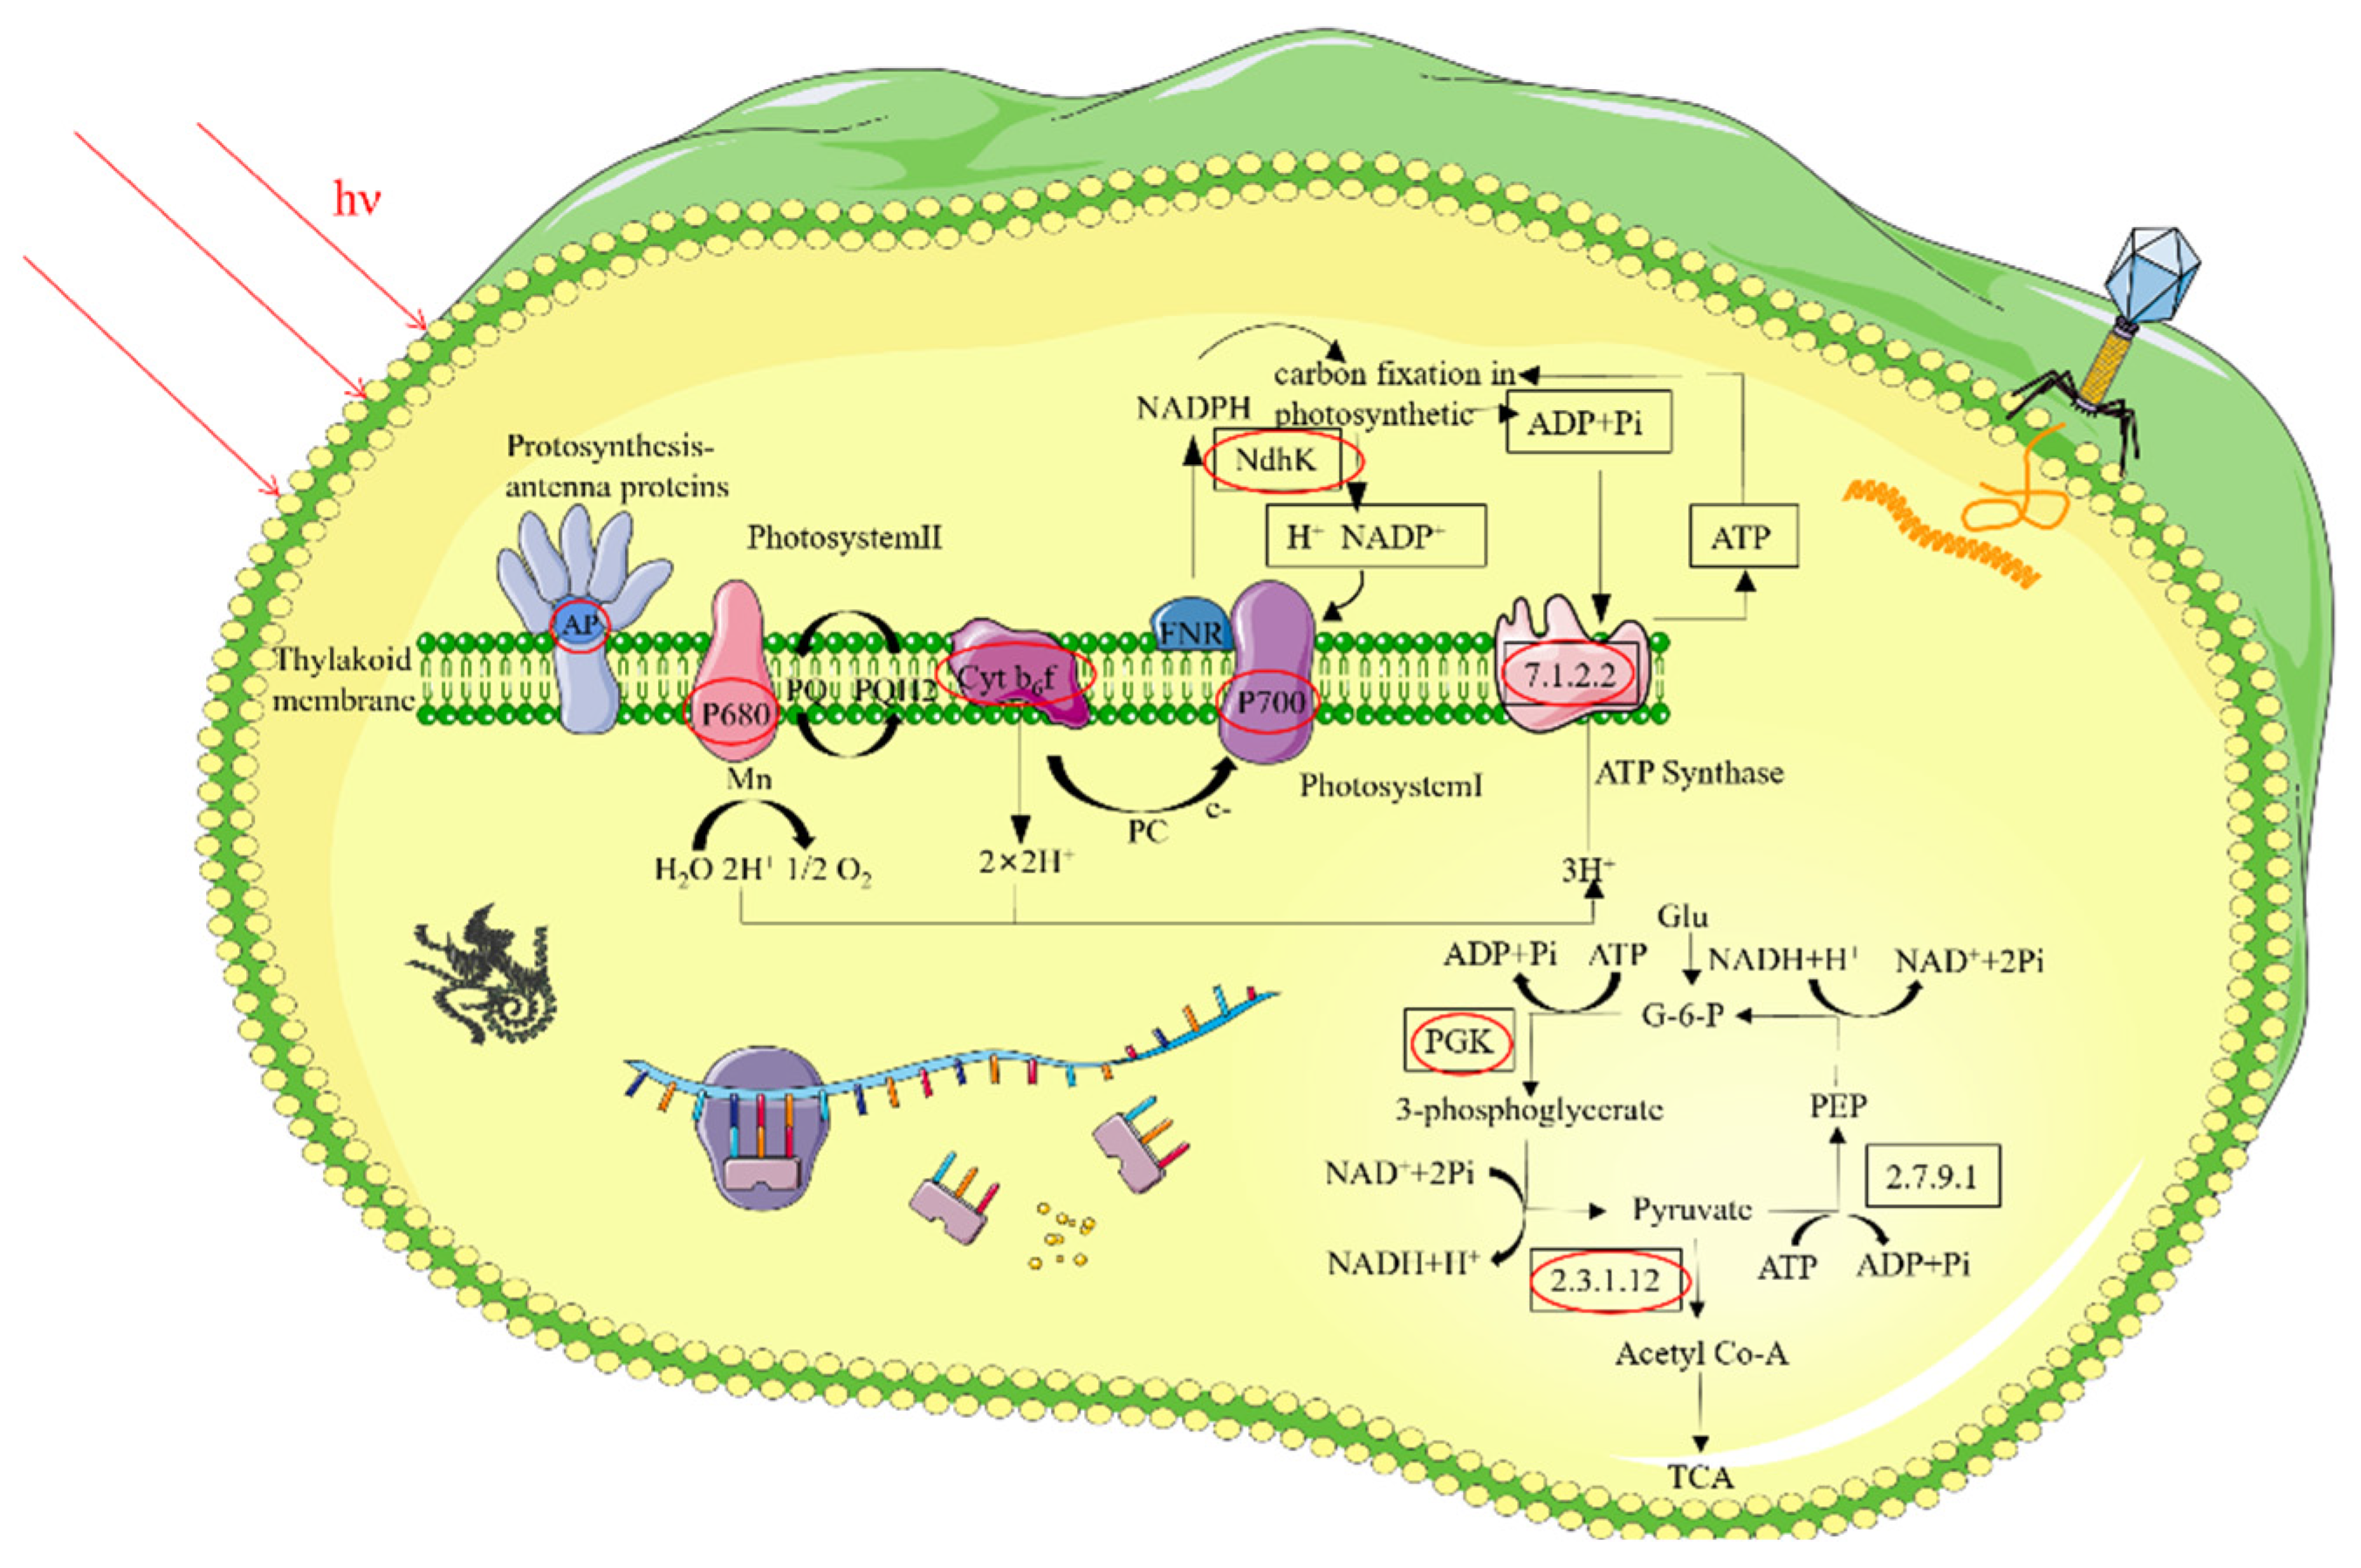
3.5.1. Analysis of Photosynthetic DEPs

The phycobilisomes consist of multiple photosynthetic light-harvesting proteins (i.e., photosynthesis-associated haptoglobin) attached to the outer surface of the cystoid membrane [33]. Cyanobacteria collects light energy through multiple light-harvesting proteins in this complex and transfers the absorbed energy to photosynthetic reaction centers with an efficiency greater than 95%. Among these light-harvesting proteins, phycocyanin is the core component of the water-soluble complex, receiving and transferring energy to the chlorophyll of the cystoid membrane [34]. When YongM infested the host for 1 h, the expression of phycocyanin in the host was reduced, the light-harvesting ability was weakened whereas photosynthesis was inhibited. In contrast, after 8 h YongM infiltration, we observed elevated phycocyanin-related rod-linked proteins, which contributed to light uptake and increased photosynthetic efficiency.
The PSII oxygen precipitation complex (OEC) consists of five subunits, PsbO, PsbP, PsbQ, PsbU, and PsbV [35], which can be photolyzed by water to provide protons for PSI. Its P680 reaction center contains chlorophyll a, which photolyzes water and produces ATP using a proton pump [36]. The P700 reaction center of PSI contains chlorophyll, which absorbs electrons and associated hydrogen delivered from PSII to reduce NADP+ to NADPH. Both ATP and NADPH are then used in light-independent dark reactions, culminating in the conversion of carbon dioxide to glucose and the release of oxygen as a byproduct. PSII is a multisubunit protein-pigment complex in which the core, chlorophyll, and β-carotene bind mainly to the haptoglobin CP43 (PsbC) and CP47 (PsbB), which transmit excitation energy to the reaction center proteins PsbA and PsbD, combining all redox-active cofactors involved in energy conversion [37,38]. After 8 h of infection, the subunits responsible for water photolysis, PsbO, PsbP, PsbQ, and PetE related to photosynthetic electron transport were all down regulated, whereas the photoresponsive phase was suppressed. The up-regulated proteins were Psb27, a highly conserved component of photosystem II consisting of four helices [39], PsaA, a membrane-integrated protein involved in constituting PSI [40] and the cytochrome complex PetA [41], a protein associated with senescence whose up-regulation may indicate that photosynthesis was almost stagnant, and cells were in a state of senescence.
In addition to the above pathway, all DEPs in the carbon fixation pathway were down-regulated after 8 h; phosphoglycerate kinase (PGK), present in all living organisms, catalyzes the interconversion of ATP and ADP and is highly conserved throughout evolution, converting 1,3-diphosphoglycerate to 3-phosphoglycerate in the second step of glycolysis and forming a molecule of ATP [42]. In most cells, this reaction is essential for ATP production in aerobic bacteria, fermentation in anaerobic bacteria, and carbon fixation in plants. Ribulose diphosphate carboxylase large subunit (RbcL) is the macromolecular subcomplex site of Rubsico, and the RbcX protein has been identified as possessing a chaperone-like protein function, as it contributes to the correct assembly of RbcL and RbcS subunits during Rubsico biosynthesis [43]. This metabolic pathway is complemented by down-regulated pyruvate phosphate dikinase, which catalyzes the reversible conversion of ATP to AMP, pyrophosphate, and phosphoenolpyruvate (PEP). These two enzymes are essential for carbon fixation in cyanobacteria cells, resulting in an inadequate energy supply mechanism during carbon fixation and blocked organic matter synthesis in the host cyanobacteria.

3.5.2. Analysis of Energy Metabolism DEPs

After 8 h of infection, expression of ubiquinone oxidoreductase, an enzyme that catalyzes the transfer of electrons from NADH to ubiquinone and is associated with proton translocation across membranes, was reduced. This is the largest and most complex enzyme in the respiratory chain. In cyanobacteria, the three subunits NdhM, NdhN, and NdhO of the NDH-1 complex influence the electron flow around PSI by providing additional ATP for plastids and photosynthesis in cyanobacteria [44]. The NADH dehydrogenase I complex transfers electrons through FMN and Fe-sulfur centers to quinones in the respiratory and photosynthetic chains and couples redox reactions to proton transport, resulting in proton redox energy conserved as a proton gradient [45,46]. Also, among the upregulated expression proteins, alpha is transmembrane ATPases, which are membrane-bound enzyme complexes/ion transport proteins that use ATP hydrolysis to drive proton translocation across membranes. There are also transmembrane ATPases that work in reverse, using energy in the proton gradient and transmembrane ion flow across the ATPase proton channel to drive ATP synthesis. b is F-ATPase, also known as ATP synthase, a type of transmembrane ATPase that hydrolyzes ATP in bacteria to generate a proton gradient [47,48]. The above suggests that infection by YongM results in the restriction of proton transport during oxidative phosphorylation of the host.
In addition, two DEPs, one up-regulated and another down-regulated, were involved in the glycolytic and gluconeogenic metabolic pathways after 8 h of infection. The up-regulated protein is the 2-oxoacid dehydrogenase acyltransferase, which catalyzes the overall conversion of α-ketoacid to acyl-CoA and CO2 [49], whereas the down-regulated one is PGK, which is involved in the carbon fixation pathway that is also down-regulated. This protein could catalyze the interconversion of ATP and ADP. Thus, the infestation of YongM may prevent host glycolysis and gluconeogenesis pathways from proceeding normally by regulating the overall conversion of α-keto acid to acyl-CoA and carbon dioxide and the expression of catalytic enzymes that convert ATP and ADP.

3.5.3. Analysis of Translation Function DEPs

Ribosomes are organelles present in all organisms that use mRNA as a template for the targeted synthesis of genetic information carried by genes. About 1/3 of the ribosome mass consists of proteins that are named small subunit proteins (S1 to S31) and large subunit proteins (L1 to L44), based on their ribosomal subunit size. Many ribosomal proteins, especially those of the large subunit, have long finger-like protrusions that extend into the rRNA core and stabilize their structure. In the large subunits, about 1/3 of the 23S rRNA nucleotides are at least in Van der Waals contact with the protein, while L22 interacts with all six structural domains of the 23S rRNA. The proteins S4 and S7 of the starting 16S rRNA assembly are located at the junctions of five and four RNA helices, respectively, and can be used to organize and stabilize the tertiary structure of the rRNA [50,51].
After 1 h of exposure, we observed a decrease in protein expression of ribosomal large subunit proteins L25 and L2, which are known to bind 23S rRNA and have peptidyl transferase activity in E. coli. Among the proteins with elevated expression, S14 is one of the proteins from the small subunit of the ribosome. This protein is required for the assembly of 30S particles in E. coli and may also be responsible for determining the conformation of 16S rRNA at the A site [52]. Cyanobacteria are Gram-negative bacteria, and the function of its ribosomal proteins is similar to that of E. coli. After 8 h of infection, the number of proteins with elevated expression increased significantly, e.g., L1, the largest protein from the ribosomal subunit, with RNA binding site highly conserved and RNA chaperone activity. Compared with 1 h, differentially expressed ribosomal proteins were significantly increased after 8 h. Five large subunit proteins associated with ribosomal rRNA core stability were up-regulated (L29, L13, L1, L35, L21) which facilitate the stable translation of mRNA and sustained protein synthesis. In addition, the expression of the S5 protein, which is closely related to the function of 30S small subunit assembly and can reduce the rate of translation errors, was also up regulated. We speculate that this is consistent with the high vital activity of the cyanophage after 8 h, when they are in the stage of cleavage.

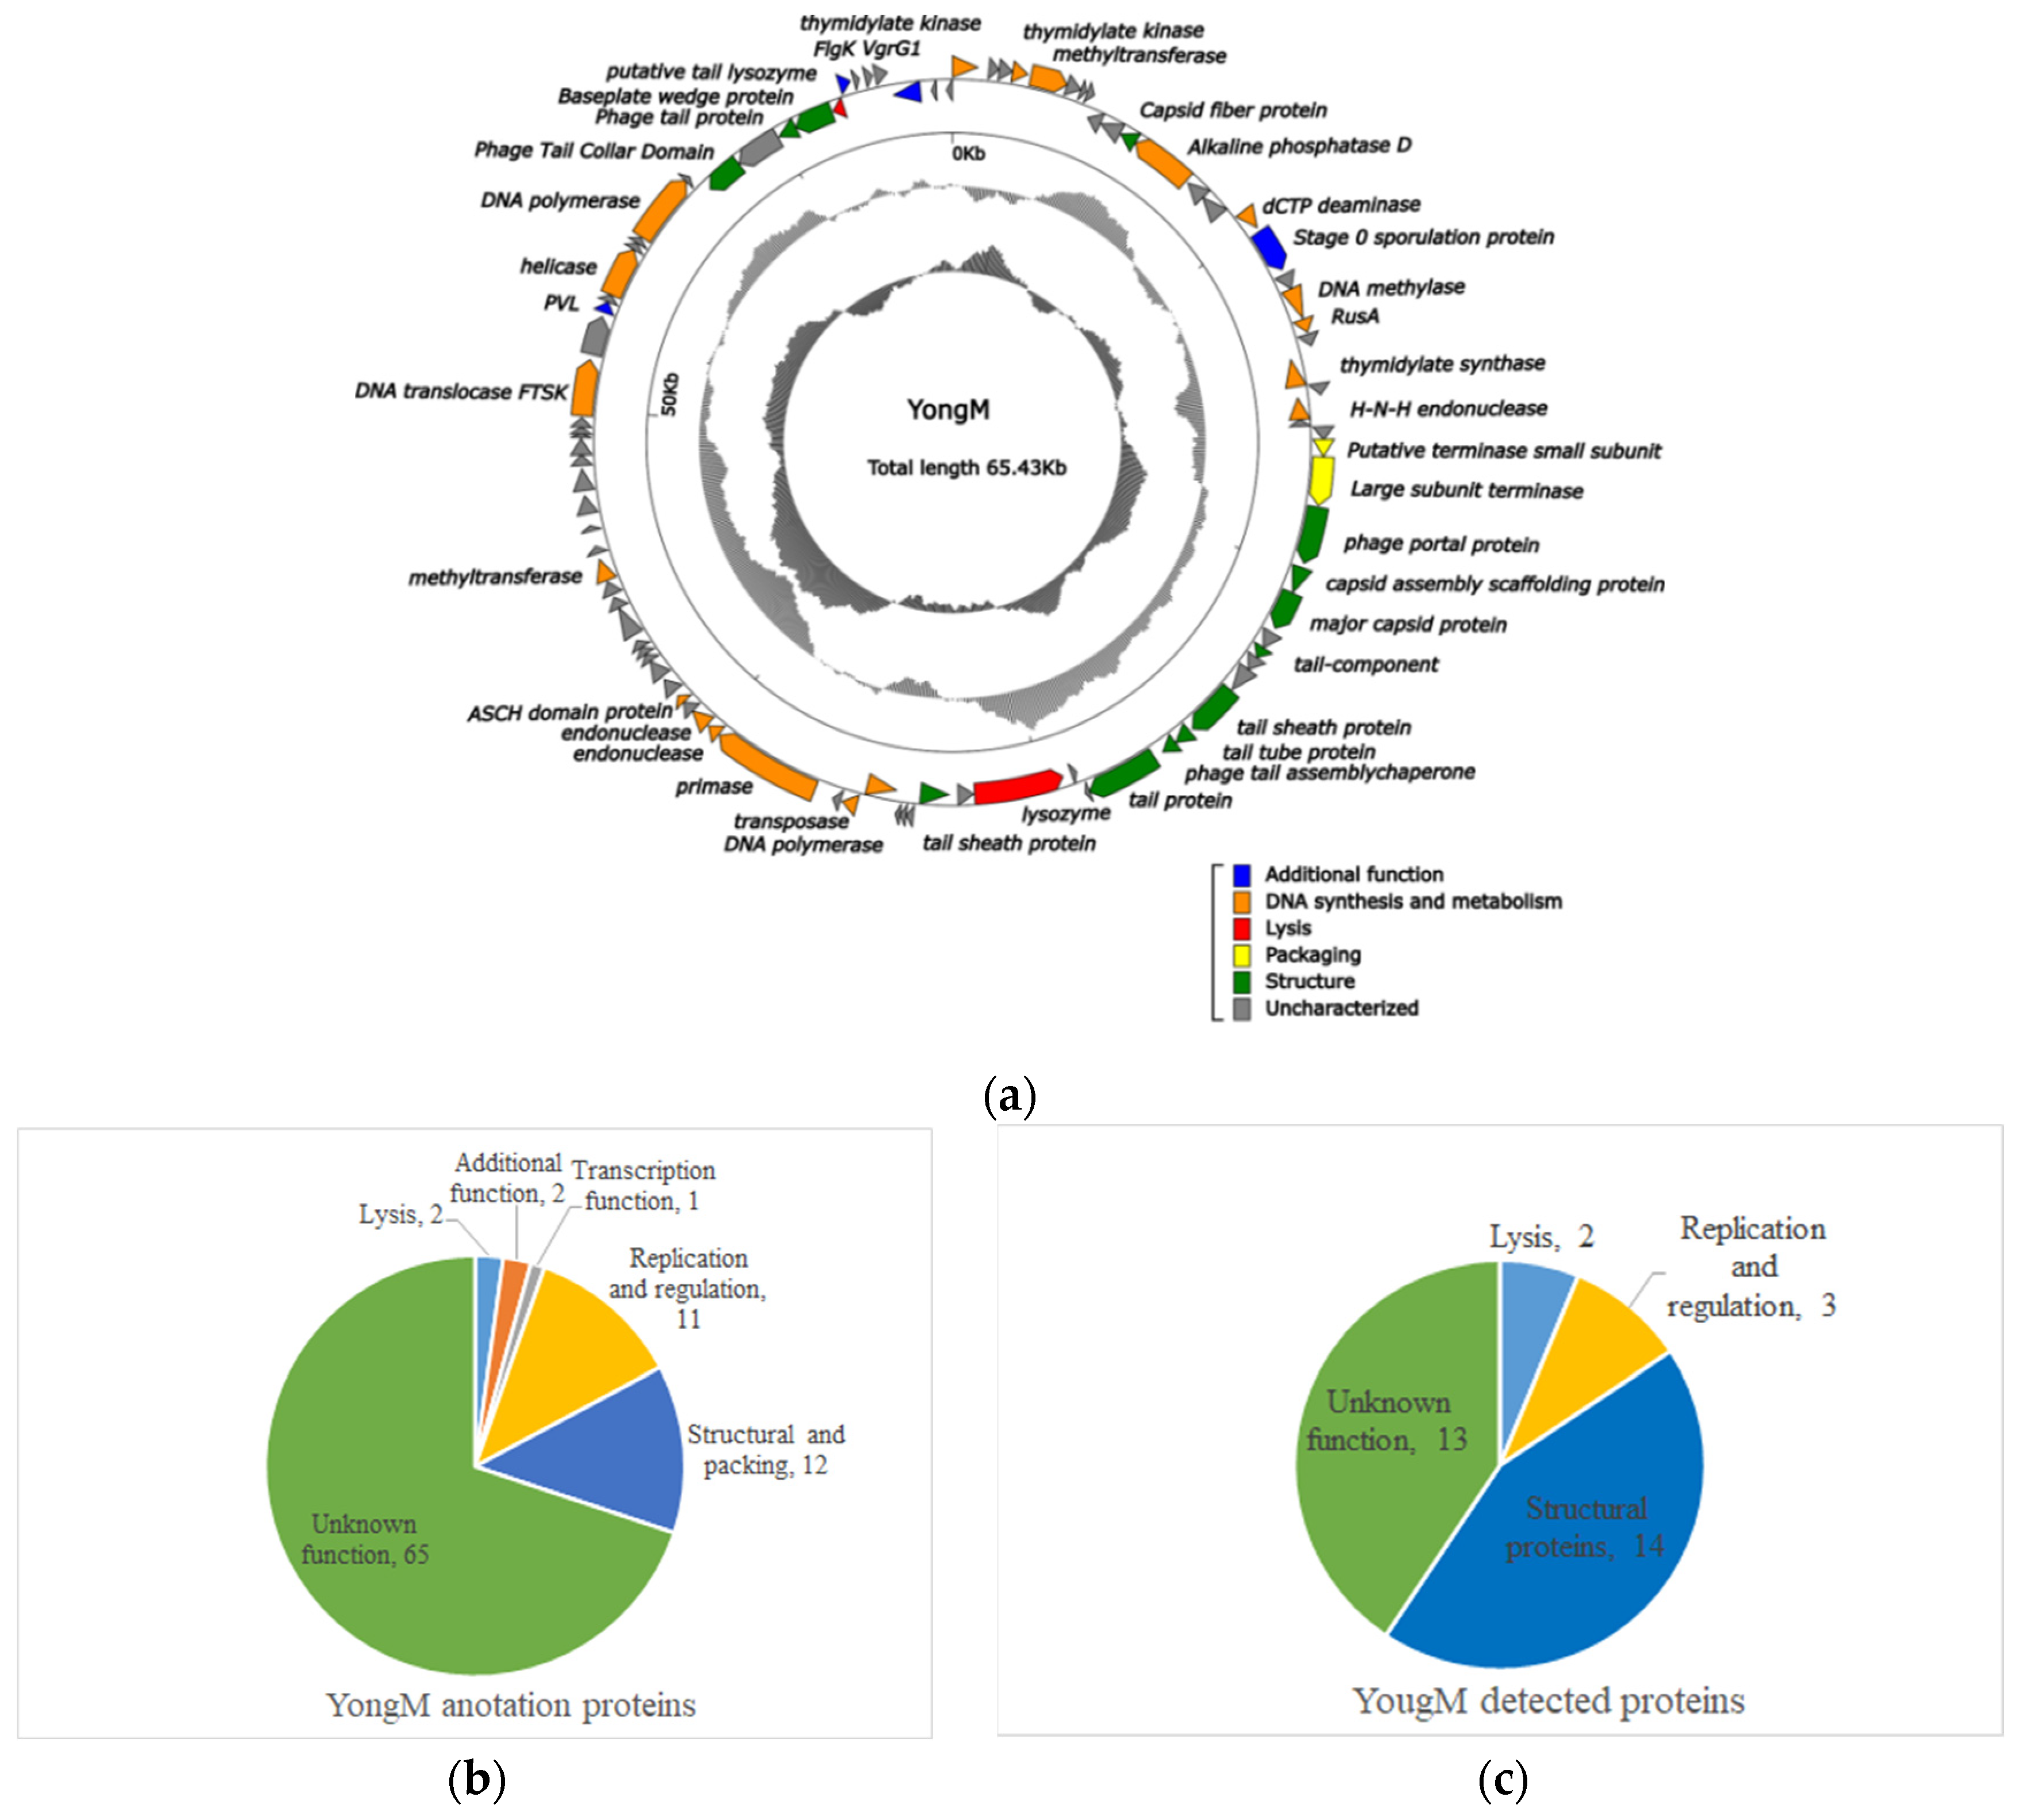
3.6. Structural and Functional Proteins of YongM

Amplification, concentration, and mass spectrometry (LC-MS/MS) analysis of YongM were performed to further validate the results obtained. By delineating and comparing the functional modules of the predicted Open Reading Frames (ORFs) and the actual identified proteins by mass spectrometry (Figure 5b,c), we found that 32 proteins (33.34% of the predicted ORFs) out of 93 predicted proteins (Figure 5a) in the YongM genome could be identified by mass spectrometry proteomics. These included 14 structural proteins, 5 functional proteins, and 13 unknown functional proteins (Table 4), most of which were encoded by the identified structural genes. The molecular weights of the identified proteins were very close to the predicted values. In addition, we identified two lysozymes (Anabaena phage Elbi) and a single lysozyme (Nostoc phage N1) by protein profiling, encoded by the predicted ORFs at position 41 and 86 of the YongM genome, with sizes of 99 kDa and 12.65 kDa, respectively. Four genes were related to DNA anabolism: thymidylate kinase, DNA polymerase, nucleic acid endonuclease, and alkaline phosphatase, which may contribute to the rapid infection and proliferation of YongM [53]. Therefore, we speculate that the lysis efficiency of YongM is inextricably linked to its own dual lytic enzymes and DNA synthesis-related proteins. In addition, the ability of YongM to lyse its host within 12 h and its relatively wide host range may also be attributed to its multiple restriction endonucleases and methylesterases. YongM may serve as a model for future studies on the interaction between these enzymes and freshwater cyanobacteria.

4. Discussion and Conclusions

Since the discovery and isolation of cyanophages, their biological functions and ecological importance in aquatic ecosystems have received great attention, especially in the control of harmful cyanobacterial blooms. Indeed, cyanophages have become important focal points in environmental science and virology. In recent years, molecular biology methods have been used to study the genetic diversity and evolutionary history of cyanophages [54,55]. For example, transcriptomic and metabolomic analyses can be performed on lytic cyanophage-infected host cells. However, gene expression can also be regulated at the post-translational level, therefore proteomic analyses are essential to fully understand the cellular response to specific conditions and to track the fate of each protein [56]. However, the systems involved in the regulation of protein expression levels are very complex, producing a very dynamic proteome. Thus, technical limitations have left most of the viral proteome unresolved, except in a few cases of classic examples [57]. Recent improvements in instrumentation, and the development of highly sensitive analytical methods, have facilitated advances in viral proteomics, but most studies are still focused on the biology of eukaryotic viruses.
The present study systematically analyzed for the first-time host FACHB-596 DEPs, and their involvement in metabolic pathways, during YongM infestation. This was done at the protein level, using a non-standard quantitative proteomics approach (Figure 6). One hour after infection, expression of cyanobacterial proteins with light-collecting activity was down-regulated, photosynthesis was inhibited and resistance of the host to the exogenous genome was reduced. This may create the ideal conditions for YongM infection and gene replication. The decrease in the expression of ribosomal large subunit proteins L25 and L2 reduced the binding of L2 protein to 23S rRNA and inhibited its peptidyl transferase activity. The host ribosome function was impaired. After 8 h of infestation, the expression of phycocyanin-associated rod-linked proteins and large subunit proteins associated with ribosomal rRNA core stability were upregulated, facilitating light energy uptake and the stable translation of mRNA and sustained protein synthesis. In addition, the expression of S5 protein, closely related to the function of 30S small subunit assembly and able to reduce the rate of translation errors, was also up regulated. This may be consistent with the high vital activity of the cyanophage after 8 h, when it was in the ascending stage of lysis. YongM may induce the ageing of the host in addition to initiate dual lytic enzyme cleavage for rapid passive cleavage and death of the host. Indeed, we found that the expression of the senescence-related protein-cytochrome complex PetA was up-regulated after 8 h of infection. In the carbon fixation pathway, the expression of all DEPs was down regulated. The expression of phosphoglycerate kinase and pyruvate phosphate dikinase was reduced, resulting in an insufficient energy supply for carbon fixation in the host, blocking organic matter synthesis and affecting vital activities. In addition, abnormal expression of the host’s proton transport-related proteins and catalytic enzymes in the oxidative phosphorylation, the glycolysis/gluconeogenesis pathway, and the interconversion of ATP and ADP prevented the host’s metabolic pathways from proceeding normally.
In conclusion, these results provide systematic information on protein profiling during the invasion and killing of host cyanobacteria by cyanophages. The identification of significant DEPs and cyanophage infestation, cleavage-related effector enzymes in the host cyanobacteria after infestation may provide insights into the design and manipulation of artificial phages against water blooms, as well as genetic resources and stimulate theoretical studies on phage-host interactions.

Author Contributions

Conceptualization: S.Z., W.A. and B.Z.; methodology: S.Z. and W.A.; validation: S.Z. and J.L.; formal analysis: B.Z. and Y.T.; investigation: S.Z. and X.S.; resources: S.Z., B.Z. and W.A.; data curation: J.L.; writing—original draft preparation: S.Z. and B.Z.; writing—review and editing: W.A.; visualization: J.L. and X.S.; project administration: W.A.; funding acquisition: Y.T. All authors have read and agreed to the published version of the manuscript.

Funding

This research was funded by the National Key Research and Development Program of China (2018YFA0903000, 2020YFC2005405 and 2020YFA0712100).

Institutional Review Board Statement

Not applicable.

Informed Consent Statement

Not applicable.

Data Availability Statement

Not applicable.

Conflicts of Interest

The authors declare no conflict of interest.

References

  1. Gilbert, P.M. Eutrophication, harmful algae and biodiversity—Challenging paradigms in a world of complex nutrient changes. Mar. Pollut. Bull. 2017, 124, 591–606. [Google Scholar] [CrossRef]
  2. Hu, X.; Zhang, R.; Ye, J.; Xu, X.; Zhang, Y.; Wu, C. Monitoring and research of microcystins and environmental factors in a typical artificial freshwater aquaculture pond. Environ. Sci. Pollut. Res. 2018, 25, 5921–5933. [Google Scholar] [CrossRef]
  3. Harke, M.J.; Steffen, M.M.; Gobler, C.J.; Otten, T.G.; Wilhelm, S.W.; Wood, S.A.; Paerl, H.W. A review of the global ecology, genomics, and biogeography of the toxic cyanobacterium, Microcystis spp. Harmful Algae 2016, 54, 4–20. [Google Scholar] [CrossRef] [Green Version]
  4. Chen, L.; Chen, J.; Zhang, X.; Xie, P. A review of reproductive toxicity of microcystins. J. Hazard. Mater. 2016, 301, 381–399. [Google Scholar] [CrossRef]
  5. Suttle, C. Viruses in the sea. Nature 2005, 437, 356–361. [Google Scholar] [CrossRef]
  6. Safferman, R.S.; Cannon, R.E.; Desjardins, P.R.; Gromov, B.V.; Haselkorn, R.; Sherman, L.A.; Shilo, M. Classification and nomenclature of viruses of cyanobacteria. Intervirology 1983, 19, 61–66. [Google Scholar] [CrossRef]
  7. Mirzaei, M.K.; Eriksson, H.; Kasuga, K.; Haggård-Ljungquist, E.; Nilsson, A.S. Genomic, Proteomic, Morphological, and Phylogenetic Analyses of vB_EcoP_SU10, a Podoviridae Phage with C3 Morphology. PLoS ONE 2014, 10, e116294. [Google Scholar] [CrossRef] [Green Version]
  8. Safferman, R.S.; Morris, M.E. Algal virus:isolation. Science 1963, 140, 679–680. [Google Scholar] [CrossRef]
  9. Brussaard, C.; Wilhelm, S.W.; Thingstad, F.; Weinbauer, M.G.; Bratbak, G.; Heldal, M.; Kimmance, S.A.; Middelboe, M.; Nagasaki, K.; Paul, J.H.; et al. Global-scale processes with a nanoscale drive: The role of marine viruses. ISME J. 2008, 2, 575–578. [Google Scholar] [CrossRef] [Green Version]
  10. Roux, S.; Brum, J.R.; Dutilh, B.E.; Sunagawa, S.; Duhaime, M.B.; Loy, A.; Poulos, B.T.; Solonenko, N.; Lara, E.; Poulain, J.; et al. Ecogenomics and potential biogeochemical impacts of globally abundant ocean viruses Ocean microbes drive biogeochemical cycling on a global scale. Nature 2016, 537, 689–693. [Google Scholar] [CrossRef] [Green Version]
  11. Lin, W.; Li, D.F.; Sun, Z.T.; Tong, Y.; Yan, X.; Wang, C.; Zhang, X.; Pei, G. A novel freshwater cyanophage vB_MelS-Me-ZS1 infecting bloom-forming cyanobacterium Microcystis elabens. Mol. Biol. Rep. 2020, 47, 7979–7989. [Google Scholar] [CrossRef] [PubMed]
  12. Jonge, P.A.; Nobrega, F.L.; Brouns, S.J.J.; Dutilh, B.E. Molecular and Evolutionary Determinants of Bacteriophage Host Range. Trends Microbiol. 2019, 27, 51–63. [Google Scholar] [CrossRef] [PubMed]
  13. Silpe, J.E.; Bassler, B.L. A Host-Produced Quorum-Sensing Autoinducer Controls a Phage Lysis-Lysogeny Decision. Cell 2019, 176, 268–280. [Google Scholar] [CrossRef] [PubMed] [Green Version]
  14. Yoshida, T.; Nagasaki, K.; Takashima, Y.; Shirai, Y.; Tomaru, Y.; Takao, Y.; Sakamoto, S.; Hiroishi, S.; Ogata, H. Ma-LMM01 infecting toxic Microcystis aeruginosa illuminates diverse cyanophage genome strategies. J. Bacteriol. 2008, 190, 1762–1772. [Google Scholar] [CrossRef] [Green Version]
  15. Xia, H.; Li, T.; Deng, F.; Hu, Z. Freshwater cyanophages. Virol. Sin. 2013, 28, 253–259. [Google Scholar] [CrossRef]
  16. Yoshida-Takashima, Y.; Yoshida, M.; Ogata, H.; Nagasaki, K.; Hiroishi, S.; Yoshida, T. Cyanophage infection in the bloom-forming cyanobacteria Microcystis aeruginosa in surface freshwater. Microbes Environ. 2012, 27, 350–355. [Google Scholar] [CrossRef] [PubMed] [Green Version]
  17. Liu, X.; Kong, S.; Shi, M.; Fu, L. Genomic Analysis of Freshwater Cyanophage Pf-WMP3 Infecting Cyanobacterium Phormidium foveolarum: The Conserved Elements for a Phage. Microb. Ecol. 2008, 56, 671–680. [Google Scholar] [CrossRef]
  18. Liu, X.; Shi, M.; Kong, S.; Gao, Y.; An, C. Cyanophage Pf-WMP4, a T7-like phage infecting the freshwater cyanobacterium Phormidium foveolarum: Complete genome sequence and DNA translocation. Virology 2007, 366, 28–39. [Google Scholar] [CrossRef] [Green Version]
  19. Zhong, K.X.; Suttle, C.A.; Baudoux, A.C.; Derelle, E.; Colombet, J.; Cho, A.; Caleta, J.; Six, C.; Jacquet, S. A New Freshwater Cyanosiphovirus Harboring Integrase. Front. Microbiol. 2018, 9, 2204. [Google Scholar] [CrossRef] [Green Version]
  20. Zhang, D.; You, F.; He, Y.; Shu, H.; Gin, Y. Isolation and Characterization of the First Freshwater Cyanophage Infecting Pseudanabaena. J. Virol. 2020, 94, e00682-20. [Google Scholar] [CrossRef]
  21. Yang, F.; Jin, H.; Wang, X.; Li, Q.; Zhang, J.; Cui, N.; Jiang, Y.; Chen, Y.; Wu, Q.; Zhou, C.; et al. Genomic Analysis of Mic1 Reveals a Novel Freshwater Long-Tailed Cyanophage. Front. Microbiol. 2020, 11, 484. [Google Scholar] [CrossRef] [PubMed]
  22. Xue, C.; Liu, X.; Wang, Q.; Lin, T.; Wang, M.; Liu, Q.; Shao, H.; Jiang, Y. The isolation and genome sequencing of a novel cyanophage S-H68 from the Bohai Sea, China. Mar. Genom. 2020, 53, 100739. [Google Scholar] [CrossRef] [PubMed]
  23. Huang, L.; Liu, Q.; Liu, X.; Wang, Q.; Jiang, Y. Isolation and Complete Genome Sequence of a Novel Cyanophage S-B68. Curr. Microbiol. 2020, 77, 2385–2390. [Google Scholar] [CrossRef]
  24. Sukenik, A.; Kaplan, A. Cyanobacterial Harmful Algal Blooms in Aquatic Ecosystems: A Comprehensive Outlook on Current and Emerging Mitigation and Control Approaches. Microorganisms 2021, 9, 1472. [Google Scholar] [CrossRef] [PubMed]
  25. Paerl, H.W.; Fulton, R.S.; Moisander, P.H.; Dyble, J. Harmful freshwater algal blooms, with an emphasis on cyanobacteria. Sci. World J. 2001, 1, 76–113. [Google Scholar] [CrossRef]
  26. Ulius, S.; Mazur-Marzec, H.; Vitonyt, I.; Kvederaviciute, K.; Holmfeldt, K. Insights into cyanophage-mediated dynamics of nodularin and other non-ribosomal peptides in Nodularia spumigena. Harmful Algae 2018, 78, 69–74. [Google Scholar]
  27. Eigemann, F.; Schwartke, M.; Schulz-Vogt, H. Niche separation of Baltic Sea cyanobacteria during bloom events by species interactions and autecological preferences. Harmful Algae 2018, 72, 65–73. [Google Scholar] [CrossRef]
  28. Murata, K.; Zhang, Q.; Galaz-Montoya, J.G.; Fu, C.; Coleman, M.L.; Osburne, M.S.; Schmid, M.F.; Sullivan, M.B.; Chisholm, S.W.; Chiu, W. Visualizing Adsorption of Cyanophage P-SSP7 onto Marine Prochlorococcus. Sci. Rep. 2017, 7, 44176. [Google Scholar] [CrossRef]
  29. Waldbauer, J.R.; Coleman, M.L.; Rizzo, A.I.; Campbell, K.L.; Zhang, L. Nitrogen sourcing during viral infection of marine cyanobacteria. Proc. Natl. Acad. Sci. USA 2019, 116, 15590–15595. [Google Scholar] [CrossRef] [Green Version]
  30. Fridman, S.; Flores-Uribe, J.; Larom, S.; Alalouf, O.; Liran, O.; Yacoby, I.; Béjà, O. A myovirus encoding both photosystem I and II proteins enhances cyclic electron flow in infected Prochlorococcus cells. Nat. Microbiol. 2017, 2, 1350–1357. [Google Scholar] [CrossRef]
  31. Wei, Y.; Xia, X. Unique Shine-Dalgarno Sequences in Cyanobacteria and Chloroplasts Reveal Evolutionary Differences in Their Translation Initiation. Genome Biol. Evol. 2019, 11, 3194–3206. [Google Scholar] [CrossRef] [PubMed]
  32. Šulčius, S.; Šimoliūnas, E.; Alzbutas, G.; Gasiūnas, G.; Jauniškis, V.; Kuznecova, J.; Miettinen, S.; Nilsson, E.; Meškys, R.; Roine, E.; et al. Genomic Characterization of Cyanophage vB_AphaS-CL131 Infecting Filamentous Diazotrophic Cyanobacterium Aphanizomenon flos-aquae Reveals Novel Insights into Virus-Bacterium Interactions. Appl. Environ. Microbiol. 2019, 85, e01311-18. [Google Scholar]
  33. Maccoll, R. Allophycocyanin and energy transfer. Biochim. Biophys. Acta (BBA)-Bioenerg. 2004, 1657, 73–81. [Google Scholar] [CrossRef] [Green Version]
  34. Jiang, T.; Zhang, J.P.; Chang, W.R.; Liang, D.C. Crystal structure of R-phycocyanin and possible energy transfer pathways in the phycobilisome. Biophys. J. 2001, 81, 1171–1179. [Google Scholar] [CrossRef] [Green Version]
  35. Thornton, L.E.; Ohkawa, H.; Roose, J.L.; Kashino, Y.; Keren, N.; Pakrasi, H.B. Homologs of plant PsbP and PsbQ proteins are necessary for regulation of photosystem ii activity in the cyanobacterium Synechocystis 6803. Plant Cell 2004, 16, 2164–2175. [Google Scholar] [CrossRef] [Green Version]
  36. Shi, L.X.; Schröder, W.P. The low molecular mass subunits of the photosynthetic supracomplex, photosystem II. Biochim. Biophys Acta 2004, 1608, 75–96. [Google Scholar] [CrossRef] [Green Version]
  37. Kamiya, N.; Shen, J.R. Crystal structure of oxygen-evolving photosystem II from Thermosynechococcus vulcanus at 3.7-A resolution. Proc. Natl. Acad. Sci. USA 2003, 100, 98–103. [Google Scholar] [CrossRef] [Green Version]
  38. Raymond, J.; Blankenship, R.E. The evolutionary development of the protein complement of photosystem 2. Biochim. Biophys. Acta (BBA)-Bioenerg. 2004, 1655, 133–139. [Google Scholar] [CrossRef] [Green Version]
  39. Huang, G.; Xiao, Y.; Pi, X.; Zhao, L.; Zhu, Q.; Wang, W.; Kuang, T.; Han, G.; Sui, S.; Shen, J. Supplementary Information for Structural insights into a dimeric Psb27-photosystem II complex from a cyanobacterium Thermosynechococcus vulcanus.pdf. Proc. Natl. Acad. Sci. USA 2021, 118, e2018053118. [Google Scholar] [CrossRef]
  40. Webber, A.N.; Malkin, R. Photosystem I reaction-centre proteins contain leucine zipper motifs. A proposed role in dimer formation. FEBS Lett. 1990, 264, 1–4. [Google Scholar] [CrossRef] [Green Version]
  41. Panavas, T.; Pikula, A.; Reid, P.D.; Rubinstein, B.; Walker, E.L. Identification of senescence-associated genes from daylily petals. Plant Mol. Biol. 1999, 40, 237–248. [Google Scholar] [CrossRef]
  42. Watson, H.C.; Walker, N.P.; Shaw, P.J.; Bryant, T.N.; Wendell, P.L.; Fothergill, L.A.; Perkins, R.E.; Conroy, S.C.; Dobson, M.J.; Tuite, M.F. Sequence and structure of yeast phosphoglycerate kinase. EMBO J. 1982, 1, 1635–1640. [Google Scholar] [CrossRef]
  43. Tarnawski, M.; Krzywda, S.; Bialek, W.; Jaskolski, M.; Szxzepaniak, A. Structure of the RuBisCO chaperone RbcX from the thermophilic cyanobacterium Thermosynechococcus elongatus. Acta Cryst. Sect. F Struct. Biol. Cryst. Commun. 2011, 67, 851–857. [Google Scholar] [CrossRef] [Green Version]
  44. Battchikova, N.; Zhang, P.; Rudd, S.; Ogawa, T.; Aro, E.M. Identification of NdhL and Ssl1690 (NdhO) in NDH-1L and NDH-1M complexes of Synechocystis sp. PCC 6803. J. Biol. Chem. 2005, 280, 2587–2595. [Google Scholar] [CrossRef] [Green Version]
  45. Rumeau, D.; Bécuwe-Linka, N.; Beyly, A.; Louwagie, M.; Garin, J.; Peltier, G. New subunits NDH-M, -N, and -O, encoded by nuclear genes, are essential for plastid Ndh complex functioning in higher plants. Plant Cell 2005, 17, 219–232. [Google Scholar] [CrossRef] [Green Version]
  46. Zhang, P.; Battchikova, N.; Paakkarinen, V.; Katoh, H.; Iwai, M.; Ikeuchi, M.; Pakrasi, H.; Ogawa, T.; Aro, E.M. Isolation, subunit composition and interaction of the NDH-1 complexes from Thermosynechococcus elongatus BP-1. Biochem. J. 2005, 390, 513–520. [Google Scholar] [CrossRef] [Green Version]
  47. Wilkens, S.; Zhang, Z.; Zheng, Y. A structural model of the vacuolar ATPase from transmission electron microscopy. Micron 2005, 36, 109–126. [Google Scholar] [CrossRef]
  48. Leyva, J.; Bianchet, M.A.; Amzel, L.M. Understanding ATP synthesis: Structure and mechanism of the F1-ATPase (Review). Mol. Membr. Biol. 2003, 20, 27–33. [Google Scholar] [CrossRef]
  49. Mattevi, A.; Obmolova, G.; Kalk, K.H.; Westphal, A.H.; Kok, A.D.; Hol, W.G. Refined Crystal Structure of the Catalytic Domain of Dihydrolipoyl Transacetylase (E2p) from Azotobacter vinelandii at 2·6 Å Resolution. J. Mol. Biol. 1993, 230, 1183–1199. [Google Scholar] [CrossRef]
  50. Maguire, B.A.; Zimmermann, R.A. The Ribosome in Focus. Cell 2001, 104, 813–816. [Google Scholar] [CrossRef]
  51. Sanyal, S.C.; Liljas, A. The end of the beginning: Structural studies of ribosomal proteins. Curr. Opin. Struct. Biol. 2000, 10, 633–636. [Google Scholar] [CrossRef]
  52. Chan, Y.L.; Suzuki, K.; Olvera, J.; Wool, I.G. Zinc finger-like motifs in rat ribosomal proteins S27 and S29. Nucleic Acids Res. 1993, 21, 649–655. [Google Scholar] [CrossRef] [Green Version]
  53. Hertveldt, K.; Lavigne, R.; Pleteneva, E.; Sernova, N.; Kurochkina, L.; Korchevskii, R.; Robben, J.; Mesyanzhinov, V.; Krylov, V.N.; Volckaert, G. Genome comparison of pseudomonas aeruginosa large phages. J. Mol. Biol. 2005, 354, 536–545. [Google Scholar] [CrossRef]
  54. Ma, Y.; Allen, L.Z.; Palenik, B. Diversity and genome dynamics of marine cyanophages using metagenomic analyses. Environ. Microbiol. Rep. 2015, 6, 583–594. [Google Scholar] [CrossRef]
  55. Hevroni, G.; Enav, H.; Rohwer, F.; Beja, O. Diversity of viral photosystem-I psaA genes. ISME J. 2015, 9, 1892–1898. [Google Scholar] [CrossRef]
  56. Lemay, M.L.; Otto, A.; Maa, S.; Plate, K.; Becher, D.; Moineau, S. Investigating Lactococcus lactis MG1363 Response to Phage p2 Infection at the Proteome Level. Mol. Cell. Proteom. 2019, 18, 704–714. [Google Scholar] [CrossRef] [Green Version]
  57. Gao, E.; Huang, Y.; Ning, D. Metabolic Genes within Cyanophage Genomes: Implications for Diversity and Evolution. Genes 2016, 7, 80. [Google Scholar] [CrossRef]
Figure 1. Growth of host cyanobacteria FACHB-596 after cyanophage YongM infection. (a) Host cyanobacteria FACHB-596 absorbance versus infection time by YongM; (b) Phenotypic changes of YongM-infected host cyanobacteria FACHB-596 cells after 1 h (left) and 8 h (right).
Microorganisms 10 00257 g001
Figure 2. Changes in protein expression in host cyanobacteria caused by YongM infection. (a) PCA of DEPs; (b) heat map; (c,d) volcanic maps of DEPS after 1 h infection (c) and 8 h infection (d).
Microorganisms 10 00257 g002
Figure 3. GO analysis of DEPs. (a) after 1 h infection; (b) after 8 h infection. BP: Biological process; CC: Cell composition; MF: Molecular function.
Microorganisms 10 00257 g003
Figure 4. Enrichment of KEGG pathway in DEPs. (a,b) KEGG enrichment histogram of DEPs after 1 h infection (a) and after 8 h infection (b).
Microorganisms 10 00257 g004
Figure 5. Comparison of predicted ORFs of YongM with proteins identified by proteomics. (a) Genome map of YongM; (b) heat map of DEPs due to cyanophage YongM infestation of host cyanobacteria FACHB-596 cells; (c) protein function/metabolic pathway and proportion of YongM detected proteins.
Microorganisms 10 00257 g005
Figure 6. Schematic diagram of key proteins and pathways involved in the lysis of cyanobacteria FACHB-596 cells caused by YongM infestation.
Microorganisms 10 00257 g006
Table 1. Host range analysis of YongM against 33 cyanobacterial strains.
OrdersFamilySpeciesStrainsSusceptibilityOrigin
ChroococcalesMicrocystaceaeMicrocystis aeruginosaFACHB-905+China
FACHB-925Australia
FACHB-942China
FACHB-469+France
FACHB-924Australia
FACHB-1326China
FACHB-912China
M. wesenbergiiFACHB-908+China
FACHB-1112China
FACHB-1317China
FACHB-1318China
FACHB-929+Japan
M. viridisFACHB-979+Japan
M. Flos-aquaeFACHB-1028+China
Microcystis sp.FACHB-915+France
M. elabensFACHB-916Japan
M. PanniformisFACHB-1757China
M. ichthyoblabe KutzFACHB-1294China
FACHB-1409+China
ChroococcacaeaChroococcus sp.FACHB-193+China
NostocalesAphanizomenonaceaeAphanizomenon flos-aquaeFACHB-1039China
FACHB-1040+China
Anabaena flos-aquaeFACHB-245+USA
Anabaena sp.FACHB-418+France
Dolichospermum flos-aquaeFACHB-1255+China
NostocaceaeNostoc sp.FACHB-596+China
OscillatorialeMicrocoleaceaePlanktothrix agardhiiFACHB-1166China
FACHB-920+Japan
Planktothricoides raciborskiiFACHB-881+China
OscillatoriaceaeOscillatoria planctonicaFACHB-708+China
HormogonalesScytonemataceaePlectonemaFACHB-402USA
FACHB-240USA
SynechococcalesSynechococcaceaeSynechococcus sp.FACHB-805+Australia
Note: “+” suspective “−” unsuspective.
Table 2. The three most significant DEPs in host cyanobacteria induced by YongM infection of FACHB-596 cells. ↑: significantly up-regulated; ↓: significantly down-regulated.
AccessionProtein Name p ValueAdj. p-ValueT1:C1T8:C8
Q8YXF2ATP-dependent zinc metalloproteinase FtsH0.0082187770.520911751.5848247
Q8YPZ8All4042 protein0.0203025620.556312141.4674468
A0A6P0S0D530S ribosomal protein S140.0146604080.534057721.4211440
Q8YT39Alr2887 protein0.0053839130.457632620.7740167
Q8YTI1All2736 protein0.0013274860.169254510.7467759
A0A1Z4KLJ550Sribosomal protein L230.012229750.520911750.3643173
A0A1Z4M5R2Photosystem I P700 chlorophyll-a apolipoprotein A10.0000009670.0000825 3.42825728
Q8YYI1Carbon Dioxide Concentration Mechanism protein0.0003053350.00390828 2.98863046
Q8YTI1All2736 protein0.0000008870.0000825 2.26210112
A0A1Z4IAM0Unknown functional protein0.0000001950.0000499 0.33966838
A0A1Z4KN79Argininosuccinate synthase0.0309387770.07920326 0.28915421
Q8YWR3Peroxidase 2 family of proteins/glutaminase0.0097775170.04120970 0.25880121
Table 3. List of DEPs involved in metabolic pathways after infection of host cyanobacteria FACHB-596 cells by YongM.
KEGG PathwayProtein NameProtein DescriptionUpward/Downward
Photosynthesis-antennal proteinsApcBAllophycocyanin β subunitDown
CpcBPhycocyanin associated rod junction proteinUp
RibosomalL23Ribosomal large subunit protein L23Down
L2Ribosomal large subunit protein L2Down
S14Ribosomal small subunit protein S14Up
L35Ribosomal large subunit protein L35Up
L3Ribosomal large subunit protein L3Down
L4Ribosomal large subunit protein L4Down
L22Ribosomal large subunit protein L22Down
L29Ribosomal large subunit protein L29Up
L5Ribosomal large subunit protein L5Down
S5Ribosomal small subunit protein S5Up
L13Ribosomal large subunit protein L13Up
L1Ribosomal large subunit protein L1Up
L35Ribosomal large subunit protein L35Up
S6Ribosomal small subunit protein S6Down
L21Ribosomal large subunit protein L21Up
S16Ribosomal small subunit protein S16Up
S1Ribosomal small subunit protein S1Up
Oxidative phosphorylationNdhKNAD (P) H-quinone oxidoreductase subunit K(EC:7.1.1.2)Down
alphaF-type H+/Na+ transporter ATPase subunit α (EC:7.1.2.2 7.2.2.1)Up
bATPase B subunitUp
OSCPF type H~+ transport ATPase subunitUp
PhotosynthesisPsb-APhotosystem II P680 reaction center D1 protein (EC:1.10.3.9)Down
Psb-OPhotosystem II oxygen evolution enhancer protein 1Down
Psb-UPhotosystem IIPsbU proteinDown
Psb-VPhotosystem II cytochrome C550Down
Psb27Photosystem IIPsb27 proteinUp
PsaAPhotosystem I P700 chlorophyll-a apolipoprotein A1Up
PetAAcocytochrome FUp
PetEplastocyaninDown
alphaF-type H+/Na+ transporter ATPase subunit α (EC:7.1.2.2 7.2.2.1)Up
bATPase B subunitUp
Carbon fixation2.7.9.1Pyruvate, orthophosphate dikinaseDown
4.1.1.39Ribulose bisphosphate carboxylase large chainDown
2.7.2.3phosphoglyceric kinaseDown
2.7.9.1Pyruvate, orthophosphate dikinaseDown
Glycolysis and gluconeogenesis2.7.2.3phosphoglyceric kinaseDown
2.3.1.12Pyruvate dehydrogenase E2 component (dihydrolipamidoacetyltransferase)Up
Table 4. Protein profile identification results of YongM.
No.LocationDescriptionScoreCoverage
120651..21748putative major capsid protein (Nostoc phage A1)10,45886%
223869..25389tail sheath protein (Nostoc phage A1)437246%
357421..58554tail collar protein (Nostoc phage A1)226524%
425487..25996tail tube protein (Nostoc phage A1)210191%
518162..19766hypothetical protein (Nostoc phage A1)181162%
629345..32047lysozyme (Anabaena phage Elbi) 115130%
75775..7658alkaline phosphatase D family protein (Salinivenus lutea)113235%
826714..28780tail protein (Nostoc phage A1)111934%
960572..61747baseplate J tail protein (Nostoc phage N1)104844%
105256..5762Capsid fiber protein103761%
1158577..59965tail fiber protein (Nostoc phage N1)99542%
1221893..22378hypothetical protein (Nostoc phage A1)92549%
1319898..20644putative outer membrane protein (Nostoc phage A1)91249%
1461784..62131lysozyme (Nostoc phage N1)67273%
154580..5233hypothetical protein (Nostoc phage A1)45324%
1632813..33661hypothetical protein (Nostoc phage N1)37637%
178358..9086hypothetical protein (Nostoc phage A1)28820%
1859997..60572tail collar protein (Nostoc phage A1)19830%
1923110..23832hypothetical protein (Nostoc phage A1)16925%
207738..8361hypothetical protein (Nostoc phage A1)15640%
2162202..62531hypothetical protein10164%
2232074..32541hypothetical protein10026%
2363660..64472Baseplate structural protein7111%
2422375..22701putative tail-component6619%
2522706..23113hypothetical protein5718%
2615042..15680hypothetical protein (Nostoc phage A1)296%
2742619..43221hypothetical protein (Microcystis phage Me-ZS1)296%
2855094..57100DNA polymerase delta catalytic subunit191%
293..722Thymidylate kinase (EC 2.7.4.9)197%
3020661..26102tail length tape-measure protein (Microcystis phage Me-ZS1)162%
3141382..41699hypothetical protein (Microcystis phage Me-ZS1)146%
3226900..27886tail tube protein (Microcystis phage Me-ZS1)134%
Publisher’s Note: MDPI stays neutral with regard to jurisdictional claims in published maps and institutional affiliations.

