3.1. Effects of Burst Ratio
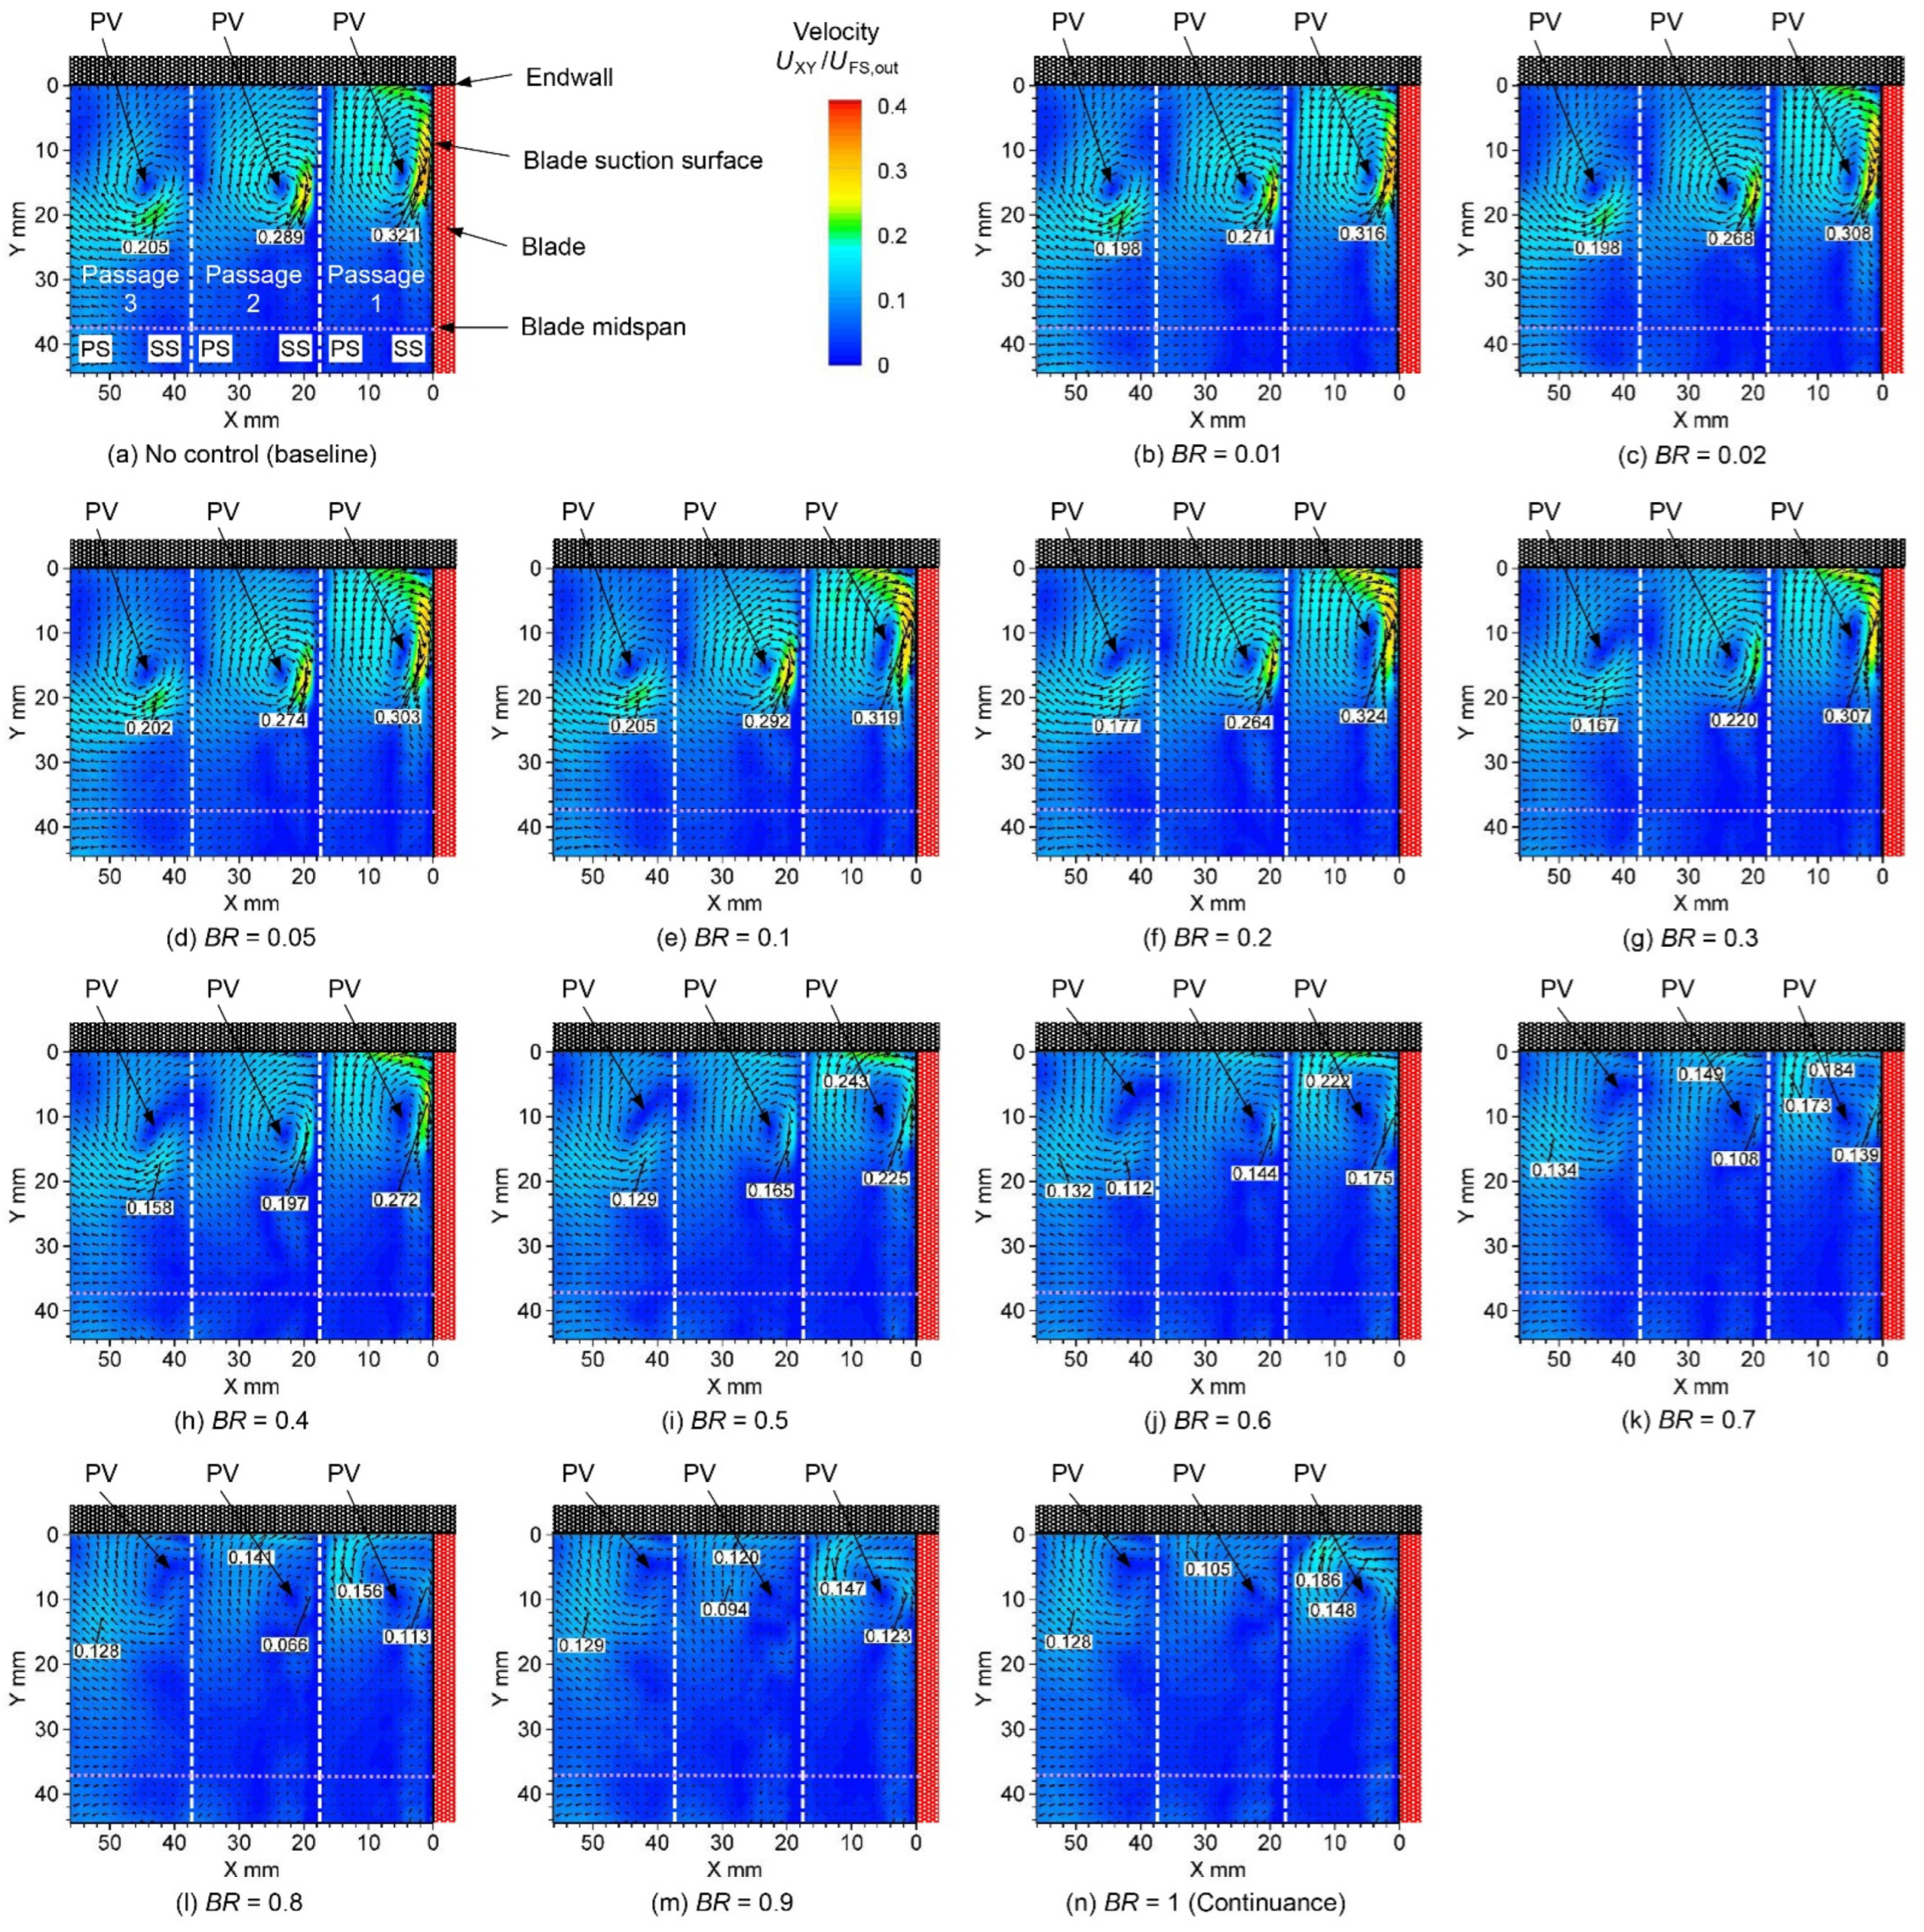
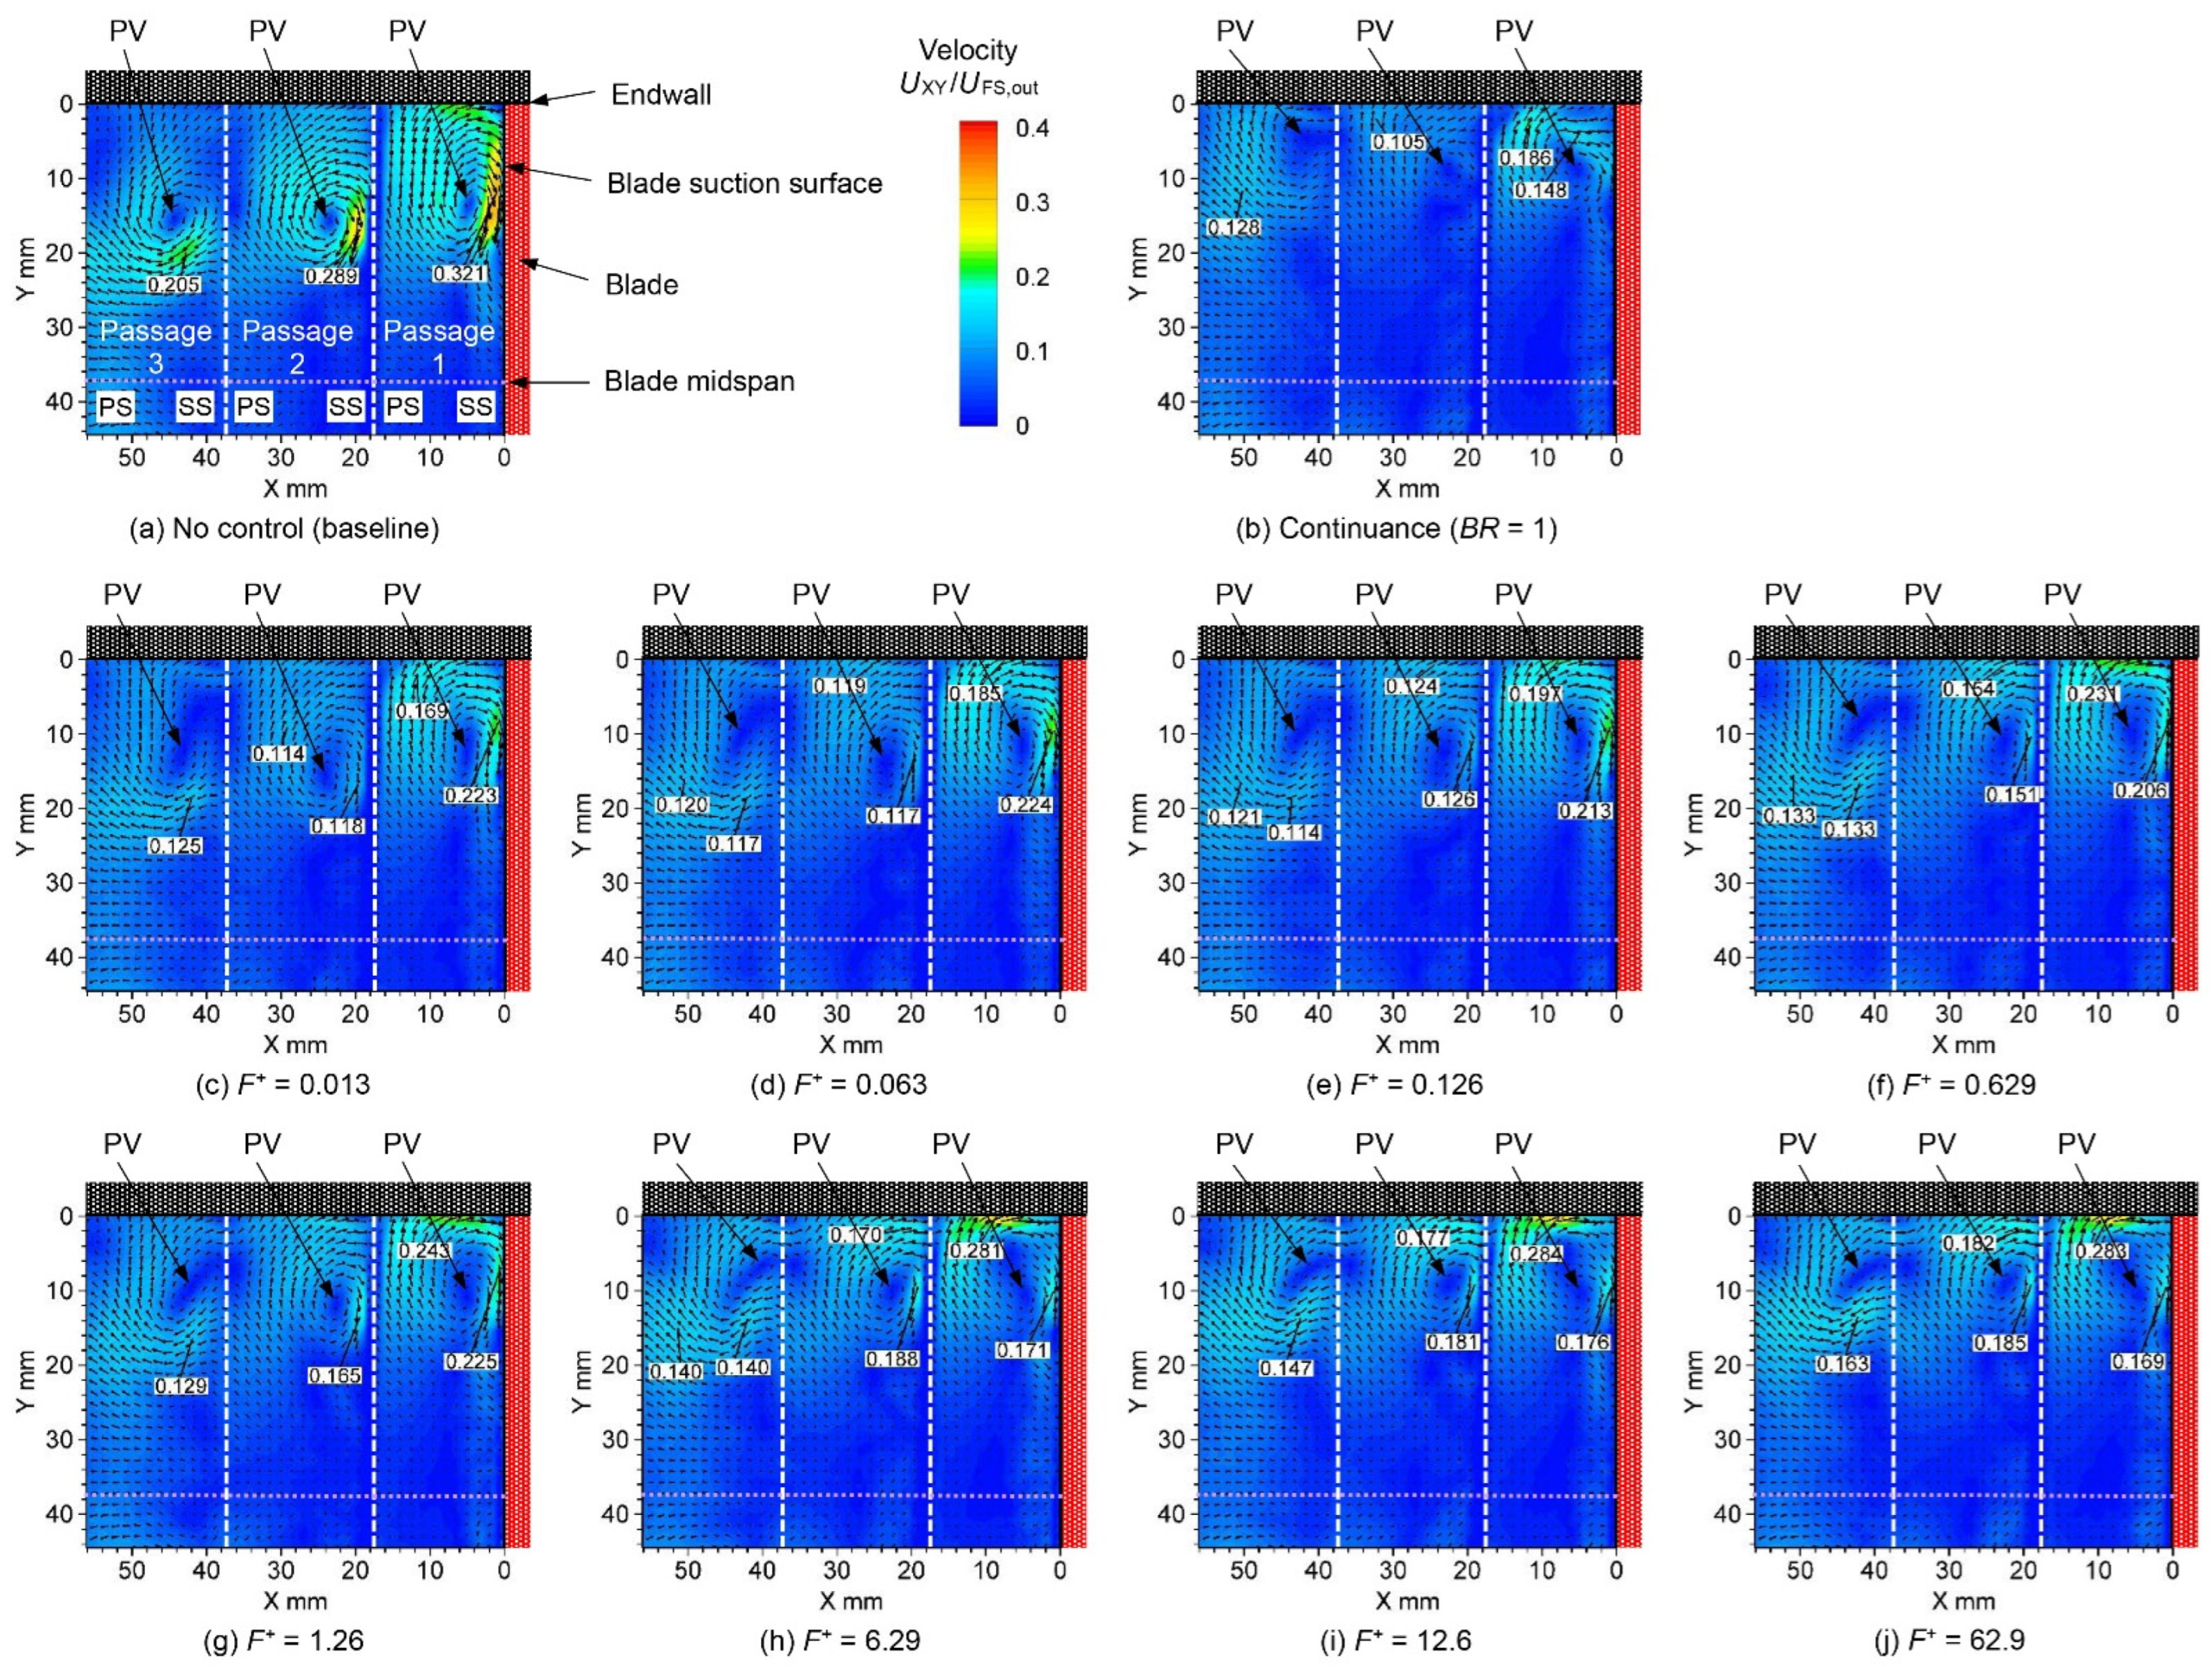
Figure 8 shows the velocity distribution, including the velocity peak values, at the linear turbine cascade outlet when the burst ratio of the plasma actuator was changed.
Figure 8a shows the velocity distribution at the no-control condition as a baseline. A large clockwise passage vortex (PV in the figure) was observed at each passage, and the secondary flow was strengthened when the passage vortex collided with the blade suction surface side. The peak velocities of passages 1,2, and 3 at the inside of the blade, the blade exit, and downstream were 0.321, 0.289, and 0.205, respectively. The peak velocity of the passage vortex decreased as the vortex moved downstream.
Figure 8b–n show the velocity distributions when the burst ratio was changed as the plasma actuator was operated. As shown in
Figure 8b–d, the peak velocity due to passage vortices in each blade decreased at very small drive conditions of 0.01–0.05 (operation of 1–5%). As seen in
Figure 8e, with a burst ratio of 0.1 (10%), in passage 1 inside the blade, the high-velocity region moved to the top endwall side, and the location of the peak velocity moved to the endwall side. The peak velocity increased consecutively. This is because the interference between the vortex and the wall surface was strengthened by moving the position of the passage vortex to the endwall side. As seen in
Figure 8f–j, with a burst ratio of 0.2–0.6 (20–60%), the high-velocity region of passage 1 gradually moved to the endwall. As seen in
Figure 8k–n, with a burst ratio of 0.7–1 (70–100%), the high-velocity region of passage 1 moved from the endwall to the blade pressure side, and the peak location of the velocity also moved to the blade pressure side.
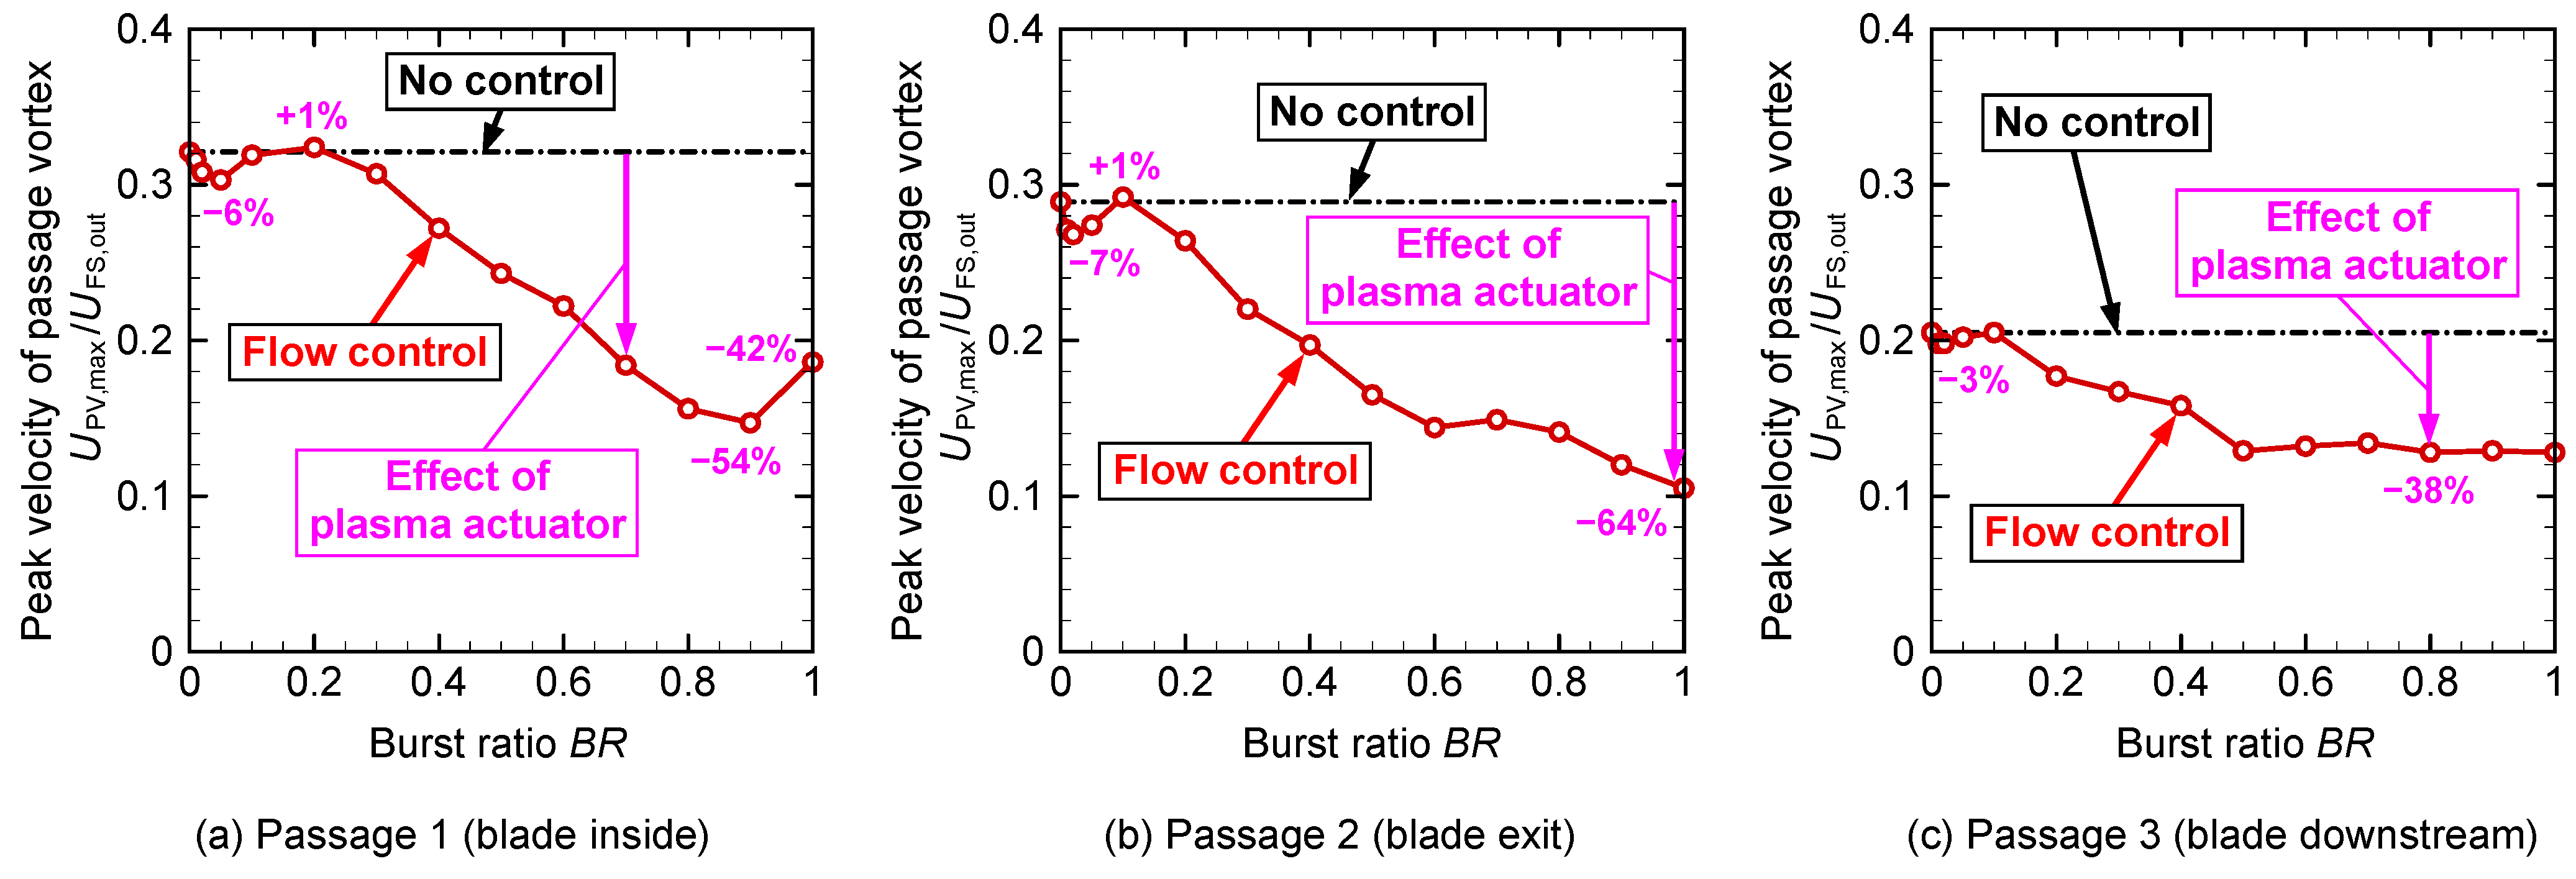
Figure 9 shows the peak velocity (local maximum velocity) of the passage vortex at various burst ratios shown in
Figure 8. In passage 1 at the blade interior, shown in
Figure 9a, a peak velocity decrease of 6% was observed at a very low
BR of 0.05 (5% operation). Although the peak velocity increased temporarily at
BR = 0.2, it decreased gradually after
BR = 0.2. The decrease in the peak velocity was up to 54% at
BR = 0.9. At
BR = 1, as shown in
Figure 8n, the velocity reduction effect was slightly weaker than that at
BR = 0.9 because the velocity peak increased at the blade pressure side of the endwall. In passage 2 at the blade outlet, shown in
Figure 9b, a peak velocity decrease of 7% was observed at a very low
BR of 0.02 (2% operation). After increasing once at
BR = 0.1, the peak velocity gradually decreased, and the peak velocity at
BR = 1 decreased by 64%. In passage 3 at the blade downstream, as shown in
Figure 9c, the peak velocity decreased by 3% at
BR = 0.02, and then, at
BR = 0.1, it became virtually the same value as in the no-control case. Thereafter, the peak velocity gradually decreased until
BR = 0.5, and it became approximetely flat above
BR = 0.5. A peak velocity decrease of 38% was maintained thereafter.
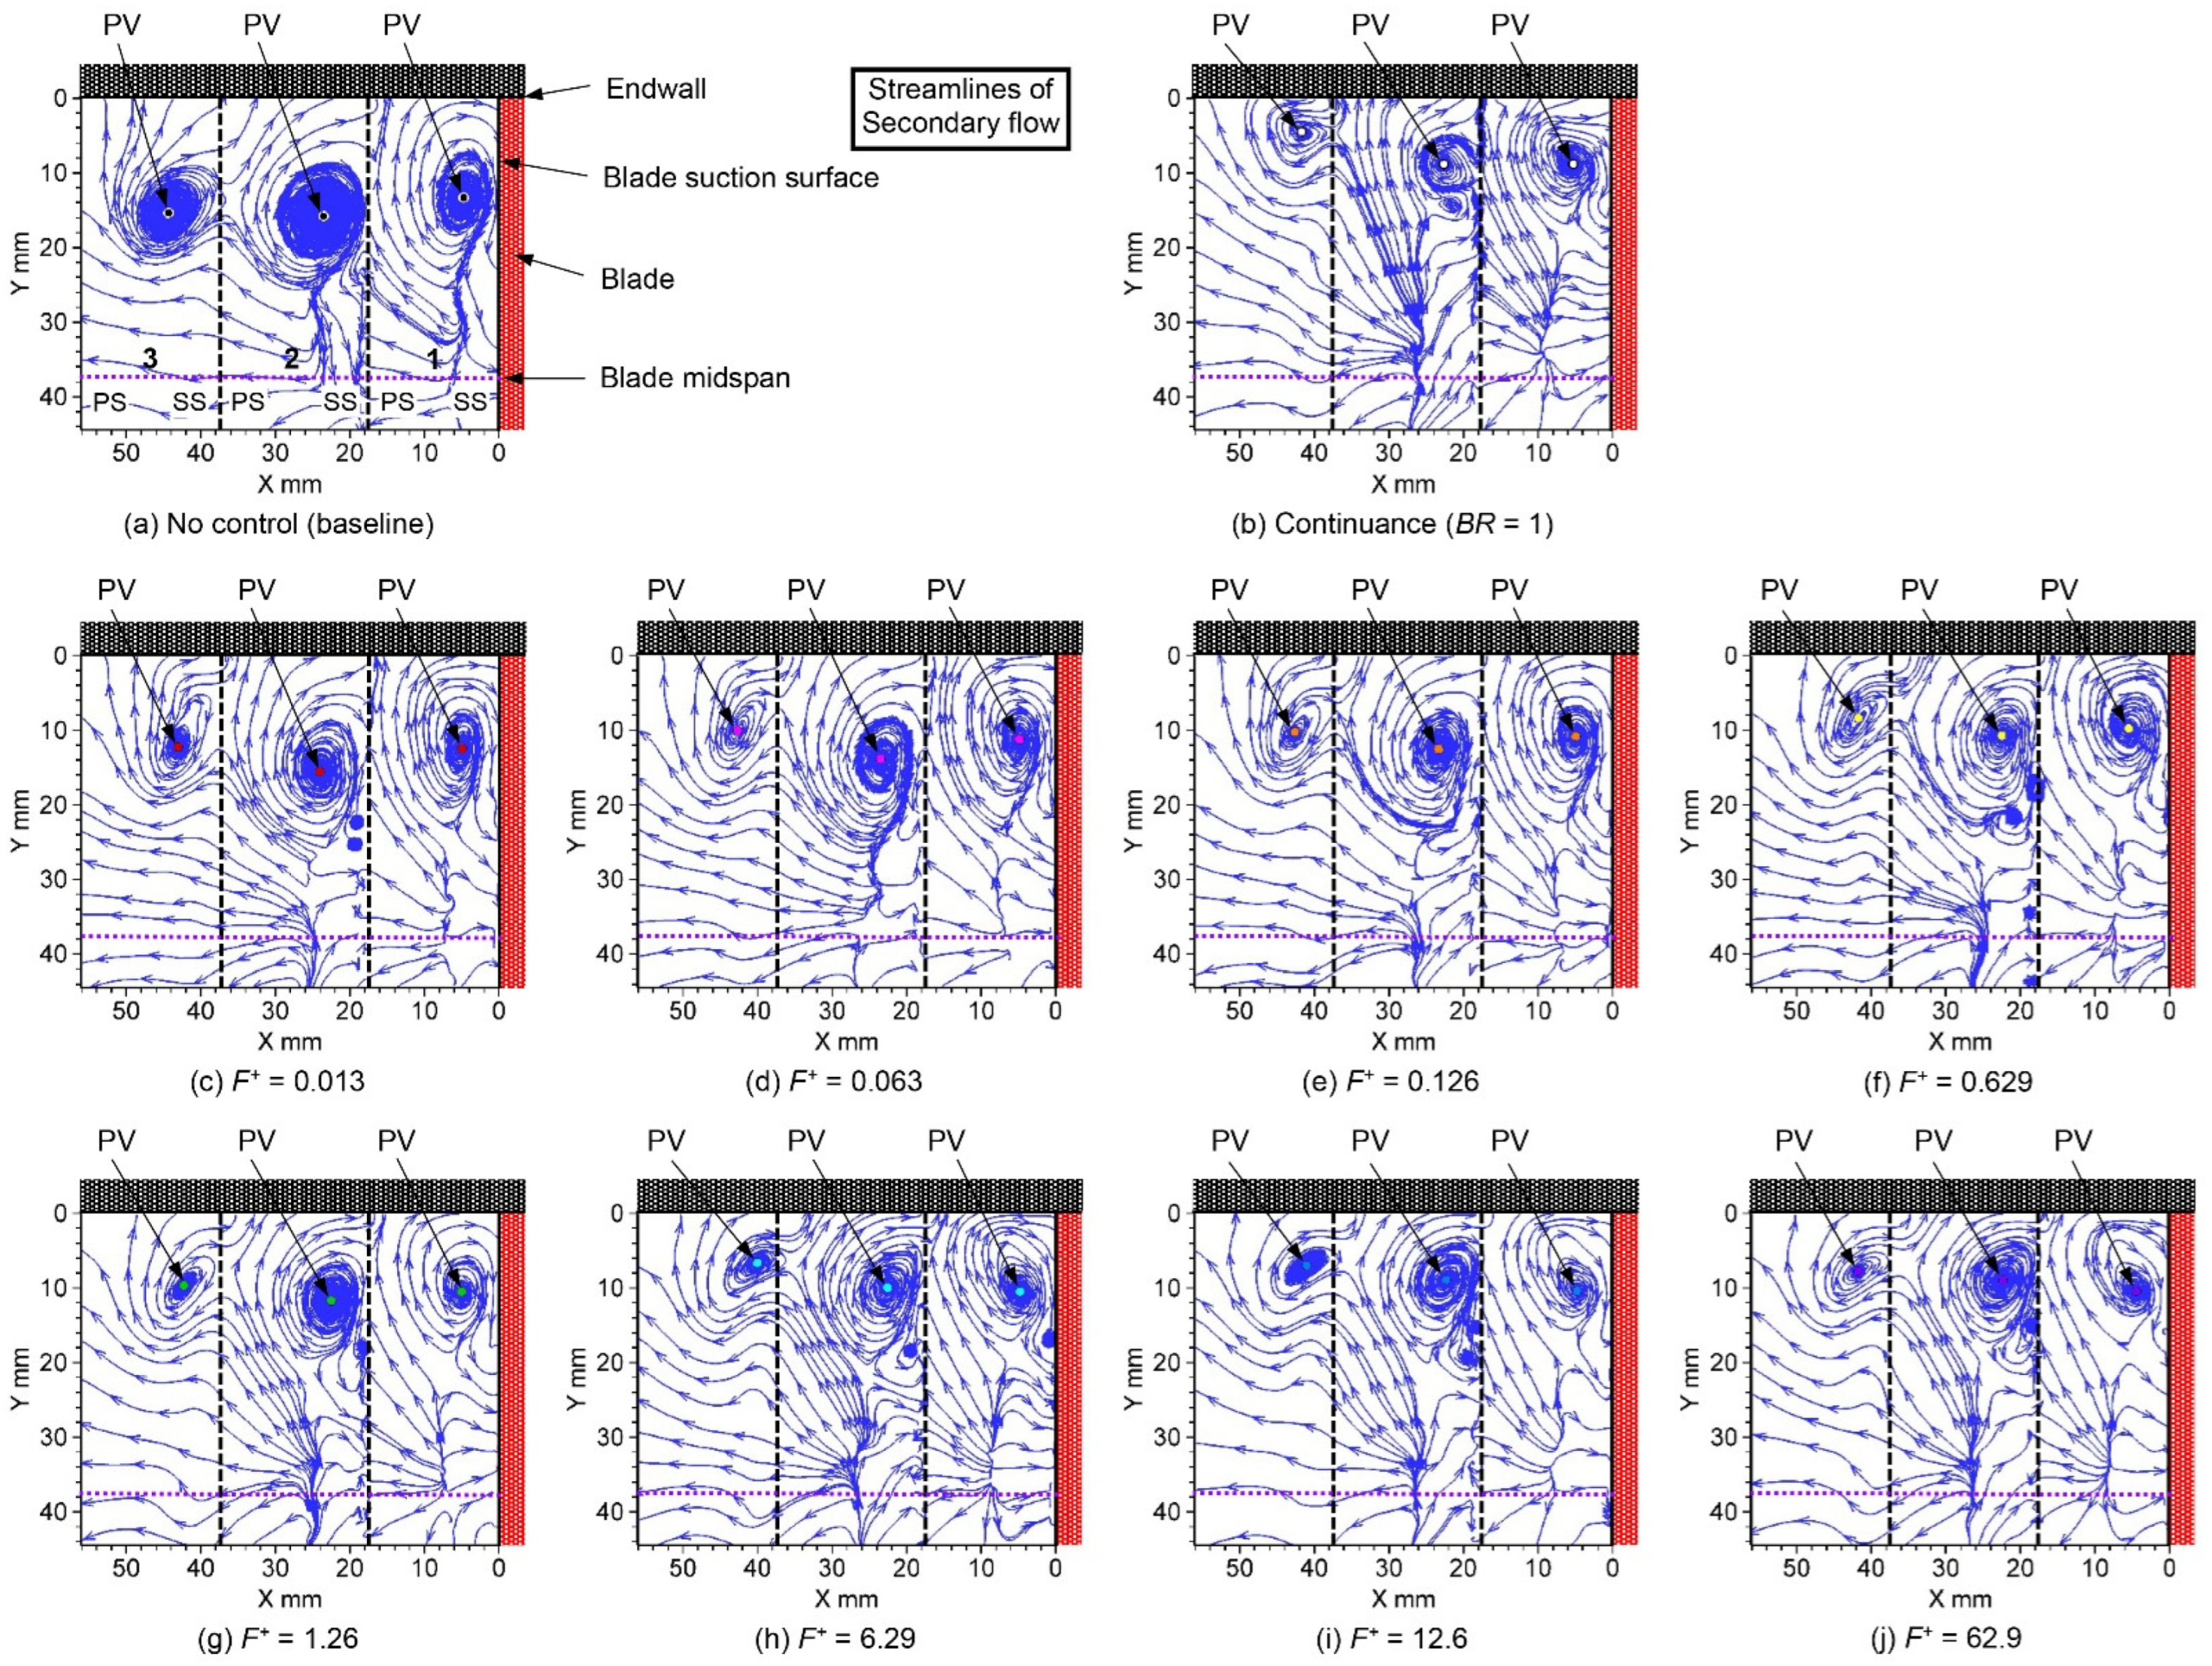
Figure 10 shows the streamlines of the secondary flow at each burst ratio, which shows the center position of the passage vortex. The locations of the passage vortices are shown in each figure.
Figure 10a shows the case with no flow control as a baseline. There were clockwise passage vortices in each passage, and their center positions were
Y = 13 mm,
Y = 16 mm, and
Y = 15 mm in passages 1, 2, and 3, respectively. As seen in
Figure 10b–d, there was little change in the vortex center position at
BR = 0.01–0.05. In contrast, as shown in
Figure 10e, at
BR = 0.1, the center position of the passage vortex rose on the endwall side as
BR increased. As seen in
Figure 10j, a small counterclockwise vortex was generated on the blade suction side on the lower side of the passage vortex for
BR = 0.6. An increase in the burst ratio resulted in a larger counterclockwise vortex.
Figure 11 shows plots of the center position of the passage vortex, as shown in
Figure 10. The center positions at no control and continuous flow control (
BR = 1) are shown as black circles and white circles, respectively. Through continuous flow control, the center position of the passage vortex moved to the uppermost endwall side. In the burst operation cases, as the burst ratio increased, it gradually moved from the position of no control to the position of continuous flow control. The moving volume of the center position of the passage vortex by the flow control of the plasma actuator increased as the position moved downstream from passages 1, 2, and 3 at the blade inside, blade exit, and blade downstream, respectively.
Figure 12 shows changes in the vertical direction (
Y-direction) position of the vortex center shown in
Figure 11. At passage 1 at the blade interior, shown in
Figure 12a, the distance with the upper endwall surface at
BR = 0.2 decreased by 35% compared with the baseline. This value is approximately the same as the decrease at the continuous operation of
BR = 1. In passage 2 at the blade exit, as shown in
Figure 12b, the larger the burst ratio, the more closely the vortex center approached the upper endwall surface. In continuous operation (
BR = 1), the distance between the wall surface and the vortex center decreased by 43%. This tendency was more pronounced in passage 3 at the blade downstream, as shown in
Figure 12c. The vortex center location at passage 3 varied steeply at a burst ratio between 0.4 and 0.6. This tendency is also clearly confirmed in
Figure 11. The distance between the endwall and the vortex center decreased by as much as 71% at
BR = 0.9.
Figure 13 shows the distribution of the turbulence intensity at each burst ratio.
Figure 13a shows the results without flow control. In each passage, the turbulence intensity was high at the center of the passage vortex. In passage 1 inside the blade, the turbulence intensity was 14.9% around
Y = 20 mm, where the passage vortex hit the blade suction side and rolled up, and the turbulence intensity was higher than that of the vortex center. On the lower side, at
Y = 25 mm, a region with high turbulence intensity was generated along the spanwise direction of the blade suction surface side, and the maximum turbulence intensity was 15.6%. The high turbulence intensity region along the blade suction surface side was caused by the separation of the boundary layer on the blade suction surface. Owing to the low Reynolds number condition, the horizontal width of the region of the high turbulence intensity caused by the flow separation was approximately one third of the blade pitch. At passage 2, the turbulence intensity at which the passage vortex rolled up from the blade suction surface was 13.5%, which was slightly weaker than that at passage 1. Similarly, the maximum turbulence intensity weakened to 12.6% in the region with high turbulence intensity, owing to the boundary layer separation.
Figure 13b shows the result of the plasma actuator being controlled by a burst ratio of 1% (
BR = 0.01). Compared to
Figure 13a, each peak value of the turbulence intensity decreased, and it could be confirmed that it was effective even with only 1% operation of the plasma actuator. Up to a burst ratio of 0.2, as shown in
Figure 13c–f, there was no significant change in the value of the maximum turbulence intensity, but the location of the maximum turbulence intensity moved to the upper endwall side. This appeared to be accompanied by the movement of the center position of the passage vortex to the upper endwall surface, as shown in
Figure 11. As shown in
Figure 13g, in passage 1 inside the blade, the position of the maximum turbulence intensity due to the passage vortex hardly changed, but the strength of the maximum turbulence intensity gradually decreased. In passage 2 at the blade exit and passage 3 at the blade downstream, the position of the maximum turbulence intensity of the passage vortex moved to the upper endwall side, and the strength of the turbulence intensity gradually weakened. In contrast, the separation region on the blade suction surface observed in passage 1 had a nearly constant strength of maximum turbulence intensity and maintained a value of approximately 16%. This separation region existed up to approximately
Y = 30 mm at no control; however, when the burst ratio was increased at flow control, it extended upward to approximately
Y = 20 mm. This is because the flow separation region expanded by weakening the passage vortex.
Figure 14 shows how the turbulence intensity at the center position of the passage vortex of
Figure 13 changes with the burst ratio. According to
Figure 14a, at the blade interior, there was no change from no control (
BR = 0) to
BR = 0.2, and it was virtually constant around 13%. At
BR = 0.3 or higher, the turbulence intensity of the vortex center gradually decreased as the burst ratio increased. At
BR = 0.9, a decrease of up to 49% was observed. According to
Figure 14b, at the blade exit, no effect was observed until
BR = 0.2; however, at
BR = 0.3 to 0.6, the larger burst ratio resulted in smaller turbulence intensity. At
BR = 0.6 or higher, the turbulence intensity was maintained approximately constant, and a decrease of up to 37% was observed at
BR = 0.8. In passage 3 at the blade downstream, as shown in
Figure 14c, a decrease in the turbulence intensity of 10% was observed at
BR = 0.02. The turbulence intensity was gradually decreased between
BR = 0.1 and 1, and the turbulence intensity decreased by up to 58% at
BR = 1.
Figure 15 shows how the vorticity distribution changes with the burst ratio. At no control, as shown in
Figure 15a, the area of the passage vortex had negative vorticity. The vorticity at the center of the passage vortex in passages 1, 2, and 3 was −720, −630, and −500 s
−1, respectively. The strength of the negative vorticity decreased as the passage vortex moved downstream. The negative peak vorticity at passages 1, 2, and 3 was −830, −690, and −540 s
−1, respectively, and their position and peak value were close to those at the center of the passage vortex. In passage 1, a strong counterclockwise vortex with positive vorticity occurred when the passage vortex hit the blade suction surface and rolled up. The maximum positive vorticity at passages 1, 2, and 3 was 1160, 840, and 250 s
−1, respectively, and it weakened rapidly as the counterclockwise vortex moved downstream.
Figure 15b shows the vorticity distribution at flow control of
BR = 0.01. Both the vorticity at the center of the passage vortex and the negative peak vorticity were weaker than those at the no-control condition. Even plasma actuator operation at a slight burst ratio suppresses the passage vortex. As shown in
Figure 15c, as the burst ratio decreased, the negative vorticity region decreased and moved to the upper endwall surface side.
In
Figure 15, the value of the vorticity at the center of the passage vortex and the value of the negative peak vorticity are indicated. In the case of no control, as in
Figure 15a, the position where the absolute value of the negative vorticity is the maximum is in close agreement with the center position of the passage vortex. In contrast, in the case of the control after
Figure 15b, the position where the strength of the negative vorticity is the maximum peak is separated from the center of the passage vortex. It exists between the center position of the passage vortex and the upper endwall surface or blade suction surface. The reason for this is that the passage vortex weakens as the burst ratio increases, owing to the operation of the plasma actuator, and it approaches the upper endwall side and the blade suction surface side. Therefore, the interaction between the passage vortex and the upper endwall surface or the blade suction surface becomes stronger.
Figure 16 shows a negative vorticity at the center position of the passage vortex, as shown in
Figure 15.
As shown in
Figure 16a, the magnitude of the vorticity suddenly weakened at a burst ratio as low as
BR = 0.1. The magnitude of vorticity was reduced by as much as 27% at
BR = 0.1 (10% operation). Although the absolute value of the vorticity increased temporarily at
BR = 0.2, this seemed to be because the center of the passage vortex moved to the upper endwall side, and the interference between the vortex and the endwall surface intensified, as shown in
Figure 12a. From
BR = 0.2 to 0.5, the strength of the vorticity rapidly weakened, and it decreased by as much as 67% at
BR = 0.6. After
BR = 0.6, the vorticity remained practically constant until
BR = 0.8. After
BR = 0.8, the strength of the vorticity tended to increase gradually, and the decrease became 54% at
BR = 1. This seemed to be due to the fact that the vortex center moved further to the upper endwall side, as observed in
Figure 12a, and the interaction between the passage vortex and the endwall surface intensified.
As seen in
Figure 16b, the vorticity at flow control of
BR = 0.02 (2% operation) was reduced by 16% from that at no control. Subsequently, the vorticity at
BR = 0.1 was increased by 10%. This is because the vortex center at
BR = 0.1 moved to the upper endwall side, as observed in
Figure 11b. Simultaneously, as observed in
Figure 12b, the turbulence intensity at
BR = 0.1 was also 9% higher than that at no control. After
BR = 0.2, the vorticity gradually weakened, and the vorticity at
BR = 0.8 was decreased by 70%. At
BR = 0.9 and
BR = 1, the vorticity increased slightly, because the center position of the vortex moved further to the upper endwall side, as shown in
Figure 12b, and the interference between the passage vortex and the endwall surface intensified. This can also be observed from the increase in the turbulence intensity, as shown in
Figure 14b.
As seen in
Figure 16c, the vorticity decreased rapidly with very slight operation at
BR = 0.01, and it was reduced by as much as 24% at
BR = 0.05. Concurrently, the center position of the passage vortex shown in
Figure 12c moved downward slightly, away from the upper endwall surface. The magnitude of the vorticity increased slightly at
BR = 0.1. The vortex center position shown in
Figure 12c at
BR = 0.1 moved to the upper endwall side, and the interaction between the endwall surface and the vortex was temporarily intensified. From
BR = 0.2 to 0.5, the vorticity gradually decreased. From
BR = 0.5 to 0.8, the vorticity was nearly flat, and at
BR = 0.9 or higher, the magnitude of the vorticity decreased again. The magnitude of the vorticity at
BR = 1 was reduced by 66%.
Figure 17 shows the negative peak vorticity shown in
Figure 15. The overall trend is similar to that shown in
Figure 16. In
Figure 17a, the vorticity from
BR = 0 to
BR = 0.2 is virtually constant; however, it decreases sharply after
BR = 0.2. The magnitude of the negative peak vorticity decreases by 67% at
BR = 0.8. In
Figure 17b, the vorticity falls sharply at
BR = 0.02 (19% reduction), and then increases once at
BR = 0.1. The vorticity gradually decreased after
BR = 0.2 and showed a decrease of up to 70% at
BR = 0.8. In
Figure 17c, the vorticity drops sharply at
BR = 0.02 (15% reduction), then slightly increases at
BR = 0.1, gradually decreases after
BR = 0.1, and decreases by 56% at
BR = 0.7. After
BR = 0.7, the vorticity remains practically constant. Finally, the magnitude of the vorticity at
BR = 1 is slightly increased, and the reduction in the vorticity is 50%.
As shown in
Figure 8,
Figure 9,
Figure 10,
Figure 11,
Figure 12,
Figure 13,
Figure 14,
Figure 15,
Figure 16 and
Figure 17, the effect of the burst ratio on the burst operation of the plasma actuator was examined. The higher the burst ratio, the weaker the passage vortex and the more the passage vortex moves to the upper endwall surface and blade suction surface side. However, it was clarified that the velocity distribution, streamlines of the secondary flow, turbulence intensity distribution, and vorticity distribution did not necessarily change proportionally with the change in the burst ratio and that the turbulence intensity and vorticity decreased or increased temporarily with the movement of the passage vortex and the interaction between the passage vortex and the upper endwall surface.
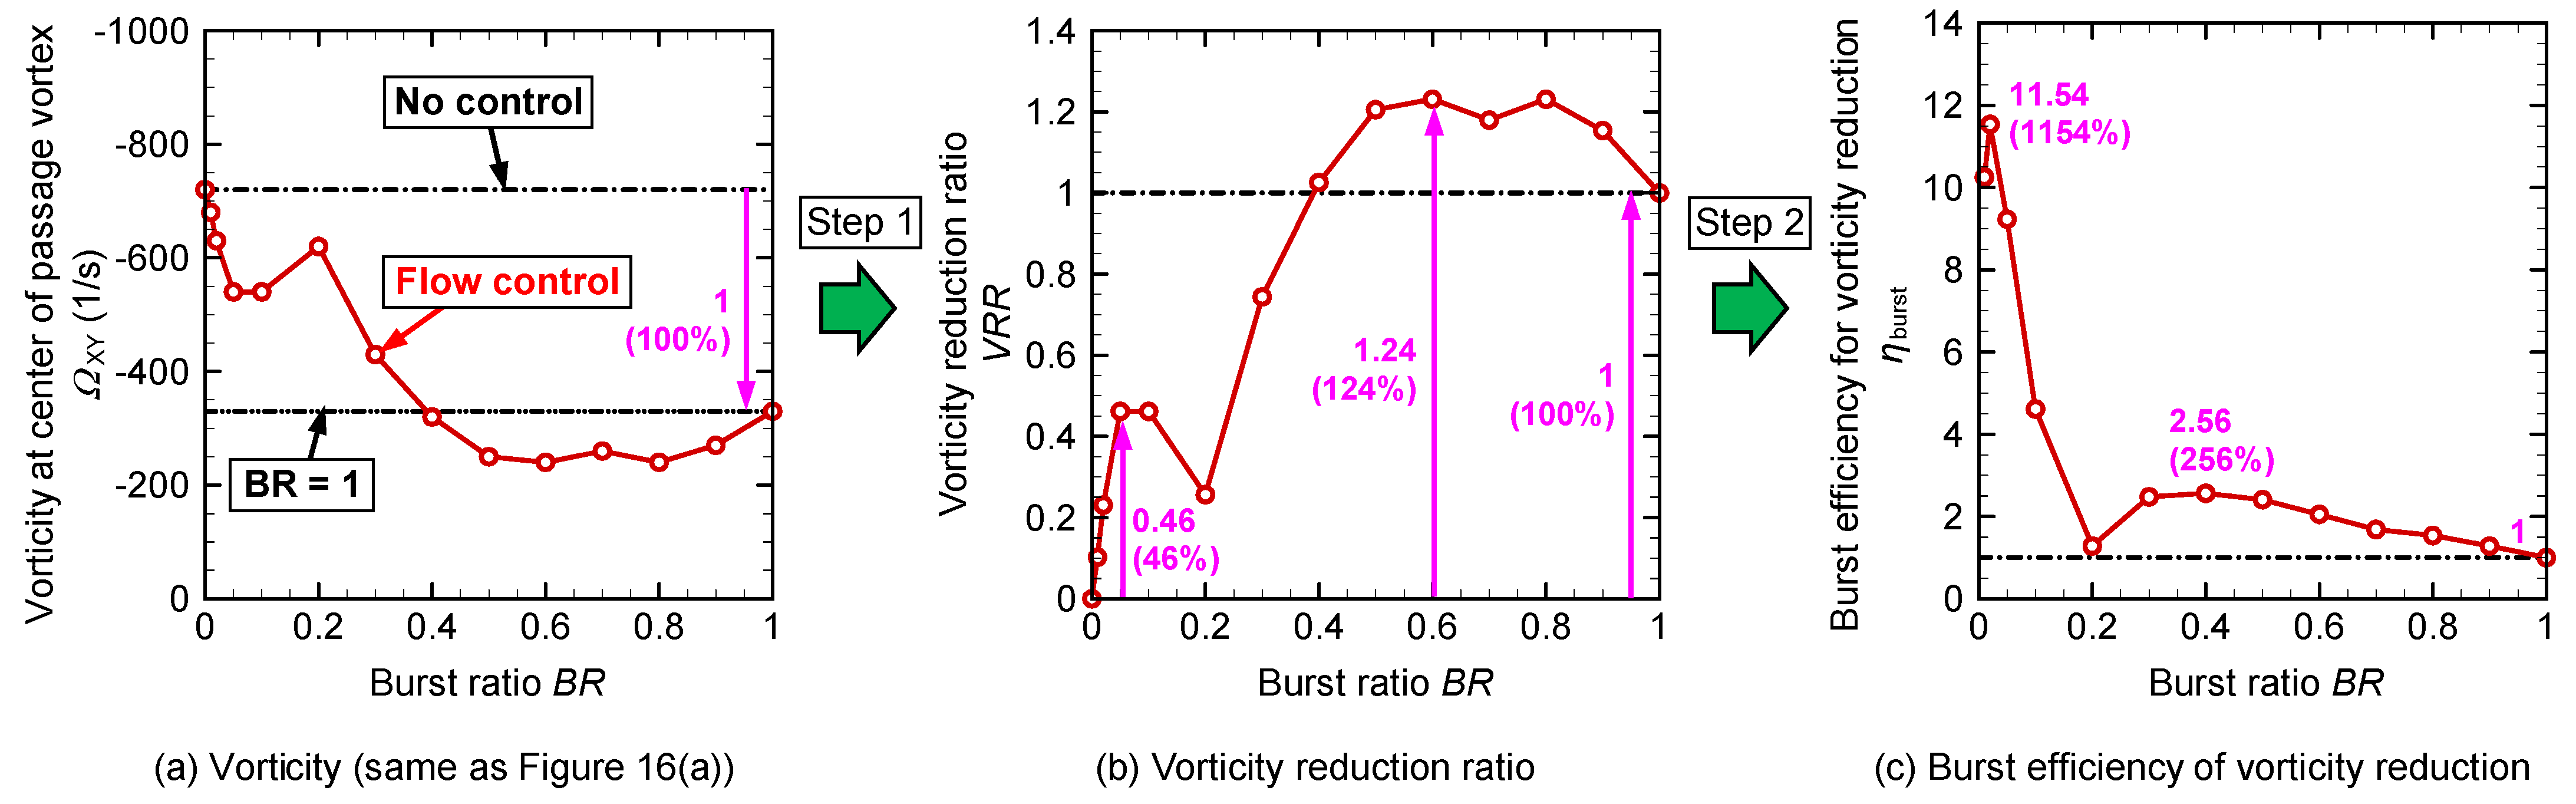
To consider and discuss the energy consumption during burst mode operation, the vorticity reduction ratio (
VRR) and burst efficiency (
ηburst) were analyzed. The analysis process is illustrated in
Figure 18.
Figure 18a shows a representation of the vorticity at the center of the passage vortex in passage 1 at the blade interior at various burst ratios, as shown in
Figure 16a.
As the first step,
VRR was calculated as follows:
where Ω
XY,NC and Ω
XY,BR = 1 are the vorticities at the center of the passage vortex at no control and in continuous operation mode (
BR = 1), respectively. The calculated results are shown in
Figure 18b. In this figure, the vorticity reduction ratio in continuous mode operation,
BR = 1, is set to 1 (100%) as a reference. There were two peaks of
VRR. One was at
BR = 0.05 (5% operation), where the
VRR becomes 0.46 (46%). The other was at
BR = 0.6 (60% operation), where the
VRR becomes 1.24 (124%) reduction. These results indicate that burst mode operation by a few percent results in a larger vorticity reduction, and burst mode operation with a burst ratio from 50% to 90% results in a higher vorticity reduction compared with continuous mode operation.
In the second step, the efficiency of the burst mode for the vorticity at the center of the passage vortex,
ηburst, was calculated as follows:
The calculated results are shown in
Figure 18c. Because the electric energy consumption of the plasma actuator in burst mode operation is proportional to the burst ratio [
22], the burst efficiency,
ηburst, indicates the efficiency of the vorticity reduction effect considering the electric energy consumption of the plasma actuator. In
Figure 18c, two high peaks of burst efficiency are observed. One peak is located at a very low burst ratio of
BR = 0.05 (5% operation), where the burst efficiency is as much as 11.54 (1154%), compared with that in continuous mode operation. The other peak is located at
BR = 0.4 (40% operation), where the burst efficiency is 2.56 (256%). In this figure, the burst efficiency at any burst ratio is greater than 1 (100%). This result indicates that the burst mode operation of the plasma actuator is more effective than continuous mode operation in terms of electric energy consumption.
There is no other study concerning the burst mode operation of plasma actuators for the reduction of the passage vortex in the turbine blade. Therefore, the results in this study were compared with burst mode operation for the reduction of the flow separation on the suction surface of single airfoils. Corke and Post [
4] reported that only
BR = 0.1 (10%) was sufficient for the separation control of an airfoil. Bernard et al. [
5] also found that the lift force on an airfoil was enhanced at
F+ = 1.0 and
BR = 0.06 (6%), while the electric power consumption was significantly reduced compared to steady actuation. They described that the momentum transfer at such low
BR is presumably reduced compared to larger
BR and continuous operation. The amount of momentum transfer to the boundary layer of the airfoil is not the primary parameter for effective control. It was suspected that the periodic perturbations imparted by the plasma discharge drove the performance of the control. With the passage vortex reduction control of turbine blades in this study, a similar tendency was observed. There were two peaks in the high burst efficiency of the vorticity reduction at a very low
BR of 0.05 (5%) and at a relatively higher
BR of 0.4 (40%). The first peak in high burst efficiency at low BR is considered to be generated by the perturbation of the inlet boundary layer of the turbine cascade. Hence, the second peak in high burst efficiency at high
BR is due to the synergistic effect of both the perturbation and momentum transfer to the inlet boundary layer. These two points offer new perspectives on the active flow control of the passage vortex in turbomachinery.
3.2. Effects of Burst Frequency
Figure 19 shows the effect of the difference in burst frequency on the measured velocity distribution.
Figure 19a shows the velocity distribution with no control, and
Figure 19b shows the velocity distribution with flow control during continuous operation (
BR = 1).
Figure 19a,b are the same as
Figure 8a,n, respectively.
Figure 19c–j show the velocity distributions when
F+ is changed under a 0.5 fixed burst ratio. In
Figure 19c, at the lowest burst ratio
, F+ = 0.013, the center position of the passage vortex is close to that in
Figure 19a with no control. However, the peak value of the velocity of the secondary flow is close to that shown in
Figure 19b for the continuous flow control of
BR = 1. As shown in
Figure 19d, the center position of the passage vortex moved to the upper endwall side as the burst frequency increased. Through this movement, the interaction between the passage vortex and the upper endwall becomes stronger, and the maximum peak velocity of the secondary flow is generated at the location where the passage vortex hits the upper endwall surface. In contrast, the interaction between the passage vortex and blade suction surface side becomes weaker, and the peak value of the velocity at the location where the passage vortex rolls from the blade suction surface side tends to be smaller.
Figure 20 shows how the peak value of the velocity generated by the passage vortex in
Figure 19 changes with the burst frequency increase. In each figure, the value at no control in
Figure 19a is shown by the black dash-dot-dash line, and the value at flow control by the continuous operation,
BR = 1, in
Figure 19b is shown by the black dash-dot-dot-dash line.
In
Figure 20a, at the lower burst frequency of
F+ = 0.013–0.126, the peak velocity is reduced more than that at no control, and a reduction of 34% is observed at
F+ = 0.126, which is closest to the baseline (represented by the black dash-dot-dot-dash line) at the continuous operation of
BR = 1. When the burst frequency was
F+ = 0.126–6.29, the peak value of the velocity tended to increase with the burst frequency. This is because, as observed in
Figure 19, the center position of the passage vortex moved to the upper endwall side, and the interaction between the vortex and endwall surface became stronger. Hence, at
F+ = 6.29–62.9, the peak value of the velocity was nearly constant.
In
Figure 20b, the same tendency as in passage 1 is observed. At
F+ = 0.013–0.063, the reduction in the peak value of the velocity was large, and a reduction of as much as 59% was observed, which is quite close to the value of continuous flow control (
BR = 1). At
F+ = 0.063–6.29, the peak velocity due to passage vortices gradually increased; then, at
F+ = 6.29–62.9, the peak velocity was nearly constant.
In
Figure 20c, at the burst frequency
F+ = 0.063–1.26, the peak velocity is virtually constant, and the value is coincident with that during continuous operation (
BR = 1). The peak velocity was reduced by up to 41%. Above
F+ = 1.26, the peak velocity gradually increased. The peak velocity at
F+ = 62.9 was nearly in the middle position between no control and continuous flow control.
In any passage, the peak velocity tended to increase as the burst frequency increased. This is because the passage vortex moved to the upper endwall side as the burst frequency increased, and the interaction between the passage vortex and endwall surface became stronger.
Figure 21 shows the streamlines of the secondary flow when the burst frequency changes.
Figure 21a,b show the streamline distributions with no control and continuous flow control, respectively, and are the same as
Figure 10a,n.
Figure 21c,j show the results when the burst frequency was changed. As the burst frequency increased, the center position of the passage vortex moved to the upper endwall side.
Figure 22 shows a plot of the center position of the passage vortex shown in
Figure 21. The black circle in the figure shows the vortex center with no control, and the white circle shows the vortex center during continuous operation (
BR = 1). The center position at the lowest burst frequency,
F+ = 0.063 (red circle), is closest to that of the no-control case (black circle). As the burst frequency increased, the center position gradually approached that of the continuous operation flow control (white circle). When passages 1–3 are compared, the movement to the upper endwall side of the vortex center location increases as the vortex moves downstream at passage 1 inside the blade, passage 2 at the blade exit, and passage 3 at the blade downstream, which means that the flow control effect of the plasma actuator becomes higher downstream.
Figure 23 shows how the vertical distance (
Y-coordinate) from the upper endwall surface at the center position of the passage vortex in
Figure 22 changes with the burst frequency.
In
Figure 23a, at the lowest burst frequency of
F+ = 0.013, the center position of the passage vortex is far from the upper endwall surface, and it is close to the center position with no control. At a burst frequency of
F+ = 0.013–0.629, a higher burst frequency results in a smaller distance between the vortex center position and the upper endwall surface. At
F+ = 0.629, the distance between the vortex center and the upper endwall surface was reduced by 26%, and it was close to the vortex center position in continuous flow control (
BR = 1). At a burst frequency of
F+ = 1.26 or higher, the vortex center position remained virtually constant.
In
Figure 23b, the vortex center position at
F+ = 0.013 is practically the same as that at no control. As the burst frequency increased, the vortex center position gradually moved to the upper endwall side, and at
F+ = 12.6, the distance between the vortex center and the endwall decreased by 43% compared with that at no control, and it became the same as that at continuous flow control (
BR = 1). Subsequently, it maintained the same value at
F+ = 62.9.
Figure 23c shows that
Y had the largest value at
F+ = 0.013. As the burst frequency increased, the vortex center position gradually moved to the upper endwall side. At
F+ = 6.29,
Y decreased by as much as 57% compared with
Y at no control. After
F+ = 12.6,
Y tended to increase slightly.
Figure 24 shows how the turbulence intensity distribution changes with the change in burst frequency.
Figure 24a,b are the same as
Figure 13a,n at no control (
BR = 0) and continuous flow control (
BR = 1), respectively.
Figure 24c–j show the distributions of the turbulence intensity when the burst frequency
F+ is changed under conditions where the burst ratio is fixed at 0.5. When the smallest burst frequency of
F+ = 0.013 is used, as shown in
Figure 24c, the turbulence intensity distribution is closer to that with no control, shown in
Figure 24a, than that with continuous flow control, as shown in
Figure 24b. As shown in
Figure 24d, as the burst frequency increases, the turbulence intensity distribution approaches that of the continuous flow control, shown in
Figure 24b. At burst frequency
F+ = 6.29, as shown in
Figure 24h, the turbulence intensity distribution is most similar to that of the continuous flow control, shown in
Figure 24b.
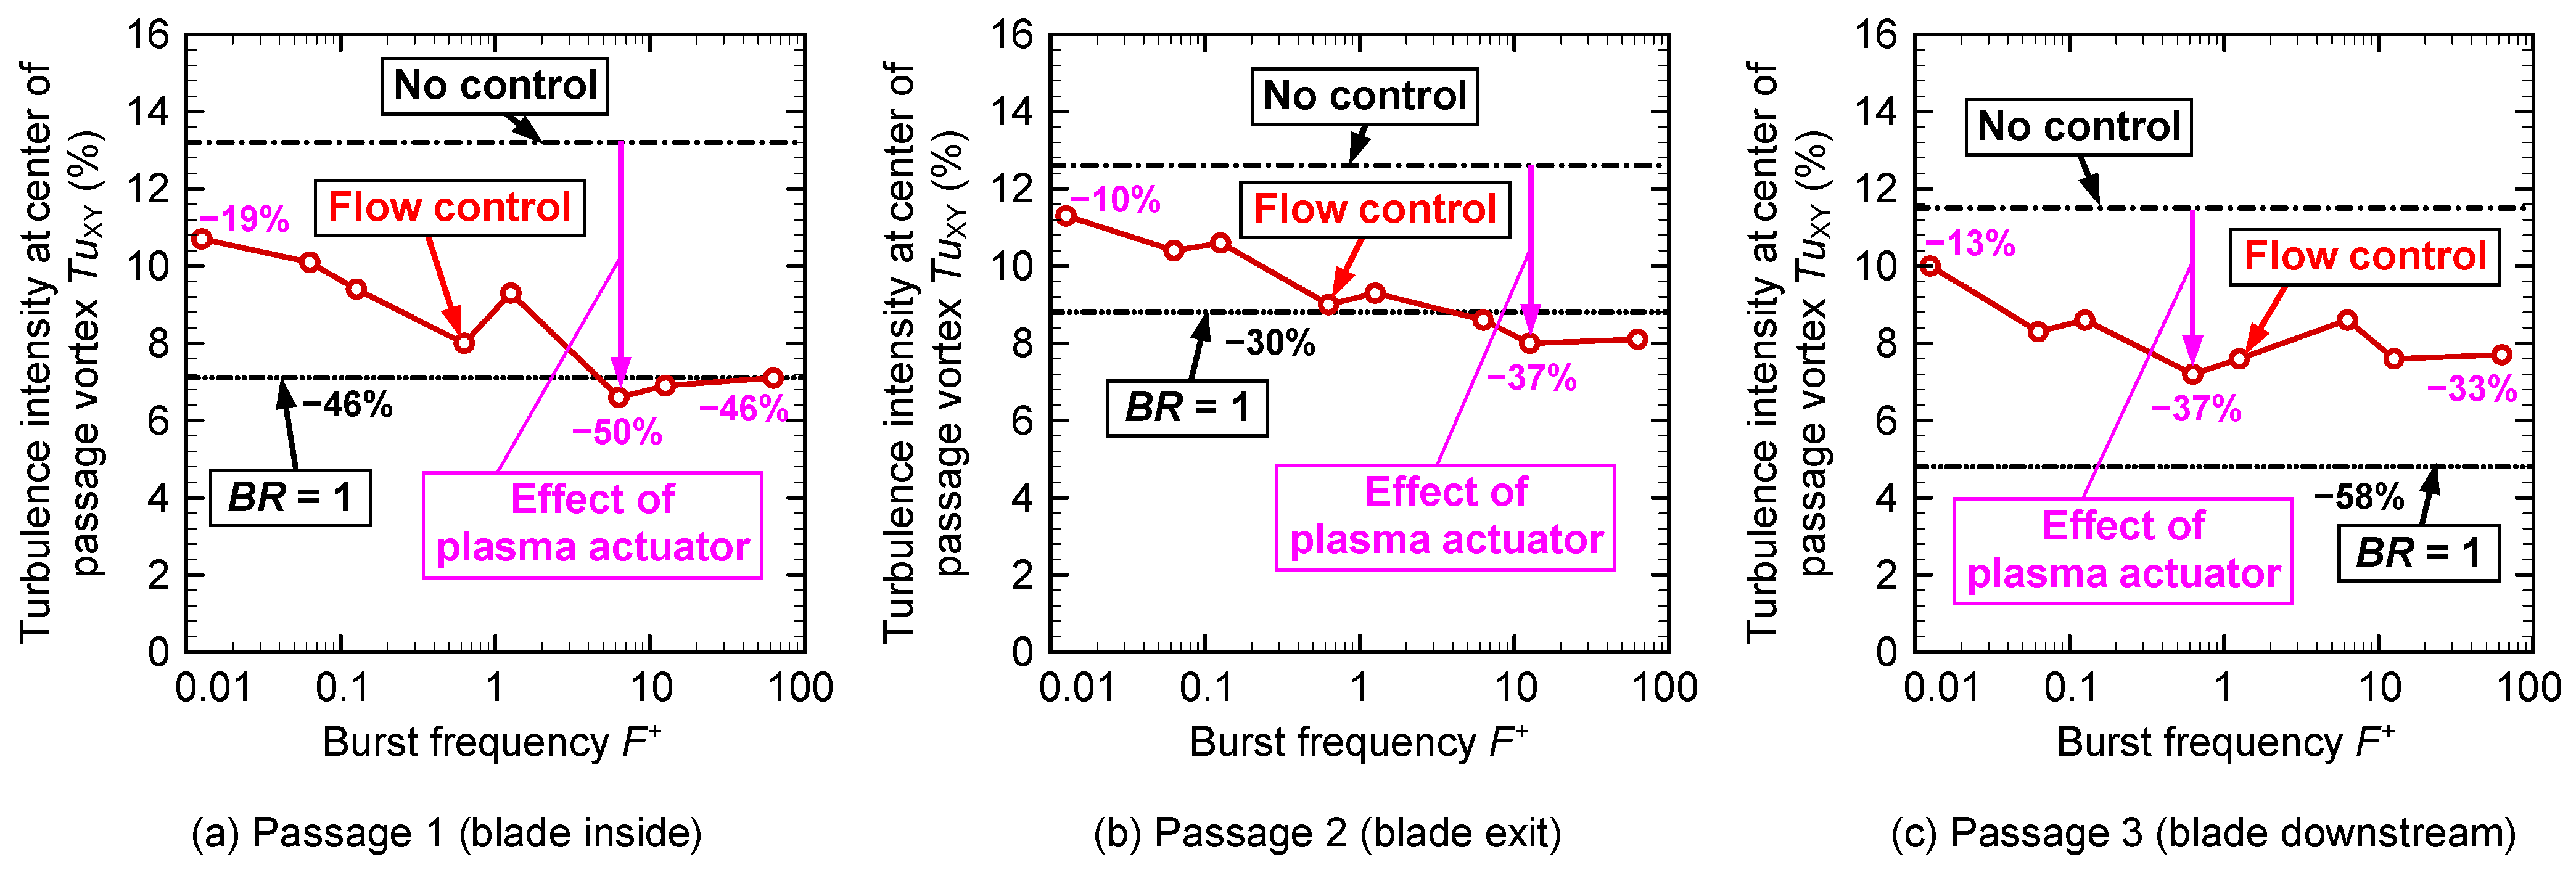
Figure 25 shows how the turbulence intensity at the center position of the passage vortex of
Figure 24 changes with the change in the burst frequency. The value at no control is shown by the black dash-dot-dash line, and the value at continuous flow control (
BR = 1) is shown by the black dash-dot-dot-dash line.
In
Figure 25a, at a low burst frequency, the turbulence intensity is located in the middle, between the value at no control and the value at continuous flow control. The higher the burst frequency, the smaller the turbulence intensity, and, at
F+ = 6.29, there is a reduction of 50% compared with that at no control, which nearly agrees with the black dash-dot-dot-dash line of continuous flow control. Even if the burst frequency increased further, there was not much change.
Figure 25b shows a similar tendency. At a low burst frequency, the turbulence intensity at the center of the passage vortex was closer to that at no control; however, it gradually decreased as the burst frequency increased. At
F+ = 0.629, the turbulence intensity was in close agreement with the value for continuous flow control. The turbulence intensity at
F+ = 12.6 was reduced by 37% compared with that at no control.
As shown in
Figure 25c, the turbulence intensity at a low burst frequency was close to the value at no control, and it decreased gradually as the burst frequency increased. At
F+ = 0.629, a reduction in the turbulence intensity of 37% was observed compared with the no-control condition. However, unlike passages 1 and 2, even at high burst frequencies, the turbulence intensity remained higher than that under continuous flow control.
Figure 26 shows how the vorticity distribution of the secondary flow changes with the change in the burst frequency. In the figure, the vortex at the center position of the passage vortex and the positive and negative peak values of the vorticity are recorded.
Figure 26a,b are the vorticity distributions at no control and continuous flow control (
BR = 1), respectively, and they are the same as
Figure 15a,n.
Figure 26c shows the vorticity distribution at the lowest burst frequency of
F+ = 0.013, and the distribution is similar to that with no control, as shown in
Figure 26a. However, the peak value of the vorticity is close to that of the continuous flow control (
BR = 1), as shown in
Figure 26b. In passage 1, the vorticity reaches a negative peak value when the passage vortex hits the blade suction surface side. In addition, there is a positive peak value of the vorticity in the vicinity of the blade suction surface. As shown in
Figure 26d, the higher burst frequency results in the movement of the negative vorticity region to the upper endwall surface side because of the movement of the passage vortex to the upper endwall. In passage 1, after
F+ = 6.29, as shown in
Figure 26h, a region in which the vorticity is strongly negative is formed near the upper endwall surface, because the passage vortex approaches the upper endwall surface.
Figure 27 shows the change in the vortex at the center position of the passage vortex by changing the burst frequency from
Figure 26. In passage 1, shown in
Figure 27a, despite the burst ratio being halved (
BR = 0.5), the vorticity at the passage vortex center is approximetely the same as the continuous flow control line (
BR = 1) at any burst frequency. At
F+ = 0.629, the vorticity decreased by as much as 67% compared with that at no control. A 54% decrease was observed for the magnitude of vorticity at
F+ = 0.629 of
BR = 0.5 compared to that of the continuous flow control with
BR = 1 (54% decrease). This indicates that the burst flow control at
BR = 0.5 also has the same or a greater vorticity reduction effect compared to the continuous flow control at
BR = 1. In passage 2, shown in
Figure 27b, the vorticity of the passage vortex center at any burst frequency of
BR = 0.5 is also close to that at continuous flow control. At
F+ = 0.063, the vorticity decreased by as much as 75% compared with that at no control. In passage 3, shown in
Figure 27c, the vorticity was close to that of continuous flow control at the low burst frequency before
F+ = 1.26. At
F+ = 0.629, the vorticity decreased by 72% compared with that at no control. In contrast, the vorticity increased to
F+ = 6.29 or higher. As observed in
Figure 23c, the interaction between the passage vortex and the upper endwall surface becomes stronger when moving the center position of the passage vortex to the upper endwall side at a high burst frequency.
Figure 28 illustrates the changes in the negative peak values of vorticity in response to changes in the burst frequency in the vorticity distribution shown in
Figure 26. In passage 1, shown in
Figure 28a, the negative peak vorticity is the lowest at
F+ = 0.629, and a decrease of 53% was observed compared with that at no control, which coincides with that at continuous flow control of
BR = 1. As the burst frequency decreases, the negative peak value of the vorticity gradually increases. A 40% reduction in the magnitude of vorticity is observed at
F+ = 0.013. Conversely, when the burst frequency becomes larger than
F+ = 0.629, the magnitude of vorticity increases rapidly to
F+ = 6.29 (where a 30% decrease in the magnitude of vorticity is observed), after which it remains approximately constant for values beyond
F+ = 6.29. In passage 2, as shown in
Figure 28b, the negative vorticity is lowest at
F+ = 0.126, and a 62% decrease is observed compared with that at no control, which is marginally lower than that at continuous flow control of
BR = 1 (59% reduction). At lower burst frequencies lower than
F+ = 0.126, a slight increase in vorticity is observed (55% reduction at
F+ = 0.013). In contrast, higher burst frequencies after
F+ = 0.126 gradually increase the vorticity as the burst frequency becomes higher (22% reduction at
F+ = 12.6). As seen in
Figure 28c, when the burst frequency is lower than
F+ = 0.629, the vorticity is virtually constant, and a decrease in vorticity by up to 50% is observed at
F+ = 0.063. This is practically the same value as that at continuous flow control (
BR = 1). In contrast, at
F+ values of 1.26 or higher, higher
F+ values result in higher vorticity (30% reduction at
F+ = 62.9). As observed in the vorticity distributions at a higher burst frequency in
Figure 26g–j, the passage vortex moves to the upper endwall side, the interference between the vortex and the endwall surface becomes stronger, and a larger vorticity region is generated.
The results from
Figure 19,
Figure 20,
Figure 21,
Figure 22,
Figure 23,
Figure 24,
Figure 25,
Figure 26,
Figure 27 and
Figure 28 are summarized as follows: low burst frequency values result in a decrease in the peak velocity of the passage vortex and passage vortex center and negative peak vorticities; however, the position of the passage vortex center and turbulence intensity at the vortex center increase. In contrast, a high burst frequency value leads to decrease in the position of the vortex center and turbulence intensity of the passage; however, an increase is observed in the peak velocity of the passage vortex, vorticity at the vortex center, and negative peak vorticity. The dimensionless burst frequency around
F+ = 1 is balanced between the two effects, which appears to be appropriate.
To consider and discuss the energy consumption in the burst mode operation,
VRR and
ηburst were also analyzed using Equations (6) and (7). The results of the analysis are shown in
Figure 29.
Figure 29a shows the vorticity at the center of the passage vortex in passage 1 at various burst frequencies, which is the same as in
Figure 27a. The difference between the vorticities with no control and continuous flow control (
BR = 1) is defined as 1 (100%) in this figure.
Figure 29b shows the vorticity reduction ratio calculated using Equation (4), as previously described. Despite
BR = 0.5, the effect of the vorticity reduction ratio at various burst frequencies was greater than 1, which means that the reduction effect was larger than that at
BR = 1. The maximum
VRR is 1.23 (123%) at
F+ = 0.629. The maximum
VRR is 0.97 (97%) at
F+ = 0.013.
Figure 29c shows the burst efficiency of vorticity reduction at various burst frequencies. The efficiency considers the electric energy consumption at
BR = 0.5, and the burst efficiency is twice that of the
VRR, as shown in
Figure 29b. The maximum efficiency is 2.46 (246%) at
F+ = 0.629, which is approximately 2.5 times higher than the efficiency at the baseline of the continuous mode operation,
BR = 1. The variation owing to the burst frequency is gentle; however, the efficiency around
F+ = 1 is considered the most suitable. At both lower and higher burst frequencies, away from
F+ = 1, the burst efficiency tends to decrease the vorticity reduction effect.
Some studies regarding the flow separation control on the suction surface of single airfoils [
4,
5,
11] concluded that the most effective non-dimensional burst frequency was around
F+ = 1. Although this study dealt with the passage vortex reduction of turbine blades, the results were similar to those of the flow separation reduction control of single airfoils.


