
Engineered Cell Line Imaging Assay Differentiates Pathogenic from Non-Pathogenic Bacteria

 , and
, and 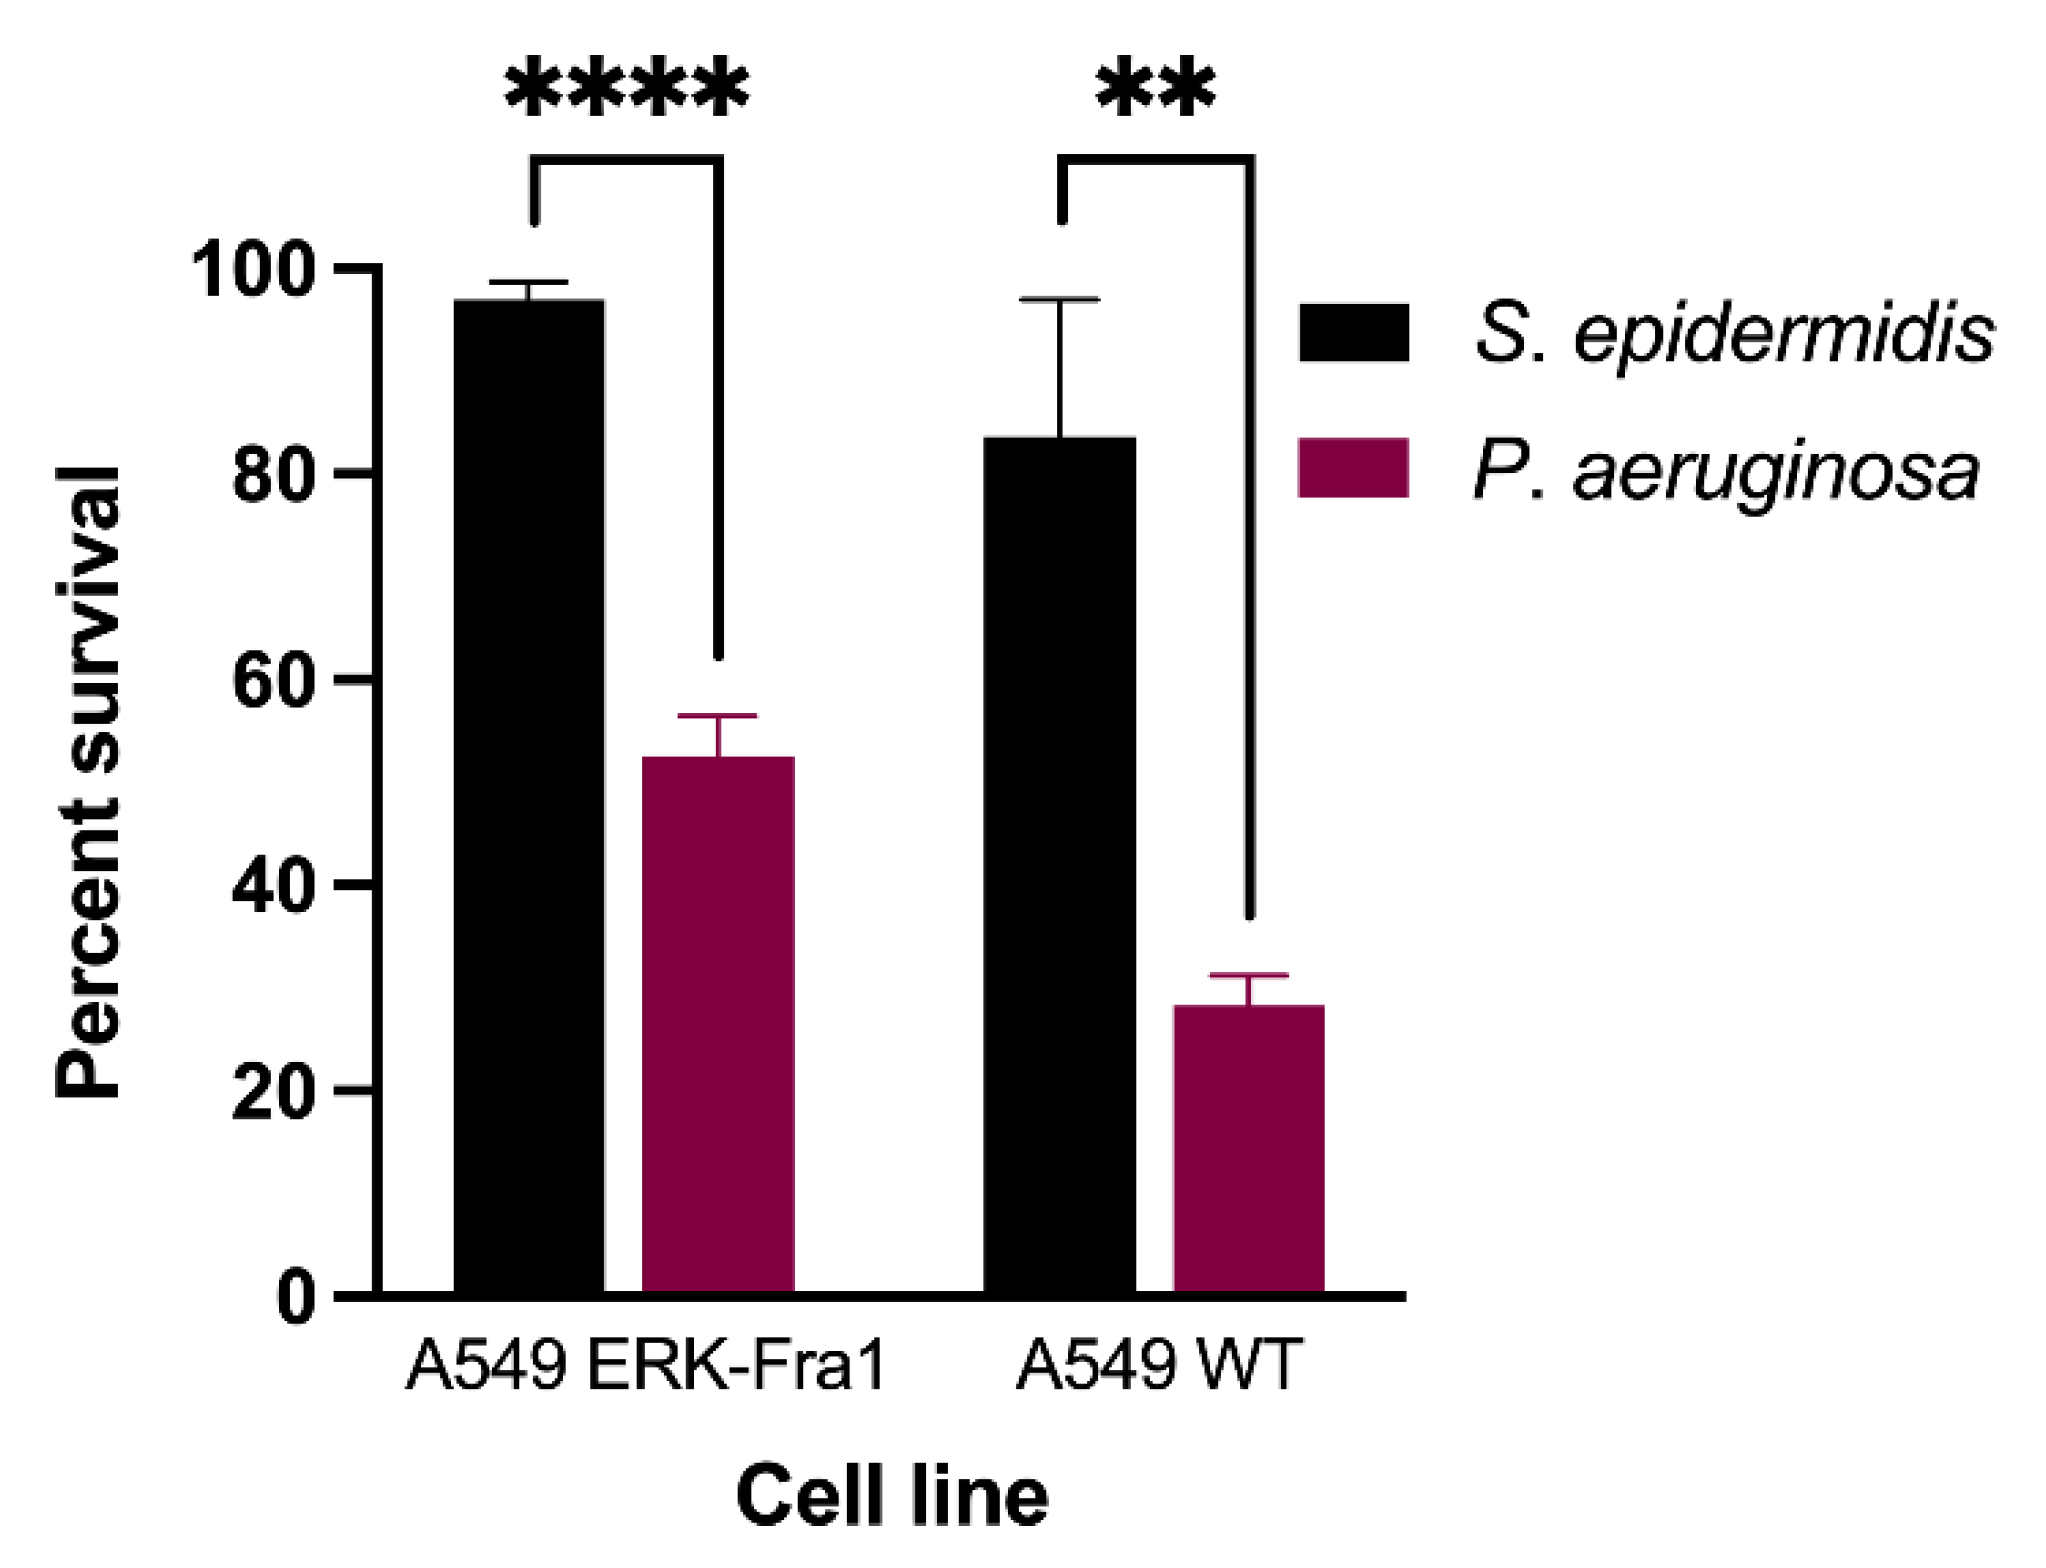
Abstract
:1. Introduction
2. Results
2.1. Pathogenic Bacteria Induce Significant Cell Death in A549 Cell Lines
2.2. Imaging Assays
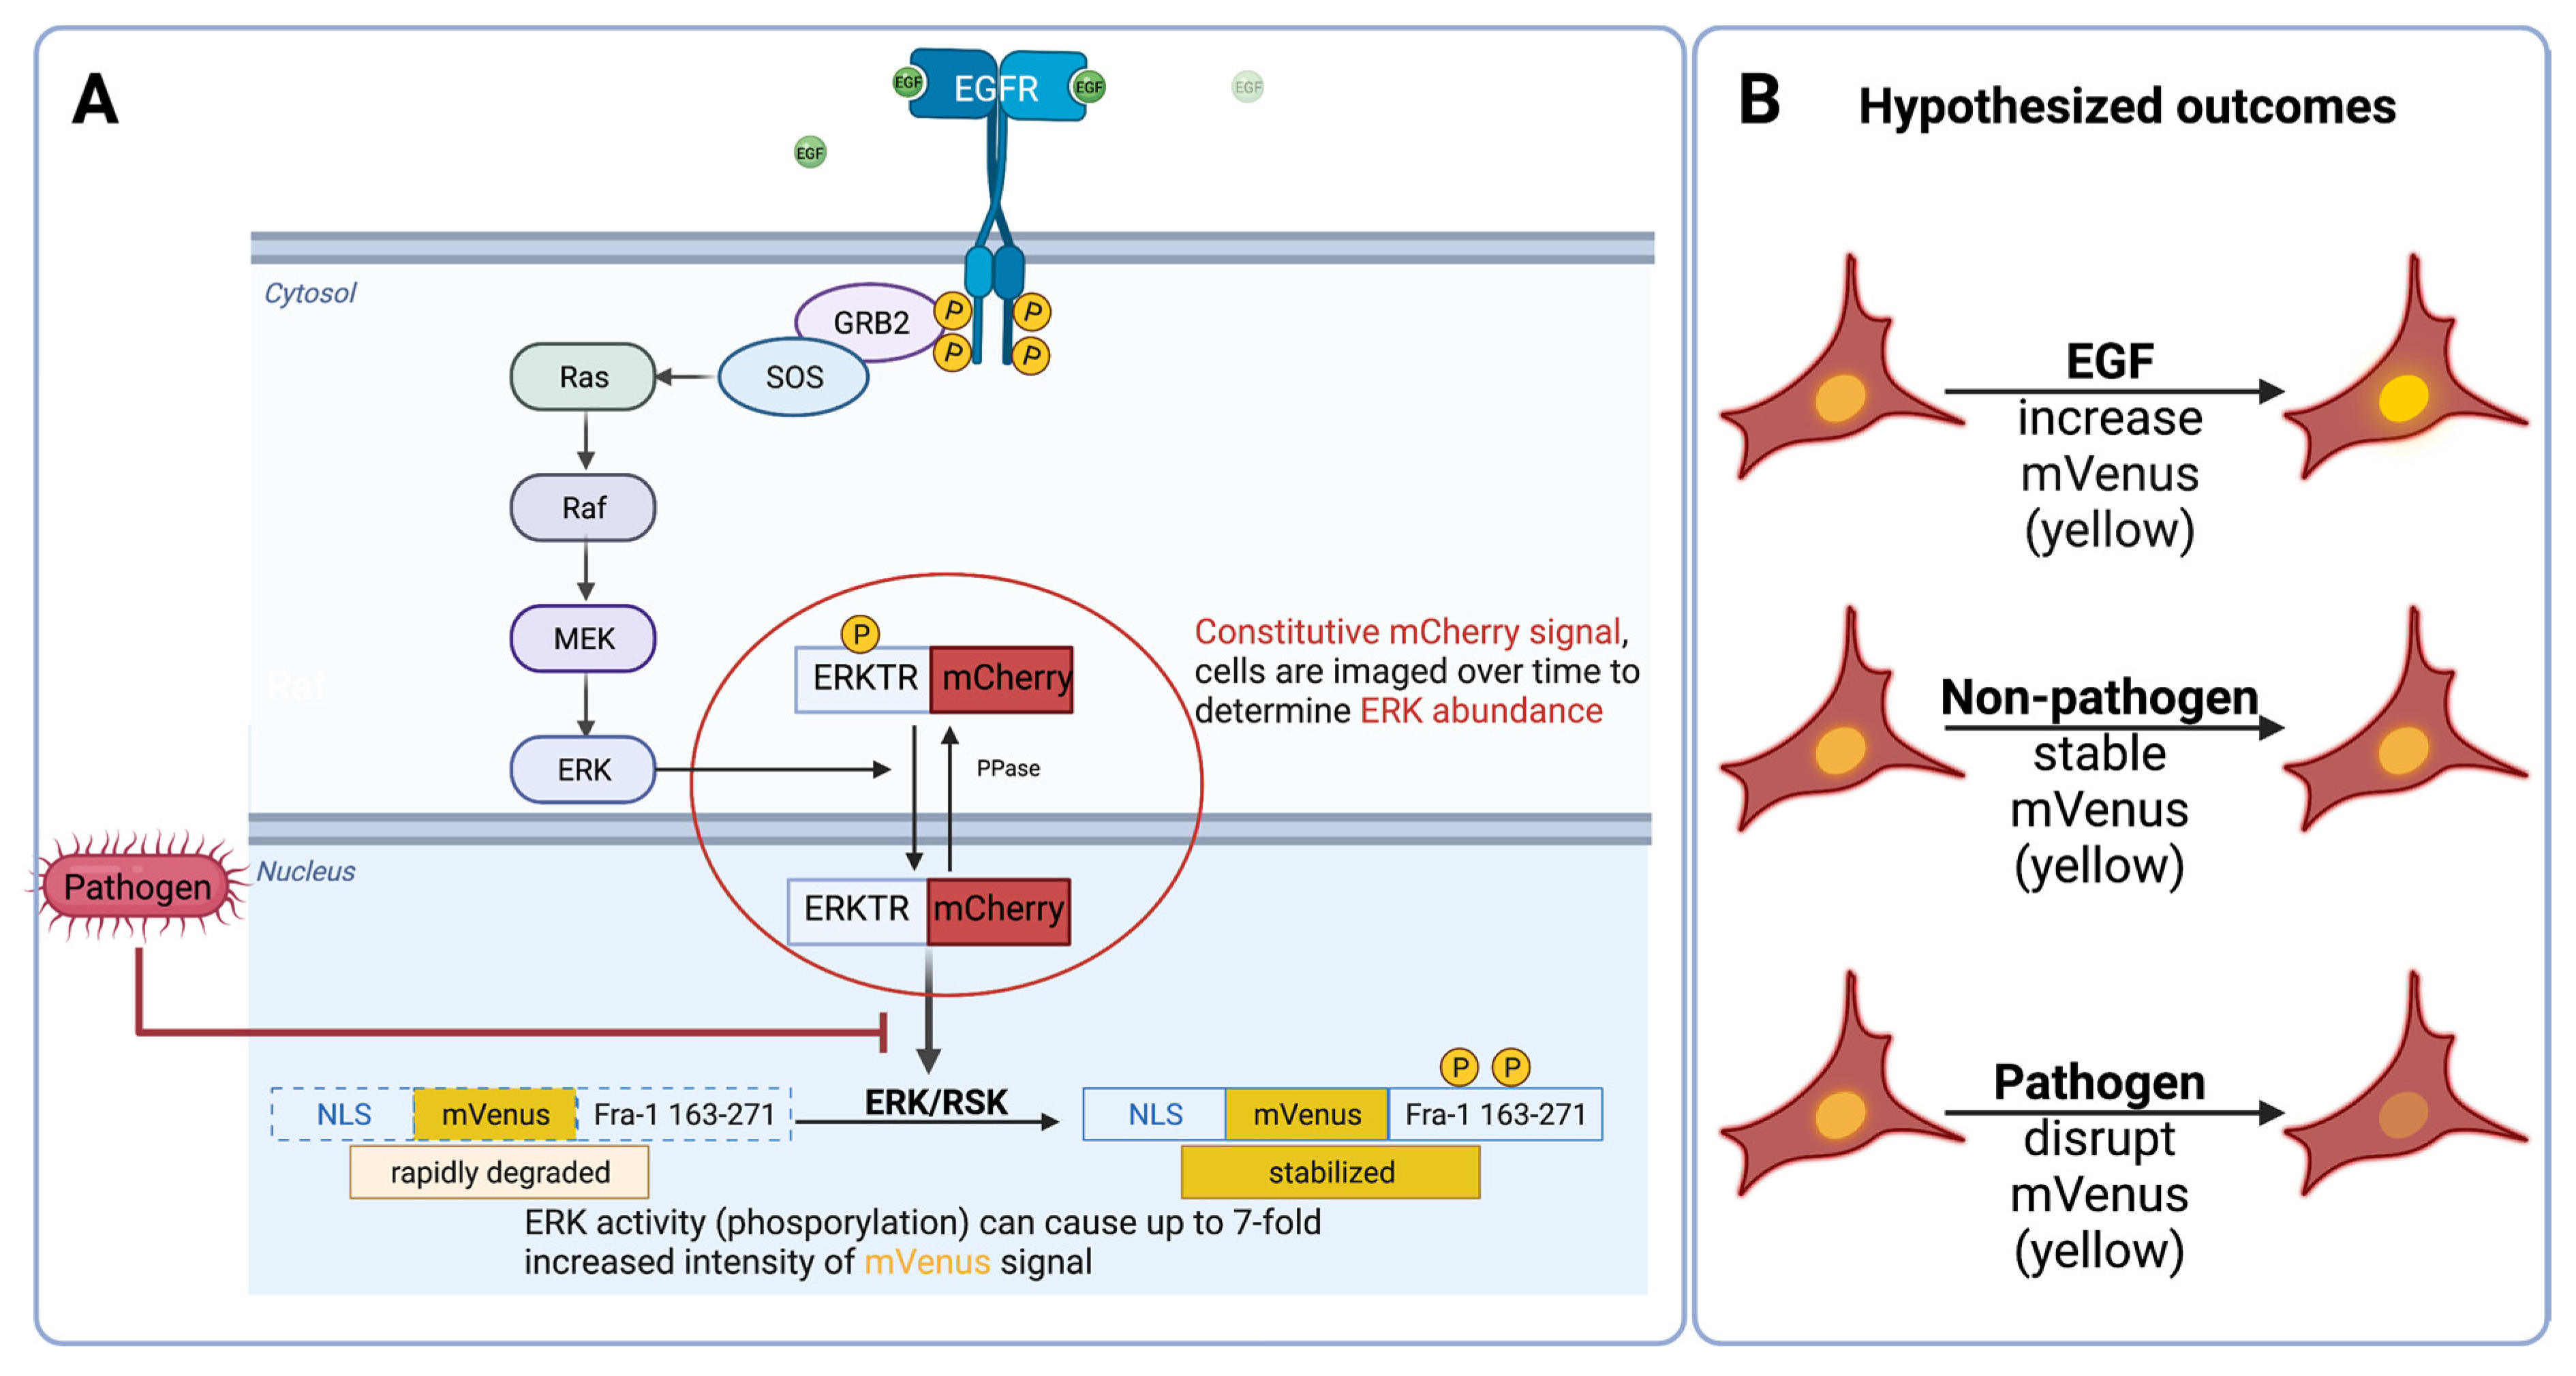
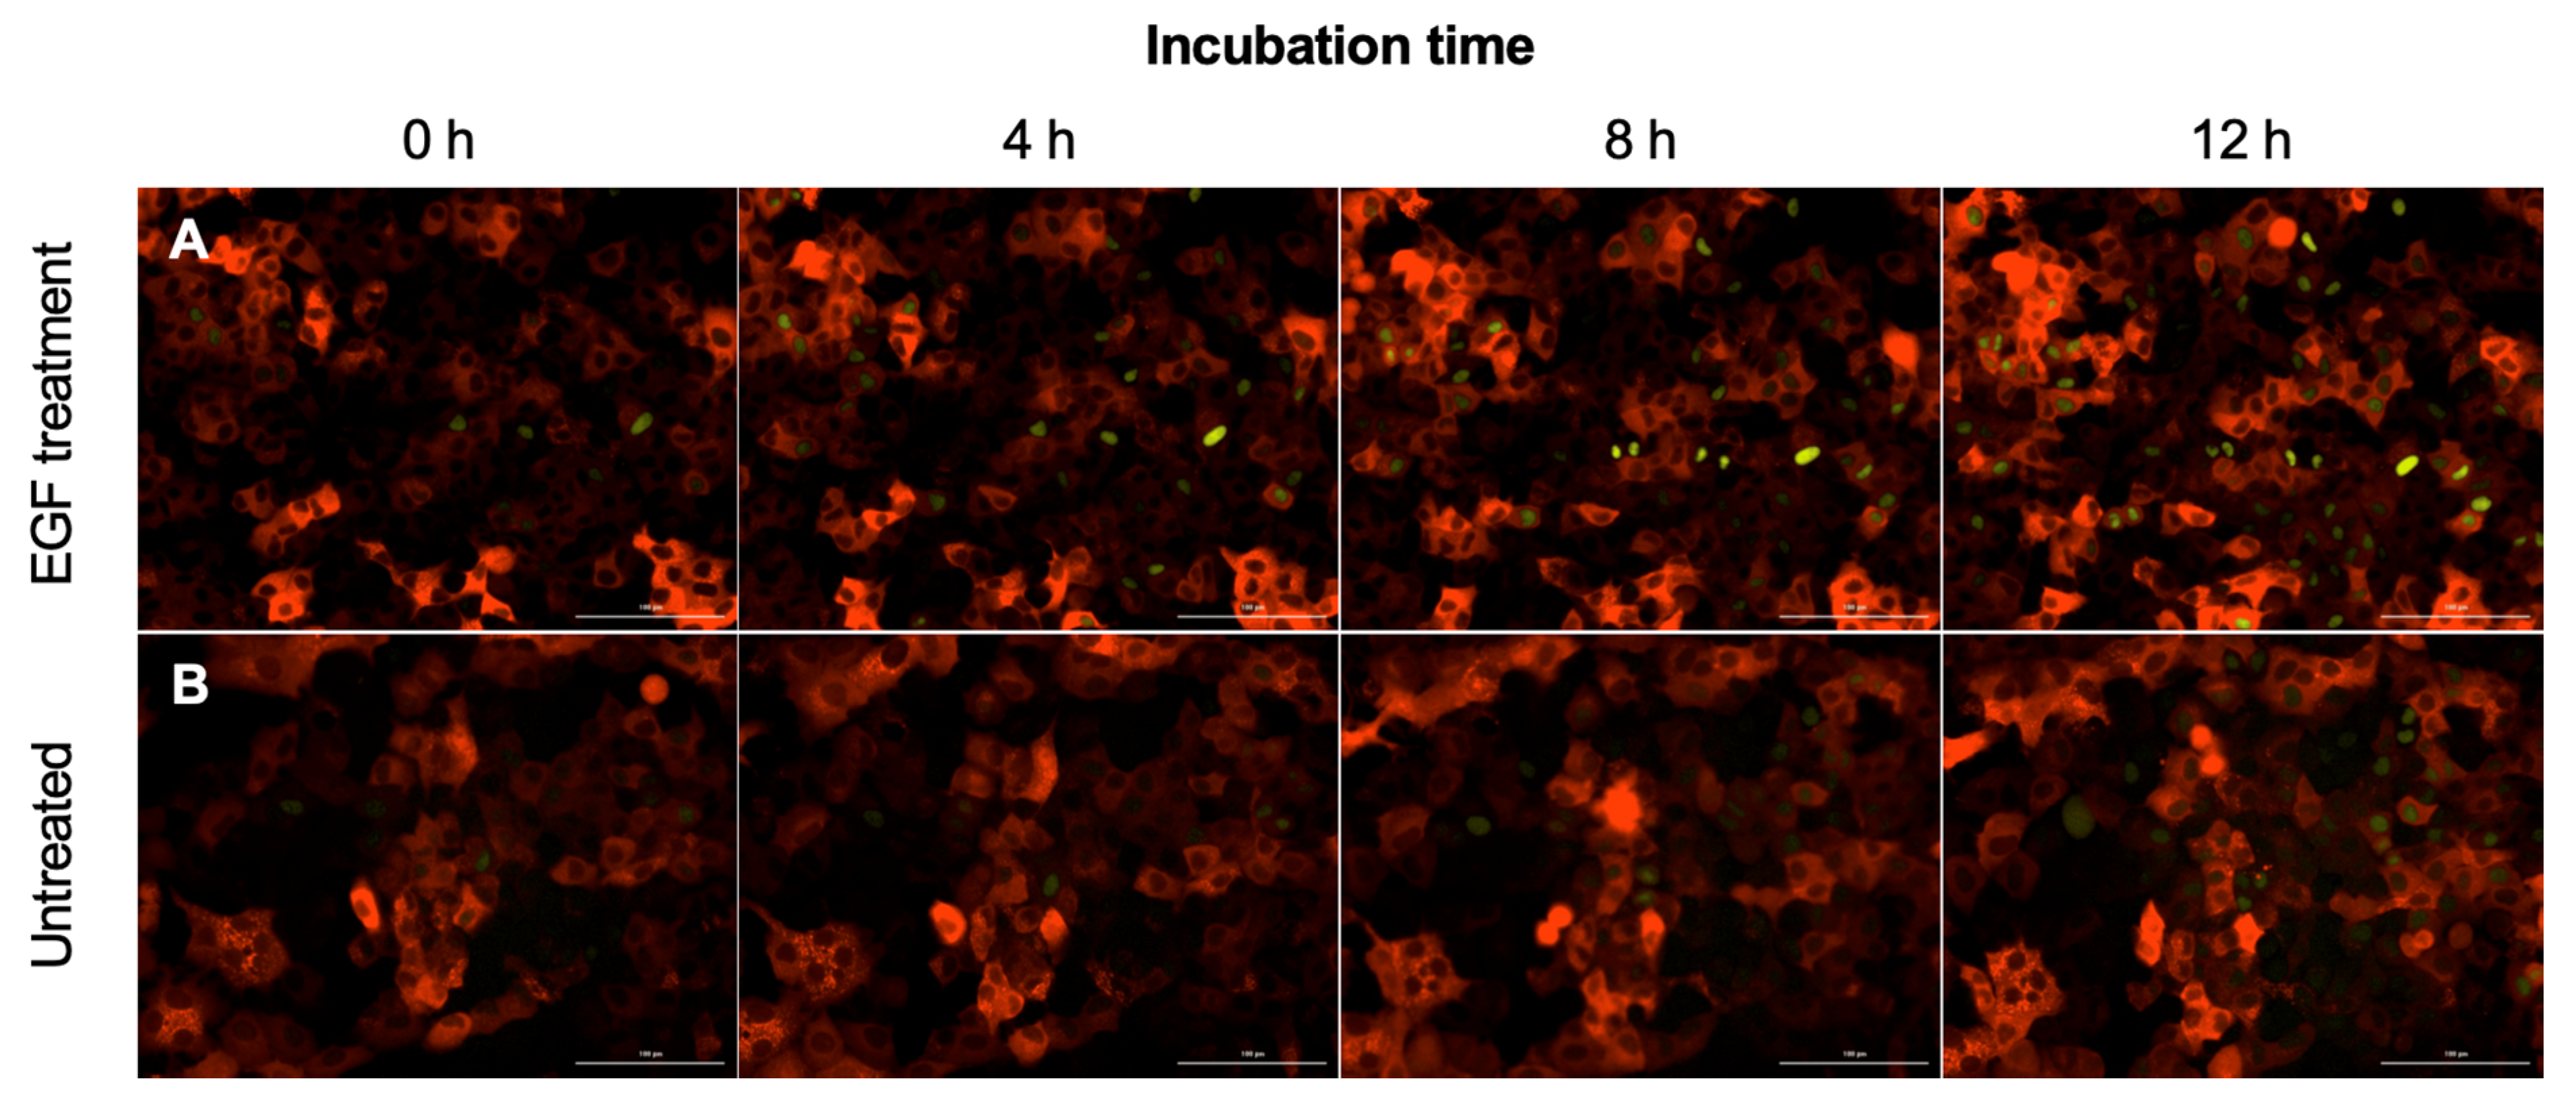
2.3. Engineered Reporters Have a Strong Fra1 (mVenus) Signal in the Presence of Epidermal Growth Factor (EGF)
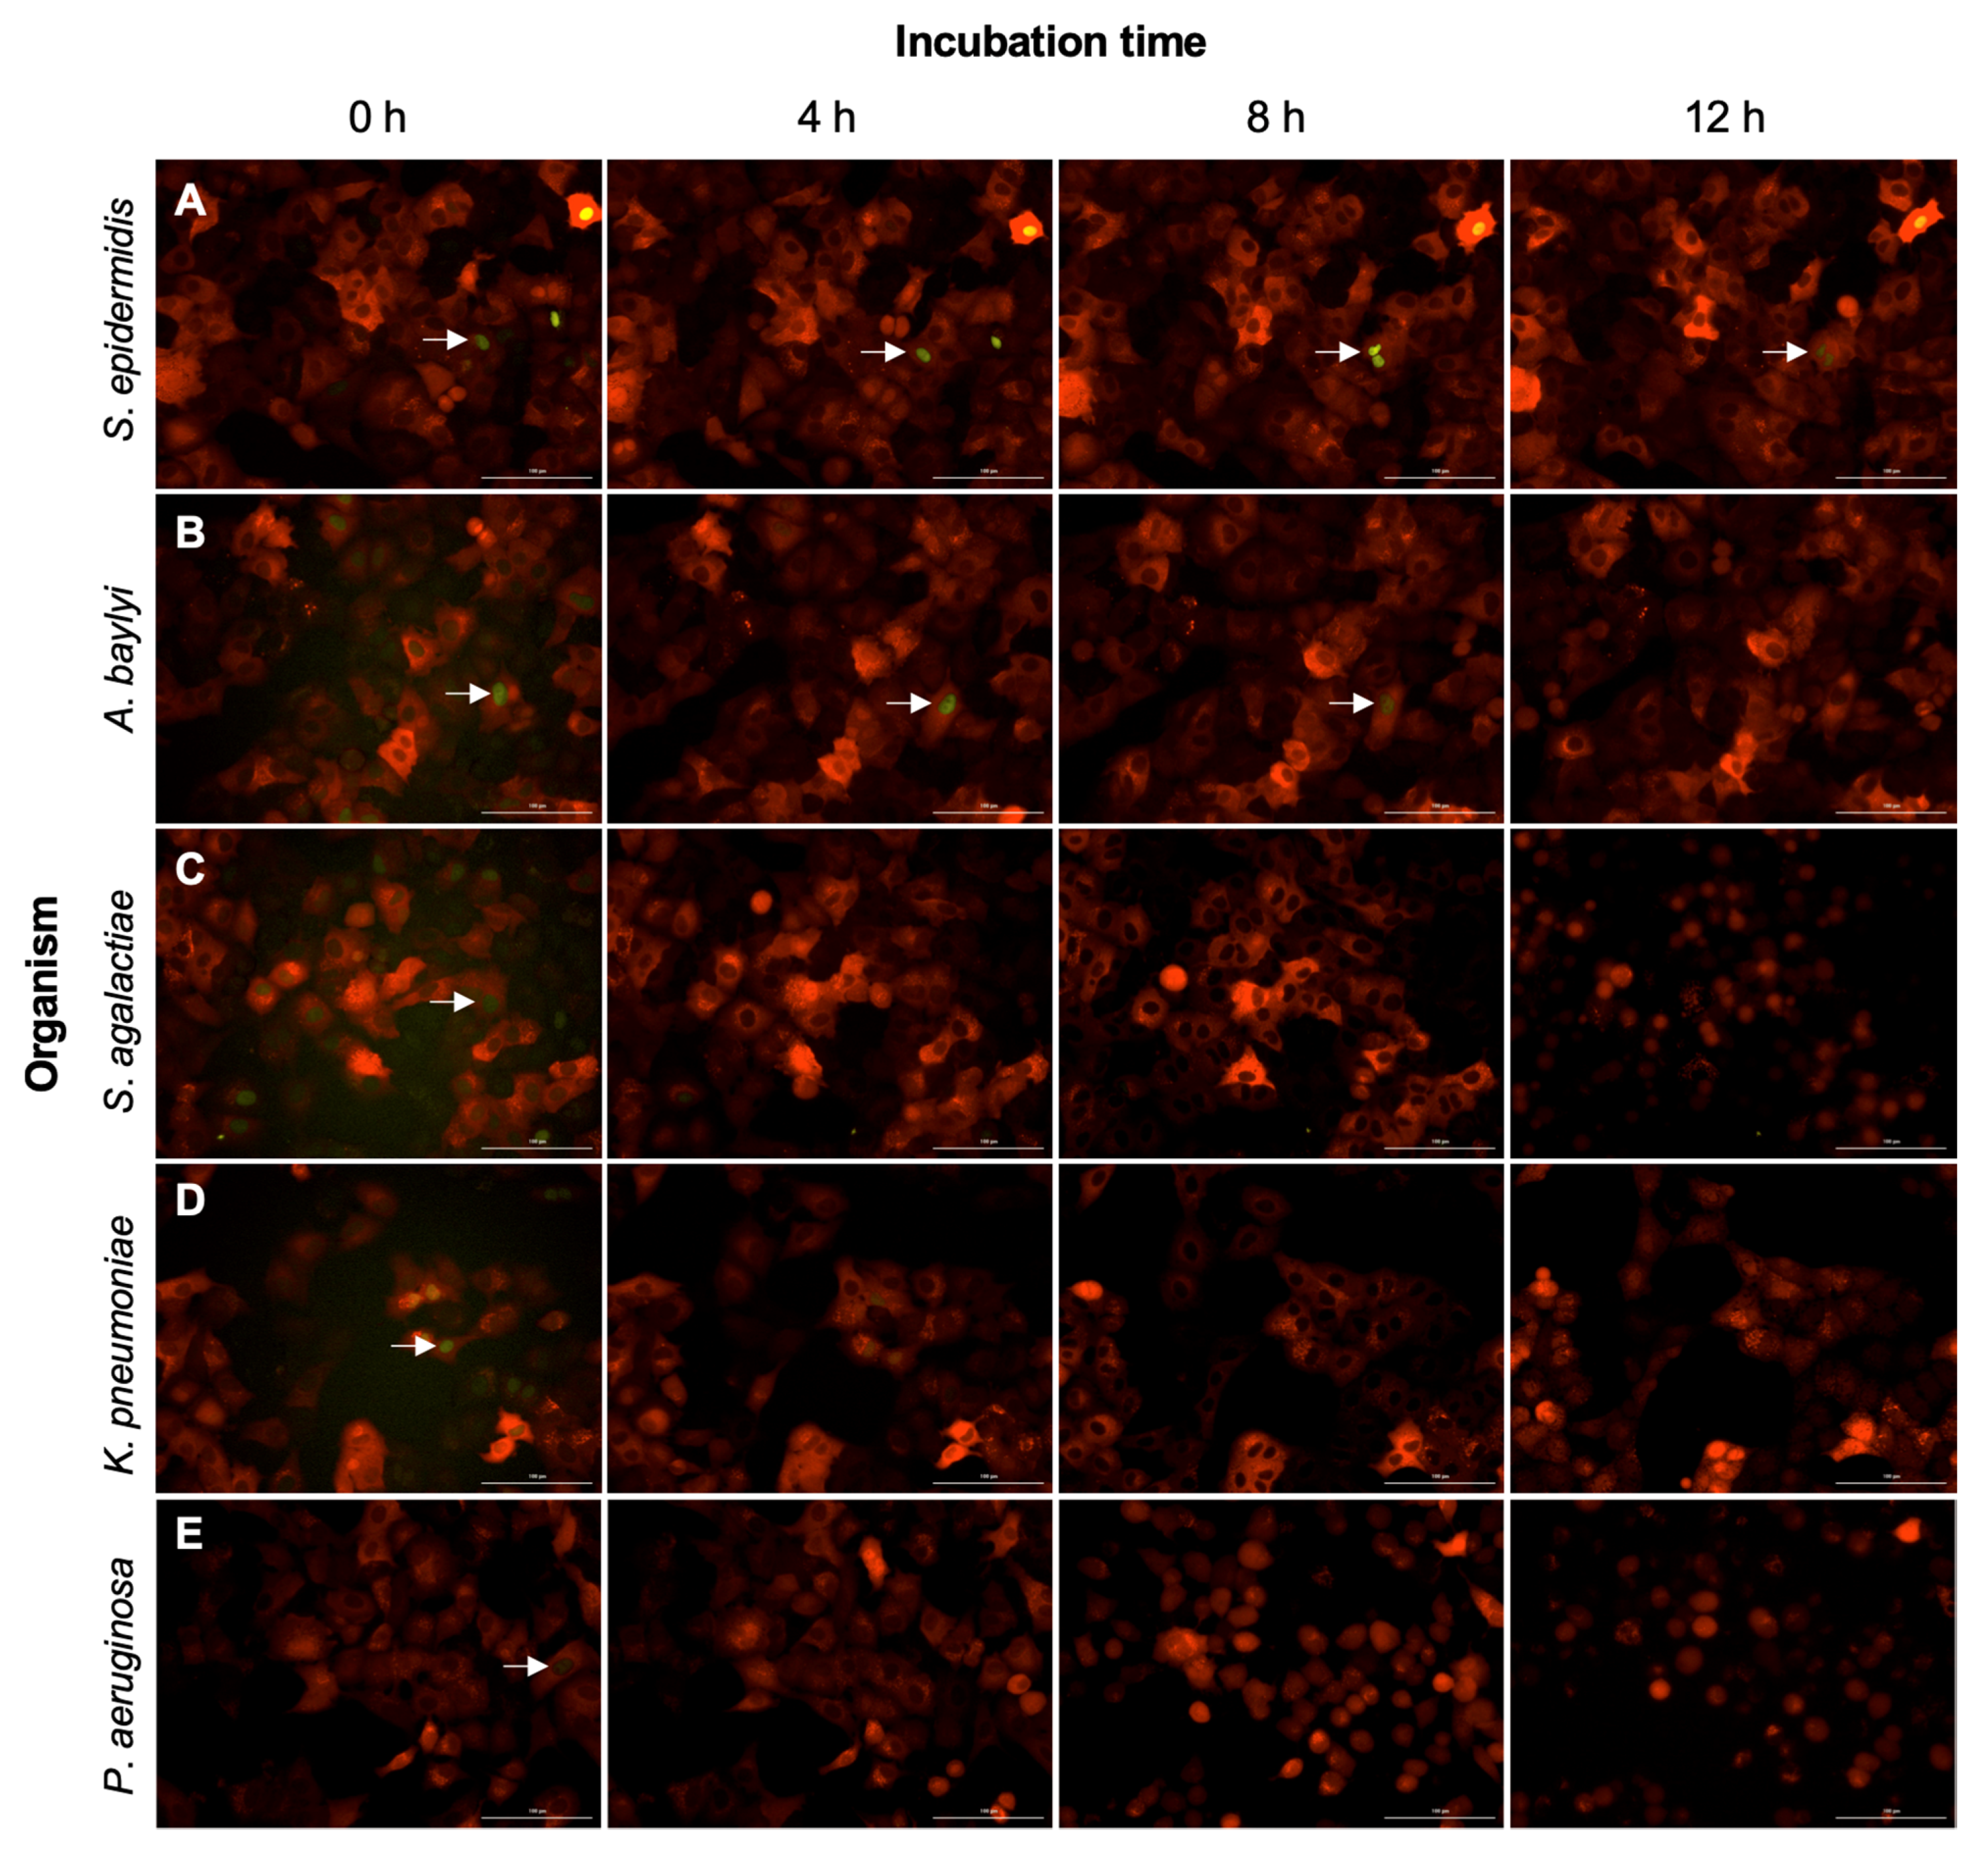
2.4. Non-Pathogenic Bacteria Have Delayed Interruption of ERK-Fra1 Signaling
2.5. Engineered Reporters Have Interrupted Fra1 Signaling in the Presence of Pathogens
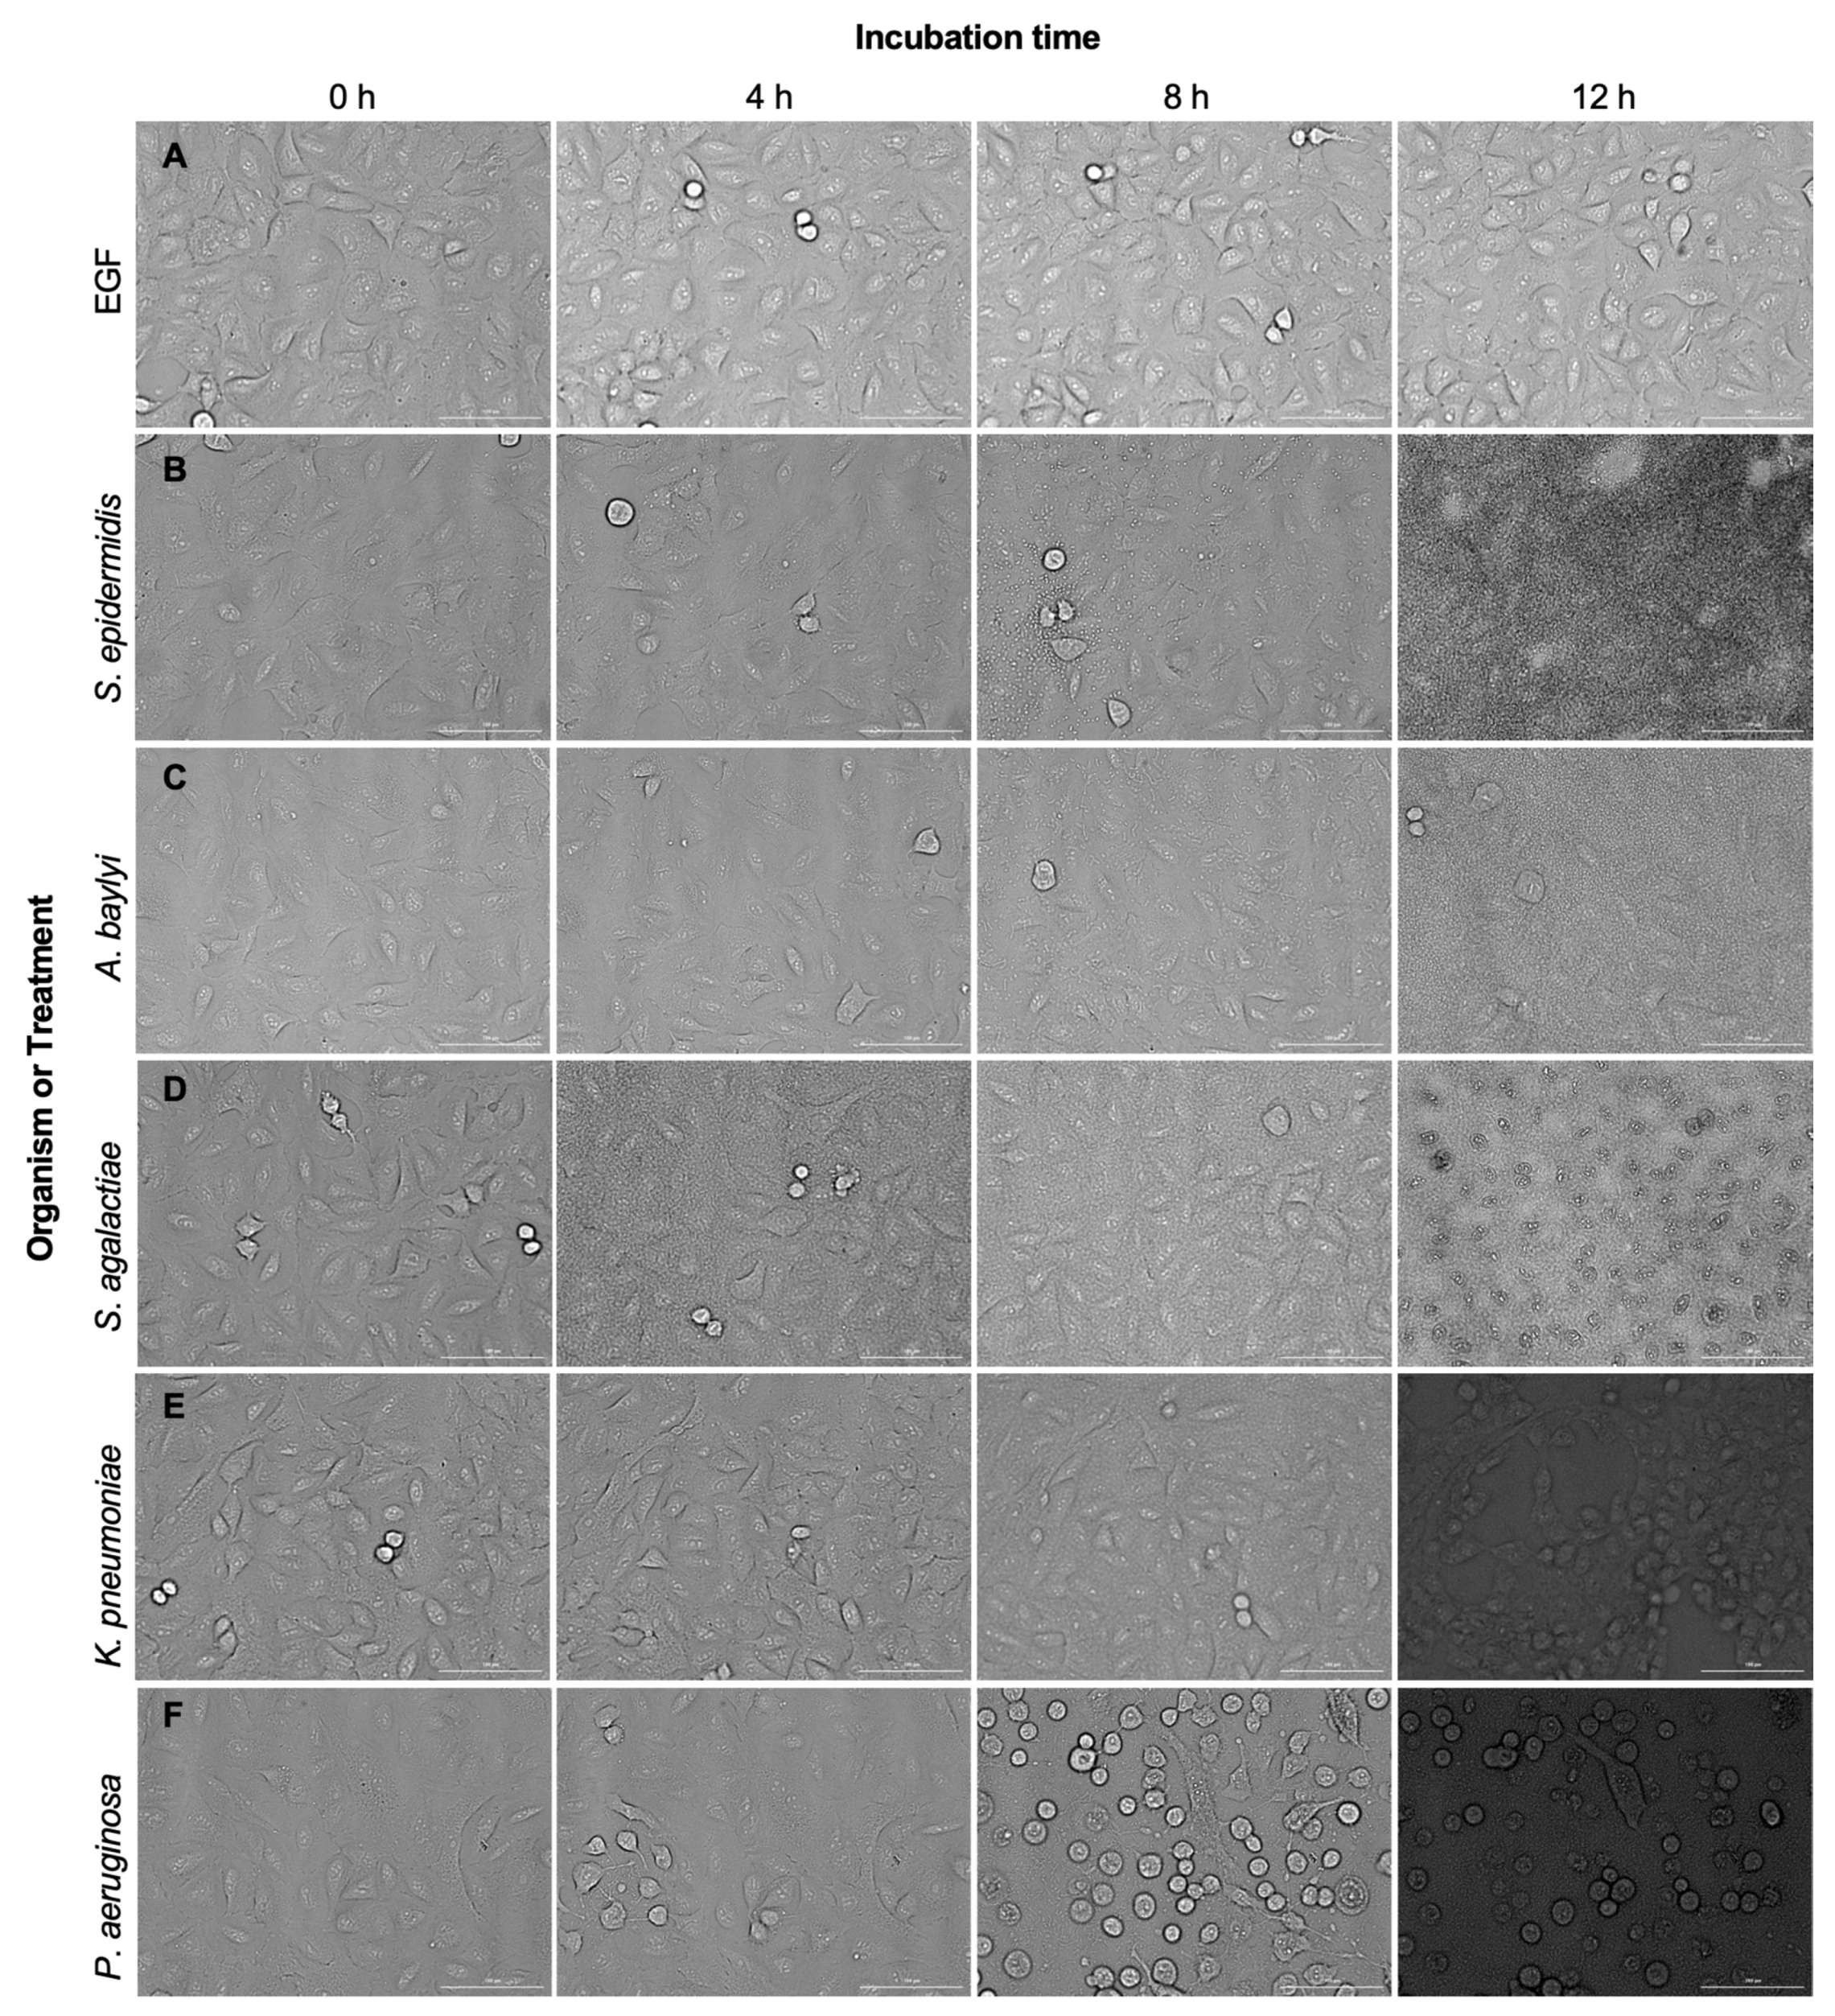
2.6. A549 Wild-Type Cells Undergo Damage and Cell Death in the Presence of Pathogens, but Not in the Presence of EGF or Non-Pathogen
3. Discussion
4. Materials and Methods
4.1. Cell Culture
4.2. Engineering A549 Cell to Create A549 ERK-Fra1
4.3. Flow Cytometry to Enrich for the Stable Reporter Cell Line of A549 ERK-Fra1
4.4. Bacterial Culture
4.5. AlamarBlue Assay
4.6. Bacterial Challenge Assay with A549 and A549 ERK-Fra1 Cells
4.7. Image Acquisition
4.8. Image Analysis
4.9. Statistical Analysis
Supplementary Materials
Author Contributions
Funding
Institutional Review Board Statement
Informed Consent Statement
Data Availability Statement
Acknowledgments
Conflicts of Interest
References
- Louca, S.; Mazel, F.; Doebeli, M.; Parfrey, L.W. A census-based estimate of Earth’s bacterial and archaeal diversity. PLoS Biol. 2019, 17, e3000106. [Google Scholar] [CrossRef] [Green Version]
- Dethlefsen, L.; McFall-Ngai, M.; Relman, D.A. An ecological and evolutionary perspective on human–microbe mutualism and disease. Nature 2007, 449, 811–818. [Google Scholar] [CrossRef] [PubMed]
- Linares, D.M.; Ross, P.; Stanton, C. Beneficial microbes: The pharmacy in the gut. Bioengineered 2016, 7, 11–20. [Google Scholar] [CrossRef] [PubMed] [Green Version]
- Law, J.W.-F.; Ab Mutalib, N.-S.; Chan, K.-G.; Lee, L.-H. Rapid methods for the detection of foodborne bacterial pathogens: Principles, applications, advantages and limitations. Front. Microbiol. 2015, 5, 770. [Google Scholar] [CrossRef] [Green Version]
- Mangmee, S.; Reamtong, O.; Kalambaheti, T.; Roytrakul, S.; Sonthayanon, P. MALDI-TOF mass spectrometry typing for predominant serovars of non-typhoidal Salmonella in a Thai broiler industry. Food Control 2020, 113, 107188. [Google Scholar] [CrossRef]
- Kuhns, M.; Zautner, A.E.; Rabsch, W.; Zimmermann, O.; Weig, M.; Bader, O.; Groß, U. Rapid discrimination of Salmonella enterica serovar Typhi from other serovars by MALDI-TOF mass spectrometry. PLoS ONE 2012, 7, e40004. [Google Scholar] [CrossRef] [PubMed]
- Yang, S.-M.; Kim, E.; Kim, D.; Baek, J.; Yoon, H.; Kim, H.-Y. Rapid detection of Salmonella Enteritidis, Typhimurium, and Thompson by specific peak analysis using matrix-assisted laser desorption ionization time-of-flight mass spectrometry. Foods 2021, 10, 933. [Google Scholar] [CrossRef]
- Abdelhaseib, M.U.; Singh, A.K.; Bailey, M.; Singh, M.; El-Khateib, T.; Bhunia, A.K. Fiber optic and light scattering sensors: Complimentary approaches to rapid detection of Salmonella enterica in food samples. Food Control 2016, 61, 135–145. [Google Scholar] [CrossRef]
- Valadez, A.M.; Lana, C.A.; Tu, S.-I.; Morgan, M.T.; Bhunia, A.K. Evanescent wave fiber optic biosensor for Salmonella detection in food. Sensors 2009, 9, 5810–5824. [Google Scholar] [CrossRef] [Green Version]
- Kaushik, S.; Pandey, A.; Tiwari, U.K.; Sinha, R.K. A label-free fiber optic biosensor for Salmonella Typhimurium detection. Opt. Fiber Technol. 2018, 46, 95–103. [Google Scholar] [CrossRef]
- Méthot, P.-O.; Alizon, S. What is a pathogen? Toward a process view of host-parasite interactions. Virulence 2014, 5, 775–785. [Google Scholar] [CrossRef] [PubMed]
- Pirofski, L.-a.; Casadevall, A. Q&A: What is a pathogen? A question that begs the point. BMC Biol. 2012, 10, 6. [Google Scholar]
- Fasciano, A.C.; Mecsas, J.; Isberg, R.R. New age strategies to reconstruct mucosal tissue colonization and growth in cell culture systems. Microbiol. Spectr. 2019, 7. [Google Scholar] [CrossRef] [PubMed]
- Lim, Y.; Shiver, A.L.; Khariton, M.; Lane, K.M.; Ng, K.M.; Bray, S.R.; Qin, J.; Huang, K.C.; Wang, B. Mechanically resolved imaging of bacteria using expansion microscopy. PLoS Biol. 2019, 17, e3000268. [Google Scholar] [CrossRef] [Green Version]
- Dufrêne, Y.F. Atomic force microscopy in microbiology: New structural and functional insights into the microbial cell surface. mBio 2014, 5, e01363-14. [Google Scholar] [CrossRef] [Green Version]
- Cott, C.; Thuenauer, R.; Landi, A.; Kühn, K.; Juillot, S.; Imberty, A.; Madl, J.; Eierhoff, T.; Römer, W. Pseudomonas aeruginosa lectin LecB inhibits tissue repair processes by triggering β-catenin degradation. Biochim. Biophys. Acta 2016, 1863, 1106–1118. [Google Scholar] [CrossRef] [Green Version]
- van ‘t Wout, E.F.; van Schadewijk, A.; van Boxtel, R.; Dalton, L.E.; Clarke, H.J.; Tommassen, J.; Marciniak, S.J.; Hiemstra, P.S. Virulence factors of Pseudomonas aeruginosa induce both the unfolded protein and integrated stress responses in airway epithelial cells. PLoS Pathog. 2015, 11, e1004946. [Google Scholar] [CrossRef] [Green Version]
- Bermudez-Brito, M.; Plaza-Díaz, J.; Fontana, L.; Munoz-Quezada, S.; Gil, A. In vitro cell and tissue models for studying host–microbe interactions: A review. Br. J. Nutr. 2013, 109, S27–S34. [Google Scholar] [CrossRef] [Green Version]
- Zahir, T.; Camacho, R.; Vitale, R.; Ruckebusch, C.; Hofkens, J.; Fauvart, M.; Michiels, J. High-throughput time-resolved morphology screening in bacteria reveals phenotypic responses to antibiotics. Commun. Biol. 2019, 2, 269. [Google Scholar] [CrossRef]
- Sridhar, S.; Forrest, S.; Warne, B.; Maes, M.; Baker, S.; Dougan, G.; Bartholdson Scott, J. High-content imaging to phenotype antimicrobial effects on individual bacteria at scale. Msystems 2021, 6, e00028-21. [Google Scholar] [CrossRef]
- Bhavsar, A.P.; Guttman, J.A.; Finlay, B.B. Manipulation of host-cell pathways by bacterial pathogens. Nature 2007, 449, 827–834. [Google Scholar] [CrossRef] [PubMed]
- Leiser, O.P.; Hobbs, E.C.; Sims, A.C.; Korch, G.W.; Taylor, K.L. Beyond the list: Bioagent-agnostic signatures could enable a more flexible and resilient biodefense posture than an approach based on priority agent lists alone. Pathogens 2021, 10, 1497. [Google Scholar] [CrossRef] [PubMed]
- Krachler, A.M.; Woolery, A.R.; Orth, K. Manipulation of kinase signaling by bacterial pathogens. J. Cell Biol. 2011, 195, 1083–1092. [Google Scholar] [CrossRef] [Green Version]
- Cheng, H.-C.; Qi, R.Z.; Paudel, H.; Zhu, H.-J. Regulation and function of protein kinases and phosphatases. Enzyme Res. 2011, 2011. [Google Scholar] [CrossRef] [PubMed] [Green Version]
- Rahman, M.M.; McFadden, G. Modulation of NF-κB signalling by microbial pathogens. Nat. Rev. Microbiol. 2011, 9, 291–306. [Google Scholar] [CrossRef] [PubMed]
- Ni, Q.; Mehta, S.; Zhang, J. Live-cell imaging of cell signaling using genetically encoded fluorescent reporters. FEBS J. 2018, 285, 203–219. [Google Scholar] [CrossRef]
- Zumla, A.; Memish, Z.A.; Maeurer, M.; Bates, M.; Mwaba, P.; Al-Tawfiq, J.A.; Denning, D.W.; Hayden, F.G.; Hui, D.S. Emerging novel and antimicrobial-resistant respiratory tract infections: New drug development and therapeutic options. Lancet Infect. Dis. 2014, 14, 1136–1149. [Google Scholar] [CrossRef]
- Bradley, B.T.; Bryan, A. Emerging respiratory infections: The infectious disease pathology of SARS, MERS, pandemic influenza, and Legionella. Semin. Diagn. Pathol. 2019, 36, 152–159. [Google Scholar] [CrossRef]
- Al-Nasiry, S.; Geusens, N.; Hanssens, M.; Luyten, C.; Pijnenborg, R. The use of Alamar Blue assay for quantitative analysis of viability, migration and invasion of choriocarcinoma cells. Hum. Reprod. 2007, 22, 1304–1309. [Google Scholar] [CrossRef] [Green Version]
- Rampersad, S.N. Multiple applications of Alamar Blue as an indicator of metabolic function and cellular health in cell viability bioassays. Sensors 2012, 12, 12347–12360. [Google Scholar] [CrossRef]
- Albeck, J.G.; Mills, G.B.; Brugge, J.S. Frequency-modulated pulses of ERK activity transmit quantitative proliferation signals. Mol. Cell 2013, 49, 249–261. [Google Scholar] [CrossRef] [PubMed] [Green Version]
- Sparta, B.; Pargett, M.; Minguet, M.; Distor, K.; Bell, G.; Albeck, J.G. Receptor level mechanisms are required for epidermal growth factor (EGF)-stimulated extracellular signal-regulated kinase (ERK) activity pulses. J. Biol. Chem. 2015, 290, 24784–24792. [Google Scholar] [CrossRef] [PubMed] [Green Version]
- Kim, H.J.; Jo, A.; Jeon, Y.J.; An, S.; Lee, K.-M.; Yoon, S.S.; Choi, J.Y. Nasal commensal Staphylococcus epidermidis enhances interferon-λ-dependent immunity against influenza virus. Microbiome 2019, 7, 80. [Google Scholar] [CrossRef] [Green Version]
- Zhu, X.; Ge, Y.; Wu, T.; Zhao, K.; Chen, Y.; Wu, B.; Zhu, F.; Zhu, B.; Cui, L. Co-infection with respiratory pathogens among COVID-2019 cases. Virus Res. 2020, 285, 198005. [Google Scholar] [CrossRef] [PubMed]
- Chen, T.-L.; Siu, L.-K.; Lee, Y.-T.; Chen, C.-P.; Huang, L.-Y.; Wu, R.C.-C.; Cho, W.-L.; Fung, C.-P. Acinetobacter baylyi as a pathogen for opportunistic infection. J. Clin. Microbiol. 2008, 46, 2938–2944. [Google Scholar] [CrossRef] [Green Version]
- Huang, W.; Yang, Y.; Zhang, X.; Zhao, C.; Yin, A.; Zhang, X.; He, Z.; Jiang, Y.; Zhang, L. An easy operating pathogen microarray (EOPM) platform for rapid screening of vertebrate pathogens. BMC Infect. Dis. 2013, 13, 437. [Google Scholar] [CrossRef] [Green Version]
- Lim, H.J.; Kang, E.-R.; Park, M.Y.; Kim, B.K.; Kim, M.J.; Jung, S.; Roh, K.H.; Sung, N.; Yang, J.-H.; Lee, M.-W. Development of a multiplex real-time PCR assay for the simultaneous detection of four bacterial pathogens causing pneumonia. PLoS ONE 2021, 16, e0253402. [Google Scholar] [CrossRef]
- Langelier, C.; Kalantar, K.L.; Moazed, F.; Wilson, M.R.; Crawford, E.D.; Deiss, T.; Belzer, A.; Bolourchi, S.; Caldera, S.; Fung, M. Integrating host response and unbiased microbe detection for lower respiratory tract infection diagnosis in critically ill adults. Proc. Natl. Acad. Sci. USA 2018, 115, E12353–E12362. [Google Scholar] [CrossRef] [Green Version]
- Singh, A.K.; Bettasso, A.M.; Bae, E.; Rajwa, B.; Dundar, M.M.; Forster, M.D.; Liu, L.; Barrett, B.; Lovchik, J.; Robinson, J.P. Laser optical sensor, a label-free on-plate Salmonella enterica colony detection tool. MBio 2014, 5, e01019-13. [Google Scholar] [CrossRef] [Green Version]
- Buzalewicz, I.; Karwańska, M.; Wieliczko, A.; Podbielska, H. On the application of multi-parametric optical phenotyping of bacterial colonies for multipurpose microbiological diagnostics. Biosens. Bioelectron. 2021, 172, 112761. [Google Scholar] [CrossRef]
- Singh, A.K.; Drolia, R.; Bai, X.; Bhunia, A.K. Streptomycin induced stress response in Salmonella enterica serovar Typhimurium shows distinct colony scatter signature. PLoS ONE 2015, 10, e0135035. [Google Scholar] [CrossRef] [PubMed] [Green Version]
- Xu, L.; Bai, X.; Tenguria, S.; Liu, Y.; Drolia, R.; Bhunia, A.K. Mammalian cell-based immunoassay for detection of viable bacterial pathogens. Front. Microbiol. 2020, 11, 575615. [Google Scholar] [CrossRef]
- Rogers, G.; Marsh, P.; Stressmann, A.; Allen, C.; Daniels, T.; Carroll, M.; Bruce, K. The exclusion of dead bacterial cells is essential for accurate molecular analysis of clinical samples. Clin. Microbiol. Infect. 2010, 16, 1656–1658. [Google Scholar] [CrossRef] [PubMed] [Green Version]
- Cangelosi, G.A.; Meschke, J.S. Dead or alive: Molecular assessment of microbial viability. Appl. Environ. Microbiol. 2014, 80, 5884–5891. [Google Scholar] [CrossRef] [Green Version]
- Fisch, D.; Yakimovich, A.; Clough, B.; Wright, J.; Bunyan, M.; Howell, M.; Mercer, J.; Frickel, E. Defining host–pathogen interactions employing an artificial intelligence workflow. eLife 2019, 8, e40560. [Google Scholar] [CrossRef]
- Riba, J.; Gleichmann, T.; Zimmermann, S.; Zengerle, R.; Koltay, P. Label-free isolation and deposition of single bacterial cells from heterogeneous samples for clonal culturing. Sci. Rep. 2016, 6, 32837. [Google Scholar] [CrossRef] [PubMed] [Green Version]
- Banerjee, P.; Bhunia, A.K. Cell-based biosensor for rapid screening of pathogens and toxins. Biosens. Bioelectron. 2010, 26, 99–106. [Google Scholar] [CrossRef]
- FitzGerald, E.S.; Luz, N.F.; Jamieson, A.M. Competitive cell death interactions in pulmonary infection: Host modulation versus pathogen manipulation. Front. Immunol. 2020, 11, 814. [Google Scholar] [CrossRef] [PubMed]
- Ashida, H.; Mimuro, H.; Ogawa, M.; Kobayashi, T.; Sanada, T.; Kim, M.; Sasakawa, C. Cell death and infection: A double-edged sword for host and pathogen survival. J. Cell Biol. 2011, 195, 931–942. [Google Scholar] [CrossRef] [Green Version]
- Jondle, C.N.; Gupta, K.; Mishra, B.B.; Sharma, J. Klebsiella pneumoniae infection of murine neutrophils impairs their efferocytic clearance by modulating cell death machinery. PLoS Pathog. 2018, 14, e1007338. [Google Scholar] [CrossRef] [Green Version]
- Pargett, M.; Gillies, T.E.; Teragawa, C.K.; Sparta, B.; Albeck, J.G. Single-cell imaging of ERK signaling using fluorescent biosensors. In Kinase Signaling Networks; Springer: New York, NY, USA, 2017; pp. 35–59. [Google Scholar]
- Arbibe, L.; Kim, D.W.; Batsche, E.; Pedron, T.; Mateescu, B.; Muchardt, C.; Parsot, C.; Sansonetti, P.J. An injected bacterial effector targets chromatin access for transcription factor NF-κB to alter transcription of host genes involved in immune responses. Nat. Immunol. 2007, 8, 47–56. [Google Scholar] [CrossRef]
- Li, H.; Xu, H.; Zhou, Y.; Zhang, J.; Long, C.; Li, S.; Chen, S.; Zhou, J.-M.; Shao, F. The phosphothreonine lyase activity of a bacterial type III effector family. Science 2007, 315, 1000–1003. [Google Scholar] [CrossRef] [PubMed]
- Gillies, T.E.; Pargett, M.; Minguet, M.; Davies, A.E.; Albeck, J.G. Linear integration of ERK activity predominates over persistence detection in Fra-1 regulation. Cell Syst. 2017, 5, 549–563.e5. [Google Scholar] [CrossRef] [PubMed] [Green Version]
- MacGilvary, N.J.; Tan, S. Fluorescent Mycobacterium tuberculosis reporters: Illuminating host–pathogen interactions. Pathog. Dis. 2018, 76, fty017. [Google Scholar] [CrossRef] [PubMed] [Green Version]
- Chakraborty, S.; Winardhi, R.S.; Morgan, L.K.; Yan, J.; Kenney, L.J. Non-canonical activation of OmpR drives acid and osmotic stress responses in single bacterial cells. Nat. Commun. 2017, 8, 1587. [Google Scholar] [CrossRef] [PubMed]
- Roche, B.; Bumann, D. Single-cell reporters for pathogen responses to antimicrobial host attacks. Curr. Opin. Microbiol. 2021, 59, 16–23. [Google Scholar] [CrossRef]
- Eisenreich, W.; Rudel, T.; Heesemann, J.; Goebel, W. How viral and intracellular bacterial pathogens reprogram the metabolism of host cells to allow their intracellular replication. Front. Cell. Infect. Microbiol. 2019, 9, 42. [Google Scholar] [CrossRef] [Green Version]
- Rana, A.; Ahmed, M.; Rub, A.; Akhter, Y. A tug-of-war between the host and the pathogen generates strategic hotspots for the development of novel therapeutic interventions against infectious diseases. Virulence 2015, 6, 566–580. [Google Scholar] [CrossRef] [Green Version]


Publisher’s Note: MDPI stays neutral with regard to jurisdictional claims in published maps and institutional affiliations. |
© 2022 by the authors. Licensee MDPI, Basel, Switzerland. This article is an open access article distributed under the terms and conditions of the Creative Commons Attribution (CC BY) license (https://creativecommons.org/licenses/by/4.0/).
Share and Cite
Phillips, S.M.B.; Bergstrom, C.; Walker, B.; Wang, G.; Alfaro, T.; Stromberg, Z.R.; Hess, B.M. Engineered Cell Line Imaging Assay Differentiates Pathogenic from Non-Pathogenic Bacteria. Pathogens 2022, 11, 209. https://doi.org/10.3390/pathogens11020209
Phillips SMB, Bergstrom C, Walker B, Wang G, Alfaro T, Stromberg ZR, Hess BM. Engineered Cell Line Imaging Assay Differentiates Pathogenic from Non-Pathogenic Bacteria. Pathogens. 2022; 11(2):209. https://doi.org/10.3390/pathogens11020209
Chicago/Turabian StylePhillips, Shelby M. B., Carson Bergstrom, Brian Walker, George Wang, Trinidad Alfaro, Zachary R. Stromberg, and Becky M. Hess. 2022. "Engineered Cell Line Imaging Assay Differentiates Pathogenic from Non-Pathogenic Bacteria" Pathogens 11, no. 2: 209. https://doi.org/10.3390/pathogens11020209