
A Case Report of Chronic Stress in Honey Bee Colonies Induced by Pathogens and Acaricide Residues

 , , and
Abstract
:
1. Introduction
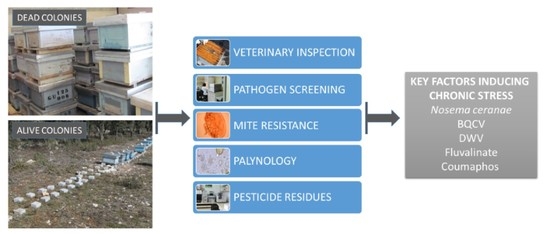
2. Results
2.1. Veterinary Inspection
2.2. Pathogen Screening
Varroa Mite Resistance to Acaricides
2.3. Stored Pollen Analysis
2.4. Meteorological Data
3. Discussion
4. Material and Methods
4.1. Pathogen Screening
Test of Varroa Mite Resistance to Acaricides
- Inclusion of an additional batch for a 24 h incubation period;
- Feeding the honey bees with syrup during the incubation periods; and
- Freezing the honey bees at the end of the incubation period to collect the remaining Varroa mites (−80 °C, 15 min).
4.2. Stored Pollen Analysis
4.3. Meteorological Data
4.4. Statistical Analysis
5. Conclusions
Supplementary Materials
Author Contributions
Funding
Institutional Review Board Statement
Informed Consent Statement
Data Availability Statement
Acknowledgments
Conflicts of Interest
References
- Klein, A.-M.; Vaissière, B.E.; Cane, J.H.; Steffan-Dewenter, I.; Cunningham, S.; Kremen, C.; Tscharntke, T. Importance of pollinators in changing landscapes for world crops. Proc. R. Soc. B Boil. Sci. 2006, 274, 303–313. [Google Scholar] [CrossRef] [PubMed] [Green Version]
- Williams, I.H. The dependence of crop production within the European Union on pollination by honey bees. Agric. Zool. Rev. 1994, 6, 229–257. [Google Scholar]
- Aguilar, R.; Ashworth, L.; Galetto, L.; Aizen, M. Plant reproductive susceptibility to habitat fragmentation: Review and synthesis through a meta-analysis. Ecol. Lett. 2006, 9, 968–980. [Google Scholar] [CrossRef]
- Ashman, T.-L.; Knight, T.M.; Steets, J.A.; Amarasekare, P.; Burd, M.; Campbell, D.; Dudash, M.R.; Johnston, M.O.; Mazer, S.J.; Mitchell, R.J.; et al. Pollen Limitation of Plant Reproduction: Ecological and Evolutionary Causes and Consequences. Ecology 2004, 85, 2408–2421. [Google Scholar] [CrossRef] [Green Version]
- Ernest, S.K.M.; Brown, J.H. Homeostasis and Compensation: The Role of Species and Resources in Ecosystem Stability. Ecology 2001, 82, 2118–2132. [Google Scholar] [CrossRef]
- Chauzat, M.-P.; Cauquil, L.; Roy, L.; Franco, S.; Hendrikx, P.; Ribière-Chabert, M. Demographics of the European Apicultural Industry. PLoS ONE 2013, 8, e79018. [Google Scholar] [CrossRef]
- Vanengelsdorp, D.; Meixner, M.D. A historical review of managed honey bee populations in Europe and the United States and the factors that may affect them. J. Invertebr. Pathol. 2010, 103, S80–S95. [Google Scholar] [CrossRef]
- Hristov, P.; Shumkova, R.; Palova, N.; Neov, B. Factors Associated with Honey Bee Colony Losses: A Mini-Review. Vet. Sci. 2020, 7, 166. [Google Scholar] [CrossRef]
- Ratnieks, F.L.W.; Carreck, N. Clarity on Honey Bee Collapse? Science 2010, 327, 152–153. [Google Scholar] [CrossRef]
- Staveley, J.P.; Law, S.A.; Fairbrother, A.; Menzie, C.A. A Causal Analysis of Observed Declines in Managed Honey Bees (Apis mellifera). Hum. Ecol. Risk Assess. Int. J. 2013, 20, 566–591. [Google Scholar] [CrossRef] [Green Version]
- Cepero, A.; Hernández, R.M.; Bartolomé, C.; Gómez-Moracho, T.; Barrios, L.; Bernal, J.; Martín, M.T.; Meana, A.; Higes, M. Passive laboratory surveillance in Spain: Pathogens as risk factors for honey bee colony collapse. J. Apic. Res. 2015, 54, 525–531. [Google Scholar] [CrossRef]
- Cepero, A.; Ravoet, J.; Gómez-Moracho, T.; Bernal, J.L.; Del Nozal, M.J.; Bartolomé, C.; Maside, X.; Meana, A.; González-Porto, A.V.; de Graaf, D.C.; et al. Holistic screening of collapsing honey bee colonies in Spain: A case study. BMC Res. Notes 2014, 7, 1–10. [Google Scholar] [CrossRef] [Green Version]
- Evison, S.E.F.; Roberts, K.E.; Laurenson, L.; Pietravalle, S.; Hui, J.; Biesmeijer, J.C.; Smith, J.E.; Budge, G.; Hughes, W.O.H. Pervasiveness of Parasites in Pollinators. PLoS ONE 2012, 7, e30641. [Google Scholar] [CrossRef] [Green Version]
- Alonso-Prados, E.; Muñoz, I.; De La Rúa, P.; Serrano, J.; Fernández-Alba, A.R.; García-Valcárcel, A.I.; Hernando, M.D.; Alonso, Á.; Alonso-Prados, J.L.; Bartolomé, C.; et al. The toxic unit approach as a risk indicator in honey bees surveillance programmes: A case of study in Apis mellifera iberiensis. Sci. Total. Environ. 2020, 698, 134208. [Google Scholar] [CrossRef]
- Martinello, M.; Baratto, C.; Manzinello, C.; Piva, E.; Borin, A.; Toson, M.; Granato, A.; Boniotti, M.B.; Gallina, A.; Mutinelli, F. Spring mortality in honey bees in northeastern Italy: Detection of pesticides and viruses in dead honey bees and other matrices. J. Apic. Res. 2017, 56, 239–254. [Google Scholar] [CrossRef]
- Sánchez-Bayo, F.; Goulson, D.; Pennacchio, F.; Nazzi, F.; Goka, K.; Desneux, N. Are bee diseases linked to pesticides?—A brief review. Environ. Int. 2016, 89–90, 7–11. [Google Scholar] [CrossRef]
- Pettis, J. Test Detecting Varroa Mite Resistance to Apistan, Apivar & Coumaphos. Available online: https://www2.gov.bc.ca/assets/gov/farming-natural-resources-and-industry/agriculture-and-seafood/animal-and-crops/animal-production/bee-assets/api_fs223.pdf (accessed on 25 September 2016).
- Rosenkranz, P.; Aumeier, P.; Ziegelmann, B. Biology and control of Varroa destructor. J. Invertebr. Pathol. 2010, 103, S96–S119. [Google Scholar] [CrossRef]
- Higes, M.; Martín-Hernández, R.; Hernández-Rodríguez, C.S.; González-Cabrera, J. Assessing the resistance to acaricides in Varroa destructor from several Spanish locations. Parasitol. Res. 2020, 119, 3595–3601. [Google Scholar] [CrossRef] [PubMed]
- Higes, M.; Hernández, R.M.; Botías, C.; Bailón, E.G.; González-Porto, A.V.; Barrios, L.; Nozal, M.J.; Bernal, J.L.; Jiménez, J.J.; Palencia, P.G.; et al. How natural infection by Nosema ceranae causes honeybee colony collapse. Environ. Microbiol. 2008, 10, 2659–2669. [Google Scholar] [CrossRef]
- Higes, M.; Hernández, R.M.; Garrido-Bailón, E.; González-Porto, A.V.; García-Palencia, P.; Meana, A.; Nozal, M.J.; Mayo, R.; Bernal, J.L. Honeybee colony collapse due to Nosema ceranaein professional apiaries. Environ. Microbiol. Rep. 2009, 1, 110–113. [Google Scholar] [CrossRef] [PubMed]
- Higes, M.; Hernández, R.M.; Meana, A. Nosema ceranaein Europe: An emergent type C nosemosis. Apidologie 2010, 41, 375–392. [Google Scholar] [CrossRef] [Green Version]
- Higes, M.; Meana, A.; Bartolomé, C.; Botías, C.; Hernández, R.M. Nosema ceranae (Microsporidia), a controversial 21st century honey bee pathogen. Environ. Microbiol. Rep. 2013, 5, 17–29. [Google Scholar] [CrossRef] [PubMed]
- Botías, C.; Barrios, L.; Nanetti, A.; Meana, A.; Martín-Hernández, R.; Garrido-Bailón, E.; Higes, M. Nosema spp. parasitization decreases the effectiveness of acaricide strips (Apivar®) in treating varroosis of honey bee (Apis mellifera iberiensis) colonies. Environ. Microbiol. Rep. 2011, 4, 57–65. [Google Scholar] [CrossRef] [PubMed]
- Antúnez, K.; Hernández, R.M.; Prieto, L.; Meana, A.; Zunino, P.; Higes, M. Immune suppression in the honey bee (Apis mellifera) following infection by Nosema ceranae (Microsporidia). Environ. Microbiol. 2009, 11, 2284–2290. [Google Scholar] [CrossRef] [PubMed]
- Aufauvre, J.; Misme-Aucouturier, B.; Viguès, B.; Texier, C.; Delbac, F.; Blot, N. Transcriptome Analyses of the Honeybee Response to Nosema ceranae and Insecticides. PLoS ONE 2014, 9, e91686. [Google Scholar] [CrossRef] [PubMed]
- Holt, H.L.; Aronstein, K.A.; Grozinger, C.M. Chronic parasitization by Nosema microsporidia causes global expression changes in core nutritional, metabolic and behavioral pathways in honey bee workers (Apis mellifera). BMC Genom. 2013, 14, 1–16. [Google Scholar] [CrossRef] [Green Version]
- Kurze, C.; Dosselli, R.; Grassl, J.; Le Conte, Y.; Kryger, P.; Baer, B.; Moritz, R. Differential proteomics reveals novel insights into Nosema–honey bee interactions. Insect Biochem. Mol. Biol. 2016, 79, 42–49. [Google Scholar] [CrossRef] [PubMed]
- Mayack, C.; Naug, D. Energetic stress in the honeybee Apis mellifera from Nosema ceranae infection. J. Invertebr. Pathol. 2009, 100, 185–188. [Google Scholar] [CrossRef]
- Dussaubat, C.; Maisonnasse, A.; Crauser, D.; Beslay, D.; Costagliola, G.; Soubeyrand, S.; Kretzchmar, A.; Le Conte, Y. Flight behavior and pheromone changes associated to Nosema ceranae infection of honey bee workers (Apis mellifera) in field conditions. J. Invertebr. Pathol. 2013, 113, 42–51. [Google Scholar] [CrossRef]
- Wolf, S.; McMahon, D.; Lim, K.S.; Pull, C.D.; Clark, S.J.; Paxton, R.; Osborne, J.L. So Near and Yet So Far: Harmonic Radar Reveals Reduced Homing Ability of Nosema Infected Honeybees. PLoS ONE 2014, 9, e103989. [Google Scholar] [CrossRef] [Green Version]
- Botías, C.; Martín-Hernández, R.; Barrios, L.; Meana, A.; Higes, M. Nosema spp. infection and its negative effects on honey bees (Apis mellifera iberiensis) at the colony level. Vet. Res. 2013, 44, 25. [Google Scholar] [CrossRef] [Green Version]
- Hatjina, F.; Tsoktouridis, G.; Bouga, M.; Charistos, L.; Evangelou, V.; Avtzis, D.; Meeus, I.; Brunain, M.; Smagghe, G.; de Graaf, D.C. Polar tube protein gene diversity among Nosema ceranae strains derived from a Greek honey bee health study. J. Invertebr. Pathol. 2011, 108, 131–134. [Google Scholar] [CrossRef]
- Lodesani, M.; Costa, C.; Besana, A.; Dall’Olio, R.; Franceschetti, S.; Tesoriero, D.; Giacomo, D. Impact of control strategies for Varroa destructor on colony survival and health in northern and central regions of Italy. J. Apic. Res. 2014, 53, 155–164. [Google Scholar] [CrossRef]
- Noureddine, A.; Haddad, N. The first data on hygienic behavior of Apis mellifera intermissa in Algeria. J. Biol. Earth Sci. 2013, 201, 1–5. [Google Scholar]
- Francis, R.M.; Amiri, E.; Meixner, M.D.; Kryger, P.; Gajda, A.; Andonov, S.; Uzunov, A.; Topolska, G.; Charistos, L.; Costa, C.; et al. Effect of genotype and environment on parasite and pathogen levels in one apiary—a case study. J. Apic. Res. 2014, 53, 230–232. [Google Scholar] [CrossRef]
- Gisder, S.; Hedtke, K.; Möckel, N.; Frielitz, M.-C.; Linde, A.; Genersch, E. Five-Year Cohort Study of Nosema spp. in Germany: Does Climate Shape Virulence and Assertiveness of Nosema ceranae? Appl. Environ. Microbiol. 2010, 76, 3032–3038. [Google Scholar] [CrossRef] [PubMed] [Green Version]
- Stevanovic, J.; Simeunovic, P.; Gajić, B.; Lakic, N.; Radovic, D.; Fries, I.; Stanimirovic, Z. Characteristics of Nosema ceranae infection in Serbian honey bee colonies. Apidologie 2013, 44, 522–536. [Google Scholar] [CrossRef] [Green Version]
- Stevanovic, J.; Stanimirovic, Z.; Genersch, E.; Kovacevic, S.; Ljubenkovic, J.; Radakovic, M.; Aleksic, N. Dominance of Nosema ceranae in honey bees in the Balkan countries in the absence of symptoms of colony collapse disorder. Apidologie 2011, 42, 49–58. [Google Scholar] [CrossRef] [Green Version]
- Dainat, B.; Evans, J.; Chen, Y.P.; Gauthier, L.; Neumann, P. Predictive Markers of Honey Bee Colony Collapse. PLoS ONE 2012, 7, e32151. [Google Scholar] [CrossRef]
- Francis, R.M.; Nielsen, S.L.; Kryger, P. Varroa-Virus Interaction in Collapsing Honey Bee Colonies. PLoS ONE 2013, 8, e57540. [Google Scholar] [CrossRef] [Green Version]
- Mordecai, G.J.; Wilfert, L.; Martin, S.; Jones, I.; Schroeder, D. Diversity in a honey bee pathogen: First report of a third master variant of the Deformed Wing Virus quasispecies. ISME J. 2015, 10, 1264–1273. [Google Scholar] [CrossRef] [PubMed] [Green Version]
- Chen, Y.P.; Siede, R. Honey Bee Viruses. Adv. Virus Res. 2007, 70, 33–80. [Google Scholar] [CrossRef] [PubMed] [Green Version]
- Mendoza, Y.; Antúnez, K.; Branchiccela, B.; Anido, M.; Santos, E.; Invernizzi, C. Nosema ceranae and RNA viruses in European and Africanized honeybee colonies (Apis mellifera) in Uruguay. Apidologie 2013, 45, 224–234. [Google Scholar] [CrossRef]
- Costa, C.; Tanner, G.; Lodesani, M.; Maistrello, L.; Neumann, P. Negative correlation between Nosema ceranae spore loads and deformed wing virus infection levels in adult honey bee workers. J. Invertebr. Pathol. 2011, 108, 224–225. [Google Scholar] [CrossRef] [PubMed]
- Dussaubat, C.; Brunet, J.-L.; Higes, M.; Colbourne, J.; Lopez, J.; Choi, J.H.; Hernández, R.M.; Botías, C.; Cousin, M.; McDonnell, C.; et al. Gut Pathology and Responses to the Microsporidium Nosema ceranae in the Honey Bee Apis mellifera. PLoS ONE 2012, 7, e37017. [Google Scholar] [CrossRef] [PubMed] [Green Version]
- Hedtke, K.; Jensen, P.; Jensen, A.B.; Genersch, E. Evidence for emerging parasites and pathogens influencing outbreaks of stress-related diseases like chalkbrood. J. Invertebr. Pathol. 2011, 108, 167–173. [Google Scholar] [CrossRef] [PubMed]
- Martin, S.J.; Hardy, J.; Villalobos, E.; Hernández, R.M.; Nikaido, S.; Higes, M. Do the honeybee pathogens N osema ceranae and deformed wing virus act synergistically? Environ. Microbiol. Rep. 2013, 5, 506–510. [Google Scholar] [CrossRef] [Green Version]
- Doublet, V.; Natsopoulou, M.; Zschiesche, L.; Paxton, R. Within-host competition among the honey bees pathogens Nosema ceranae and Deformed wing virus is asymmetric and to the disadvantage of the virus. J. Invertebr. Pathol. 2015, 124, 31–34. [Google Scholar] [CrossRef]
- Authority, E.F.S. Conclusion on the peer review of the pesticide risk assessment of the active substance tau-fluvalinate. EFSA J. 2010, 8, 1645. [Google Scholar] [CrossRef]
- Garten, C.; Trabalka, J.R. Evaluation of models for predicting terrestrial food chain behavior of xenobiotics. Environ. Sci. Technol. 1983, 17, 590–595. [Google Scholar] [CrossRef]
- Chauzat, M.-P.; Carpentier, P.; Martel, A.-C.; Bougeard, S.; Cougoule, N.; Porta, P.; Lachaize, J.; Madec, F.; Aubert, M.; Faucon, J.-P. Influence of pesticide residues on honey bee (Hymenoptera: Apidae) colony health in France. Environ. Ѐntomol. 2009, 38, 514–523. [Google Scholar] [CrossRef] [Green Version]
- Mullin, C.A.; Frazier, M.; Frazier, J.L.; Ashcraft, S.; Simonds, R.; Vanengelsdorp, D.; Pettis, J.S. High Levels of Miticides and Agrochemicals in North American Apiaries: Implications for Honey Bee Health. PLoS ONE 2010, 5, e9754. [Google Scholar] [CrossRef] [Green Version]
- Hörig, K. Development of a toxicokinetic model for the honey bee (Apis mellifera) colony for the use in risk assessment. Ph.D. Thesis, Faculty of Mathematics, Computer Science and Natural Sciences of the RWTH Aachen University, Aachen, Germany, 2015. [Google Scholar]
- Bogdanov, S.; Kilchenmann, V.; Imdorf, A. Acaricide residues in some bee products. J. Apic. Res. 1998, 37, 57–67. [Google Scholar] [CrossRef]
- Martel, A.-C.; Zeggane, S.; Aurières, C.; Drajnudel, P.; Faucon, J.-P.; Aubert, M. Acaricide residues in honey and wax after treatment of honey bee colonies with Apivar® or Asuntol® 50. Apidologie 2007, 38, 534–544. [Google Scholar] [CrossRef]
- Sokół, R. The influence of a multimonth persistence of Fluwarol in a hive of a honey bee colony. Med. Weter. 1996, 52, 718–720. [Google Scholar]
- Bogdanov, S. Contaminants of bee products. Apidologie 2005, 37, 1–18. [Google Scholar] [CrossRef] [Green Version]
- Bernal, J.L.; Garrido-Bailon, E.; DEL Nozal, J.B.; González-Porto, A.V.; Hernández, R.M.; Diego, J.C.; Jimenez, J.J.; Higes, M. Overview of Pesticide Residues in Stored Pollen and Their Potential Effect on Bee Colony (Apis mellifera) Losses in Spain. J. Econ. Ѐntomol. 2010, 103, 1964–1971. [Google Scholar] [CrossRef]
- Johnson, R.; Ellis, M.D.; Mullin, C.A.; Frazier, M. Pesticides and honey bee toxicity–USA. Apidologie 2010, 41, 312–331. [Google Scholar] [CrossRef] [Green Version]
- Traynor, K.; Pettis, J.S.; Tarpy, D.; Mullin, C.A.; Frazier, J.L.; Frazier, M.; Vanengelsdorp, D. In-hive Pesticide Exposome: Assessing risks to migratory honey bees from in-hive pesticide contamination in the Eastern United States. Sci. Rep. 2016, 6, 33207. [Google Scholar] [CrossRef] [Green Version]
- Johnson, R.M.; Pollock, H.S.; Berenbaum, M.R. Synergistic Interactions between In-Hive Miticides in Apis mellifera. J. Econ. Ѐntomol. 2009, 102, 474–479. [Google Scholar] [CrossRef] [PubMed]
- Wu, J.Y.; Smart, M.D.; Anelli, C.M.; Sheppard, W.S. Honey bees (Apis mellifera) reared in brood combs containing high levels of pesticide residues exhibit increased susceptibility to Nosema (Microsporidia) infection. J. Invertebr. Pathol. 2012, 109, 326–329. [Google Scholar] [CrossRef] [PubMed]
- Di Pasquale, G.; Salignon, M.; Le Conte, Y.; Belzunces, L.P.; Decourtye, A.; Kretzschmar, A.; Suchail, S.; Brunet, J.-L.; Alaux, C. Influence of Pollen Nutrition on Honey Bee Health: Do Pollen Quality and Diversity Matter? PLoS ONE 2013, 8, e72016. [Google Scholar] [CrossRef] [PubMed] [Green Version]
- Alaux, C.; Dantec, C.; Parrinello, H.; Le Conte, Y. Nutrigenomics in honey bees: Digital gene expression analysis of pollen’s nutritive effects on healthy and Varroa-parasitized bees. BMC Genom. 2011, 12, 496. [Google Scholar] [CrossRef] [PubMed] [Green Version]
- Brodschneider, R.; Crailsheim, K. Nutrition and health in honey bees. Apidologie 2010, 41, 278–294. [Google Scholar] [CrossRef]
- Calovi, M.; Grozinger, C.M.; Miller, D.A.; Goslee, S.C. Summer weather conditions influence winter survival of honey bees (Apis mellifera) in the northeastern United States. Sci. Rep. 2021, 11, 1–12. [Google Scholar] [CrossRef] [PubMed]
- Martín-Hernández, R.; Bartolomé, C.; Chejanovsky, N.; Le Conte, Y.; Dalmon, A.; Dussaubat, C.; García-Palencia, P.; Meana, A.; Pinto, M.A.; Soroker, V.; et al. Nosema ceranae in Apis mellifera: A 12 years postdetection perspective. Environ. Microbiol. 2018, 20, 1302–1329. [Google Scholar] [CrossRef] [PubMed] [Green Version]
- Buendía-Abad, M.; Martín-Hernández, R.; Ornosa, C.; Barrios, L.; Bartolomé, C.; Higes, M. Epidemiological study of honeybee pathogens in Europe: The results of Castilla-La Mancha (Spain). Span. J. Agric. Res. 2018, 16, e0502. [Google Scholar] [CrossRef] [Green Version]
- Antúnez, K.; Anido, M.; Garrido-Bailón, E.; Botías, C.; Zunino, P.; Martínez-Salvador, A.; Hernández, R.M.; Higes, M. Low prevalence of honeybee viruses in Spain during 2006 and 2007. Res. Vet. Sci. 2012, 93, 1441–1445. [Google Scholar] [CrossRef] [PubMed]
- Martín-Hernández, R.; Botías, C.; Bailón, E.G.; Martínez-Salvador, A.; Prieto, L.; Meana, A.; Higes, M. Microsporidia infecting Apis mellifera: Coexistence or competition. Is Nosema ceranae replacing Nosema apis? Environ. Microbiol. 2011, 14, 2127–2138. [Google Scholar] [CrossRef]
- Meeus, I.; De Graaf, D.; Jans, K.; Smagghe, G. Multiplex PCR detection of slowly-evolving trypanosomatids and neogregarines in bumblebees using broad-range primers. J. Appl. Microbiol. 2010, 109, 107–115. [Google Scholar] [CrossRef] [Green Version]
- Stevanovic, J.; Schwarz, R.S.; Vejnovic, B.; Evans, J.D.; Irwin, R.E.; Glavinic, U.; Stanimirovic, Z. Species-specific diagnostics of Apis mellifera trypanosomatids: A nine-year survey (2007–2015) for trypanosomatids and microsporidians in Serbian honey bees. J. Invertebr. Pathol. 2016, 139, 6–11. [Google Scholar] [CrossRef] [PubMed] [Green Version]
- Cepero, A.; Hernández, R.M.; Prieto, L.; Gómez-Moracho, T.; Martínez-Salvador, A.; Bartolomé, C.; Maside, X.; Meana, A.; Higes, M. Is Acarapis woodi a single species? A new PCR protocol to evaluate its prevalence. Parasitol. Res. 2014, 114, 651–658. [Google Scholar] [CrossRef] [PubMed]
- Ravoet, J.; Maharramov, J.; Meeus, I.; De Smet, L.; Wenseleers, T.; Smagghe, G.; De Graaf, D.C. Comprehensive Bee Pathogen Screening in Belgium Reveals Crithidia mellificae as a New Contributory Factor to Winter Mortality. PLoS ONE 2013, 8, e72443. [Google Scholar] [CrossRef] [PubMed] [Green Version]
- Francis, R.; Kryger, P. Single Assay Detection of Acute Bee Paralysis Virus, Kashmir Bee Virus and Israeli Acute Paralysis Virus. J. Apic. Sci. 2012, 56, 137–146. [Google Scholar] [CrossRef] [Green Version]
- Chantawannakul, P.; Ward, L.; Boonham, N.; Brown, M. A scientific note on the detection of honeybee viruses using real-time PCR (TaqMan) in Varroa mites collected from a Thai honeybee (Apis mellifera) apiary. J. Invertebr. Pathol. 2006, 91, 69–73. [Google Scholar] [CrossRef] [PubMed]
- Valverde, S.; Bernal, J.L.; Martín, M.T.; Nozal, M.J. Fast determination of neonicotinoid insecticides in bee pollen using QuECHERS and ultra high performance liquid chromatography coupled to quadrupole time-of-flight mass spectrometry. Electrophoresis 2016, 37, 2470–2477. [Google Scholar] [CrossRef] [PubMed]
- Faegri, K.; Iversen, J. Textbook of Pollen Analysis, 4th ed.; John Wiley & Sons: Chichester, West Sussex, UK, 1989. [Google Scholar]
- Valdés, B.; Díez, M.J.; Fernández, I. Atlas polínico de Andalucía Occidental; Instituto de Desarrollo Regional Nº 43, Universidad de Sevilla y Excma: Diputación de Cádiz: Cádiz, Spain, 1987. [Google Scholar]
- Walter, H.; Lieth, H. Klimadiagramm–Weltatlas; VEB G. Fisher Verlag: Jena, Germany, 1967. [Google Scholar]
- Rivas-Martinez, S.S.R.-S.S. Worldwide Bioclimatic Classification System, 1996–2021. Available online: http://www.globalbioclimatics.org/default.htm (accessed on 5 July 2021).


| Status of the Colonies | Colony Code | %VD | %NC * | DWV | BQCV | FVT (*) | CMF * | LN(TUm) * | %WP |
|---|---|---|---|---|---|---|---|---|---|
| Dead | D1 | 5 | 70 | 7 | 435 | −6.38 | 96.3 | ||
| D2 | 0 | 80 | 7 | 415 | −6.43 | 45.1 | |||
| D3 | 0 | 75 | <LOQ | 202 | −7.154 | 89.3 | |||
| D4 | 0 | 92 | 13 | 350 | −6.59 | 65.1 | |||
| D5 | 0 | 89 | 9 | 323 | −6.68 | 79.4 | |||
| Surviving | S1 | 25 | 20 | + | + | 7 | 283 | −6.81 | 90.5 |
| S2 | 1 | 30 | + | − | 9 | 545 | −6.16 | 30.7 | |
| S3 | 0 | 25 | + | − | 10 | 2230 | −4.75 | 15.2 | |
| S4 | 0 | 60 | + | + | 15 | 465 | −6.31 | 30.5 | |
| S5 | 0 | 36 | + | + | 20 | 1165 | −5.42 | 33.7 | |
| S6 | 0 | 20 | + | − | 16 | 305 | −6.73 | 77.7 | |
| S7 | 0 | 30 | − | + | 18 | 775 | −5.80 | 92.1 | |
| S8 | 0 | 45 | − | + | 19 | 850 | −5.71 | 55.6 | |
| S9 | 0 | 35 | + | − | 13 | 936 | −5.62 | 85.4 | |
| S10 | 0 | 35 | + | + | 13 | 845 | −5.72 | 93.7 |
| Incubation Time | Mites | Control | CheckMite® (Coumaphos) | Apistan® (Tau-Fluvalinate) | Apitraz® (Amitraz) |
|---|---|---|---|---|---|
| 6 h | Dead | 1 | 10 | 5 | 8 |
| Alive | 7 | 0 | 0 | 0 | |
| 24 h | Dead | 2 | 11 | 7 | 8 |
| Alive | 9 | 0 | 1 | 1 |
Publisher’s Note: MDPI stays neutral with regard to jurisdictional claims in published maps and institutional affiliations. |
© 2021 by the authors. Licensee MDPI, Basel, Switzerland. This article is an open access article distributed under the terms and conditions of the Creative Commons Attribution (CC BY) license (https://creativecommons.org/licenses/by/4.0/).
Share and Cite
Alonso-Prados, E.; González-Porto, A.-V.; Bernal, J.L.; Bernal, J.; Martín-Hernández, R.; Higes, M. A Case Report of Chronic Stress in Honey Bee Colonies Induced by Pathogens and Acaricide Residues. Pathogens 2021, 10, 955. https://doi.org/10.3390/pathogens10080955
Alonso-Prados E, González-Porto A-V, Bernal JL, Bernal J, Martín-Hernández R, Higes M. A Case Report of Chronic Stress in Honey Bee Colonies Induced by Pathogens and Acaricide Residues. Pathogens. 2021; 10(8):955. https://doi.org/10.3390/pathogens10080955
Chicago/Turabian StyleAlonso-Prados, Elena, Amelia-Virginia González-Porto, José Luis Bernal, José Bernal, Raquel Martín-Hernández, and Mariano Higes. 2021. "A Case Report of Chronic Stress in Honey Bee Colonies Induced by Pathogens and Acaricide Residues" Pathogens 10, no. 8: 955. https://doi.org/10.3390/pathogens10080955