
Amplicon Sequencing of Variable 16S rRNA from Bacteria and ITS2 Regions from Fungi and Plants, Reveals Honeybee Susceptibility to Diseases Results from Their Forage Availability under Anthropogenic Landscapes


 , , , , ,
  ,
,  ,
,  , , and
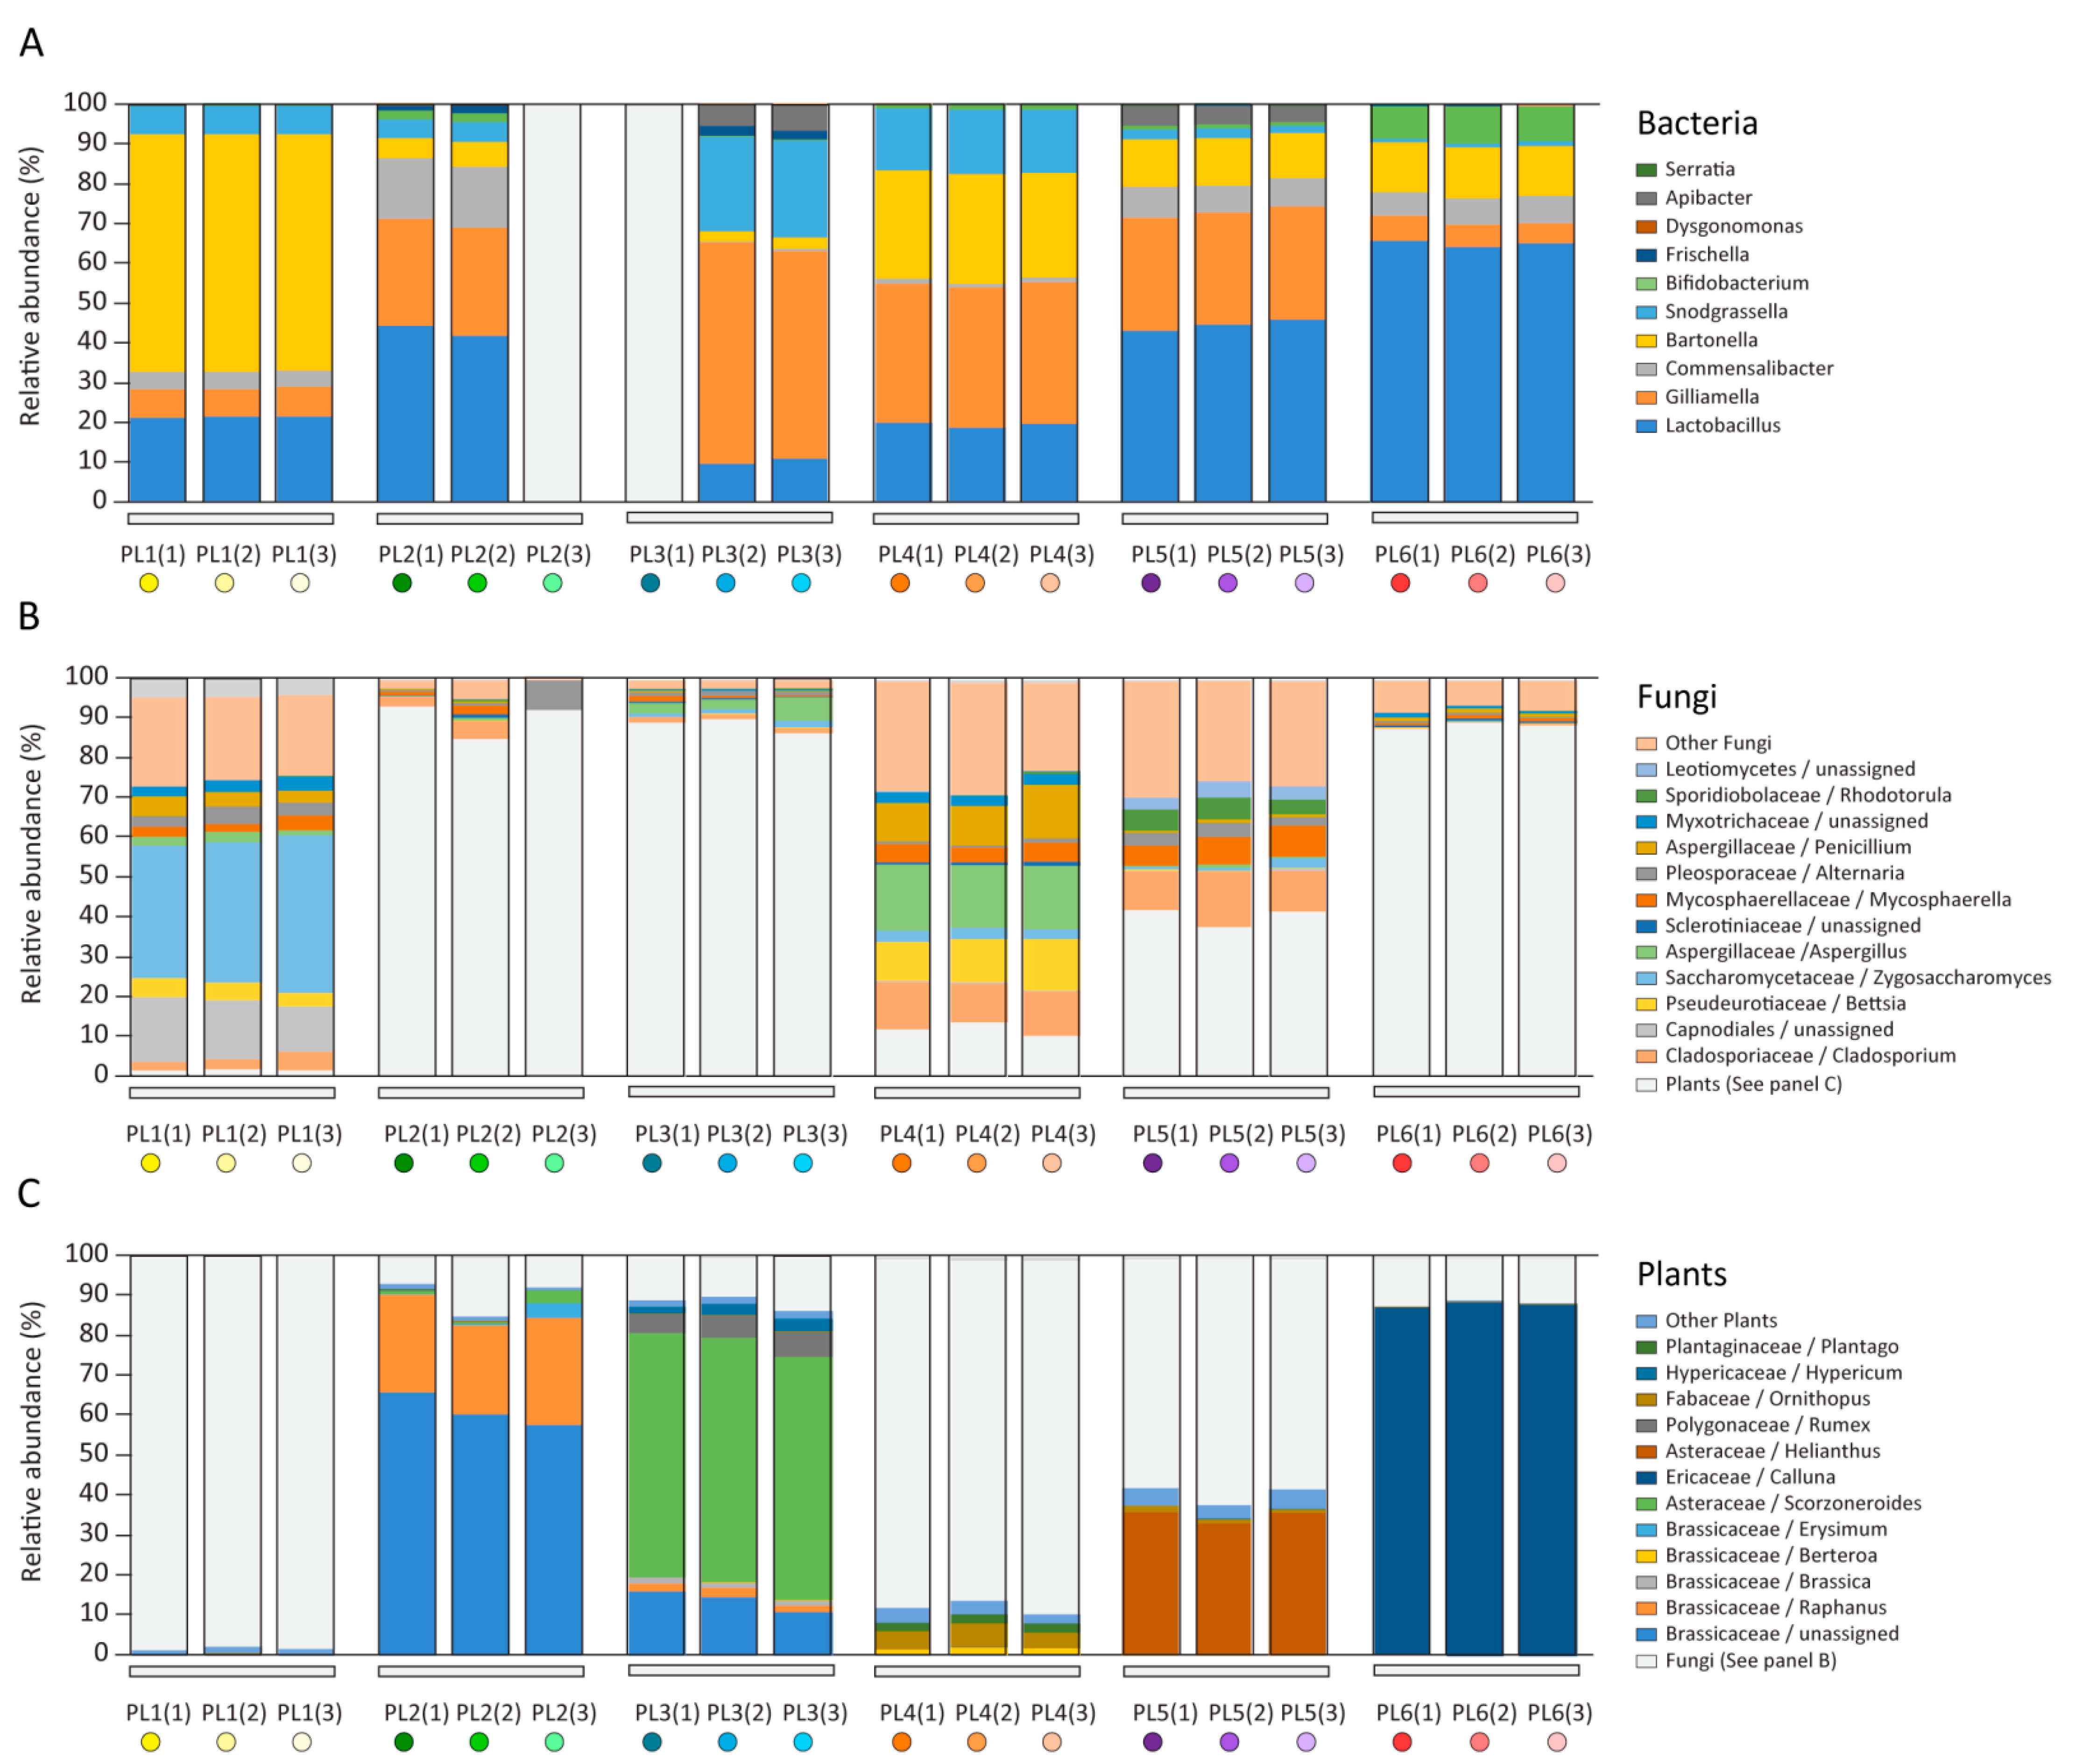
Abstract
:1. Introduction
2. Results and Discussion
2.1. Microbiome and Pollen Composition of Honeybees from Poland (Differences over the Vegetation Season)
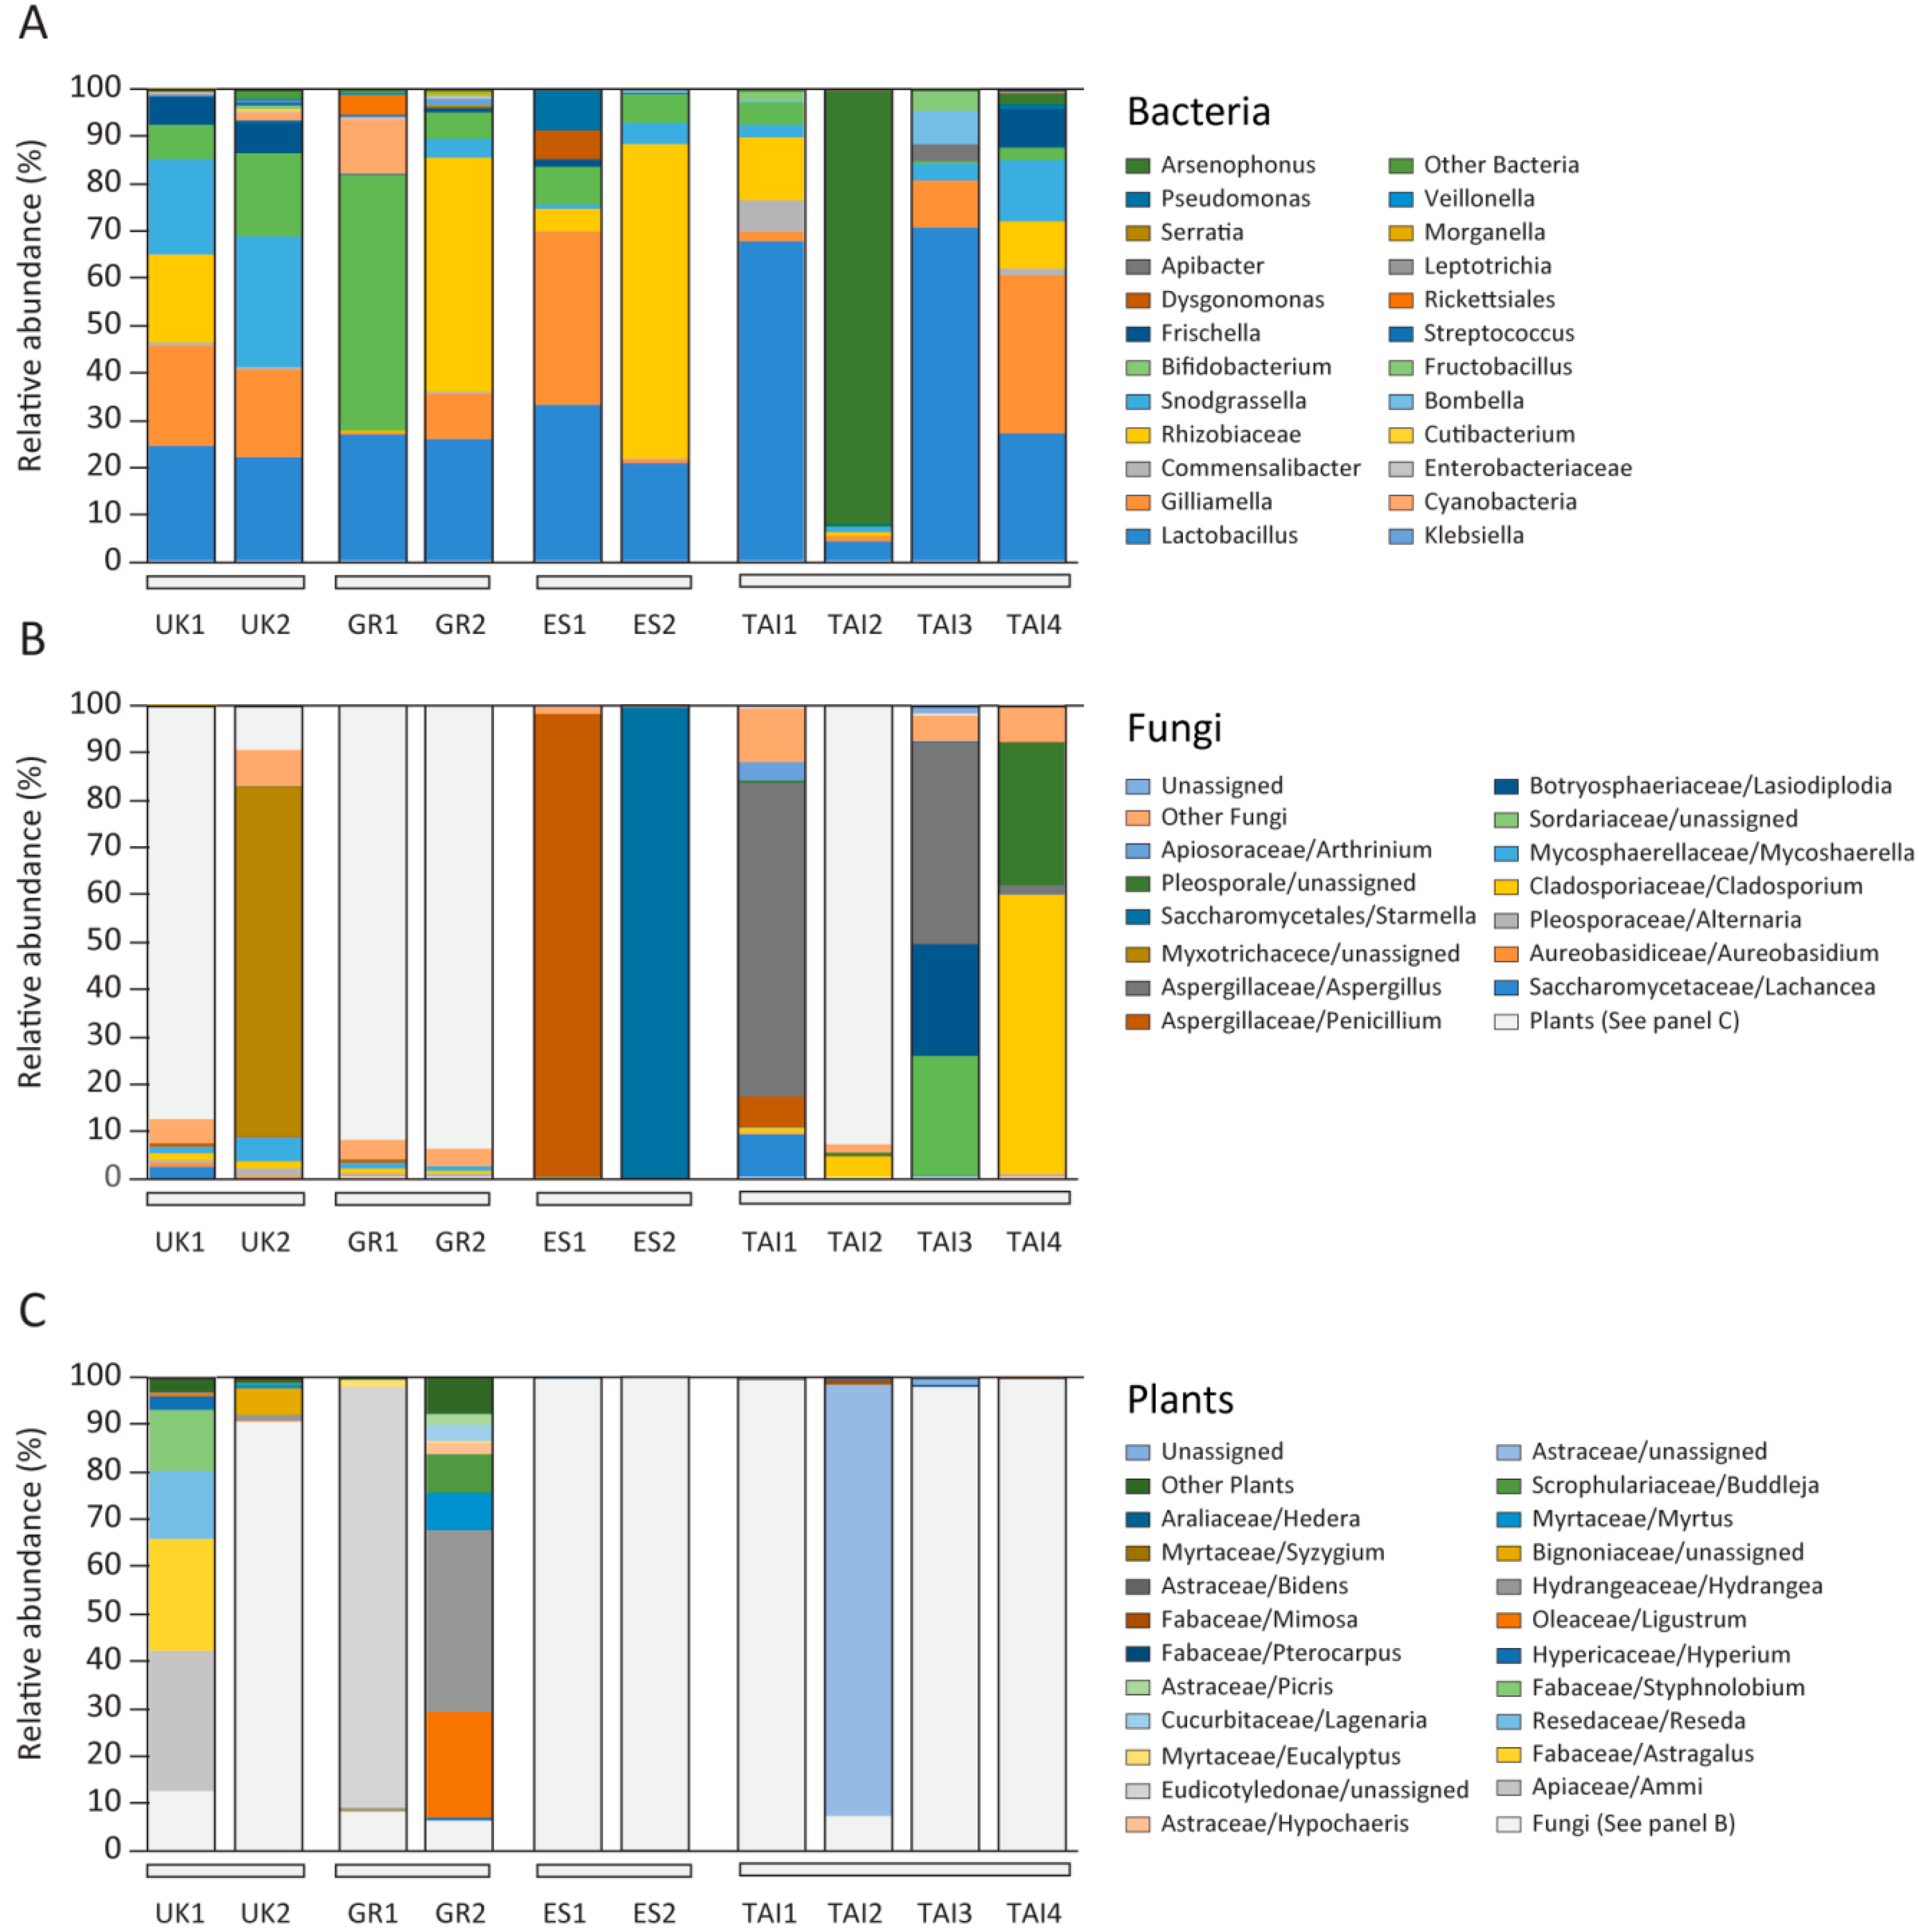
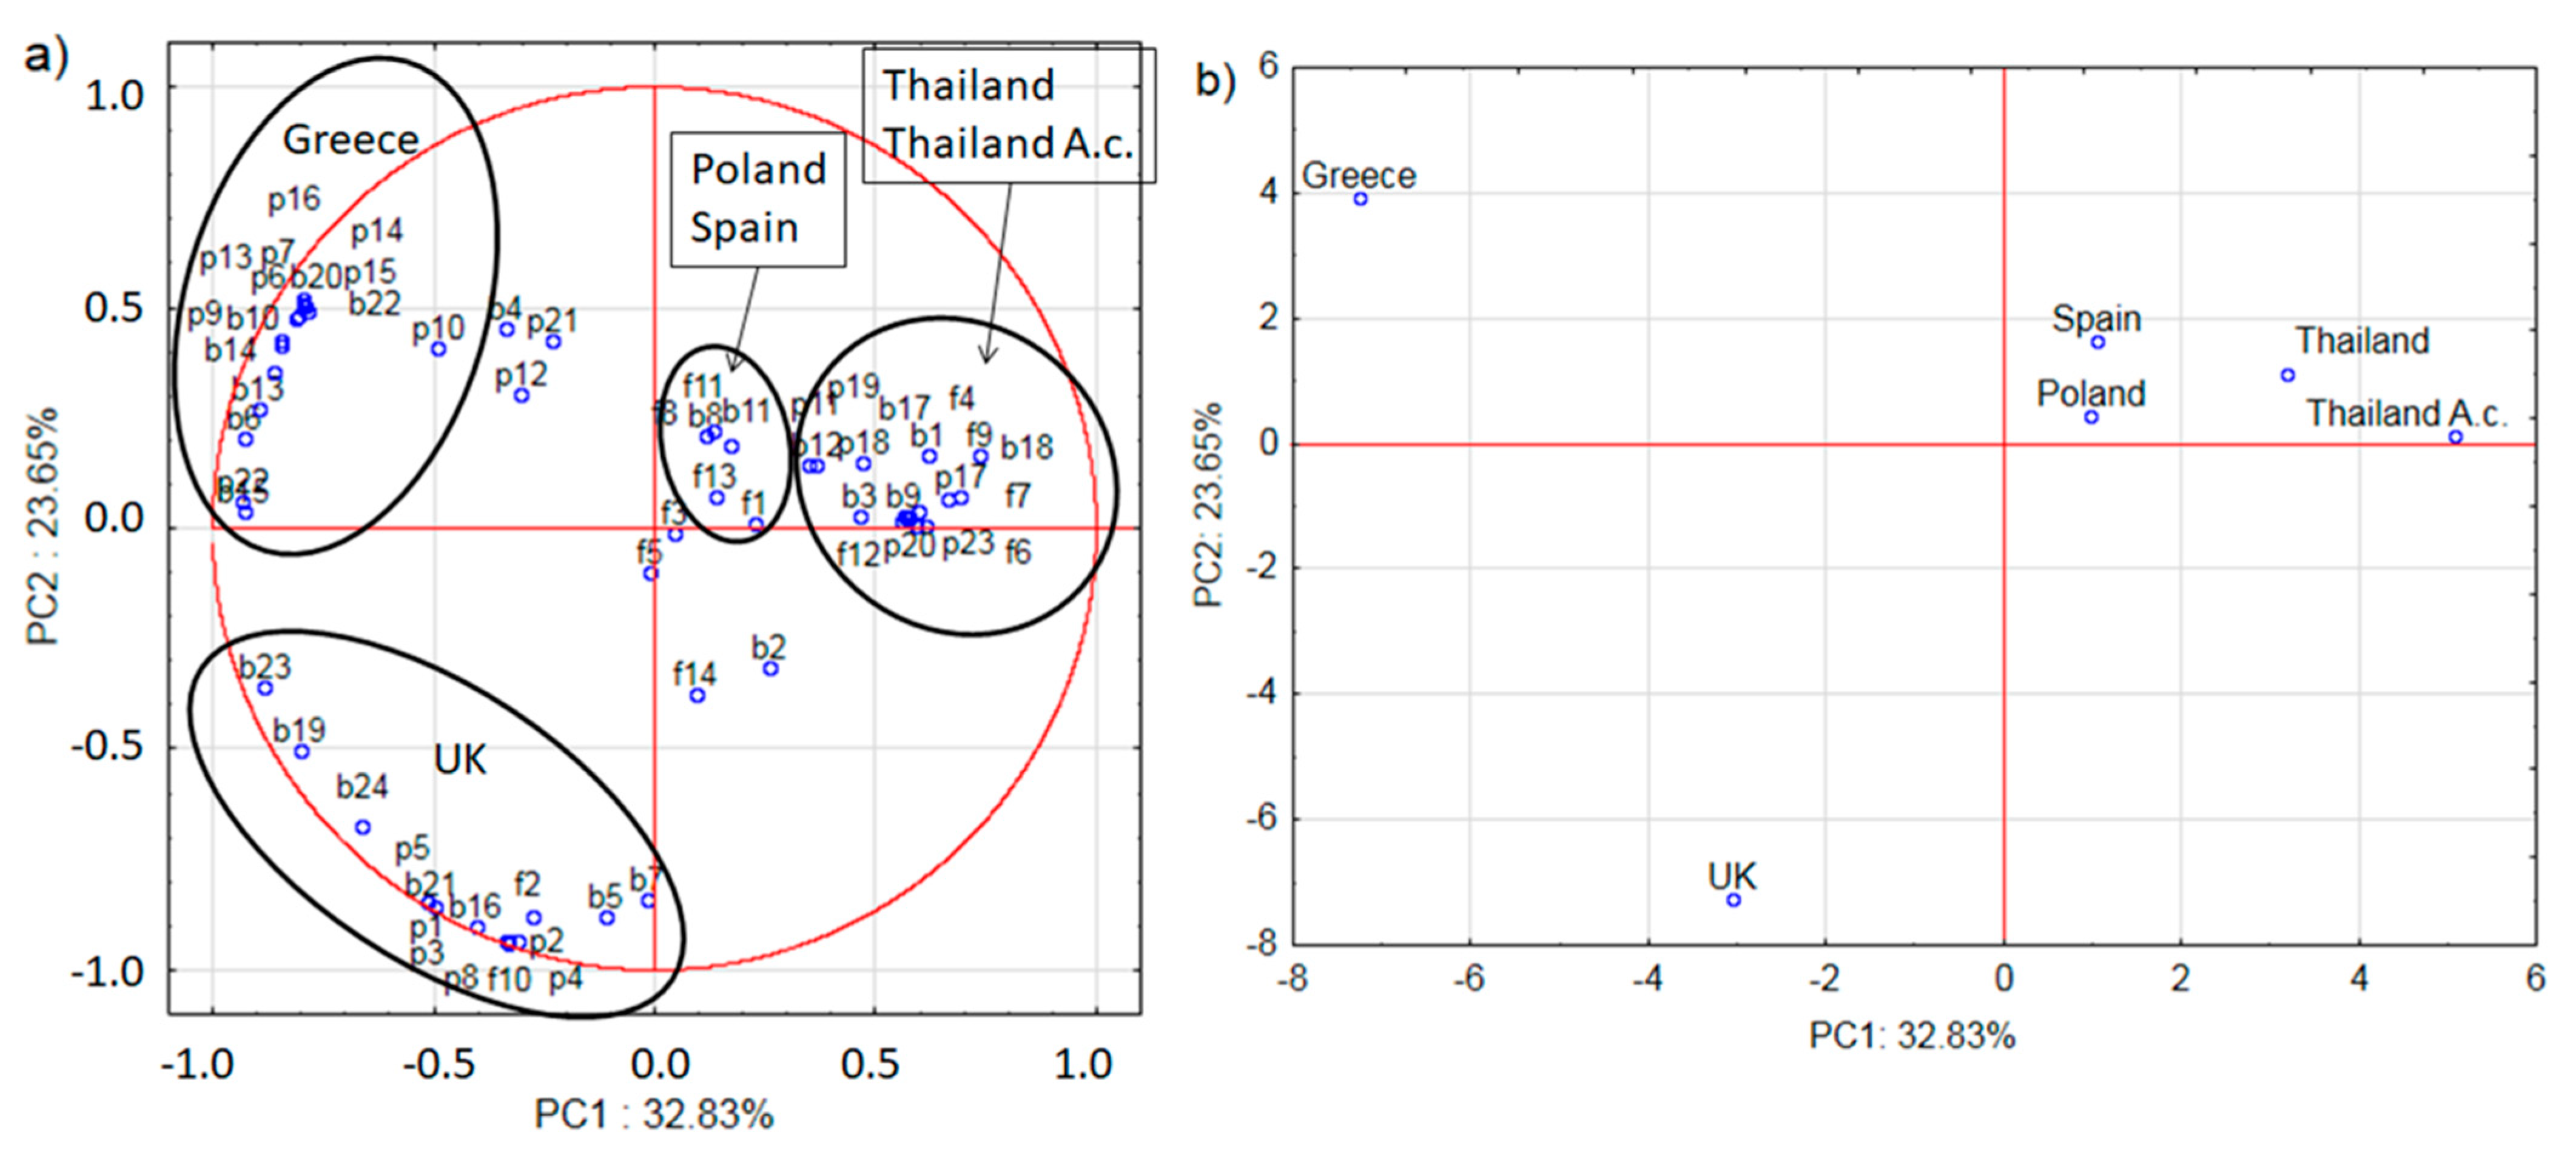
2.2. Microbiome and Pollen Composition of Honeybees from UK, Greece, Spain, and Thailand
3. Conclusions
4. Highlights
- The composition of honeybee microbiomes is mainly determined by their forage availability.
- Honeybees were more susceptible to pathogens if they did not receive a well-balanced diet, and especially honeybees on sugar based diet were more prone to fungal pathogens (Nosema ceranae) and neogregarines. In most samples Nosema sp. and neogregarines parasitized the host bee at the same time.
- The period when honeybees switch to the winter generation (longer-lived forager honeybees) is the most sensitive to diet perturbations, and hence pathogen attack, for the whole beekeeping season.
5. Materials and Methods
5.1. Honeybee Collection and DNA Isolation
5.2. NGS
5.3. Positive, Negative Control
5.4. Purification, Clean-Up
5.5. Library Pooling—Concentration, Normalization
5.6. Sequencing
5.7. 16S rRNA Bacterial Gene Analyses
5.8. ITS2 Region Analyses
5.9. Analyses of Amplicon from Honeybee Samples
5.10. Screening for Pathogen Infected Honeybee Samples
5.11. Statistical Analysis
Supplementary Materials
Author Contributions
Funding
Institutional Review Board Statement
Informed Consent Statement
Data Availability Statement
Data Citation
Lead Contact
Conflicts of Interest
References
- Yao, R.; Xu, L.; Lu, G.; Zhu, L. Evaluation of the Function of Wild Animal Gut Microbiomes Using Next-Generation Sequencing and Bioinformatics and its Relevance to Animal Conservation. Evol. Bioinform. 2019, 15, 1176934319848438. [Google Scholar] [CrossRef]
- Romero, S.; Nastasa, A.; Chapman, A.; Kwong, W.K.; Foster, L.J. The honey bee gut microbiota: Strategies for study and characterization. Insect Mol. Biol. 2019, 28, 455–472. [Google Scholar] [CrossRef] [Green Version]
- Hawkins, J.; De Vere, N.; Griffith, A.; Ford, C.R.; Allainguillaume, J.; Hegarty, M.J.; Baillie, L.; Adams-Groom, B. Using DNA Metabarcoding to Identify the Floral Composition of Honey: A New Tool for Investigating Honey Bee Foraging Preferences. PLoS ONE 2015, 10, e0134735. [Google Scholar] [CrossRef] [Green Version]
- Kešnerová, L.; Emery, O.; Troilo, M.; Liberti, J.; Erkosar, B.; Engel, P. Gut microbiota structure differs between honeybees in winter and summer. ISME J. 2020, 14, 801–814. [Google Scholar] [CrossRef] [Green Version]
- Tauber, J.P.; Nguyen, V.; Lopez, D.; Evans, J.D. Effects of a Resident Yeast from the Honeybee Gut on Immunity, Microbiota, and Nosema Disease. Insects 2019, 10, 296. [Google Scholar] [CrossRef] [PubMed] [Green Version]
- McNeil, D.J.; McCormick, E.; Heimann, A.C.; Kammerer, M.; Douglas, M.R.; Goslee, S.C.; Grozinger, C.M.; Hines, H.M. Bumble bees in landscapes with abundant floral resources have lower pathogen loads. Sci. Rep. 2020, 10, 1–12. [Google Scholar] [CrossRef] [PubMed]
- Patel, V.; Pauli, N.; Biggs, E.; Barbour, L.; Boruff, B. Why bees are critical for achieving sustainable development. Ambio 2021, 50, 49–59. [Google Scholar] [CrossRef] [Green Version]
- Kwong, W.K.; A Moran, N. Evolution of host specialization in gut microbes: The bee gut as a model. Gut Microb. 2015, 6, 214–220. [Google Scholar] [CrossRef] [Green Version]
- Ahn, J.H.; Hong, I.P.; Bok, J.I.; Kim, B.Y.; Song, J.; Weon, H.Y. Pyrosequencing analysis of the bacterial communi-ties in the guts of honey bees Apis cerana and Apis mellifera in Korea. J. Microbiol. 2012, 50, 735–745. [Google Scholar] [CrossRef] [PubMed]
- Khan, K.A.; Al-Ghamdi, A.A.; Ghramh, H.A.; Ansari, M.J.; Ali, H.; Alamri, S.A.; Kahtani, S.N.A.-; Adgaba, N.; Qasim, M.; Hafeez, M. Structural diversity and functional variability of gut microbial communities associated with honey bees. Microb. Pathog. 2020, 138, 103793. [Google Scholar] [CrossRef] [PubMed]
- Kwong, W.K.; Moran, N.A. Gut microbial communities of social bees. Nat. Rev. Genet. 2016, 14, 374–384. [Google Scholar] [CrossRef]
- Raymann, K.; Bobay, L.M.; Moran, N.A. Antibiotics reduce genetic diversity of core species in the honeybee gut micro-biome. Mol. Ecol. 2018, 27, 2057–2066. [Google Scholar] [CrossRef] [PubMed]
- Pachla, A.; Ptaszyńska, A.A.; Wicha, M.; Kunat, M.; Wydrych, J.; Oleńska, E.; Małek, W. Insight into probiotic properties of lactic acid bacterial endosymbionts of Apis mellifera L. derived from the Polish apiary. Saudi J. Biol. Sci. 2021, 28, 1890–1899. [Google Scholar] [CrossRef] [PubMed]
- Gilliam, M.; Prest, D.B. Microbiology of feces of the larval honey bee, Apis mellifera. J. Invertebr. Pathol. 1987, 49, 70–75. [Google Scholar] [CrossRef]
- Gilliam, M.; Valentine, D.K. Bacteria isolated from the intestinal contents of foraging worker honey bees, Apis mellifera: The genus Bacillus. J. Invertebr. Pathol. 1976, 28, 275–276. [Google Scholar] [CrossRef]
- Gilliam, M. Are yeasts present in adult worker honey bees as a consequence of stress? Ann. Enlomal. Soc. Am. 1973, 66, 1176. [Google Scholar] [CrossRef]
- Gilliam, M. Identification and roles of non-pathogenic microflora associated with honey bees. FEMS Microbiol. Lett. 1997, 155, 1–10. [Google Scholar] [CrossRef]
- Gilliam, M.; Taber, S. Diseases, pests, and normal microflora of honeybees Api smellifera, from feral colonies. J. Invertebr. Pathol. 1991, 58, 286–289. [Google Scholar] [CrossRef]
- Ptaszyńska, A.A.; Paleolog, J.; Borsuk, G. Nosema ceranae Infection Promotes Proliferation of Yeasts in Honey Bee Intestines. PLoS ONE 2016, 11, e0164477. [Google Scholar] [CrossRef] [Green Version]
- Gilliam, M.; Prest, D.B. Fungi isolated from the intestinal contents of foraging worker honey bees, Apis mellifera. J. Invertebr. Pathol. 1972, 20, 101–103. [Google Scholar] [CrossRef]
- Tauber, J.P.; McMahon, D.; Ryabov, E.; Kunat, M.; Ptaszynska, A.A.; Evans, J.D. Honeybee intestines retain low yeast titers, but no bacterial mutualists, at emergence. Yeast 2021, in press. [Google Scholar]
- Zalasiewicz, J.; Waters, C.; Williams, M. Chapter 32: The Anthropocene. In A Geologic Time Scale; Gradstein, F., Ogg, J., Schmitz, M., Ogg, G., Eds.; Cambridge University Press: Cambridge, UK, 2020. [Google Scholar] [CrossRef]
- Howard, J. Anthropogenic Landforms and Soil Parent Materials. In Progress in Soil Science; Springer: Cham, Switzerland, 2017; Volume 23, pp. 25–51. [Google Scholar]
- Le Conte, Y.; Navajas, M. Climate change: Impact on honey bee populations and diseases. Rev. Sci. Tech. 2008, 27, 485–497, 499–510. [Google Scholar] [CrossRef] [PubMed]
- IUCN Red List, IUCN Species Survival Commission. Guidelines for Application of IUCN Red List criteria at regional and national levels. Table 3; Last Updated: Dec. 2020 List version 2020-3. Available online: https://www.iucnredlist.org/statistics (accessed on 15 December 2020).
- Fox, R. The decline of moths in Great Britain: A review of possible causes. Insect. Conserv. Divers. 2012, 6, 5–19. [Google Scholar] [CrossRef]
- Benton, T.G.; Bryant, D.M.; Cole, L.; Crick, H.Q. Linking agricultural practice to insect and bird populations: A his-torical study over three decades. J. Appl. Ecol. 2002, 39, 673–687. [Google Scholar] [CrossRef] [Green Version]
- Thomas, J.A.; Telfer, M.G.; Roy, D.B.; Preston, C.D.; Greenwood, J.J.D.; Asher, J.; Fox, R.; Clarke, R.T.; Lawton, J.H. Comparative Losses of British Butterflies, Birds, and Plants and the Global Extinction Crisis. Science 2004, 303, 1879–1881. [Google Scholar] [CrossRef] [PubMed] [Green Version]
- Hallmann, C.A.; Foppen, R.P.B.; Van Turnhout, C.A.M.; De Kroon, H.; Jongejans, E. Declines in insectivorous birds are associated with high neonicotinoid concentrations. Nat. Cell Biol. 2014, 511, 341–343. [Google Scholar] [CrossRef]
- Pimm, S.L.; Jenkins, C.N.; Abell, R.; Brooks, T.M.; Gittleman, J.L.; Joppa, L.N.; Raven, P.H.; Roberts, C.M.; Sexton, J.O. The biodiversity of species and their rates of extinction, distribution, and protection. Science 2014, 344, 1246752. [Google Scholar] [CrossRef]
- Sánchez-Bayo, F.; Wyckhuys, K.A. Worldwide decline of the entomofauna: A review of its drivers. Biol. Conserv. 2019, 232, 8–27. [Google Scholar] [CrossRef]
- Marshman, J.; Blay-Palmer, A.; Landman, K. Anthropocene Crisis: Climate Change, Pollinators, and Food Security. Environments 2019, 6, 22. [Google Scholar] [CrossRef] [Green Version]
- EU Pollinators Initiative. Brussels, 1.6.2018. COM(2018) 395 final. Available online: https://eur-lex.europa.eu/legal-content/EN/TXT/PDF/?uri=CELEX:52018DC0395&from=PL (accessed on 15 December 2020).
- LIFE+ URBANBE. Available online: https://ec.europa.eu/environment/life/project/Projects/index.cfm?fuseaction=home.showFile&rep=file&fil=URBANBEES_Management_Plan.pdf (accessed on 15 December 2020).
- City Bees. Available online: https://www.eea.europa.eu/atlas/eea/city-bees/story/article (accessed on 15 December 2020).
- Urban Beekeeping. Available online: https://beeproject.ca/urban-beekeeping (accessed on 15 December 2020).
- Garnett, T. Urban agriculture in London: Rethinking our food economy. In Growing Cities, Growing Food; German Foundation for International Development: Feldafing, Germany, 2000; pp. 477–500. [Google Scholar]
- Wilson, C.J.; Jamieson, M.A. The effects of urbanization on bee communities depends on floral resource availability and bee functional traits. PLoS ONE 2019, 14, e0225852. [Google Scholar] [CrossRef] [Green Version]
- Cariveau, D.P.; Winfree, R. Causes of variation in wild bee responses to anthropogenic drivers. Curr. Opin. Insect Sci. 2015, 10, 104–109. [Google Scholar] [CrossRef]
- Hernandez, J.L.; Frankie, G.W.; Thorp, R.W. Ecology of Urban Bees: A Review of Current Knowledge and Directions for Future Study. Cities Environ. 2009, 2, 1–15. [Google Scholar] [CrossRef]
- Ellegaard, K.M.; Engel, P. Genomic diversity landscape of the honey bee gut microbiota. Nat. Commun. 2019, 10, 1–13. [Google Scholar] [CrossRef] [PubMed]
- Cilia, G.; Fratini, F.; Tafi, E.; Mancini, S.; Turchi, B.; Sagona, S.; Cerri, D.; Felicioli, A.; Nanetti, A. Changes of Western honey bee Apis mellifera ligustica (Spinola, 1806) ventriculus microbial profile related to their in-hive tasks. J. Apic. Res. 2021, 60, 198–202. [Google Scholar] [CrossRef]
- Laha, R.C.; De Mandal, S.; Ralte, L.; Ralte, L.; Kumar, N.S.; Gurusubramanian, G.; Satishkumar, R.; Mugasimangalam, R.; Kuravadi, N.A. Meta-barcoding in combination with palynological inference is a potent diagnostic marker for hon-ey floral composition. AMB Express 2017, 7, 132. [Google Scholar] [CrossRef] [Green Version]
- Gous, A.; Swanevelder, D.Z.H.; Eardley, C.D.; Willows-Munro, S. Plant-pollinator interactions over time: Pollen metabarcoding from bees in a historic collection. Evol. Appl. 2019, 12, 187–197. [Google Scholar] [CrossRef] [Green Version]
- Keller, A.; Danner, N.; Grimmer, G.; Ankenbrand, M.; Von Der Ohe, K.; Rost, S.; Härtel, S.; Steffan-Dewenter, I. Evaluating multiplexed next-generation sequencing as a method in palynology for mixed pollen samples. Plant Biol. 2014, 17, 558–566. [Google Scholar] [CrossRef] [PubMed] [Green Version]
- Baksay, S.; Pornon, A.; Burrus, M.; Mariette, J.; Andalo, C.; Escaravage, N. Experimental quantification of pollen with DNA metabarcoding using ITS1 and trnL. Sci. Rep. 2020, 10, 1–9. [Google Scholar] [CrossRef] [Green Version]
- Szczęsna, T. Protein content and amino acid composition of bee-collected pollen from selected botanical origins. J. Agric. Sci. 2006, 50, 81–90. [Google Scholar]
- Wynns, A.A. Convergent evolution of highly reduced fruiting bodies in Pezizomycotina suggests key adaptations to the bee habitat. BMC Evol. Biol. 2015, 15, 1–11. [Google Scholar] [CrossRef] [Green Version]
- Zheng, H.; Nishida, A.; Kwong, W.K.; Koch, H.; Engel, P.; Steele, M.I.; Moran, N.A. Metabolism of Toxic Sugars by Strains of the Bee Gut Symbiont Gilliamella apicola. mBio 2016, 7, e01326-16. [Google Scholar] [CrossRef] [PubMed] [Green Version]
- Vanderplanck, M.; Vereecken, N.J.; Grumiau, L.; Esposito, F.; Lognay, G.; Wattiez, R.; Michez, D. The importance of pollen chemistry in evolutionary host shifts of bees. Sci. Rep. 2017, 7, 43058. [Google Scholar] [CrossRef] [PubMed] [Green Version]
- Vanderplanck, M.; Moerman, R.; Rasmont, P.P.; Lognay, G.C.; Wathelet, B.; Wattiez, R.; Michez, D. How Does Pollen Chemistry Impact Development and Feeding Behaviour of Polylectic Bees? PLoS ONE 2014, 9, e86209. [Google Scholar] [CrossRef] [PubMed]
- Past Weather in London, England, United Kingdom—July 2019. Available online: https://www.timeanddate.com/weather/uk/london/historic?month=07&year=2019 (accessed on 15 December 2020).
- Rodríguez-Andrade, E.; Stchigel, A.M.; Terrab, A.; Guarro, J.; Cano-Lira, J.F. Diversity of xerotolerant and xerophilic fungi in honey. IMA Fungus 2019, 10, 1–30. [Google Scholar] [CrossRef]
- Burnside, C.E. Saprophytic Fungi Associated with the Honey Bee. Bee World 1929, 10, 42. [Google Scholar] [CrossRef]
- Batra, L.R.; Batra, S.W.T.; Bohart, G.E. The mycoflora of domesticated and wild bees (Apoidea). Mycopathologia et Mycologia Applicata 1973, 49, 13–44. [Google Scholar] [CrossRef]
- Past Weather in Athens, Greece—November 2017. Available online: https://www.timeanddate.com/weather/greece/athens/historic?month=11&year=2017 (accessed on 15 December 2020).
- Past Weather in Madrid, Spain—November 2017. Available online: https://www.timeanddate.com/weather/spain/madrid/historic?month=11&year=2017 (accessed on 15 December 2020).
- Past Weather in Chiang Mai, Thailand—February 2018. Available online: https://www.timeanddate.com/weather/thailand/chiang-mai/historic?month=02&year=2018) (accessed on 15 December 2020).
- Nováková, E.; Hypša, V.; A Moran, N. Arsenophonus, an emerging clade of intracellular symbionts with a broad host distribution. BMC Microbiol. 2009, 9, 143. [Google Scholar] [CrossRef] [Green Version]
- Gancarz, M.; Hurd, P.J.; Latoch, P.; Polaszek, A.; Michalska-Madej, J.; Grochowalski, Ł.; Strapagiel, D.; Gnat, S.; Załuski, D.; Rusinek, R.; et al. Dataset of the next-generation sequencing of variable 16S rRNA from bacteria and ITS2 regions from fungi and plants derived from honeybees kept under anthropogenic landscapes. Data in Brief. [CrossRef]
- Abou-Shaara, H. The foraging behaviour of honey bees, Apis mellifera: A review. Veterinární Medicína 2014, 59, 1–10. [Google Scholar] [CrossRef] [Green Version]
- Daisley, B.A.; Chmiel, J.A.; Pitek, A.P.; Thompson, G.J.; Reid, G. Missing Microbes in Bees: How Systematic Depletion of Key Symbionts Erodes Immunity. Trends Microbiol. 2020, 28, 1010–1021. [Google Scholar] [CrossRef]
- Kakumanu, M.L.; Reeves, A.M.; Anderson, T.D.; Rodrigues, R.R.; Williams, M.A. Honey Bee Gut Microbiome Is Altered by In-Hive Pesticide Exposures. Front. Microbiol. 2016, 7, 1255. [Google Scholar] [CrossRef] [Green Version]
- A Ptaszyńska, A.; Borsuk, G.; Mułenko, W.; Demetraki-Paleolog, J. Differentiation of Nosema apis and Nosema ceranae spores under Scanning Electron Microscopy (SEM). J. Apic. Res. 2014, 53, 537–544. [Google Scholar] [CrossRef]
- Ptaszyńska, A.A.; Gancarz, M.; Hurd, P.J.; Borsuk, G.; Wiacek, D.; Nawrocka, A.; Strachecka, A.; Załuski, D.; Paleolog, J. Changes in the bioelement content of summer and winter western honeybees (Apis mellifera) induced by Nosema ceranae infection. PLoS ONE 2018, 13, e0200410. [Google Scholar] [CrossRef]
- Emsen, B.; De la Mora, A.; Lacey, B.; Eccles, L.; Kelly, P.G.; Medina-Flores, C.A.; Guzman-Novoa, E. Seasonality of Nosema ceranae Infections and Their Rela-tionship with Honey Bee Populations, Food Stores, and Survivorship in a North Ameri-can Region. Veter. Sci. 2020, 7, 131. [Google Scholar] [CrossRef]
- Martín-Hernández, R.; Meana, A.; Prieto, L.; Salvador, A.M.; Garrido-Bailón, E.; Higes, M. Outcome of Colonization of Apis mellifera by Nosema ceranae. Appl. Environ. Microbiol. 2007, 73, 6331–6338. [Google Scholar] [CrossRef] [Green Version]
- Lipa, J.; Triggiani, O. A newly recorded neogregarine (Protozoa, Apicomplexa), parasite in honey bees (Apis mellifera) and bumble bees (Bombus spp). Apidologie 1992, 23, 533–536. [Google Scholar] [CrossRef] [Green Version]
- Cepero, A.; Ravoet, J.; Gómez-Moracho, T.; Bernal, J.L.; Del Nozal, M.J.; Bartolomé, C.; Maside, X.; Meana, A.; González-Porto, A.V.; De Graaf, D.C.; et al. Holistic screening of collapsing honey bee colonies in Spain: A case study. BMC Res. Notes 2014, 7, 1–10. [Google Scholar] [CrossRef] [Green Version]
- Graystock, P.; Ng, W.H.; Parks, K.; Tripodi, A.D.; Muñiz, P.A.; Fersch, A.A.; Myers, C.R.; McFREDERICK, Q.S.; McArt, S.H. Dominant bee species and floral abundance drive parasite temporal dynamics in plant-pollinator communities. Nat. Ecol. Evol. 2020, 4, 1–10. [Google Scholar] [CrossRef] [PubMed]
- Costanza, R.; d’Arge, R.; de Groot, R.; Farber, S.; Grasso, M.; Hannon, B.; Limburg, K.; Naeem, S.; O’Neill, R.V.; Paruelo, J.; et al. The value of the world’s ecosystem services and natural capital. Nature 1997, 387, 253–260. [Google Scholar] [CrossRef]
- Goulson, D.; Nicholls, E.; Botías, C.; Rotheray, E.L. Bee declines driven by combined stress from parasites, pesticides, and lack of flowers. Science 2015, 347, 1255957. [Google Scholar] [CrossRef]
- Mayer, C.; Adler, L.; Armbruster, S.; Dafni, A.; Eardley, C.; Huang, S.-Q.; Kevan, P.G.; Ollerton, J.; Packer, L.; Ssymank, A. Pollination ecology in the 21st Century: Key questions for future research. J. Pollinat. Ecol. 2011, 3, 8–23. [Google Scholar] [CrossRef]
- De Vere, N.; Jones, L.E.; Gilmore, T.; Moscrop, J.; Lowe, A.; Smith, D.; Hegarty, M.J.; Creer, S.; Ford, C.R. Using DNA metabarcoding to investigate honey bee foraging reveals limited flower use despite high floral availability. Sci. Rep. 2017, 7, 42838. [Google Scholar] [CrossRef] [PubMed] [Green Version]
- Ptaszyńska, A.A.; Załuski, D. Extracts from Eleutherococcus senticosus (Rupr. et Maxim.) Maxim. Roots: A New Hope Against Honeybee Death Caused by Nosemosis. Molcules 2020, 25, 4452. [Google Scholar] [CrossRef] [PubMed]
- Vaudo, A.D.; Tooker, J.F.; Grozinger, C.M.; Patch, H.M. Bee nutrition and floral resource restoration. Curr. Opin. Insect Sci. 2015, 10, 133–141. [Google Scholar] [CrossRef] [PubMed] [Green Version]
- Bolyen, E.; Rideout, J.; Dillon, M.; Bokulich, N.; Abnet, C.; Al-Ghalith, G.; Alexander, H.; Alm, E.; Arumugam, M.; Asnicar, F.; et al. Reproducible, interactive, scalable and extensible microbiome data science using QIIME 2. Nat. Biotechnol. 2019, 37, 852–857. [Google Scholar] [CrossRef] [PubMed]
- Callahan, B.J.; Mcmurdie, P.J.; Rosen, M.J.; Han, A.W.; Johnson, A.J.A.; Holmes, S.P. DADA2: High-resolution sample inference from Illumina amplicon data. Nat. Methods 2016, 13, 581–583. [Google Scholar] [CrossRef] [Green Version]
- Katoh, K.; Standley, D. MAFFT multiple sequence alignment software version 7: Improvements in performance and usability. Mol. Biol. Evol. 2013, 30, 772–780. [Google Scholar] [CrossRef] [Green Version]
- Price, M.N.; Dehal, P.S.; Arkin, A.P. FastTree 2 – Approximately Maximum-Likelihood Trees for Large Alignments. PLoS ONE 2010, 5, e9490. [Google Scholar] [CrossRef]
- Fabian, P.; Gaël, V.; Alexandre, G.; Vincent, M.; Bertrand, T.; Olivier, G.; Mathieu, B.; Peter, P.; Ron, W.; Vincent, D.; et al. Scikit-learn: Machine learning in python. J. Machine Learn. Res. 2011, 12, 2825–2830. [Google Scholar]
- Quast, C.; Pruesse, E.; Yilmaz, P.; Gerken, J.; Schweer, T.; Yarza, P.; Peplies, J.; Glöckner, F.O. The SILVA ribosomal RNA gene database project: Improved data processing and web-based tools. Open. External Link New Window Nucl. Acids Res. 2013, 41, D590–D596. [Google Scholar] [CrossRef]
- Abarenkov, K.; Nilsson, R.H.; Larsson, K.-H.; Alexander, I.J.; Eberhardt, U.; Erland, S.; Høiland, K.; Kjøller, R.; Larsson, E.; Pennanen, T.; et al. The UNITE database for molecular identification of fungi - recent updates and future perspectives. New Phytol. 2010, 186, 281–285. [Google Scholar] [CrossRef]
- Klindworth, A.; Pruesse, E.; Schweer, T.; Peplies, J.; Quast, C.; Horn, M.; Glöckner, F.O. Evaluation of general 16S ribosomal RNA gene PCR primers for classical and next-generation sequencing-based diversity studies. Nucleic Acids Res. 2012, 41, e1. [Google Scholar] [CrossRef] [PubMed]
- White, T.J.; Bruns, T.D.; Lee, S.B.; Taylor, J.W.; Innis, M.A.; Gelfand, D.H.; Sninsky, J. Amplification and Direct Sequencing of Fungal Ribosomal RNA Genes for Phylogenetics. In PCR Protocols: A Guide to Methods and Applications; Innis, M.A., Gelfand, D.H., Sninsky, J.J., White, T.J., Eds.; Academic Press: San Diego, CA, USA, 1990; pp. 315–322. [Google Scholar]
- Klee, J.; Tay, W.T.; Paxton, R.J. Specific and sensitive detection of Nosema bombi (Microsporidia: Nosematidae) in bumble bees (Bombus spp.; Hymenoptera: Apidae) by PCR of partial rRNA gene sequences. J. Invertebr. Pathol. 2006, 91, 98–104. [Google Scholar] [CrossRef] [PubMed]
- Yang, B.; Peng, G.; Li, T.; Kadowaki, T. Molecular and phylogenetic characterization of honey bee viruses, Nosemamicrosporidia, protozoan parasites, and parasitic mites in China. Ecol. Evol. 2013, 3, 298–311. [Google Scholar] [CrossRef] [PubMed]
- Meeus, I.; De Graaf, D.; Jans, K.; Smagghe, G. Multiplex PCR detection of slowly-evolving trypanosomatids and neogregarines in bumblebees using broad-range primers. J. Appl. Microbiol. 2009, 109, 107–115. [Google Scholar] [CrossRef] [PubMed] [Green Version]


Publisher’s Note: MDPI stays neutral with regard to jurisdictional claims in published maps and institutional affiliations. |
© 2021 by the authors. Licensee MDPI, Basel, Switzerland. This article is an open access article distributed under the terms and conditions of the Creative Commons Attribution (CC BY) license (http://creativecommons.org/licenses/by/4.0/).
Share and Cite
Ptaszyńska, A.A.; Latoch, P.; Hurd, P.J.; Polaszek, A.; Michalska-Madej, J.; Grochowalski, Ł.; Strapagiel, D.; Gnat, S.; Załuski, D.; Gancarz, M.; et al. Amplicon Sequencing of Variable 16S rRNA from Bacteria and ITS2 Regions from Fungi and Plants, Reveals Honeybee Susceptibility to Diseases Results from Their Forage Availability under Anthropogenic Landscapes. Pathogens 2021, 10, 381. https://doi.org/10.3390/pathogens10030381
Ptaszyńska AA, Latoch P, Hurd PJ, Polaszek A, Michalska-Madej J, Grochowalski Ł, Strapagiel D, Gnat S, Załuski D, Gancarz M, et al. Amplicon Sequencing of Variable 16S rRNA from Bacteria and ITS2 Regions from Fungi and Plants, Reveals Honeybee Susceptibility to Diseases Results from Their Forage Availability under Anthropogenic Landscapes. Pathogens. 2021; 10(3):381. https://doi.org/10.3390/pathogens10030381
Chicago/Turabian StylePtaszyńska, Aneta A., Przemyslaw Latoch, Paul J. Hurd, Andrew Polaszek, Joanna Michalska-Madej, Łukasz Grochowalski, Dominik Strapagiel, Sebastian Gnat, Daniel Załuski, Marek Gancarz, and et al. 2021. "Amplicon Sequencing of Variable 16S rRNA from Bacteria and ITS2 Regions from Fungi and Plants, Reveals Honeybee Susceptibility to Diseases Results from Their Forage Availability under Anthropogenic Landscapes" Pathogens 10, no. 3: 381. https://doi.org/10.3390/pathogens10030381