
High CD169 Monocyte/Lymphocyte Ratio Reflects Immunophenotype Disruption and Oxygen Need in COVID-19 Patients

 ,
,  , , , , , and
Abstract
:
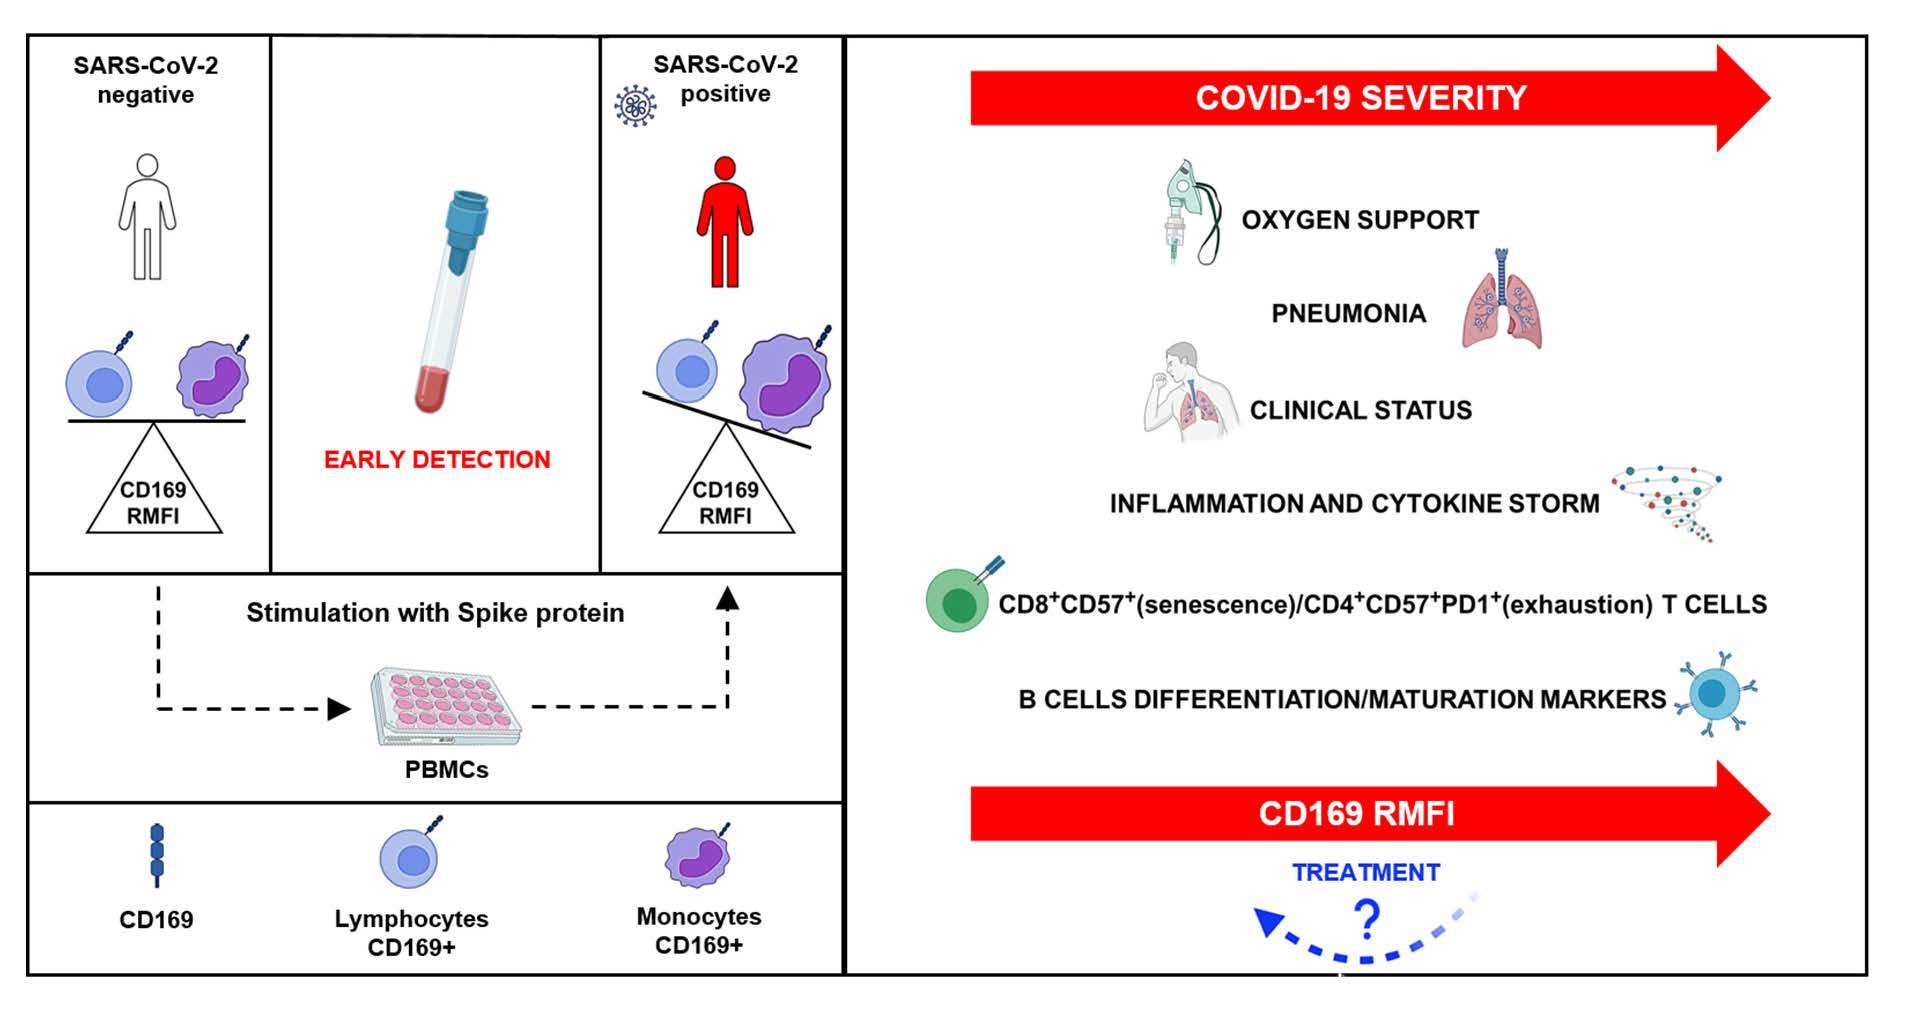
1. Introduction
2. Results
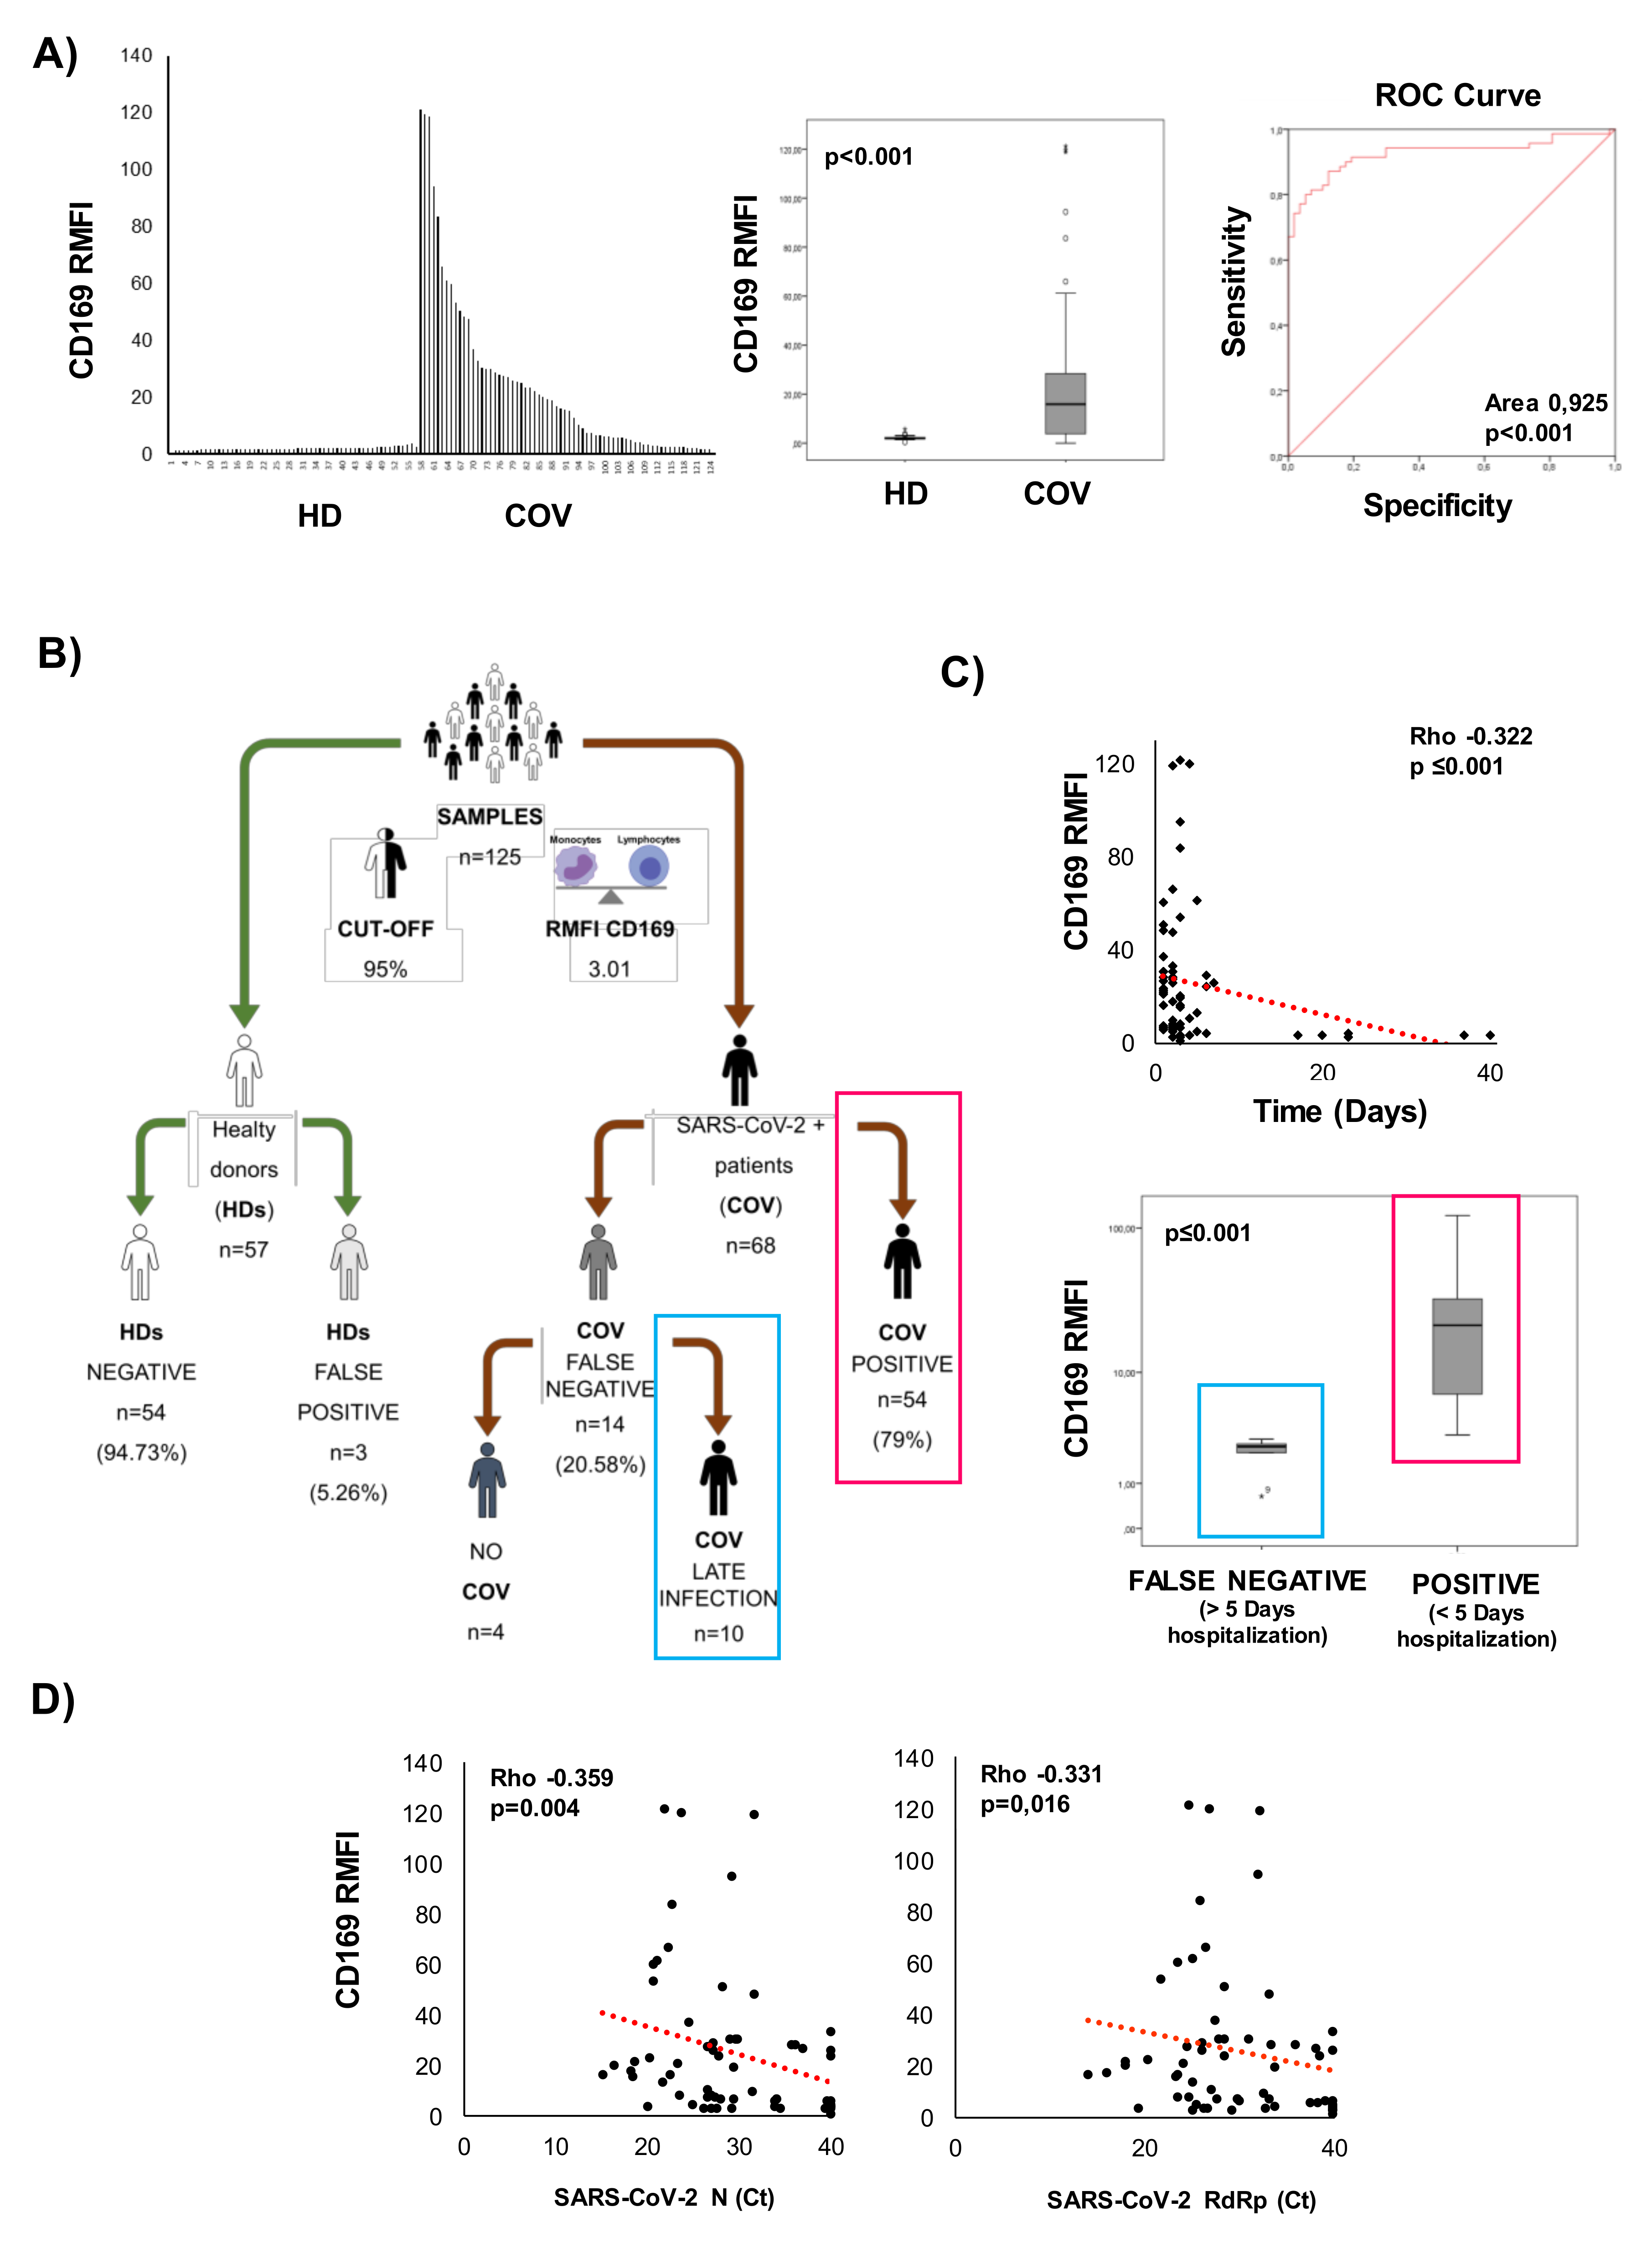
2.1. Flow Cytometry Analysis of CD169 Expression in COVID-19 Patients and Healthy Donors
2.2. Demographics and Clinical Classification of COVID-19 Patients
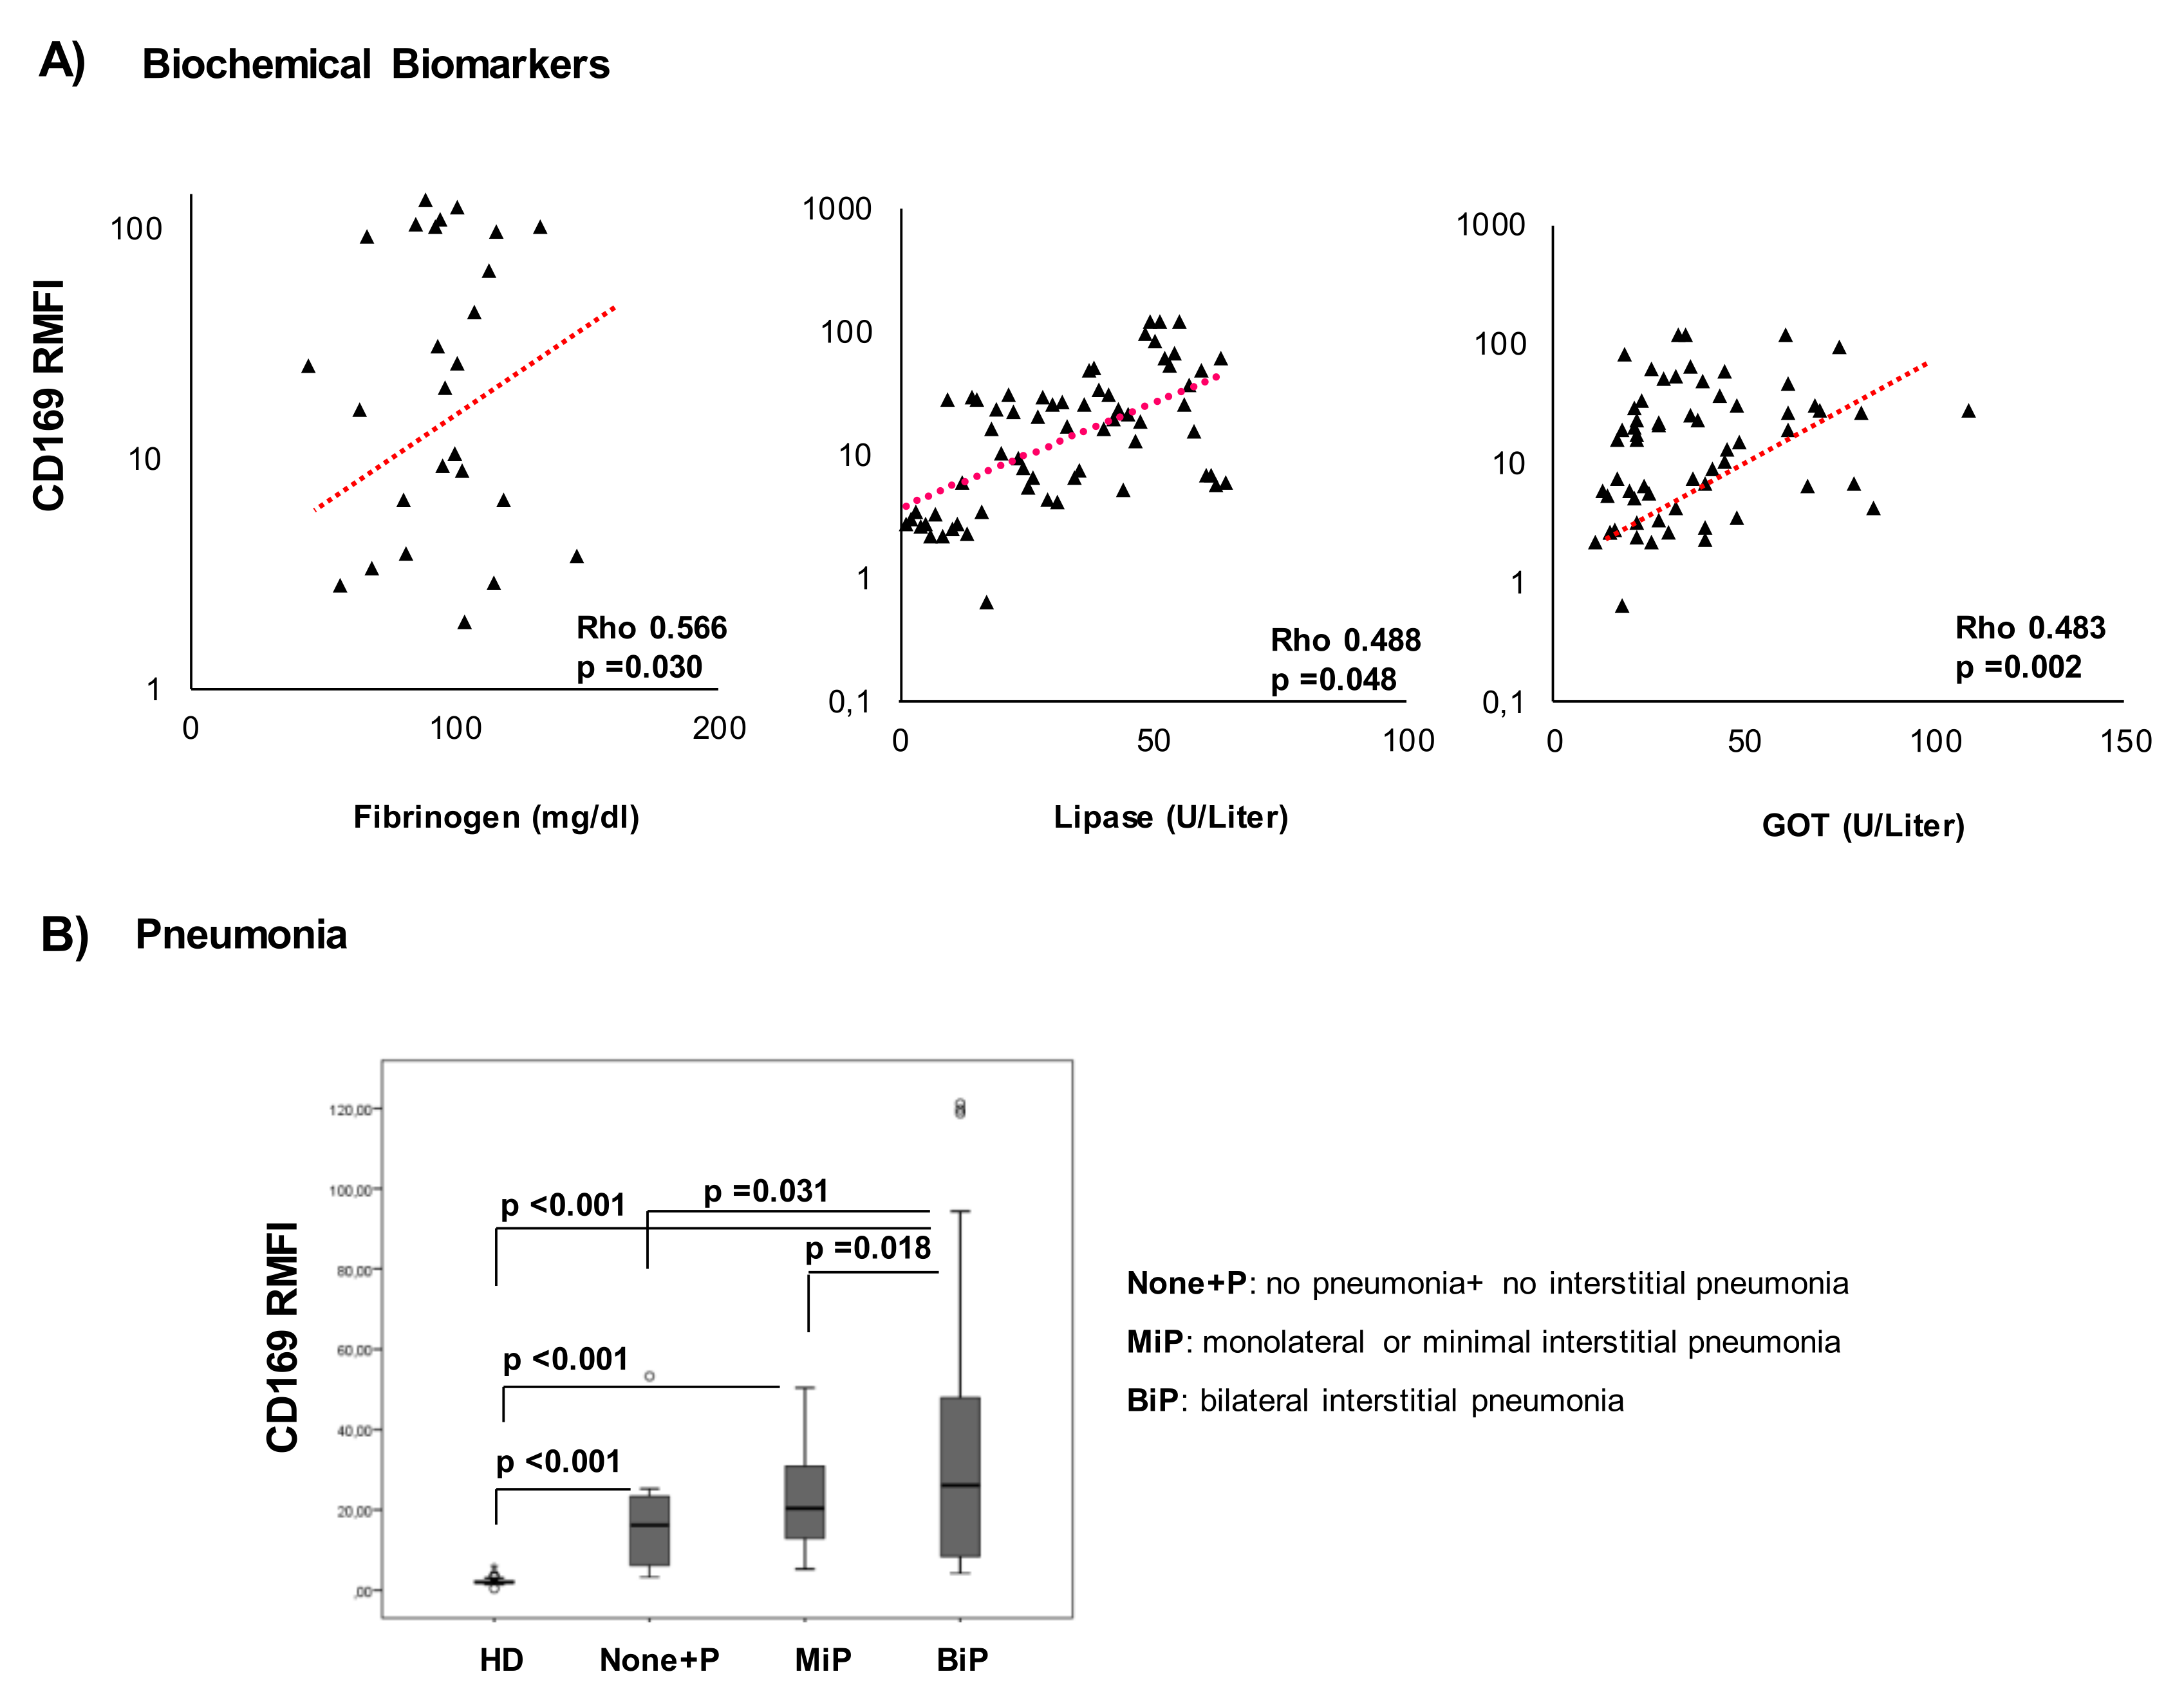
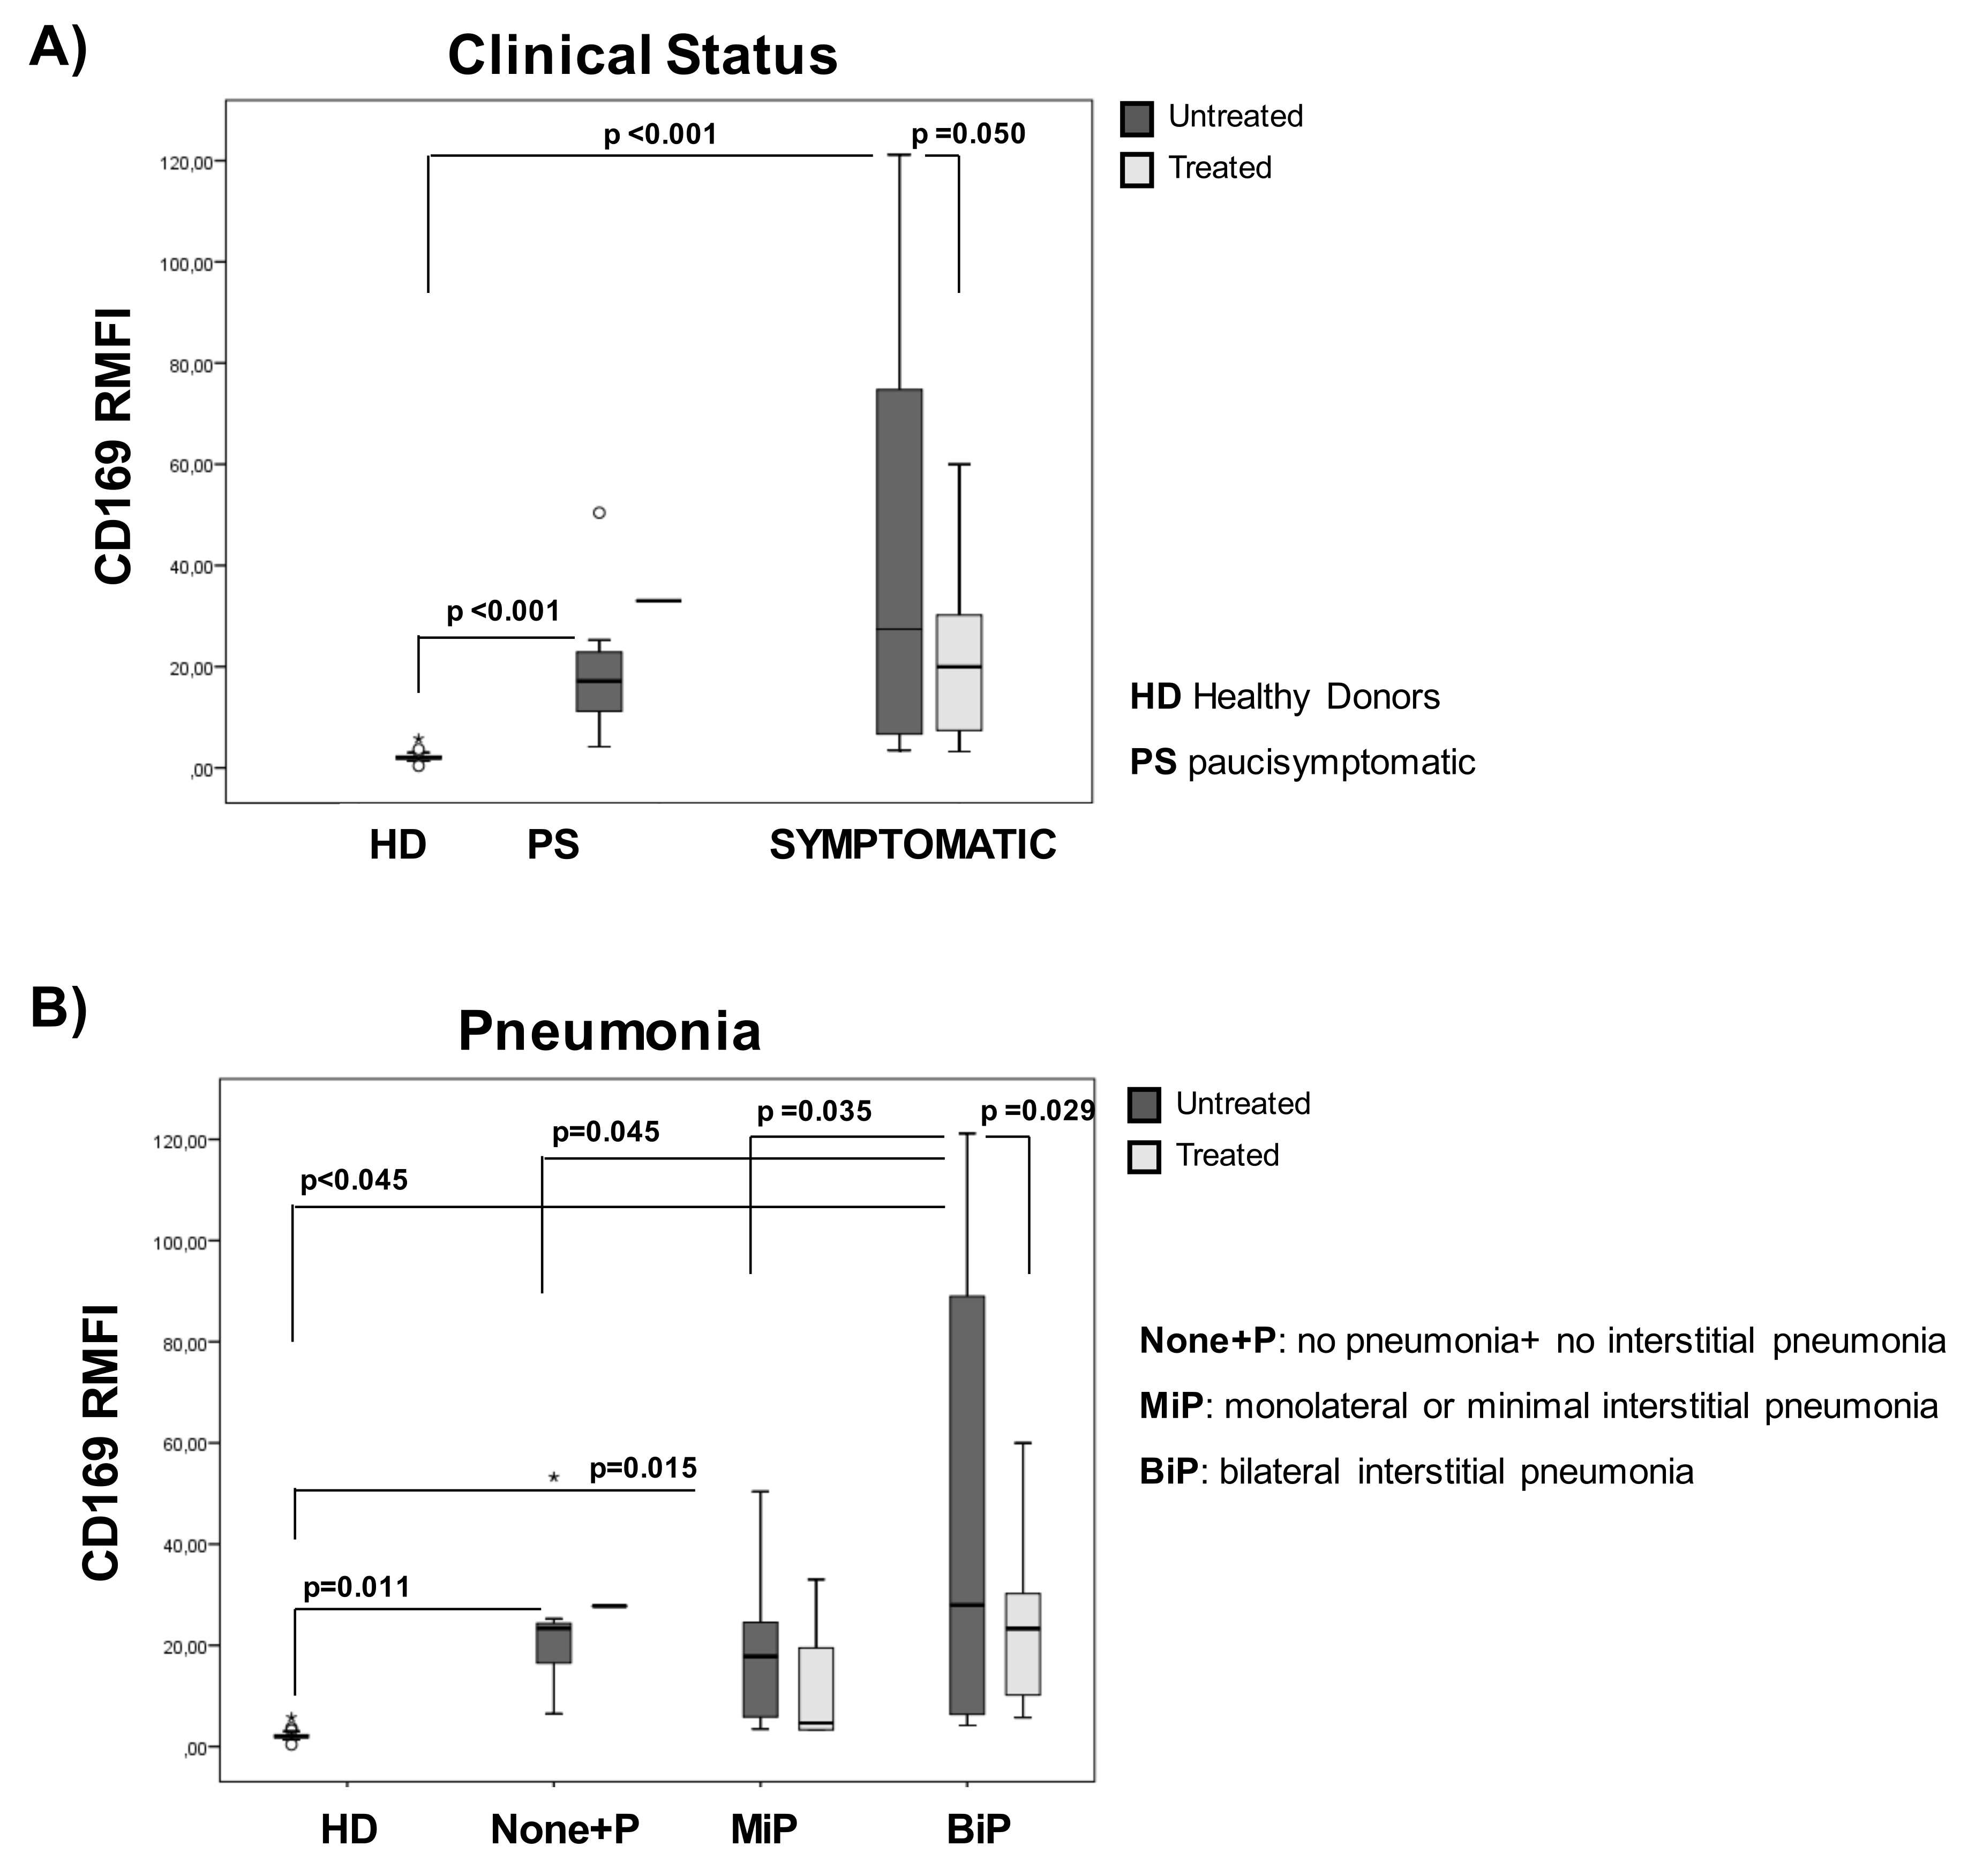
2.3. CD169 RMFI Correlates with Biochemical Parameters of Disease Severity and Is Associated with Pneumonia Statuses of COVID-19 Patients
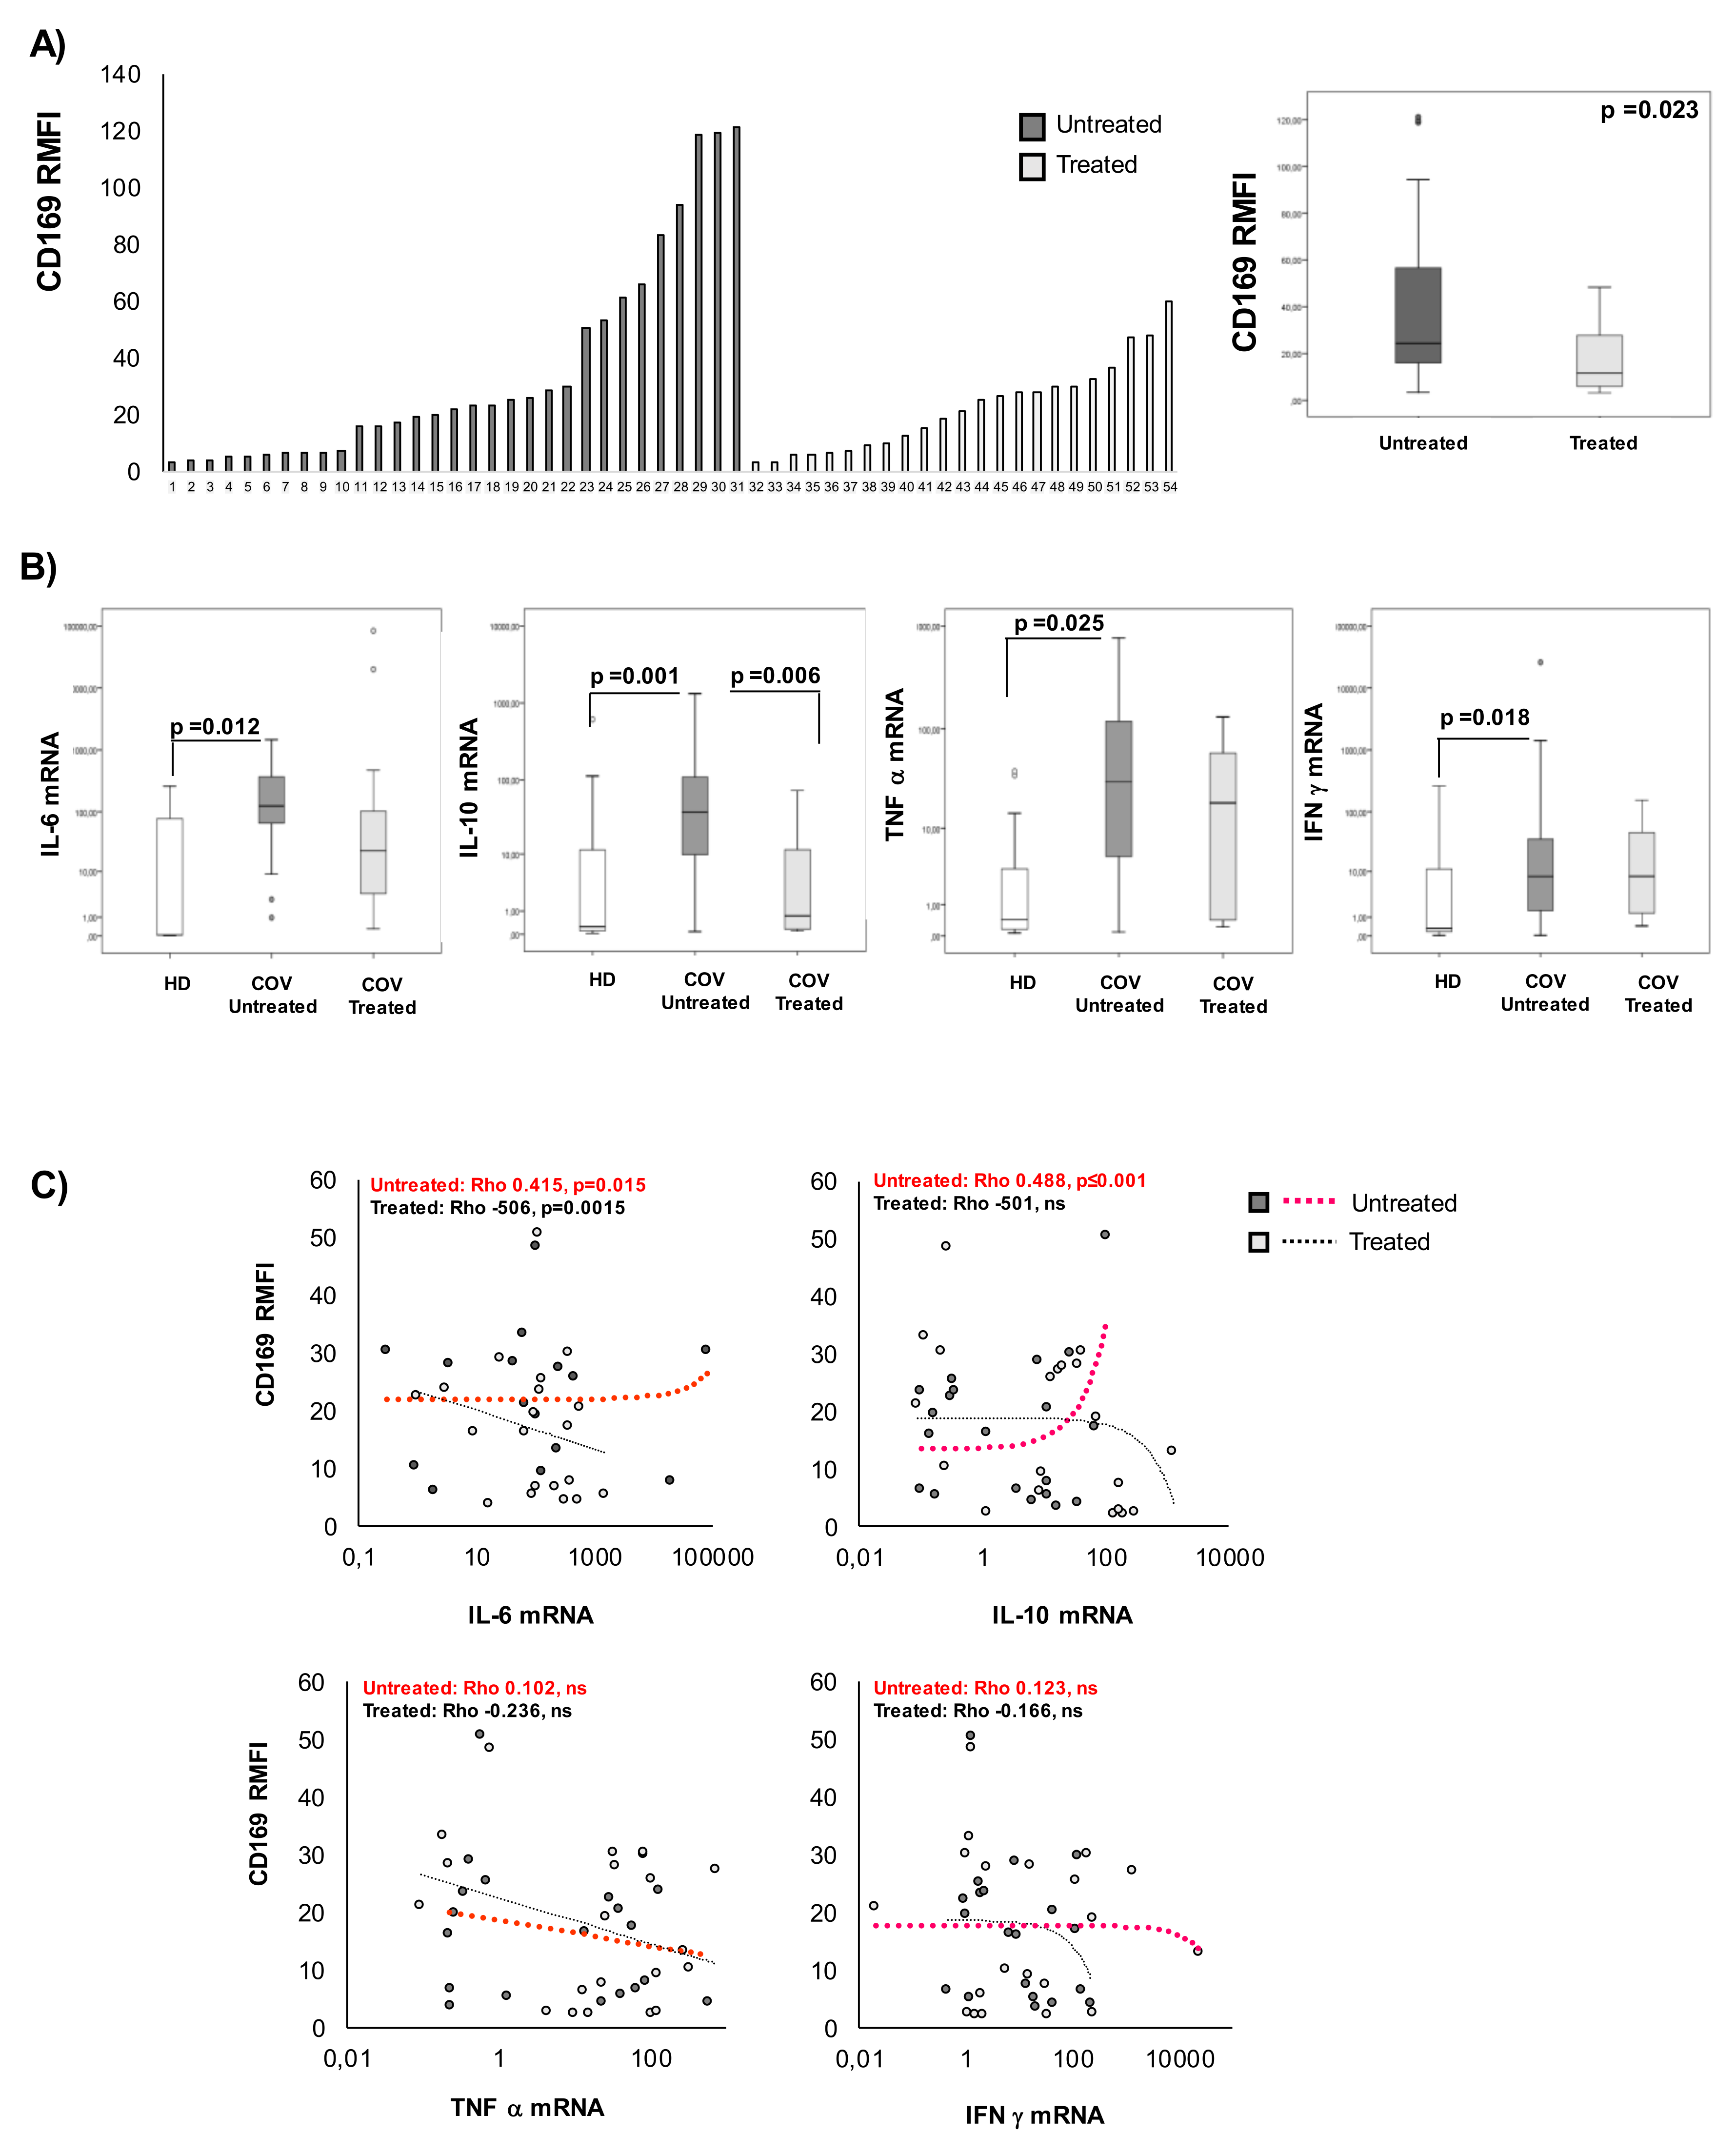
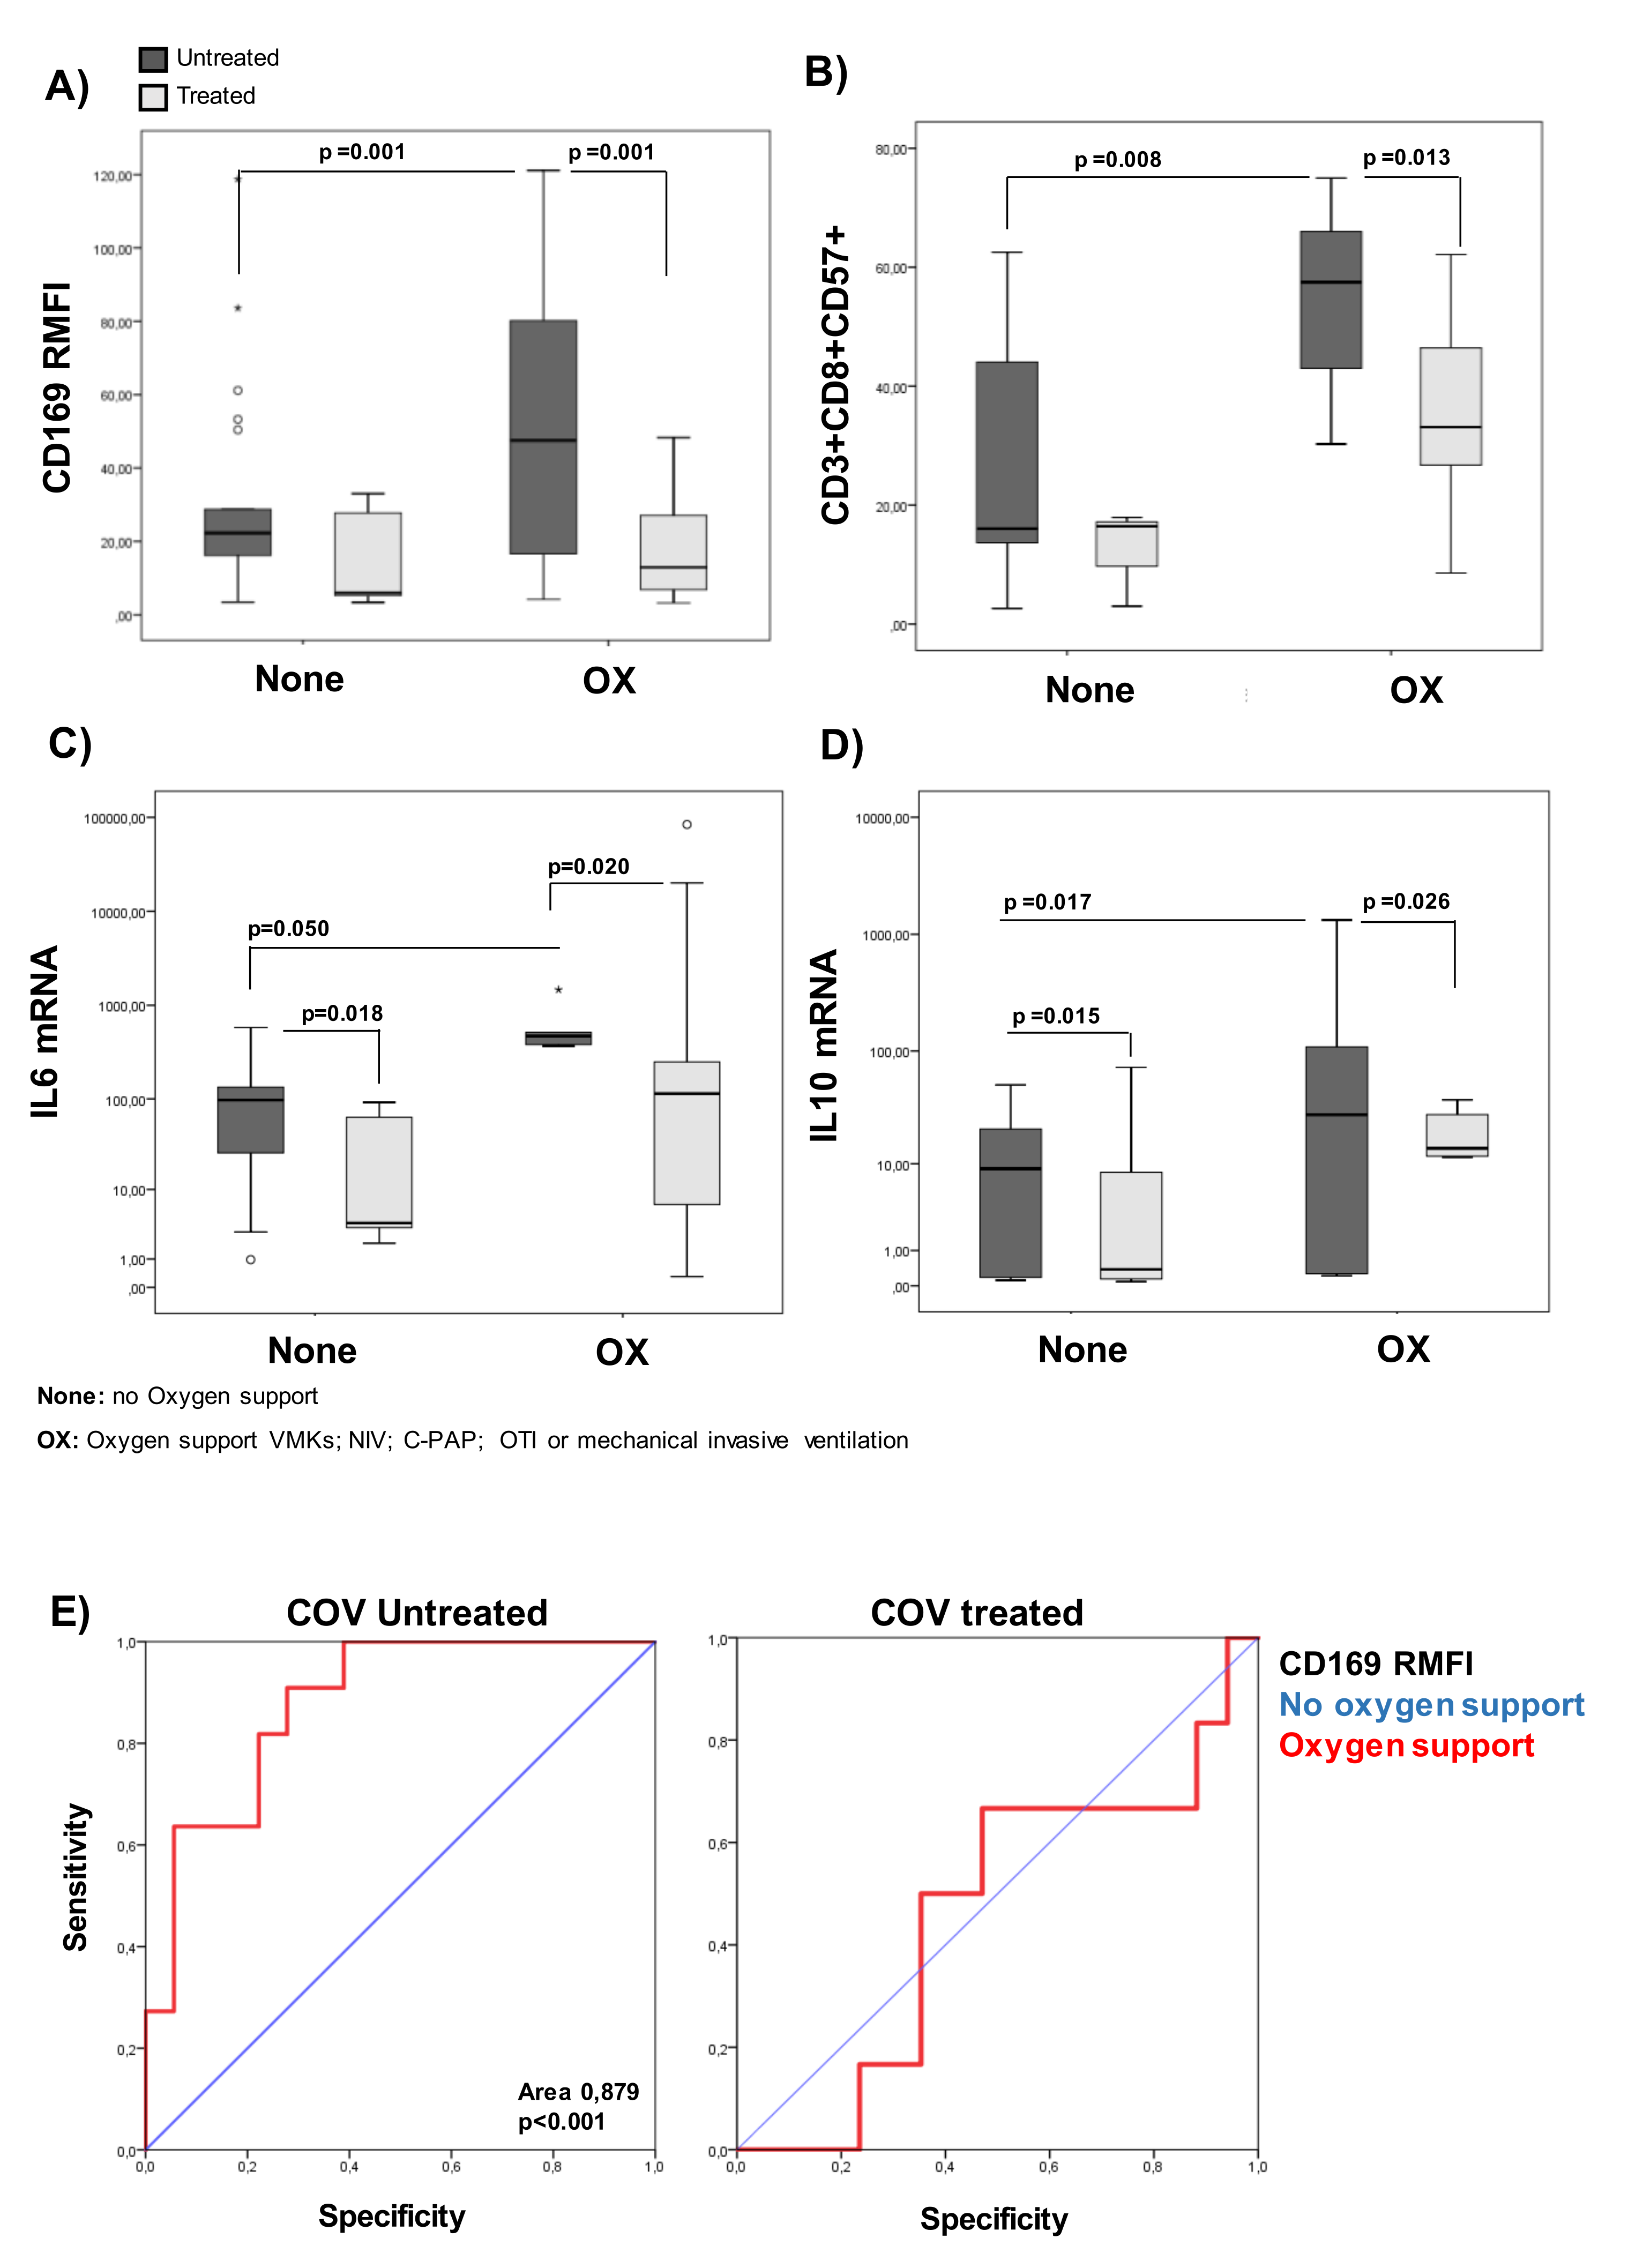
2.4. CD169 RMFI Correlates with the Expression of Pro-Inflammatory Cytokines in COVID-19 Patients and Is Altered by Therapy
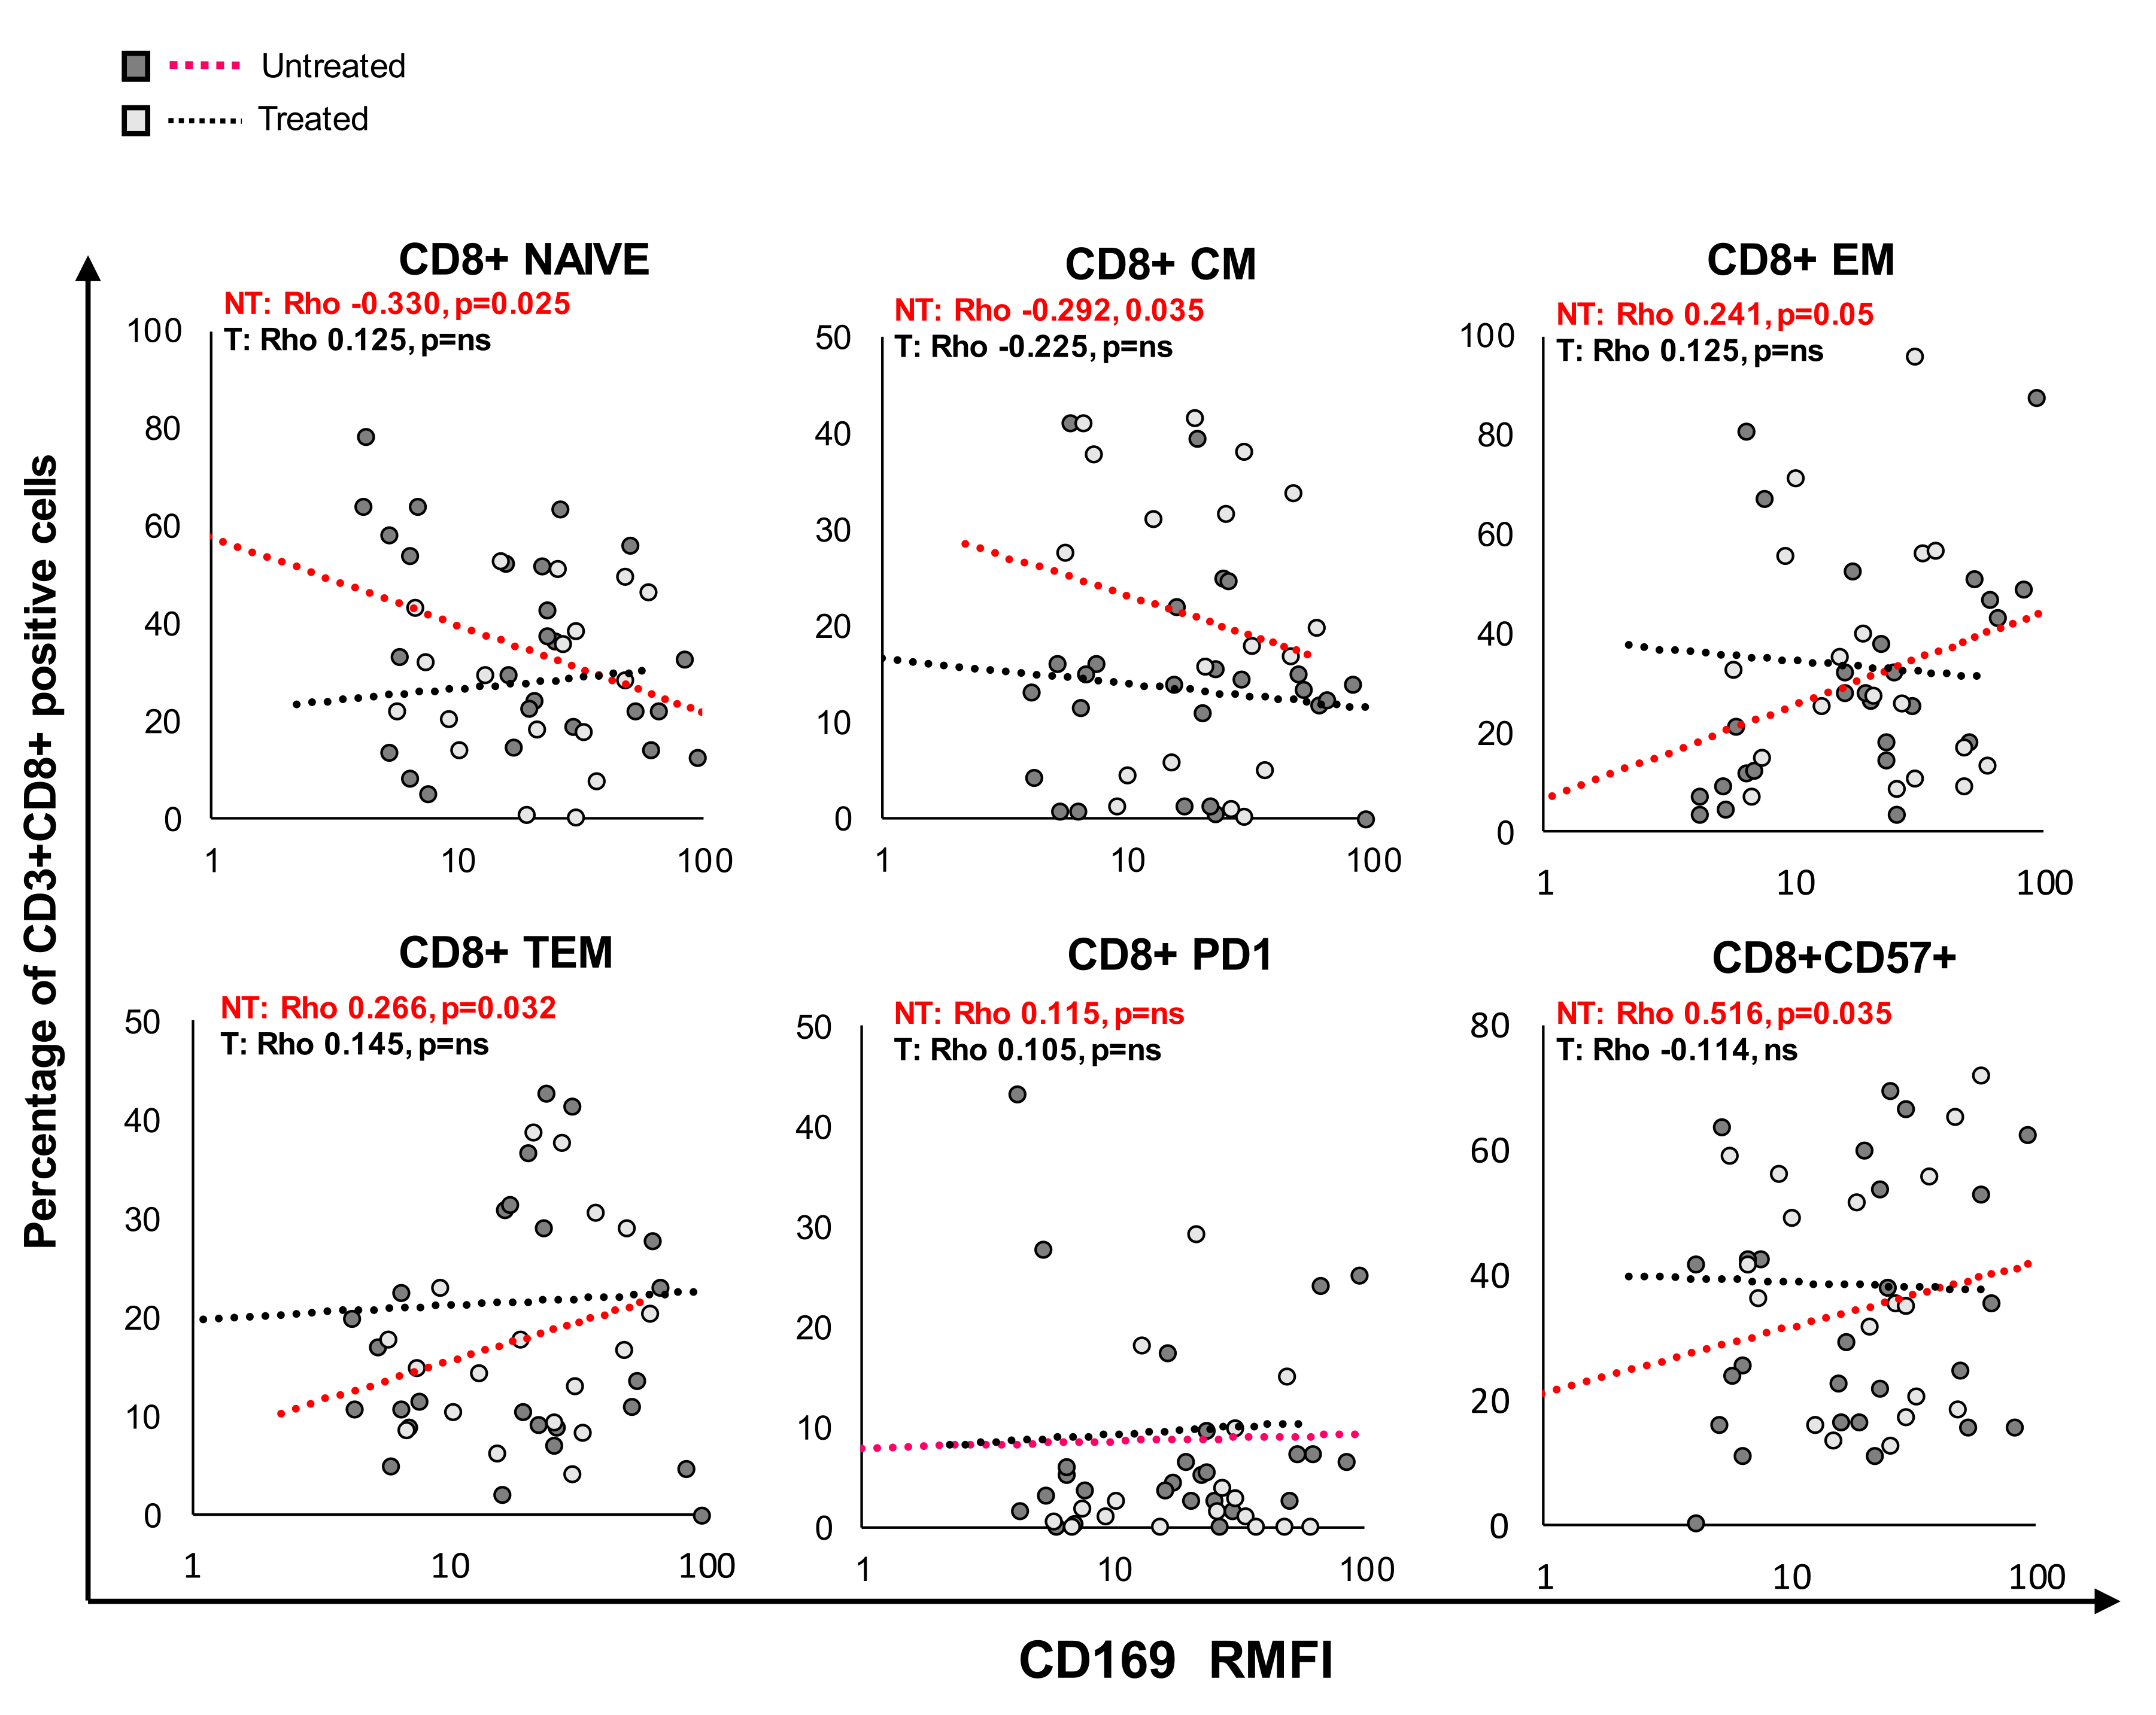
2.5. CD169 RMFI Correlated with the Expression of T-lymphocyte-Differentiation and Senescence/Exhaustion Markers in Untreated and Treated COVID-19 Patients
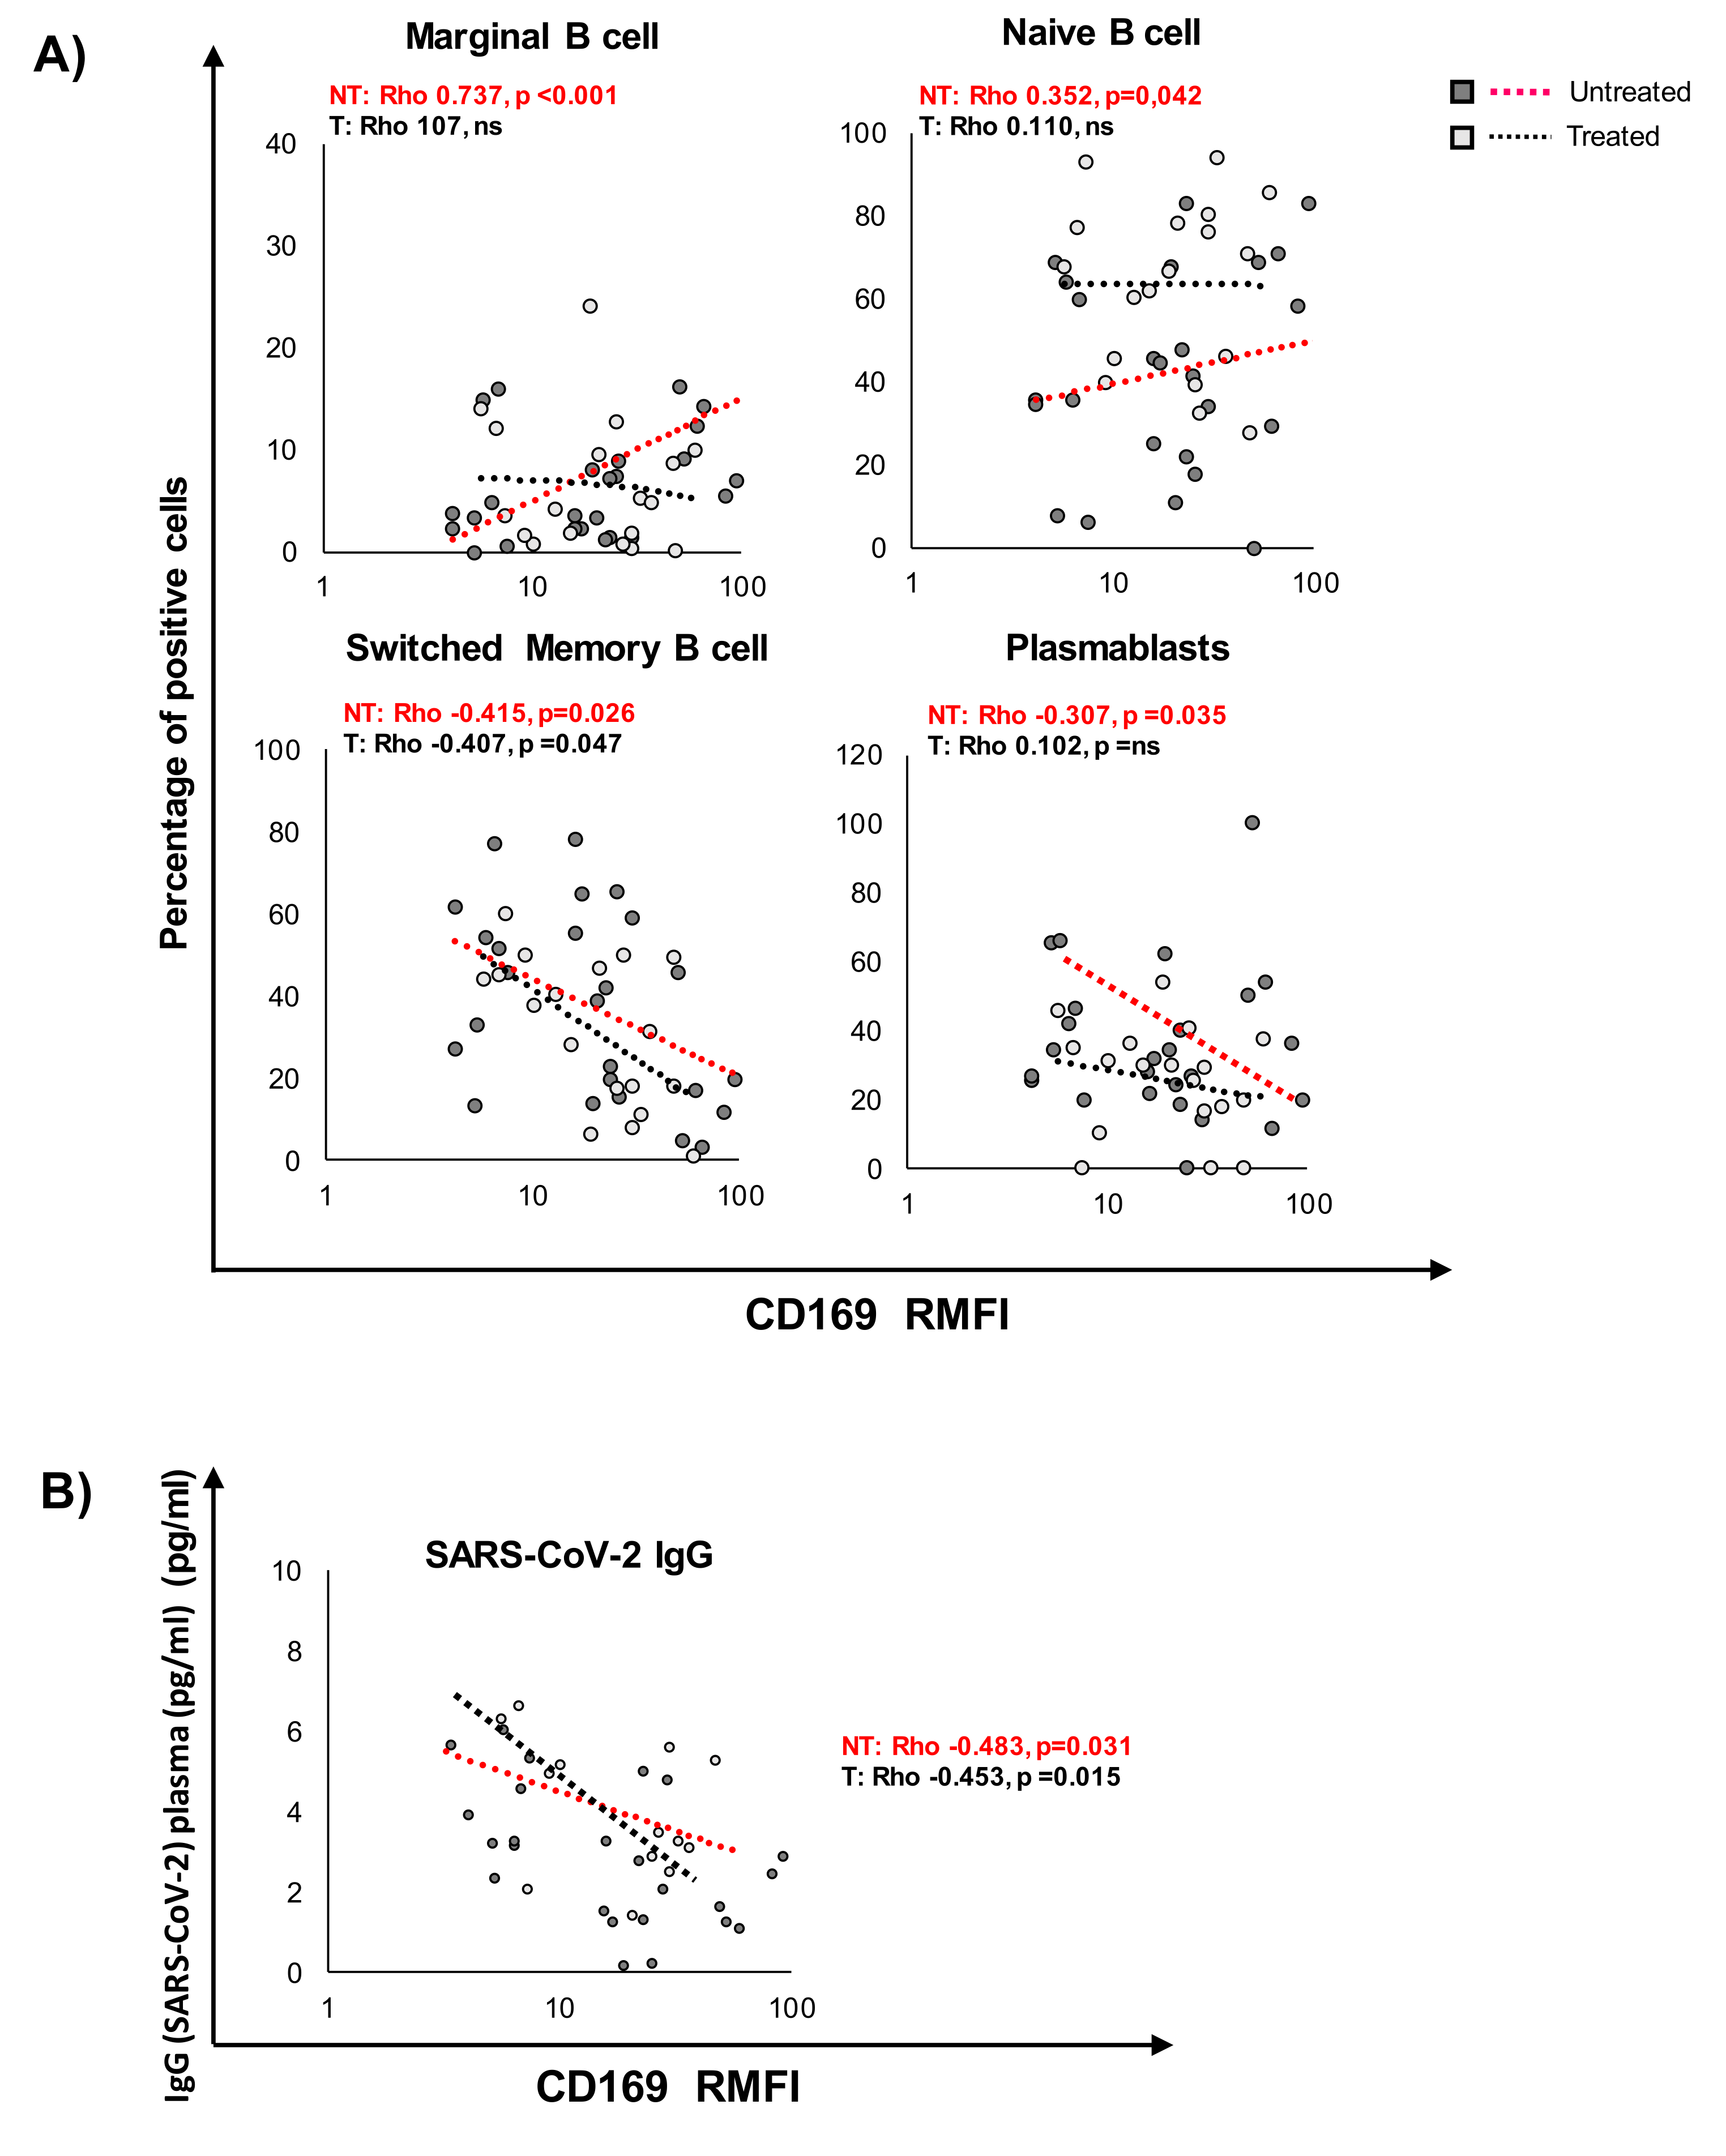
2.6. CD169 RMFI Correlated with the Expression of Differentiation and Maturation Markers in B Cells from COVID-19 Patients
2.7. CD169 RMFI Reflects the Severity Score and Respiratory Outcome of COVID-19 Patients during Hospitalization in Relation to Treatment at Sampling
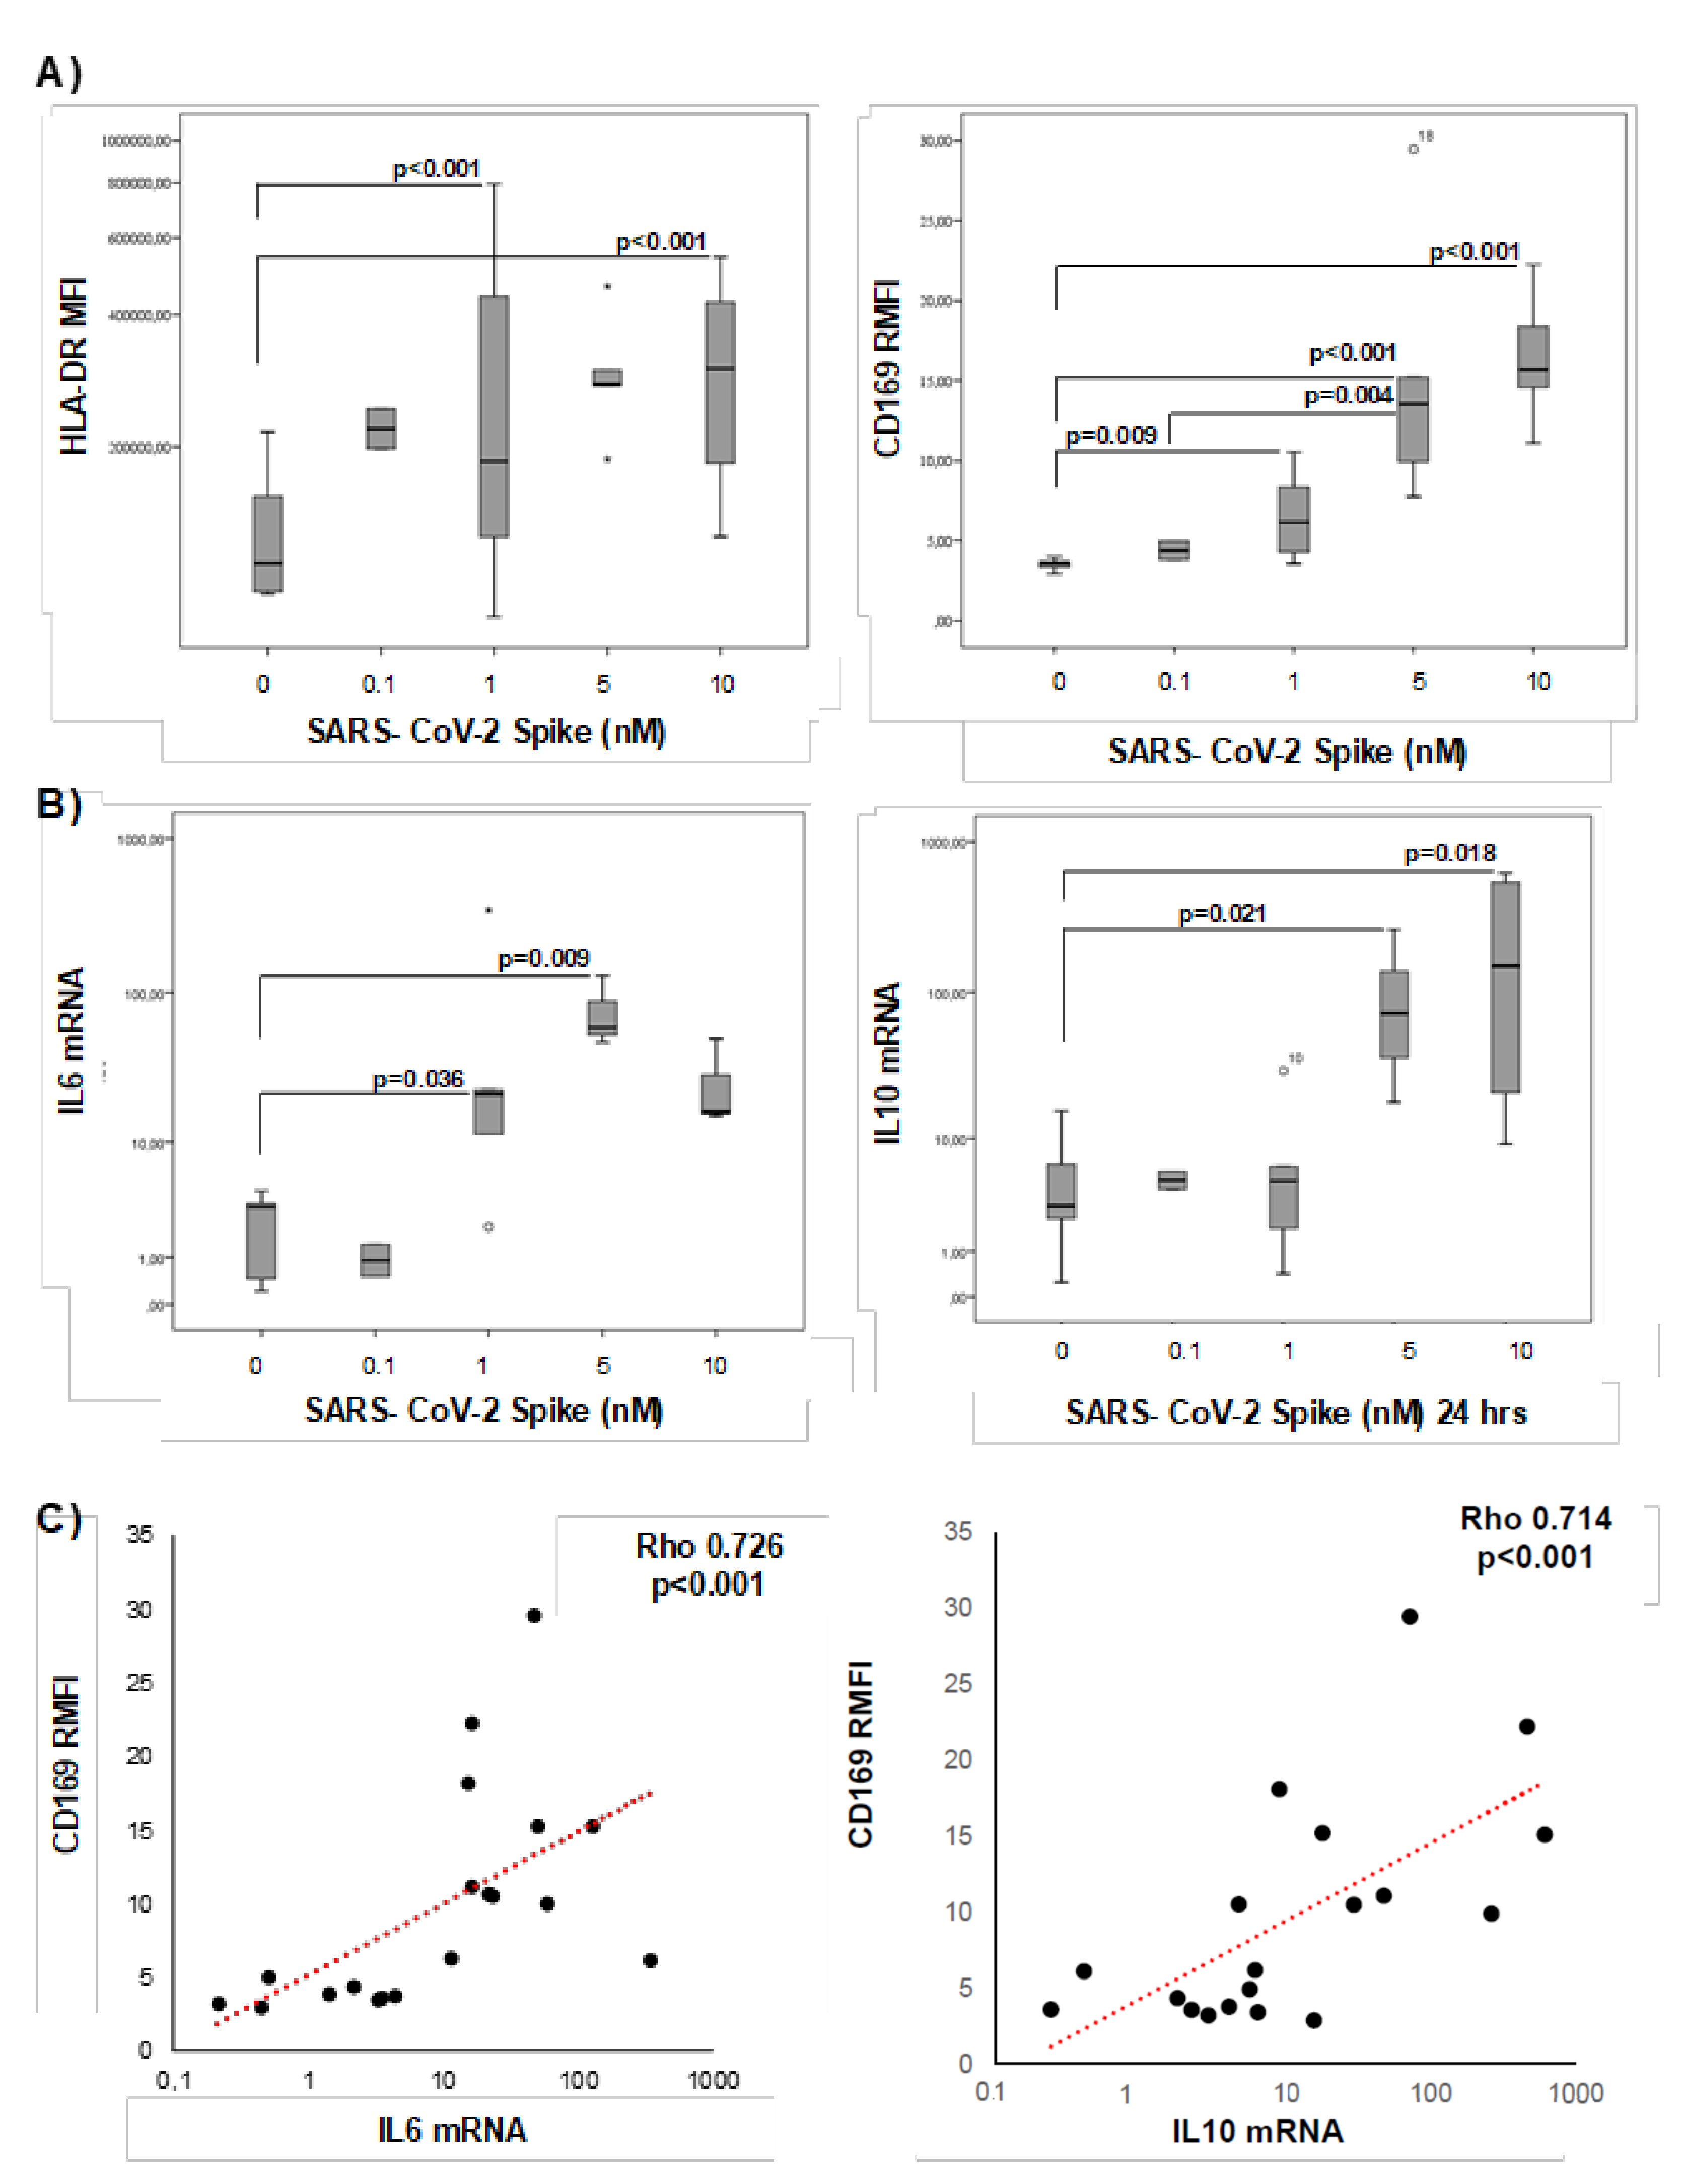
2.8. SARS-CoV-2 Spike Protein Stimulation Enhanced RMFI CD169 in PBMCs from Healthy Donors
3. Discussion
4. Materials and Methods
4.1. Patients and Controls
4.2. In Vitro Stimulation with Spike Protein
4.3. Flow Cytometry for CD169 Expression and Immunophenotyping Analysis
4.4. RNA Extraction from Blood Samples
4.5. Real-Time Quantitative RT-PCR
4.6. Statistical Analysis
Supplementary Materials
Author Contributions
Funding
Institutional Review Board Statement
Informed Consent Statement
Data Availability Statement
Acknowledgments
Conflicts of Interest
References
- Tay, M.Z.; Poh, C.M.; Rénia, L.; MacAry, P.A.; Ng, L.F.P. The trinity of COVID-19: Immunity: Inflammation and intervention. Nat. Rev. Immunol. 2020, 20, 363–374. [Google Scholar] [CrossRef]
- Wadaa-Allah, A.; Emhamed, M.S.; Sadeq, M.A.; Dahman, N.B.H.; Ullah, I.; Farrag, N.S.; Negida, A. Efficacy of the current investigational drugs for the treatment of COVID-19: A scoping review. Ann. Med. 2021, 53, 318–334. [Google Scholar] [CrossRef]
- To, K.K.; Sridhar, S.; Chiu, K.H.; Hung, D.L.; Li, X.; Hung, I.F.; Tam, A.R.; Chung, T.W.; Chan, J.F.; Zhang, A.J.; et al. Lessons learned 1 year after SARS-CoV-2 emergence leading to COVID-19 pandemic. Emerg. Microbes Infect. 2021, 10, 507–535. [Google Scholar] [CrossRef] [PubMed]
- Matteucci, C.; Minutolo, A.; Balestrieri, E.; Petrone, V.; Fanelli, M.; Malagnino, V.; Ianetta, M.; Giovinazzo, A.; Barreca, F.; Di Cesare, S.; et al. Thymosin Alpha 1 Mitigates Cytokine Storm in Blood Cells from Coronavirus Disease 2019 Patients. Open Forum Infect. Dis. 2020, 5, ofaa588. [Google Scholar] [CrossRef] [PubMed]
- Jan, L.Y.; Xia, Y.; Qiu, C.H. Functions of CD169 positive macrophages in human diseases. Biomed. Rep. 2021, 14, 26. [Google Scholar]
- Klaas, M.; Crocker, P.R. Sialoadhesin in recognition of self and non-self. Semin. Immunopathol. 2012, 34, 353–364. [Google Scholar] [CrossRef] [PubMed]
- Bourgoin, P.; Biéchelé, G.; Ait Belkacem, I.; Morange, P.E.; Malergue., F. Role of the interferons in CD64 and CD169 expressions in whole blood: Relevance in the balance between viral- or bacterial-oriented immune responses. Immun. Inflamm. Dis 2020, 8, 106–123. [Google Scholar] [CrossRef] [PubMed] [Green Version]
- Xu, H.C.; Huang, J.; Khairnar, V.; Duhan, V.; Pandyra, A.A.; Grusdat, M.; Shinde, P.; Mcllwain, D.R.; Maney, S.K.; Gommerman, J.; et al. Deficiency of the B cell-activating factor receptor results in limited CD169+ macrophage function during viral infection. J. Virol. 2015, 89, 4748–4759. [Google Scholar] [CrossRef] [Green Version]
- Pino, M.; Erkizia, I.; Benet, S.; Erikson, E.; Fernández-Figueras, M.T.; Guerrero, D.; Dalmau, J.; Ouchi, D.; Rausell, A.; Ciuffi, A.; et al. HIV-1 immune activation induces Siglec-1 expression and enhances viral trans-infection in blood and tissue myeloid cells. Retrovirology 2015, 12, 37. [Google Scholar] [CrossRef] [PubMed] [Green Version]
- Rempel, H.; Calosing, C.; Sun, B.; Pulliam, L. Sialoadhesin expressed on IFN-induced monocytes binds HIV-1 and enhances infectivity. PLoS ONE 2008, 3, e1967. [Google Scholar] [CrossRef]
- Perez-Zsolt, D.; Erkizia, I.; Pino, M.; García-Gallo, M.; Martin, M.T.; Benet, S.; Chojnacki, J.; Fernàndez-Figueras, M.T.; Guerrero, D.; Urrea, V.; et al. Anti-Siglec-1 antibodies block Ebola viral uptake and decrease cytoplasmic viral entry. Nat. Microbiol. 2019, 4, 1558–1570. [Google Scholar] [CrossRef] [PubMed]
- Feng, Z.; Diao, B.; Wang, R.; Wang, G.; Wang, C.; Tan, Y.; Liu, L.; Wang, C.; Liu, Y.; Liu, Y.; et al. The Novel Severe Acute Respiratory Syndrome Coronavirus 2 (SARS-CoV-2) Directly Decimates Human Spleens and Lymph Nodes. medRxiv 2020. [Google Scholar] [CrossRef]
- Ortillon, M.; Coudereau, R.; Cour, M.; Rimmelè, T.; Godignon, M.; Gossez, M.; Yonis, H.; Argaud, L.; Lukaszewicz, A.C.; Venet, F.; et al. Monocyte CD169 expression in COVID-19 patients upon intensive care unit admission. Cytometry A. 2021, 99, 466–471. [Google Scholar] [CrossRef] [PubMed]
- Bedin, A.S.; Makinson, A.; Picot, M.C.; Mennechet, F.; Melergue, F.; Pisoni, A.; Nyiramigisha, E.; Montagnier, L.; Bollore, K.; Debiesse, S.; et al. Monocyte CD169 Expression as a Biomarker in the Early Diagnosis of Coronavirus Disease 2019. J. Infect. Dis. 2021, 223, 562–567. [Google Scholar] [CrossRef] [PubMed]
- Bourgoin, P.; Soliveres, T.; Barbaresi, A.; Londou, A.; Ait Belkacem, I.; Arnoux, I.; Bernot, D.; Loosveld, M.; Morange, P.E.; Michelet, P.; et al. CD169 and CD64 could help differentiate bacterial from COVID-19 or other viral infections in the Emergency Department. Cytometry A. 2021, 99, 435–445. [Google Scholar] [CrossRef]
- Comins-Boo, A.; Gutiérrez-Larrañaga, M.; Roa-Bautista, A.; Guiral Foz, S.; Renuncio García, M.; González López, E.; JIrure Ventura, J.; Fariñas-Álvarez, M.C.; San Segundo, D.; López Hoyos, M. Validation of a Quick Flow Cytometry-Based Assay for Acute Infection Based on CD64 and CD169 Expression. New Tools for Early Diagnosis in COVID-19 Pandemic. Front Med. 2021. [Google Scholar] [CrossRef] [PubMed]
- Frederico, B.; Chao, B.; Lawler, C.; May, J.S.; Stevenson., P.G. Subcapsular sinus macrophages limit acute gammaherpesvirus dissemination. J. Gen. Virol. 2015, 96, 2314–2327. [Google Scholar] [CrossRef] [Green Version]
- McKechnie, J.L.; Blish, C.A. The Innate Immune System: Fighting on the Front Lines or Fanning the Flames of COVID-19? Cell Host Microbe. 2020, 27, 863–869. [Google Scholar] [CrossRef]
- Merad, M.; Martin., J.C. Pathological inflammation in patients with COVID-19: A key role for monocytes and macrophages. Nat. Rev. Immunol. 2020, 20, 355–362. [Google Scholar] [CrossRef]
- Vabret, N.; Britton, G.J.; Gruber, C.; Hegde, S.; Kim, J.; Kuksin, M.; Levantovsky, R.; Malle, L.; Moreira, A.; Park, M.D.; et al. Immunology of COVID-19: Current State of Science. Immunity 2020, 52, 910–941. [Google Scholar] [CrossRef]
- Chevrier, S.; Zurbuchen, Y.; Cervia, C.; Adamo, S.; Raeber, M.E.; de Souza, N.; Sivapatham, S.; Jacobs, A.; Bachli, E.; Rudiger, A.; et al. A distinct innate immune signature marks progression from mild to severe COVID-19. Cell. Rep. Med. 2020, 2, 100166. [Google Scholar] [CrossRef]
- Martineza, F.O.; Combes, T.W.; Orsenigo, F.; Gordon., S. Monocyte activation in systemic COVID-19 infection: Assay and rationale. EBioMedicine 2020, 59, 102964. [Google Scholar] [CrossRef] [PubMed]
- Di Micco, P.; Russo, V.; Carannante, N.; Imparato, M.; Cardillo, G.; Lodigiani, C. Prognostic Value of Fibrinogen among COVID-19 Patients Admitted to an Emergency Department: An Italian Cohort Study. J. Clin. Med. 2020, 9, 4134. [Google Scholar] [CrossRef] [PubMed]
- Barlass, U.; Wiliams, B.; Dhana, K.; Adnan, D.; Shahab, R.K.; Mahdavinia, M.; Bishehsari., F. Marked Elevation of Lipase in COVID-19 Disease: A Cohort Study. Clin. Transl. Gastroenterol. 2020, 11, e00215. [Google Scholar] [CrossRef] [PubMed]
- Kulkarni, A.V.; Kumar, P.; Tevethia, H.V.; Premkumar, M.; Arab, J.P.; Candia, R.; Talukdar, R.; Sharma, M.; Qu, X.; Rao, P.N.; et al. Systematic review with meta-analysis: Liver manifestations and outcomes in COVID-19. Aliment. Pharmacol. Ther. 2020, 52, 584–599. [Google Scholar] [CrossRef] [PubMed]
- Ji, P.; Zhu, J.; Zhong, Z.; Li, H.; Pang, J.; Li, B.; Zhang, J. Association of elevated inflammatory markers and severe COVID-19: A meta-analysis. Medicine 2020, 99, e23315. [Google Scholar] [CrossRef] [PubMed]
- Han, H.; Ma, Q.; Li, C.; Liu, R.; Zhao, L.; Wang, W.; Zhang, P.; Liu, X.; Gao, G.; Liu, F.; et al. Profiling serum cytokines in COVID-19 patients reveals IL-6 and IL-10 are disease severity predictors. Emerg. Microbes Infect. 2020, 9, 1123–1130. [Google Scholar] [CrossRef]
- Wang, W.; Ye, L.; Ye, L.; Li, B.; Gao, B.; Zeng, Y.; Kong, L.; Fang, X.; Zheng, H.; Wu, Z.; et al. Up-regulation of IL-6 and TNF-alpha induced by SARS-coronavirus Spike protein in murine macrophages via NF-kappaB pathway. Virus Res. 2007, 128, 1–8. [Google Scholar] [CrossRef] [PubMed]
- Shah, V.K.; Firmal, P.; Alam, A.; Ganguly, D.; Chattopadhyay., S. Overview of Immune Response during SARS-CoV-2 Infection: Lessons from the Past. Front. Immunol. 2020, 11, 1949. [Google Scholar] [CrossRef]
- Chen, Z.; Wherry., E.J. T cell responses in patients with COVID-19. Nat. Rev. Immunol. 2020, 20, 529–536. [Google Scholar] [CrossRef] [PubMed]
- De Candia, P.; Prattichizzo, F.; Garavelli, S.; Matarese, G. T Cells: Warriors of SARS-CoV-2 Infection. Trends Immunol. 2021, 42, 18–30. [Google Scholar] [CrossRef]
- Sami, R.; Fathi, F.; Eskandari, N.; Ahmadi, M.; Aref Nezhad, R.; Motedayyen, H. Characterizing the immune responses of those who survived or succumbed to COVID-19: Can immunological signatures predict outcome? Cytokine 2021, 140, 155439. [Google Scholar] [CrossRef] [PubMed]
- Ohnishi, K.; Yamaguchi, M.; Erdenebaatar, C.; Saito, F.; Tashiro, H.; Katabuchi, H.; Takeya, M.; Komohara, Y. Prognostic significance of CD169-positive lymph node sinus macrophages in patients with endometrial carcinoma. Cancer Sci. 2016, 107, 846–852. [Google Scholar] [CrossRef]
- Focosi, D.; Bestagno, M.; Burrone, O.; Petrini, M. CD57+ T lymphocytes and functional immune deficiency. J. Leukoc. Biol. 2010, 87, 107–116. [Google Scholar] [CrossRef] [PubMed]
- Pinti, M.; Appay, V.; Campisi, J.; Frasca, D.; Fülöp, T.; Sauce, D.; Larbi, A.; Weinberger, B.; Cossarizza, A. Aging of the immune system: Focus on inflammation and vaccination. Eur. J. Immunol. 2016, 46, 2286–2301. [Google Scholar] [CrossRef]
- Balestrieri, E.; Minutolo, A.; Petrone, V.; Fanelli, M.; Iannetta, M.; Malagnino, V.; Zordan, M.; Vitale, P.; Charvet, B.; Horvat, B.; et al. Evidence of the pathogenic HERV-W envelope expression in T lymphocytes in association with the respiratory outcome of COVID-19 patients. EbioMedicine. 2021, 66, 103341. [Google Scholar] [CrossRef]
- Chamoto, K.; Al-Habsi, M.; Honjo, T. Role of PD-1 in immunity and diseases. Curr. Top. Microbiol. Immunol. 2017, 410, 75–97. [Google Scholar] [PubMed]
- De Biasi, S.; Lo Tartaro, D.; Meschiari, M.; Gibellini, L.; Bellinazzi, C.; Borella, R.; Fidanza, L.; Mattioli, M.; Paolini, A.; Gozzi, L.; et al. Expansion of plasmablasts and loss of memory B cells in peripheral blood from COVID-19 patients with pneumonia. Eur. J. Immunol. 2020, 50, 1283–1294. [Google Scholar] [CrossRef]
- Sosa-Hernández, V.A.; Torres-Ruìz, J.; Cervantes-Dìaz, R.; Romero-Ramìrez, S.; Pàeaz-Franco, J.C.; Meza-Sànchez, D.E.; Juàrez-Vega, G.; Pèrez-Fragoso, A.; Ortiz-Navarrete, V.; Ponce-de-Leon, A.; et al. B Cell Subsets as Severity-Associated Signatures in COVID-19 Patients. Front. Immunol. 2020, 11, 611004. [Google Scholar] [CrossRef]
- Perez-Zsolt, D.; Muñoz-Basagoiti, J.; Rodon, J.; Elosua-Bayes, M.; Raïch-Regué, D.; Risco, C.; Sachse, M.; Pino, M.; Gumber, S.; Paiardini, M.; et al. SARS-CoV-2 interaction with Siglec-1 mediates trans-infection by dendritic cells. Cell Mol. Immunol. 2021, 18, 2676–2678. [Google Scholar] [CrossRef]
- Bogie, J.F.; Boelen, E.; Louagie, E.; Delputte, P.; Elewaut, D.; van Horssen, J.; Hendriks, J.J.; Hellings, N. CD169 is a marker for highly pathogenic phagocytes in multiple sclerosis. Mult. Scler. 2018, 24, 290–300. [Google Scholar] [CrossRef]
- Von Stuckrad, S.L.; Klotsche, J.; Biesen, R.; Lieber, M.; Thumfart, J.; Meisel, C.; Unterwalder, N.; Kallinich, T. SIGLEC1 (CD169) is a sensitive biomarker for the deterioration of the clinical course in childhood systemic lupus erythematosus. Lupus 2020, 29, 1914–1925. [Google Scholar] [CrossRef]
- Kuznik, A.; Bencina, M.; Svajger, U.; Jeras, M.; Rozman, B.; Jerala, R. Mechanism of endosomal TLR inhibition by antimalarial drugs and imidazoquinolines. J. Immunol. 2011, 186, 4794–4804. [Google Scholar] [CrossRef] [PubMed] [Green Version]
- Doehn, J.M.; Tabeling, C.; Biesen, R.; Saccomanno, J.; Madlung, E.; Pappe, E.; Gabriel, F.; Kurth, F.; Meisel, C.; Corman, V.M.; et al. CD169/SIGLEC1 is expressed on circulating monocytes in COVID-19 and expression levels are associated with disease severity. Infection 2021, 6, 1–6. [Google Scholar] [CrossRef]


| COV | HD | ||||||
|---|---|---|---|---|---|---|---|
| CD169 MFI Lymphocytes | CD169 MFI Monocytes | CD169 Ratio | CD169 MFI Lymphocytes | CD169 MFI Monocytes | CD169 Ratio | ||
| N | 64 | 64 | 64 | 57 | 57 | 57 | |
| Median | 3261.85 | * 44,190.10 | *** 16.65 | 3037.90 | 4353.80 | 2.01 | |
| IQR | 25 | 2043.83 | 18,005.93 | 5.28 | 2559.60 | 1567.80 | 1.76 |
| 50 | 3261.85 | 44,190.10 | 16.65 | 3037.90 | 4353.80 | 2.01 | |
| 75 | 5185.43 | 89,203.18 | 30.12 | 4498.90 | 5222.00 | 2.30 | |
| (a) Demographics, clinical status at enrollment and treatment | ||||
| Paucisymptomatic * | Symptomatic ** | Total | ||
| Number | 19 | 35 | 54 | |
| Age (Mean ± SD) | 59 ± 13 | 61 ± 17 | 60 ± 15 | |
| Sex (M/F) | 12/7 | 29/6 | 41/13 | |
| Hospitalization (Days) + | 3.5 ± 2 | 6 ± 10 | 4.54 ± 7.54 | |
| Pneumonia | None *** | 5 | 7 | 12 |
| P | 5 | 11 | 16 | |
| MiP | 6 | 0 | 6 | |
| BiP | 6 | 17 | 23 | |
| Comorbidities | None | 5 | 4 | 10 |
| Obesity | 2 | 6 | 8 | |
| Diabetes | 3 | 6 | 9 | |
| Cardiovascular | 10 | 9 | 19 | |
| Others **** | 9 | 6 | 15 | |
| Mortality | 0 | 6 | 6 | |
| No treatment | 14 | 17 | 31 | |
| Treatment (Antiviral and Corticosteroid) | 2 | 18 | 23 | |
| (b) Hematology (1) and biochemistry (2) at enrollment, and respiratory outcomes (3) | ||||
| (1) Hematology | Paucisymptomatic | Symptomatic | ||
| Red blood cells (4.40-6.00) 106 /µL | 4.32 ± 0.07 | 4.76 ± 0.43 | ||
| Hemoglobin (13.00–18.00) g/dL | 13 ± 1.36 | 13.68 ± 2.10 | ||
| White blood cells (4.30–10.80) 105/µL | 3.21 ± 1.43 | 7.15 ± 1.28 | ||
| Neutrophils Abs count % (40–75) | 2.65 ± 1.25 | 5.83 ± 2.55 | ||
| 56.6 ± 17 | 78.89 ± 1.83 ++ | |||
| Lymphocytes Abs count % (20–45) | 2.05 ± 0.23 | 0.07 ± 0.57 | ||
| 26.03 ± 10.00 | 14.59 ± 2 ++ | |||
| Monocytes Abs count % (3.4–11) | 0.38 ± 0.18 | 0.43 ± 0.40 | ||
| 8.96 ± 5.7 | 6.12 ± 2.6 | |||
| Eosinophils Abs count % (0–7) | 0.08 ± 0.13 | 0.013 ± 0.3 | ||
| 2.1 ± 3.7 | 1.0 ± 3.60 | |||
| Basophils Abs count % (0–1.5) | 0.015 ± 0.01 | 0.014 ± 0.01 | ||
| 0.35 ± 0.2 | 0.19 ± 0.07 | |||
| (2) biochemistry | Paucisymptomatic | Symptomatic | ||
| Fibrinogen (200–400) mg/dL | 460 ± 171 | 527 ± 1.3 ++ | ||
| Antithrombin III % (75–128) | 100 ± 3 | 101 ± 19 | ||
| D-dimers (0–500) ng/mL | 745 ± 633 | 1133 ± 91 ++ | ||
| Glucose (70–100) mg/dL | 101 ± 32 | 119 ± 51 | ||
| BUN (15–40) mg/dL | 41 ± 28 | 65 ± 40 ++ | ||
| AST (5–34) U/L | 27 ± 11 | 44 ± 46 | ||
| ALT (0–55) U/L | 24 ± 17 | 107 ± 63 ++ | ||
| LDH (125–220) U/L | 234 ± 71 | 438 ± 21 ++ | ||
| C-reactive protein (CRP) (0–5) mg/L | 25 ± 22 | 49 ± 49 ++ | ||
| Lipase (8–78) U/L | 55 ± 47 | 110 ± 64 ++ | ||
| Amylase (25–125) U/L | 70 ± 32 | 110 ± 53 ++ | ||
| (3) Respiratory outcome +++ | Paucisymptomatic | Symptomatic | ||
| None ∞ | 27 | 0 | ||
| NC/VMK | 0 | 12 | ||
| NIV/C-PAP/OTI | 0 | 15 | ||
| HD | CD169 RMFI | IL-6 | IL-10 | IFN-γ | TNF-α | |
|---|---|---|---|---|---|---|
| n | 57 | 19 | 19 | 19 | 19 | |
| Median | 1.92 | 0.04 | 0.26 | 0.32 | 0.45 | |
| IQR | 25 | 1.58 | 0.03 | 0.10 | 0.18 | 0.16 |
| 50 | 1.92 | 0.04 | 0.26 | 0.32 | 0.45 | |
| 75 | 2.31 | 81.12 | 12.18 | 12.38 | 3.57 | |
| UNTREATED | CD169 RMFI | IL-6 | IL-10 | IFN-γ | TNF-α | |
| n | 31 | 25 | 25 | 25 | 25 | |
| Median | 32.28 | 25.39 | 37.71 | 8.09 | 29.90 | |
| IQR | 25 | 6.67 | 4.61 | 9.40 | 1.46 | 4.63 |
| 50 | 22.28 | 25.39 | 37.71 | 8.09 | 29.90 | |
| 75 | 57.21 | 184.28 | 116.95 | 79.86 | 121.76 | |
| TREATED | CD169 RMFI | IL-6 | IL-10 | IFN-γ | TNF-α | |
| n | 23 | 19 | 19 | 19 | 19 | |
| Median | 23.30 ** | 11.68 | 0.78 ** | 8.19 | 19.05 | |
| IQR | 25 | 9.94 | 5.517 | 0.15 | 1.31 | 0.41 |
| 50 | 23.30 | 11.68 | 0.780 | 8.19 | 19.05 | |
| 75 | 33.99 | 36.92 | 11.57 | 45.84 | 59.82 | |
| (a) T-Cell Phenotype (% of Cells) | ||||||||
| HD | LYMPHO | MONO | NEUTRO | CD3 | CD4 | CD8 | CD8CD4 | |
| n | 57 | 57 | 57 | 57 | 57 | 57 | 57 | |
| Median | 22.85 | 5.69 | 46.46 | 72.42 | 61.20 | 32.89 | 0.96 | |
| IQR | 25 | 15.03 | 4.72 | 29.28 | 52.76 | 56.54 | 25.16 | 0.42 |
| 50 | 22.85 | 5.69 | 46.46 | 72.42 | 61.20 | 32.89 | 0.96 | |
| 75 | 29.11 | 7.53 | 61.69 | 80.07 | 64.69 | 37.08 | 1.69 | |
| Untreated | LYMPHO | MONO | NEUTRO | CD3 | CD4 | CD8 | CD8CD4 | |
| n | 31 | 31 | 31 | 31 | 31 | 31 | 31 | |
| Median | 12.64 | 4.34 | 62.41 | 59.85 | 51.02 | 29.50 | 0.84 | |
| IQR | 25 | 8.86 | 2.86 | 45.70 | 50.39 | 42.80 | 21.95 | 0.32 |
| 50 | 12.64 | 4.34 | 62.41 | 59.85 | 51.02 | 29.50 | 0.84 | |
| 75 | 16.87 | 6.68 | 73.17 | 76.42 | 65.86 | 37.72 | 2.14 | |
| Treated | LYMPHO | MONO | NEUTRO | CD3 | CD4 | CD8 | CD8CD4 | |
| n | 23 | 23 | 23 | 23 | 23 | 23 | 23 | |
| Median | 10.86 | 6.20 | 64.09 | 56.52 | 57.22 | 26.67 | 1.05 | |
| IQR | 25 | 5.89 | 4.77 | 50.54 | 50.93 | 44.78 | 23.43 | 0.56 |
| 50 | 10.86 | 6.20 | 64.09 | 56.52 | 57.22 | 26.67 | 1.05 | |
| 75 | 18.02 | 8.87 | 78.25 | 68.43 | 69.25 | 33.72 | 2.76 | |
| (b) Differentiation Markers in CD4+ T Cells (%) | ||||||||
| HD | CD4CM | CD4NAIVE | CD4EM | CD4TEM | CD4CD57 | CD4PD1 | CD4PD1CD57 | |
| n | 57 | 57 | 57 | 57 | 57 | 57 | 57 | |
| Median | 50.14 | 38.19 | 50.14 | 0.46 | 3.56 | 1.95 | 0.33 | |
| IQR | 25 | 35.85 | 30.17 | 35.85 | 0.24 | 1.66 | 1.15 | 0.13 |
| 50 | 50.14 | 38.19 | 50.14 | 0.46 | 3.56 | 1.95 | 0.33 | |
| 75 | 62.95 | 48.30 | 62.95 | 0.63 | 7.50 | 4.70 | 0.79 | |
| Untreated | CD4CM | CD4NAIVE | CD4EM | CD4TEM | CD4CD57 | CD4PD1 | CD4PD1CD57 | |
| n | 31 | 31 | 31 | 31 | 31 | 31 | 31 | |
| Median | 47.58 | 31.30 | 8.46 | 0.63 | 3.65 | 10.87 | 0.96 | |
| SD | 17.54 | 14.67 | 12.35 | 4.08 | 6.66 | 17.28 | 2.92 | |
| IQR | 25 | 40.37 | 24.00 | 2.53 | 0.18 | 1.41 | 4.68 | 0.38 |
| 50 | 47.58 | 31.30 | 8.46 | 0.63 | 3.65 | 10.87 | 0.96 | |
| 75 | 67.33 | 41.62 | 16.68 | 2.30 | 7.23 | 23.83 | 1.52 | |
| Treated | CD4CM | CD4NAIVE | CD4EM | CD4TEM | CD4CD57 | CD4PD1 | CD4PD1CD57 | |
| n | 23 | 23 | 23 | 23 | 23 | 23 | 23 | |
| Median | 49.89 | 35.94 | 5.74 | 1.73 | 2.66 | 8.39 | 0.55 | |
| IQR | 25 | 33.85 | 26.88 | 3.28 | 0.24 | 1.54 | 0.17 | 0.22 |
| 50 | 49.89 | 35.94 | 5.74 | 1.73 | 2.66 | 8.39 | 0.55 | |
| 75 | 62.11 | 46.10 | 17.77 | 4.62 | 10.18 | 21.07 | 1.77 | |
| (c) Differentiation, Senescence and Exhaustion Markers in CD8+ T Cells (%) | ||||||||
| HD | CD8CM | CD8NAIVE | CD8EM | CD8TEM | CD8CD57 | CD8PD1 | CD8PD1CD57 | |
| n | 57 | 57 | 57 | 57 | 57 | 57 | 57 | |
| Median | 27.94 | 46.79 | 10.55 | 5.43 | 1.92 | 3.04 | 0.54 | |
| IQR | 25 | 7.30 | 29.34 | 3.17 | 2.67 | 1.58 | 0.72 | 0.29 |
| 50 | 27.94 | 46.79 | 10.55 | 5.43 | 1.92 | 3.04 | 0.54 | |
| 75 | 45.62 | 56.07 | 33.25 | 14.51 | 2.31 | 12.87 | 6.98 | |
| untreated | CD8CM | CD8NAIVE | CD8EM | CD8TEM | CD8CD57 | CD8PD1 | CD8PD1CD57 | |
| n | 31 | 31 | 31 | 31 | 31 | 31 | 31 | |
| Median | 13.32 | 30.99 | 27.73 | 17.01 | 30.26 | 5.30 | 2.48 | |
| IQR | 25 | 4.84 | 15.26 | 13.38 | 9.04 | 15.04 | 2.59 | 1.35 |
| 50 | 13.32 | 30.99 | 27.73 | 17.01 | 30.26 | 5.30 | 2.48 | |
| 75 | 15.85 | 52.94 | 47.60 | 31.18 | 51.47 | 10.26 | 6.13 | |
| treated | CD8CM | CD8NAIVE | CD8EM | CD8TEM | CD8CD57 | CD8PD1 | CD8PD1CD57 | |
| n | 23 | 23 | 23 | 23 | 23 | 23 | 23 | |
| Median | 19.00 ** | 28.55 | 26.47 | 15.84 | 32.83 ** | 1.53 | 1.98 | |
| IQR | 25 | 5.02 | 16.58 | 12.49 | 9.16 | 24.23 | 0.00 | 0.00 |
| 50 | 19.00 | 28.55 | 26.47 | 15.84 | 32.83 | 1.53 | 1.98 | |
| 75 | 35.00 | 43.95 | 55.51 | 24.50 | 51.39 | 11.03 | 15.47 | |
| Untreated | Treated | |||
|---|---|---|---|---|
| CD4 | CD8 | CD4 | CD8 | |
| NAÏVE | ns | −0.330. p = 0.005 | ns | ns |
| CM | 0.241. p = 0.044 | −0.292. p = 0.014 | ns | ns |
| EM | ns | 0.241. p = 0.044 | ns | ns |
| TEM | ns | 0.266. p = 0.026 | ns | ns |
| Senescent (CD57+) | ns | 0.516. p = 0.014 | ns | ns |
| PD1+ | ns | ns | ns | ns |
| Exhausted (CD57 +PD1+) | ns | ns | ns | ns |
| CD169 RMFI | CD169 RMFI | |||
| Healthy Donors | Marginal | Naïve B | Unswitched | Switched Memory | Plasmablast | |
| n | 57 | 57 | 57 | 57 | 57 | 57 |
| Median | 14.09 | 53.36 | 37.97 | 33.33 | 14.66 | |
| IQR | 25 | 1.74 | 19.32 | 15.83 | 21.07 | 8.88 |
| 50 | 14.09 | 39.58 | 30.97 | 33.33 | 14.66 | |
| 75 | 19.33 | 60.63 | 43.75 | 51.17 | 30.28 | |
| Untreated COV | Marginal | Naïve B | Unswitched | Switched Memory | Plasmablast | |
| n | 31 | 31 | 31 | 31 | 31 | |
| Median | 6.24 | 43.16 | * 33.78 | 23.33 | 17.86 | |
| IQR | 25 | 2.39 | 26.47 | 16.21 | 22.16 | 10.27 |
| 50 | 6.24 | 43.16 | 31.78 | 33.33 | 17.86 | |
| 75 | 13.28 | 63.08 | 55.44 | 45.13 | 25.84 | |
| Treated COV | Marginal | Naïve B | Unswitched | Switched Memory | Plasmablast | |
| n | 23 | 23 | 23 | 23 | 23 | |
| Median | 4.58 | 47.20 | 31.49 | 26.22 | 20.67 | |
| IQR | 25 | 1.44 | 44.31 | 16.00 | 14.90 | 8.66 |
| 50 | 4.58 | 67.20 | 34.92 | 29.22 | 20.67 | |
| 75 | 10.49 | 78.80 | 47.64 | 36.38 | 32.23 | |
| Untreated | Treated | |
|---|---|---|
| CD19 | CD19 | |
| Marginal | 0.737. p < 0.001 | ns |
| NAIVE | 0.352. p = 0.032 | ns |
| Unswitched | ns | ns |
| Switched memory | −0.415. p = 0.016 | −0.407. p = 0.041 |
| Plasmablasts | −0.307. p = 0.025 | ns |
| CD169 RMFI | ||
| (a) Clinical Status | ||||||||
| UNTREATED | TREATED | |||||||
| HD | PS | SYMPTOMATIC | PS | SYMPTOMATIC | ||||
| n | 57 | 11 | 20 | 1 | 22 | |||
| Median | 2.00 | 17.00 | 27.50 | 33.00 | * 20.00 | |||
| IQR | 25 | 2.00 | 6.00 | 6.25 | 33.00 | 7.00 | ||
| 50 | 2.00 | 17.00 | 27.50 | 33.00 | 20.00 | |||
| 75 | 2.00 | 23.00 | 79.50 | 33.00 | 30.00 | |||
| (b) Pulmonary Involvement | ||||||||
| UNTREATED | TREATED | |||||||
| HD | PS | MiP | BiP | PS | MiP | BiP | ||
| n | 57 | 7 | 8 | 16 | 1 | 4 | 18 | |
| Median | 2.01 | 23.35 | 17.81 | ∞,* 27.97 | 27.74 | 4.67 | 23.30 | |
| IQR | 25 | 1.76 | 15.88 | 5.55 | 6.13 | 27.74 | 3.26 | 9.94 |
| 50 | 2.01 | 23.35 | 17.81 | 27.97 | 27.74 | 4.67 | 23.30 | |
| 75 | 2.30 | 25.27 | 26.66 | 91.66 | 27.74 | 26.24 | 31.93 | |
| None | OX | ||||||||
|---|---|---|---|---|---|---|---|---|---|
| UNTREATED | CD8CD57 | CD169 | IL6 | IL10 | CD8CD57 | CD169 | IL6 | IL10 | |
| n | 20 | 20 | 20 | 20 | 11 | 11 | 11 | 11 | |
| Median | 16.04 | 21.32 | 94.40 | 0.33 | 52.58 | 26.07 | 125.95 | 11.51 | |
| IQR | 25 | 13.33 | 8.81 | 23.51 | 0.11 | 35.65 | 5.88 | 8.92 | 1.18 |
| 50 | 16.04 | 21.32 | 94.44 | 0.33 | 52.58 | 26.07 | 125.95 | 11.51 | |
| 75 | 36.56 | 44.99 | 152.76 | 7.23 | 63.71 | 94.35 | 515.66 | 27.91 | |
| TREATED | CD8CD57 | CD169 | IL6 | IL10 | CD8CD57 | CD169 | IL6 | IL10 | |
| n | 6 | 6 | 6 | 6 | 17 | 17 | 17 | 17 | |
| Median | 23.53 | 24.39 | ** 3.82 | 20.77 | ** 32.83 | *** 18.90 | 87.927 | * 7.52 | |
| IQR | 25 | 3.00 | 5.30 | 2.62 | 00.37 | 25.87 | 8.2872 | 6.60 | 0.26 |
| 50 | 23.53 | 24.39 | 3.82 | 200.77 | 32.83 | 18.90 | 87.92 | 7.52 | |
| 75 | 29.27 | 211.91 | 4.25 | 52.39 | 33.61 | 469.59 | 10.84 | ||
| OX vs. None | Untreated | Treated | ||||
|---|---|---|---|---|---|---|
| AUC | Sensitivity (%) | Specificity (%) | AUC | Sensitivity (%) | Specificity (%) | |
| CD169 RMFI | 0.879 *** | 89 | 80 | 0.656 | 45 | 33 |
| IL-6 | 0.659 | 52 | 68 | 0.574 | 48 | 51 |
| IL-10 | 0.623 | 53 | 69 | 0.632 | 51 | 54 |
| CD8+CD57+ | 0.540 | 65 | 45 | 0.375 | 31 | 38 |
| Gene | Forward Primer (5′→3′) | Reverse Primer (5′→3′) | |
|---|---|---|---|
| GUSB | NM_000181 | CAGTTCCCTCCAGCTTCAATG | ACCCAGCCGACAAAATGC |
| IL-6 | NM_000600.3 | TGCAATAACCACCCCTGACC | ATTTGCCGAAGAGCCCTCAG |
| IL-10 | NM_000572.2 | ACATCAAGGCGCATGTGAAC | CACGGCCTTGCTCTTGTTTT |
| TNF-α | NM_000594.3 | CCCGAGTGACAAGCCTGTAG | TGAGGTACAGGCCCTCTGAT |
| IFN-γ | NM_000619.2 | TCAGCTCTGCATCGTTTTGG | GTTCCATTATCCGCTACATCTGAA |
Publisher’s Note: MDPI stays neutral with regard to jurisdictional claims in published maps and institutional affiliations. |
© 2021 by the authors. Licensee MDPI, Basel, Switzerland. This article is an open access article distributed under the terms and conditions of the Creative Commons Attribution (CC BY) license (https://creativecommons.org/licenses/by/4.0/).
Share and Cite
Minutolo, A.; Petrone, V.; Fanelli, M.; Iannetta, M.; Giudice, M.; Ait Belkacem, I.; Zordan, M.; Vitale, P.; Rasi, G.; Sinibaldi-Vallebona, P.; et al. High CD169 Monocyte/Lymphocyte Ratio Reflects Immunophenotype Disruption and Oxygen Need in COVID-19 Patients. Pathogens 2021, 10, 1639. https://doi.org/10.3390/pathogens10121639
Minutolo A, Petrone V, Fanelli M, Iannetta M, Giudice M, Ait Belkacem I, Zordan M, Vitale P, Rasi G, Sinibaldi-Vallebona P, et al. High CD169 Monocyte/Lymphocyte Ratio Reflects Immunophenotype Disruption and Oxygen Need in COVID-19 Patients. Pathogens. 2021; 10(12):1639. https://doi.org/10.3390/pathogens10121639
Chicago/Turabian StyleMinutolo, Antonella, Vita Petrone, Marialaura Fanelli, Marco Iannetta, Martina Giudice, Ines Ait Belkacem, Marta Zordan, Pietro Vitale, Guido Rasi, Paola Sinibaldi-Vallebona, and et al. 2021. "High CD169 Monocyte/Lymphocyte Ratio Reflects Immunophenotype Disruption and Oxygen Need in COVID-19 Patients" Pathogens 10, no. 12: 1639. https://doi.org/10.3390/pathogens10121639