1. Introduction
Tax constitutes a vital source of government revenue and holds a central role in countries’ fiscal policies and macroeconomic stability (
PwC 2021). The United Nations recognises the pivotal role of tax in achieving the Sustainable Development Goals (
United Nations 2022). The African Union recognises the significance of efficient and equitable taxation systems to reduce reliance on foreign aid and promote economic self-sufficiency. This vision hinges on enhancing domestic resource compliance and combating illicit financial flows to fulfil the aspirations of the African population (
PwC 2021).
Government trust, corruption, and taxation constitute well-documented areas of research (
Charron and Rothstein 2016;
Sánchez et al. 2012;
Nkundabanyanga et al. 2017;
Pillay 2017;
Nunkoo et al. 2018;
D’Attoma 2020;
Mansoor 2021;
Voogd et al. 2021;
PwC 2022;
Shanka and Menebo 2022;
Kogler et al. 2023). Increased tax compliance can be an outgrowth of citizens’ trust in the government (
Nurkholis et al. 2020). According to
Nkundabanyanga et al. (
2017) and
Pillay (
2017), tax compliance or non-compliance is influenced by factors such as government effectiveness, the transparency of the tax system, and voice and accountability.
D’Attoma (
2020) explored the impact of perceptions of public institutions on tax compliance in both the United States and Italy, identifying low institutional quality as a potential factor contributing to distrust and, subsequently, a decline in tax compliance. Analysing data from 14,509 economics students across 44 countries,
Kogler et al. (
2023) found that both trust and power are negatively related to the size of the shadow economy and the extent of corruption.
Notwithstanding the potential relationship between trust, corruption, and tax compliance, to our awareness, no study has examined this relationship and the necessary measures to transform Africa into a future global powerhouse. Firstly, trust builds a sense of partnership between taxpayers and the state, where individuals willingly contribute to state-building. Therefore, an understanding of the trust-tax compliance nexus is fundamental. Second, the association between trust and tax compliance remains particularly enigmatic in fragile states. These states face unique challenges, including weak institutions, political instability, and a higher propensity for corruption. Consequently, it is essential to scrutinise the dynamics of trust in these contexts.
This study bridges the identified gap by investigating factors influencing public trust in three government branches: the ruling party (a proxy for the executive), the parliament, and the local government, and examining whether trust in these arms of government impacts tax compliance. We conducted this investigation using Guinea, Mali, Sudan, and Zimbabwe as case studies. These countries were selected because of their high levels of fragility according to the Fragile States Index of the Fund for Peace (
Messner et al. 2019). The Fragile States Index is a tool for understanding the dynamics of nations facing fragility.
In this context, state fragility refers to nations where governments struggle to provide essential public services, characterised by weak political institutions, economic decline, poverty, widespread corruption, security threats, and violent conflicts (
Vallings and Moreno-Torres 2005;
Ferreira 2017). In the 2019 Fragile States Index compiled by the Fund for Peace (FFP), countries such as Mali, Guinea, and Zimbabwe are among the African countries grouped under the “Alert” classification. Sudan, in the same assessment, was designated at an even more critical level, marked as “High Alert” (
Messner et al. 2019). While the FFP ranked Mali as the most worsened country, closely following Libya (an African country but with no available data for our study), Zimbabwe and Guinea still hold the last ranks within the ‘Alert’ category despite some improvements. Sudan stands out as the sole African country grouped under ‘High Alert’ and has the available data for our study. The four countries are assumed to be representative of the remaining ten countries categorised under ‘Alert’ and ‘High Alert’ with available data for our study. The designation underscores the heightened degree of fragility within the socio-political and economic landscapes, as evaluated by the metrics employed by the FFP. We used data on attitudes and perceptions from the seventh round of the Afrobarometer survey, which was carried out in 2019.
This survey covers various aspects related to taxation and public trust. Our study contributes significantly by examining the complex link between government trust, corruption, and tax compliance. It integrates these factors, shedding light on their collective impact on governance, revenue, and social progress. First, it bridges insights from political science, economics, and social psychology to dissect these dynamics, enriching understanding across disciplines. Second, this study developed a model that dissects relationships between government trust, corruption perception, and tax compliance, revealing their complex interactions. Rigorous econometric analysis, utilising Afrobarometer survey data, quantifies these links, enhancing knowledge for policymaking across diverse settings. Third, this study translates theoretical insights into actionable steps to mitigate corruption, improve trust, and promote tax compliance.
2. Brief Overview of Institutional Background of the Sample Countries
This section introduces the diverse institutional backgrounds of Guinea, Mali, Sudan, and Zimbabwe, examining their constitutional frameworks, political transitions, and judicial systems. Each country presents a unique trajectory shaped by historical events, political developments, and societal factors, influencing the establishment and evolution of its governance structures. The information is sourced from (
Britannica 2023a,
2023b,
2023c,
2023d).
Guinea, as a unitary republic under the 2020 constitution, elects a president as the head of state, serving a maximum of two six-year terms (
Britannica 2023b). The president appoints a prime minister as the head of government, and legislators are elected to the National Assembly for unlimited five-year terms. The judiciary comprises the Supreme Court, the Court of Audit, and the lower courts, including a Constitutional Court and a High Court of Justice. After a military coup in September 2021, the 2020 constitution was suspended, and a transitional charter outlined governance until civilian rule was restored, featuring a president, prime minister, and an 81-member National Transitional Council.
In 1960, Mali adopted a constitution ensuring parliamentary democracy at independence, though its full implementation was delayed (
Britannica 2023c). The country saw a democratically elected president installed on 4 September 2013, ending the interim administration. A military coup in August 2020 resulted in a government takeover by the National Committee for the Salvation of the People, leading to the creation of a transitional charter in September. This charter outlined a return to civilian rule with a transitional administration under the direction of an interim president and prime minister, with a goal of serving for no longer than 18 months. Despite a second military coup in May 2021, the existing transitional government structure was maintained. Mali has eight régions, each of which is further divided into ‘cercles and arrondissements’ and is under the control of a governor. The arrondissement serves as the fundamental administrative unit, typically hosting a school and a dispensary at its centre. There are numerous villages in this administrative division, each of which has an elected village council and a chief in charge. The Supreme Court, which has both judicial and administrative responsibilities, oversees the legal system.
Sudan, since independence in 1956, has experienced multiple regime changes, including military coups in 1985, 1989, and 2019 (
Britannica 2023d). After the suspension of the interim constitution of 2005 in April 2019, a constitutional declaration was signed later that year, establishing a power-sharing agreement between the military and the Forces for Freedom and Change (FFC). A military general served as the initial leader of the transitional sovereignty council, which included both military and civilian members. A prime minister appointed a cabinet, and elections were expected in 2022. However, a military coup in October 2021 dissolved the Sovereignty Council. There are 18 administratively separate states in Sudan, each of which has a governor. The judicial system includes the Supreme Court, Appeals Courts, and a Constitutional Court.
Under the 2013 constitution, Zimbabwe is a unitary republic, with the president as the head of state and government, serving a maximum of two five-year terms (
Britannica 2023a). Two vice presidents assist the president, and the parliament consists of the National Assembly and the Senate, with members serving five-year terms. Zimbabwe is divided into eight provinces and two metropolitan provinces, each further divided into districts. Mayors serve as council chairpersons in metropolitan provinces, while elected chairpersons lead councils in provinces. The judicial system includes the Constitutional Court, the Supreme Court, the High Court, a Labour Court, an Administrative Court, and customary law courts.
3. Trust and Theories of Taxpayer Compliance
At the heart of the complex interaction between tax compliance, and governance lies the fundamental concept of trust (
D’Attoma 2020). Trust is not just a sentimental notion, but a cornerstone of effective tax administration in a democratic society. It serves as the bridge connecting taxpayers with their government, symbolising the reciprocal relationship of rights and responsibilities. Nurturing taxpayer trust requires a multifaceted approach that extends beyond fiscal policies. A government that prioritises citizen welfare, effectively communicates public needs, and operates with transparency and accountability cultivates an environment where trust can flourish (
Pillay 2017;
Taylor et al. 2020). This alignment between governmental actions and citizen expectations reinforces taxpayers’ trust in tax administration bodies.
In the relentless quest to formulate effective tax administration policies that not only encourage compliance but also foster taxpayer confidence, studies wrestle with the complex network of elements that drive tax evasion and promote compliant behaviours (
Nkundabanyanga et al. 2017;
Pillay 2017). This theoretical, policy and practical conundrum has spurred the interest of a diverse range of scholars, resulting in the formulation of several theories that elucidate the variations in taxpayer compliance and tax evasion: political legitimacy, social contract, economic deterrence, fiscal exchange, social influences, and comparative treatment.
The political legitimacy theory, standing as the first cornerstone of understanding taxpayer compliance and tax evasion, posits a profound link between taxpayers’ trust in their government and tax compliance (
Kirchler et al. 2008). This concept of legitimacy within the context of tax compliance extends to the conviction that tax authorities, institutions, laws, policies, and programs are appropriate and advantageous for the welfare of the community (
Ali et al. 2014). The underpinning premise of this theory is that taxpayers who harbour higher levels of trust in their government are more inclined to exhibit greater tax compliance. Therefore, the foundation of compliance rests on the bedrock of trust in governance institutions.
Like the political legitimacy theory, social contact theory, which emerged in response to the challenges of legitimising government during the social upheavals of 17th and 18th century Europe (
Jos 2006;
Smith et al. 2009), is a significant theory in understanding the intricate relationship between public trust and tax compliance. The theory posits that individuals consent to be governed in exchange for the protection of their rights and well-being. This social contract forms the basis for the legitimacy of government authority. When applied to the context of taxation, this theory proposes that citizens are more likely to comply with tax obligations when they perceive the government as legitimate and trustworthy. A government that is perceived as transparent, fair, and responsive is more likely to garner trust from its citizens, leading to increased compliance with tax obligations.
The economic deterrence theory, the third pillar elucidating the spectrum of taxpayer behaviour, posits that the enforcement policies and actions of tax administrations discourage individuals from resorting to tax evasion (
Sandmo 2005). The calculus involved in the decision-making process of compliance versus evasion revolves around an assessment of the potential benefits from compliance versus the foreseeable personal costs of non-compliance (
Ali et al. 2014). This theory finds a reflection in tax administration laws that detail penalties as a deterrent strategy. The implication here is that taxpayers who perceive tax evasion as a daunting prospect are more likely to adopt a disposition of tax compliance.
Fiscal exchange theory, which constitutes the fourth paradigm relevant to tax compliance, postulates a contractual relationship between taxpayers and the government, like an exchange of taxes for public goods and services (
Moore 2004;
Ali et al. 2014). In essence, this theory asserts that taxpayer compliance behaviours are intrinsically tied to their perception of receiving equitable benefits from the government (
Ali et al. 2014). Unlike the economic deterrence theory which is based on fear of legal consequences, the fiscal exchange theory accentuates positive benefits from compliance, leading to a higher probability of voluntary adherence (
Moore 2004). At its core, fiscal exchange theory highlights the correlation between tax compliance and individuals’ contentment with the quality of goods and services they receive from the government.
Social influence theory, a fifth facet in understanding taxpayer behaviours, contends that compliance attitudes and actions are shaped by the behaviours of fellow taxpayers and the prevailing social norms (
Keith 1990). Consequently, social influences have the power to alter the perceived likelihood of detection and, thereby, impact compliance choices. Those who observe peers and acquaintances adhering to tax regulations tend to follow suit, while those who perceive widespread tax evasion might be inclined toward non-compliance (
Ali et al. 2014).
Ali et al. (
2014) highlight that individuals who perceive their fellow citizens as tax-compliant are more predisposed to uphold their tax obligations, further emphasising the role of the social context in shaping compliance attitudes.
The last but not least theory, the comparative treatment theory, posits that individuals assess how the government treats them in comparison to the treatment of other societal groups (
Mckerchar and Evans 2009). This assessment goes beyond merely assessing the benefits received from the state; it extends to the fairness of treatment compared to other citizens within the nation. This assessment significantly influences their perceptions of both the state and its citizens. According to this theory, individuals who perceive equitable treatment by the government and a sense of parity within their societal group are more inclined to comply with their tax obligations. The concept of a ‘group’ here encompasses dimensions such as wealth, education, age, religion, or ethnicity (
Ali et al. 2014).
Rooted in incentives and penalties, these theories provide a nuanced view of factors that shape the choices of individuals related to tax. Fiscal exchange and comparative treatment theories, for instance, share an incentive-based foundation. The fiscal exchange highlights that taxpayers are likely to comply when they see a direct link between compliance and government benefits. Creating an environment where contributions yield tangible returns motivates participation. Similarly, the theory of comparative treatment underscores the role of equity. Individuals assess their treatment relative to others, gauging fairness. Ensuring equal treatment fosters compliance. In contrast, social influence and economic deterrence theories focus on penalties. Economic deterrence uses punitive legal measures to deter evasion. Social influence examines the dynamics of peers. Observing peers’ compliance pressures conformity. Fear of non-compliance stigma deters evasion within social circles.
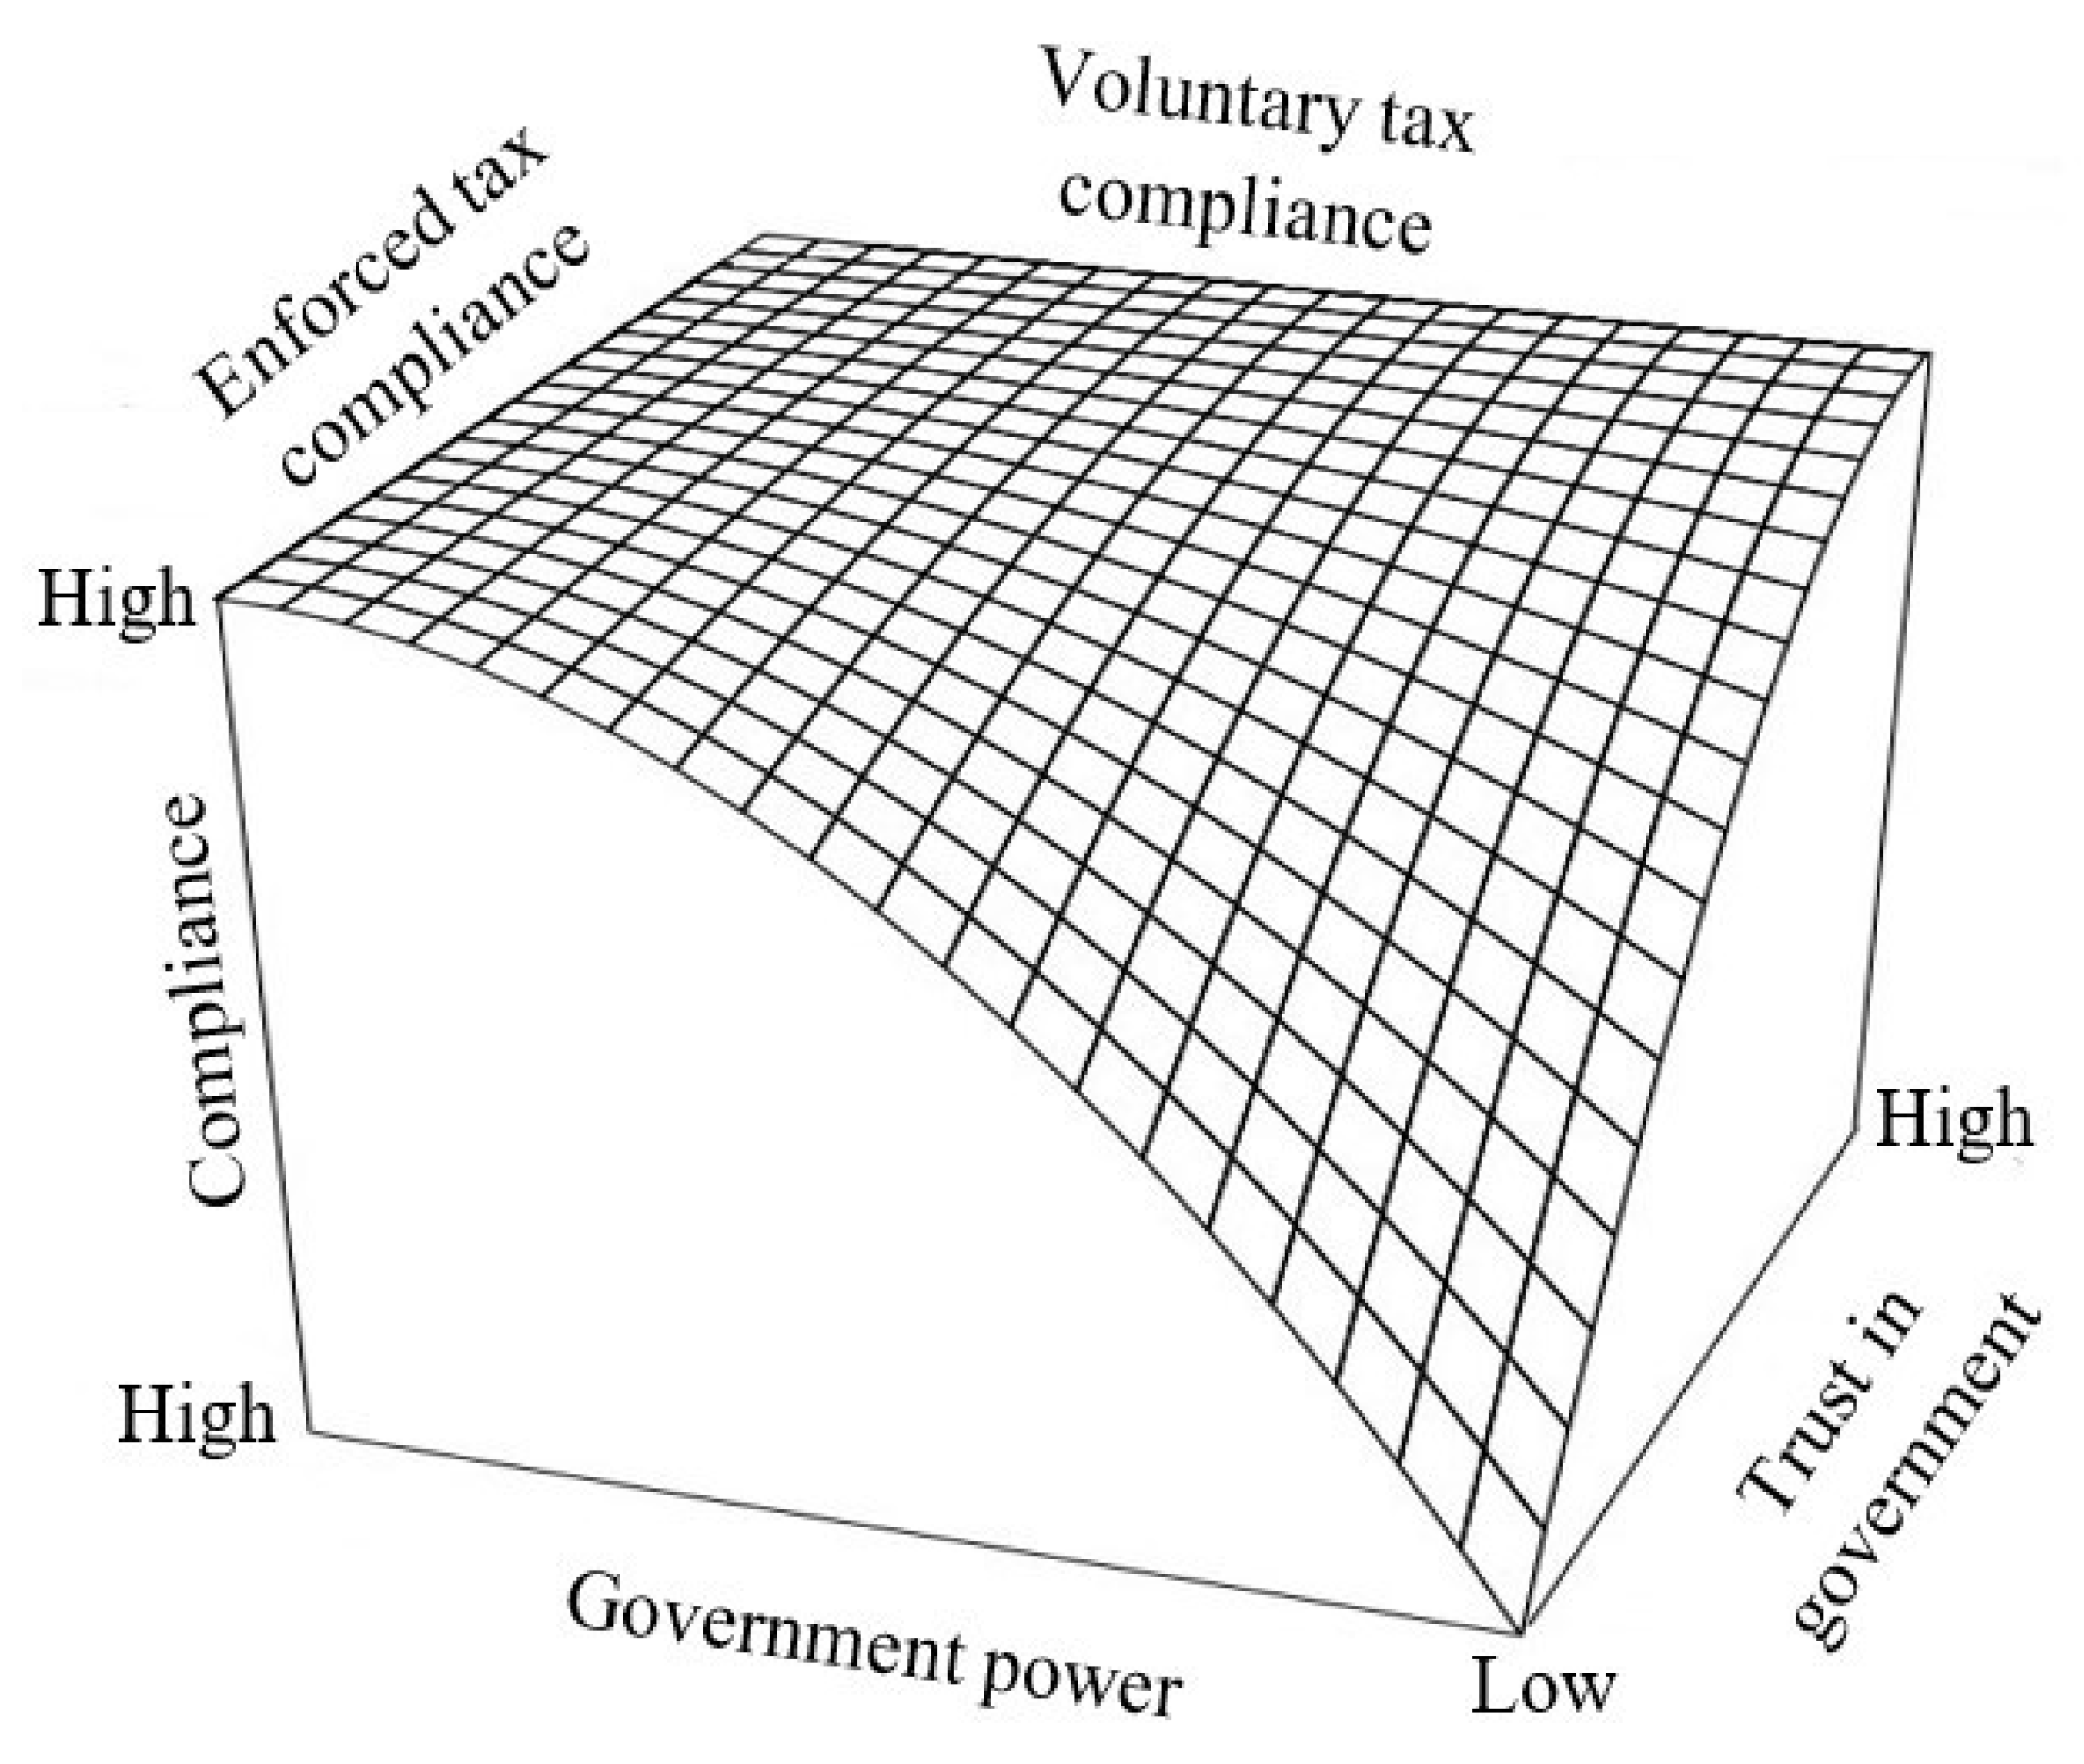
The political legitimacy and social contract theories emerge as a unifying force that encapsulates both the incentive and penalty dimensions of tax compliance. Trust in the government, the cornerstone of political legitimacy and social contract, acts as an overarching incentive for taxpayers to comply. When individuals trust that the government is acting in their best interest and utilising tax revenues responsibly, they are more likely to willingly contribute. A government that fosters trust while also demonstrating its commitment to enforcing tax regulations instils a sense of fairness and equity, promoting both compliance and the integrity of the tax system. To illustrate the interplay between trust, authority, and taxpayer compliance, we employ the three-dimensional figure developed by
Kirchler et al. (
2008), depicted in
Figure 1.
The three-dimensional model offers a visual representation of the complex interplay between trust, government, and taxpayer compliance. This model offers a framework that illustrates how these elements collaboratively influence taxpayer behaviour and ultimately affect compliance outcomes.
Starting from the low trust end of the model, where both government authority and trust are weak, taxpayers are more inclined to resort to tax evasion to maximise personal gains. This leads to decreased overall tax compliance. As the model progresses along the left side of the low-trust zone, compliance begins to increase. This upward trend results from increased governmental power to conduct audits and identify non-compliance, coupled with substantial fines for deviations. This alters the incentives of taxpayers for tax evasion, as the anticipated benefits of compliance outweigh the gains from evasion. Empowering authorities to enforce penalties fosters an environment of compelled.
Moving along the front and then the right edge of the model, in the context of limited government authority, compliance experiences an upward trend as trust deepens. Voluntary compliance significantly increases in situations with high trust levels. This phenomenon is observable when strong government authority coincides with substantial trust in authorities. However, it is important to note that while both instances achieve high compliance, a qualitative distinction arises between two types of compliance: enforced and voluntary.
The interactive dimensions of power and trust exhibit reciprocal dynamics, subtly influencing each other. Trust fluctuations gain prominence when power is constrained. In situations of imposing government authority, trust variations become less significant as authorities can enforce compliance. On the contrary, variations in government power carry more weight when trust is scarce. However, at peak trust levels, power disparities become insignificant as taxpayers willingly meet tax obligations.
Therefore, the model emphasises that increased compliance can be achieved through strategic investments in power or trust, contingent on specific circumstances. Understanding the implications of this interaction enables governments to make informed decisions that cultivate an environment fostering greater compliance, trust, and effective tax administration.
4. Materials and Methods
4.1. Source and Nature of Data
The source of data for this study is Afrobarometer survey data. Afrobarometer is a nonpartisan, pan-African study institution conducting public attitude surveys on democracy, governance, economy, and society in more than 30 African countries (
Afrobarometer 2022). These surveys have been carried out at periodic intervals since 1999. The primary method involves personal interviews to gather information from individual respondents. A standardised questionnaire, containing identical or functionally equivalent items, is administered to every respondent across countries and time periods, enabling comparisons across countries and over time periods.
During the face-to-face interview, the respondent’s language was used as a preferred instrumental tool to obtain information. Accordingly, the interviewer poses a series of questions and records the provided responses. This approach increases high survey response rates, minimal refusal rates, opportunities for respondents to clarify their answers, and the ability to draw inferences about public opinion by aggregating responses.
Afrobarometer’s sample sizes are considered sufficient for making inferences about all voting-age citizens. The average margin of sampling error is no more than plus or minus 2.8% at a 95% confidence level for a sample size of 1200 in our case. Many scholars, including
Wig and Tollefsen (
2016);
Ahlerup et al. (
2017);
Odhiambo (
2019); and
Djemaï and Kevane (
2023), have conducted research using Afrobarometer as a primary source of data.
Understanding the association between trust, corruption, and tax compliance is possible using the Afrobarometer survey data of round 7, 2019. In 2019, Afrobarometer conducted surveys in 34 African countries. The selected countries for this study had the following number of observations: Guinea (1194), Mali (1200), Sudan (1200), and Zimbabwe (1200), with a total of 4794 observations. After cleaning the missing variables, 4545 observations were used for the analysis. We opted for Round 7 (2019) of the Afrobarometer survey data instead of Round 8 (2022) because the former incorporated the tax compliance variable, whereas the latter did not. All selected Afrobarometer country surveys are nationally representative. The surveys are administered at the individual level and the respondents are household heads.
4.2. Empirical Strategy
The empirical application of the study question to establish the effects of trust in government on tax compliance demands modelling tax compliance as a function of trust and several other covariates that may confound this relationship.
Given that the outcomes (variables) of interest are binary categories with two values (1, 0), the use of linear regression, the ordinary least square method (OLS), is not acceptable. This is because OLS assumes a linear relationship between the outcome variables and the independent variables (covariates) (
Hosmer et al. 1997;
Wooldridge 2010).
One of the essential assumptions in OLS is that the error term should ordinarily be distributed with an expected mean of zero and a constant variance for all observations. When the outcome variable is binary, this does not hold true (
Hosmer et al. 1997;
Wooldridge 2010).
When the outcome variable is a binary categorical variable with two values (1, 0), the logit or probit model is the best technique to analyse the relationship between covariates and the outcome variable while controlling for the effects of other covariates (
Wooldridge 2010). The use of the logit model over the probit model is simply due to the ease with which parameter estimations can be interpreted (
Hosmer et al. 1997;
Faraway 2010). Therefore, this study employs a logit regression model to examine the effect of covariates over the selected outcome variables (whether an individual has trust in the ruling party or not, trust in parliament or not, and whether an individual must pay tax or not).
The odds of the occurrence of an event (whether an individual has trust in the ruling party or not, trust in parliament or not, trust in the local government or not, and whether an individual must pay tax or not in our context) are the ratio of the likelihood of the event to the likelihood of the non-occurrence of the event. If the likelihood of the occurrence of an event is
, the likelihood of the non-occurrence of an event is
. Thus, the corresponding odd of an event is given as follows:
Similarly, the odds of the non-occurrence of the event are also given as follows:
Since a logistic model computes the likelihood of the occurrence of an event over the likelihood of the non-occurrence of an event, the effect of the covariates is generally enlightened in terms of odds. With a logistic model, the likelihood of the occurrence of an event ‘
’ in terms of covariates ‘
’ is shown relating ‘
’ and ‘
’ by the
equation. However, this is not a good model specification. This is because extreme values of ‘
’ will yield values of
that does not fall between 0 and 1. Thus, the logistic model is an appropriate solution to such a problem by transforming the odds using the natural logarithm (
Peng and So 2002).
The log odds or the natural log odds as a linear function of the covariates, using Equations (1) and (2), the simple logistic regression mode, is given as follows:
where: ‘
’ denotes trust in the ruling party; ‘
’ represents trust in parliament; ‘
’ represents trust in local government council; ‘
’ denotes
individual in ‘
’ household (
), who resides in country ‘
’;
’s are the regression coefficients of the covariates, and
is the odds ratio.
Using the antilog of Equation (3), to estimate the likelihood of the occurrence of the outcome variables of interest is given as follows:
Therefore, the logarithmically transformed logit model, Equation (4) can be rewritten as a linear combination of the covariates as follows:
where:
is the log odds or logit, ‘
’ is the natural logarithm, ‘
’ is the likelihood of outcome variables of interest, ‘
’ is the covariates, ‘
’ and ‘
’ are the intercept and regression coefficients, respectively.
Similarly, to examine the determinants of whether an individual must pay a tax or must not pay a tax (
) was also examined using a logit model, which is specified as follows:
The logarithmically transformed logit model of Equation (6) can be rewritten as a linear combination of the covariates as follows:
where:
denotes whether there is a tax compliance or not,
represents log odds or logit,
is the intercept, and
’s are the regression coefficients of the covariates.
When the value of a ‘’ or ‘’ is a positive, a unit change in ‘’ is raising the odds of the occurrence of the event while controlling the other covariates. Whereas, when the value of a ‘’ or ‘’ is negative, the odds of the occurrence of the event decrease with a unit increase in ‘’ while other covariates remain fixed.
Although a logistic regression model looks similar to OLS, however, the underlying binomial distribution and parameters (
,
,
,
) cannot be computed in the same way as for OLS. As an alternative, the parameters are generally computed using the Maximum Likelihood Estimation (MLE) technique (
Menard 2011). The MLE will provide values of parameters (
,
,
,
), which maximises the probability of obtaining the data.
The MLE computes the likelihood of observing the data, with the unknown parameters (
,
,
,
). A “likelihood” is a probability that the observed values of the outcome variables may be estimated from the observed values of the covariates. The log-likelihood varies from 0 to −∞. Suppose in our sampling, each respondent has the same probability ‘
’, that an event occurs. For each individual in our sample of size (‘n’),
shows that the occurrence of an event for the
individual in ‘
’ household (
), who resides in country ‘
’; otherwise,
. The observed data are
,
, &
,
(dependent variables) and ECS, PER, COR, FSP, FS, RLE, HRA, & CD (covariates). Thus, using a natural logarithm, the MLE is given as follows:
The covariates used in this study are abbreviated as follows: the electoral commission (ECS), level of performance (PER), levels of corruption (COR), freedom of speech (FSP), respondents levels of education (RLE), household food insecurity (FS), household residential area (HRA: rural vs. urban), and country dummies (CD) (Guinea = 0 (reference category), Mali, Sudan, and Zimbabwe).
5. Descriptive Statistics
5.1. Trust in Various Branches of Government
Table 1 presents a comparative analysis of institutional trust in the sample countries. Data reveal differences in citizens’ perceptions of electoral commissions, parliaments, local government, and ruling parties, which are key indicators of political stability and the effectiveness of the governance of a nation. Trust in these institutions varies widely among the countries surveyed.
Table 1 highlights that 42% of citizens in Guinea express complete distrust in the electoral commission. Similar dynamics are observed for distrust in the ruling party and parliament. Such widespread distrust suggests a fractured relationship between the government and its citizens, which can lead to disengagement from the political process, and even social unrest. A lack of confidence in these institutions undermines their legitimacy and their ability to fulfil their roles in upholding democratic processes and ensuring fair representation.
Sudan shows extreme distrust in the electoral commission (55%), in the ruling party (54%), and in the parliament (49%), signifying potential electoral fragility and instability, hinting at a severe erosion of public trust in the mechanisms responsible for the country’s political decision-making. This undermines the credibility of elections and electoral outcomes. The risk of protests, conflicts, or even political upheaval is increased when citizens perceive that their voices are not being heard or represented by these institutions.
In Mali, the highest trust is placed in the local government at 36%, in the electoral commission (32%), and in the parliament (27%), indicating a moderate level of confidence. This situation implies that while certain aspects of governance may be functioning relatively well, there are areas where improvements are needed to ensure a stable political environment. On the contrary, Zimbabwe has better levels of trust in its government institutions. Citizens in Zimbabwe appear to have relatively more trust in these institutions, particularly the parliament and ruling party.
Diving deep into decentralised governance, the findings provide valuable insights into the varying levels of trust in local government councils across these four countries. Mali stands out with the highest level of trust in its local government, while Sudan exhibits the lowest level of trust, with a significant percentage of respondents expressing “Not at all” trust. Only 9% of the Sudanese respondents place a similar degree of trust in their local government council. On the opposite end of the spectrum, the figure jumps significantly to 46% among Sudanese respondents, demonstrating a profound lack of trust in the local government institution.
5.2. Level of Corruption across Countries
Table 2 illustrates the varying perceptions of corruption levels between the sample countries. In general, Sudan and Guinea have the highest proportion of respondents, indicating that corruption has increased a lot. Sudan stands out, with 70% of respondents reporting a lot of increase in corruption. This signifies a deep-seated perception that corruption is becoming more widespread in these countries.
For all the countries, the lowest proportion of respondents, ranging from 2% to 6%, feel that corruption has decreased significantly, indicating a relatively smaller perception of a substantial reduction in corruption.
While the analysis is generalised, it might be interesting to explore whether there are regional patterns in the perceived changes in corruption. For instance, if a significant proportion of respondents from a particular province within a country feel that corruption has increased, it could indicate specific issues or dynamics within that province.
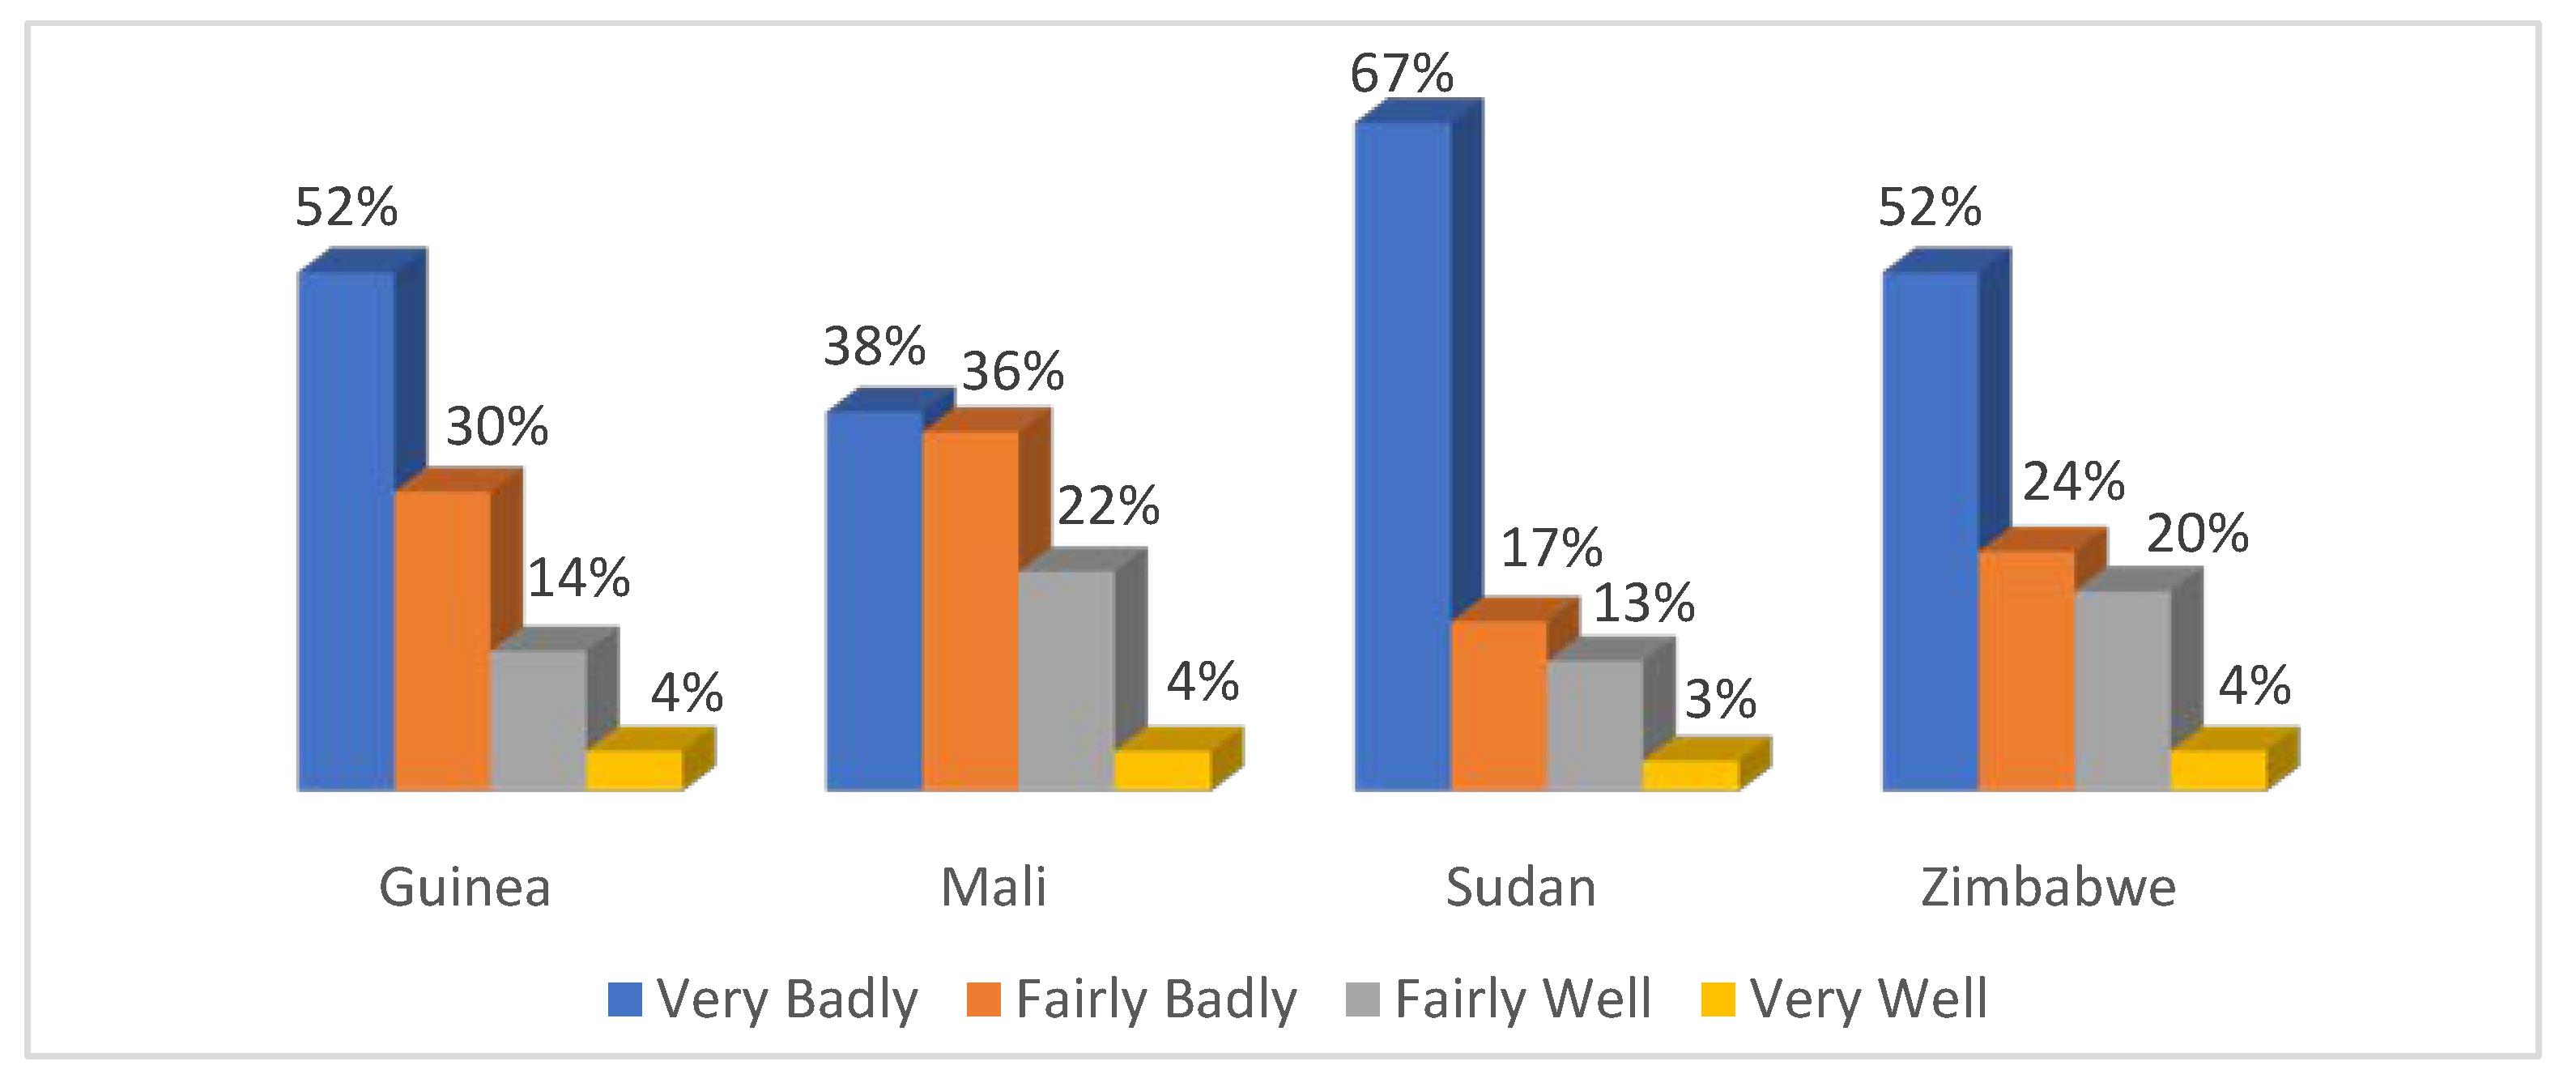
5.3. Handling Corruption in Government
Figure 2 illustrates the prevailing perception that corruption is not adequately addressed in these countries. Most respondents indicate that corruption is being tackled either “Very Badly” or “Fairly Badly.” Comparatively, the perceptions of practical anti-corruption efforts (“Fairly Well” and “Very Well”) are notably lower.
More than half of the respondents in Guinea, Zimbabwe, and Sudan believe corruption is being addressed “Very Badly”. This attitude is particularly strong in Sudan, where 67% of the respondents share this view. Guinea and Zimbabwe closely follow with a percentage of 52%. As highlighted in
Figure 2, Mali follows this category, with 38%. Across the sample countries, very few respondents feel that corruption is being handled “Very Well” with proportions between 3% and 4% in this category, indicating a limited perception of practical anti-corruption efforts.
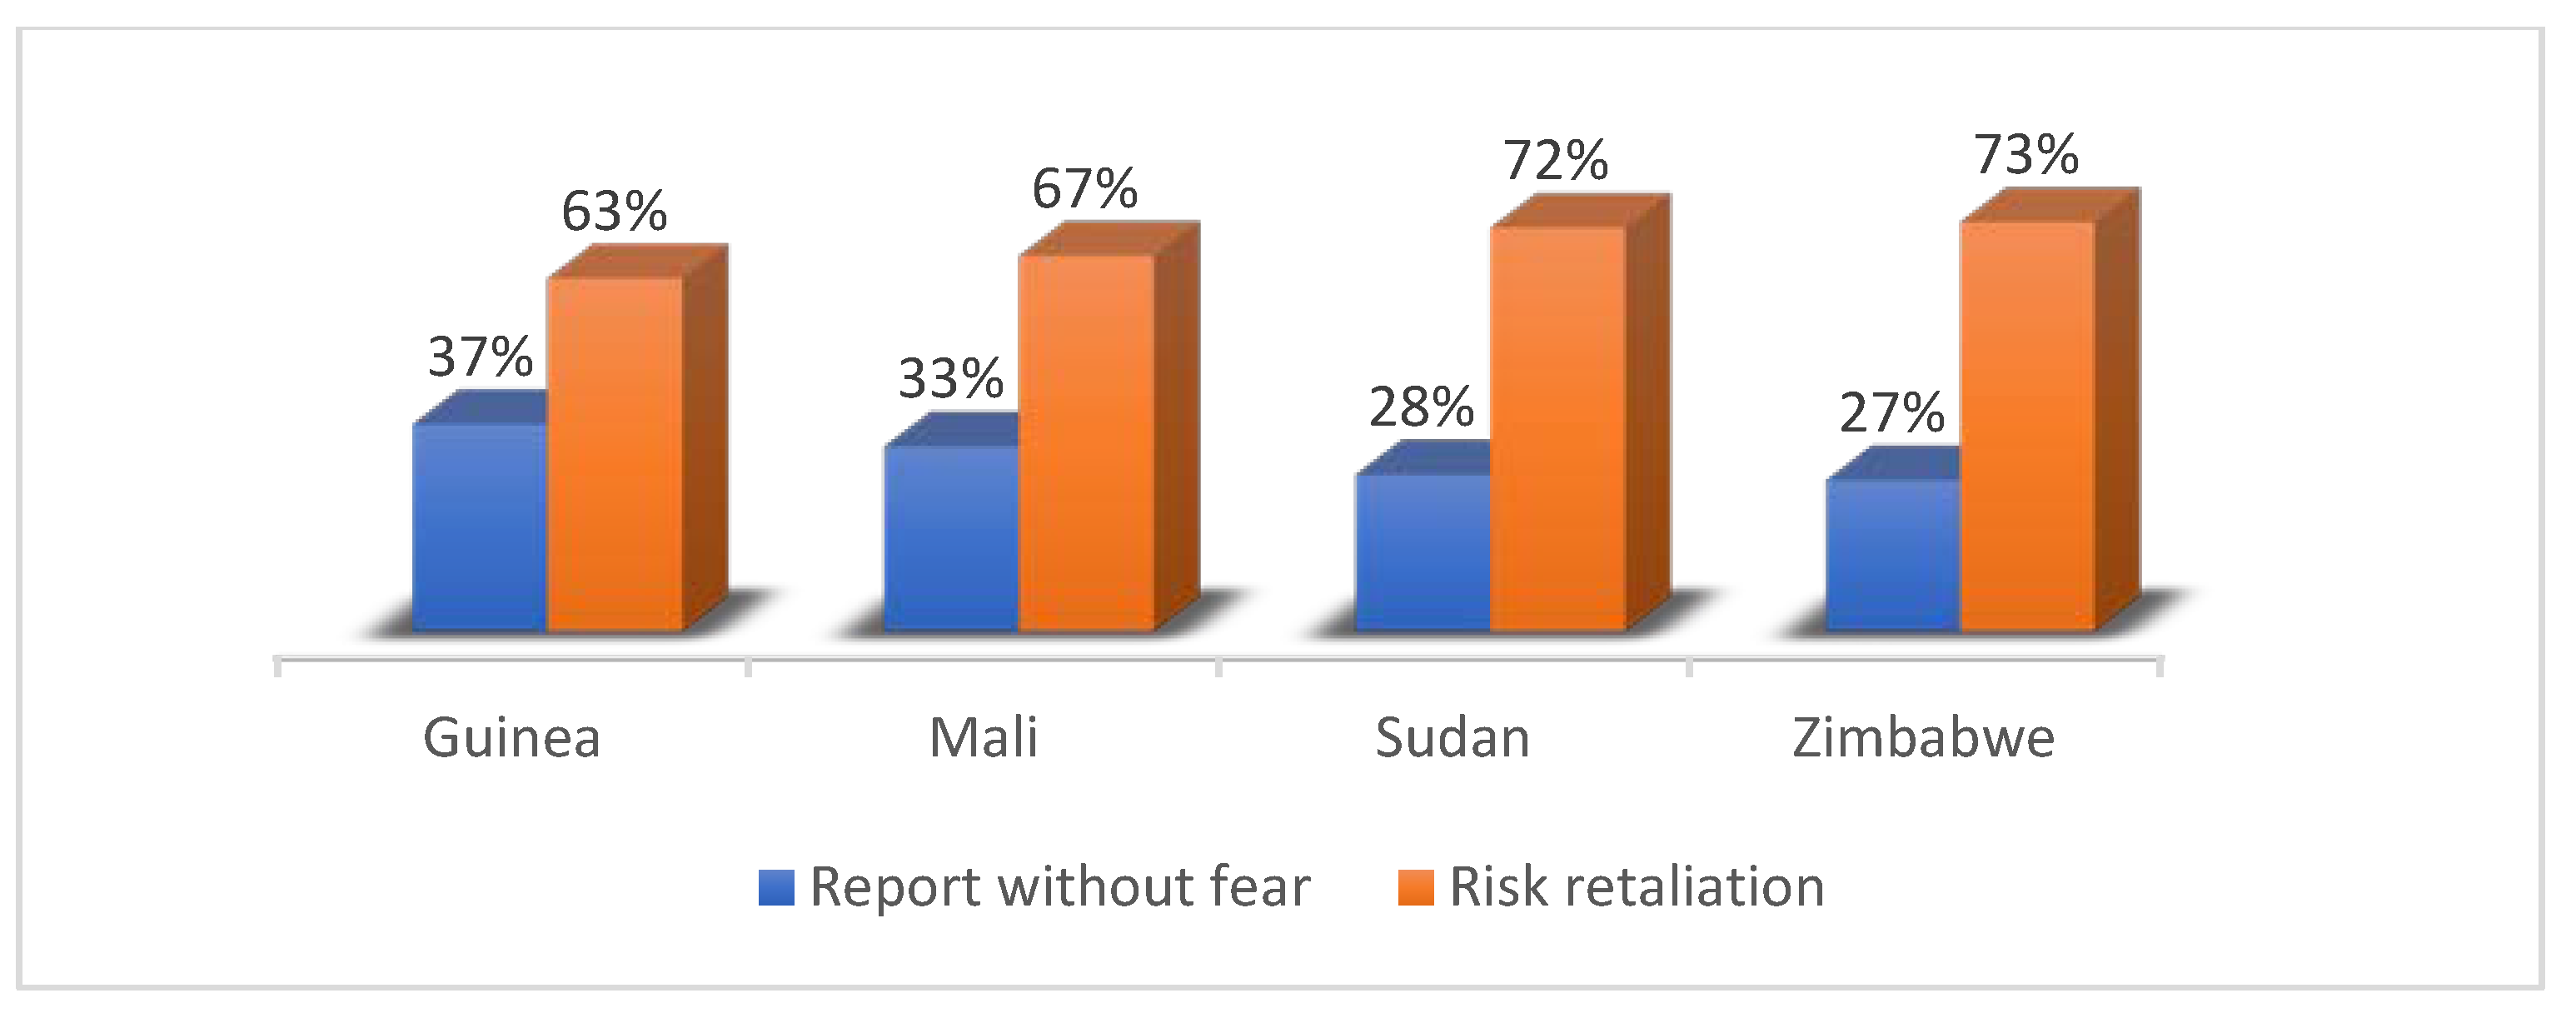
5.4. Reporting the Acts of Corruption and Its Knock-On Effects
The results revealed in
Figure 3 regarding reporting acts of corruption across the surveyed countries illustrate a crucial dimension of state fragility—the erosion of transparency, accountability, and civic engagement. Statistically, high percentages of respondents from all sample countries who fear retaliation for reporting corruption, underscore the delicate balance between the willingness of citizens to report incidents of corruption and the potential repercussions they perceive.
For example, Zimbabwe has the highest percentage (73%) of respondents who believe there is a risk of retaliation for reporting acts of corruption. Sudan follows closely, with 72% of the respondents expressing the same concern. These responses can be influenced by the level of democracy and freedom of speech and media within each country. Political environments, including the presence of censorship or restrictions, can also play a role in shaping people’s perceptions of reporting and retaliation.
The data presented in
Figure 3 offers a valuable lens through which to examine the multifaceted nature of state fragility. Fear of retaliation for reporting corruption is not merely an isolated concern; it is intertwined with broader governance challenges, media freedom, and the state’s relationship with its citizens.
5.5. Attitudes toward Taxes in Different Countries
Table 3 presents the results of a survey on attitudes toward taxes. Most of the respondents in all countries agree that people must pay taxes. Mali stands out, with 52% of respondents strongly agreeing that people must pay taxes, followed by Zimbabwe (35%) and Guinea (23%). Zimbabwe has the highest percentage of respondents who agree that people must pay taxes (50%), followed by Sudan (48%).
As indicated in
Table 3, in general, the percentage of respondents who strongly disagree or disagree with the statement ’people must pay taxes’ is relatively low in all countries. There could be two primary reasons for this phenomenon. First, it suggests that paying taxes is widely accepted as a civic duty. Second, respondents may fear legal penalties if they do not pay taxes.
6. Main Findings
The main findings are presented in two tables. The first table,
Table 4, demonstrates the effects of government trust, government performance, and corruption on tax compliance. It also presents the effects of government performance and corruption on trust in the branches of government. The second table,
Table 5, presents the effects of other control covariates on government trust and tax compliance.
Table 4 offers an analysis of the factors that influence public trust in government institutions, shedding light on how this trust subsequently impacts tax compliance. The presentation has been confined to the core variables of interest, while the additional control covariates are presented in
Table 5. Given that all models are derived using the binary logistic regression technique, the coefficients provide only valuable information on the significance and direction of relationships. To facilitate a probabilistic interpretation, marginal effects have been calculated for all coefficients. The marginal effect for each variable is demonstrated next to the coefficients. When discussing the significance and direction of relationships, we refer to the coefficients. When examining the magnitude of relationships, we refer to these marginal effects.
Table 4 illustrates a direct and significant association between trust in the ruling party and taxpayers’ compliance with tax administration and law. The marginal effects show that, compared to the respondents who did not have trust in the ruling party, those who had trust in the ruling party increase the probability of paying a tax compliance by 4.6% points (marginal effects), holding other covariates in the model constant.
Trust in the electoral commission plays a pivotal role in increasing trust in the branches of government. The marginal effects in
Table 4 demonstrate that the expected probability of trust in the ruling party increases by 20.6% points for respondents who have little trust in the electoral commission than those who do not have trust (the reference category) while with other covariates in the model are held constant. This trend becomes more pronounced as trust in the ruling party grows by 21.7% points for some trust and 24.3% points for a lot of trust in the electoral commission compared to the reference category. Similarly, a marginal increase in a little trust in the electoral commission corresponds to a 20.6% points increase in trust in the parliament. This effect has increased as the trust in the parliament increases by 23.0% points for some trust and 25.8% points for a lot of trust in the electoral commission while holding other covariates in the model. Furthermore, in contrast, the expected probability of trust in the local government council is higher by 18.7% points for those who have trust just a little witness than those who do not have trust in the electoral commission while a lot of trust results in a 22.6% points increase in local council trust, while holding other covariates in the model constant.
Similarly, a high level of trust in the electoral commission improves the willingness to adhere to tax administration laws by 6.5% points. This implies that a significant level of trust in the electoral commission while keeping other covariates constant, is associated with 6.5% points higher than the expected probability of taxpayers complying with tax laws. These results indicate that trust in both the ruling party and the electoral commission leads to a greater willingness among taxpayers to obey tax administration laws.
The regression results demonstrate the direct and significant relationship between government performance and public trust. The marginal effects indicate that, compared to the respondents who do not observe a positive performance by the president, those who perceive the president’s performance lead to a 7.6% points increase in the probability of trusting the presidential office, with other covariates in the model held constant. Similarly, this increase in perception translates to a 4.3% points increase in trust towards the parliament. The perception of effective performance in the mayor positively impacts trust in both the ruling party and the local government council. The perception that the local government council performs well contributes to increased trust in both the council itself and the parliament. These results highlight the crucial impact of government performance in developing public trust in various institutions, illustrating the interrelated nature of performance and trust (
Table 4).
Furthermore, conversely, the results demonstrate the inverse and significant relationship between corruption levels and public trust. The marginal effects reveal that, even when people perceive a lower level of corruption, trust in the ruling party is reduced by 7.1% points, and trust in the parliament is reduced by 6.7% points, in comparison to respondents who perceive there is no corruption. As the perception of corruption escalates to the highest level, the decline in trust becomes more apparent. This is evident in the marked decreases of 13% points in trust towards the ruling party, 13.4% points in trust towards the parliament, and 10% points in trust placed in the local council. The finding highlights the significant link between perceptions of corruption and the decline in public trust. In addition, the results indicate that there is an inverse and significant relationship between corruption and tax compliance. The estimates of marginal effects illustrate that, in comparison to respondents whose perceived corruption is none, those with the perception of the low level of corruption correspond to a reduction of 7.7% points in the willingness to pay taxes. This reduction in taxpayer compliance intensifies as corruption perceptions escalate, with reductions of 8.8% points for the same level of corruption, and 7.1% points for the highest level of corruption, keeping all other covariates in the model constant. This trend underscores the impact of perceived corruption in shaping taxpayer compliance behaviour (
Table 4).
Table 5 presents the direct and significant association between freedom of speech and trust in government institutions. The marginal effects reveal that, in contrast to those who perceive the absence of freedom of speech, those who perceive they have freedom of speech increase trust in the ruling party by 3.9% points, holding other covariates in the model constant. This increase in trust increases to 4.4% points as the level of freedom of speech intensifies from free to very free.
An individual who has freedom of speech is willing to comply with tax obligations. As demonstrated in the marginal effects, compared to those who believe they do not have freedom of speech at all, those who assume they are ‘not very free’ leads to a 5.9% points increase in their willingness to pay taxes, 4.3% points for ‘free’, and 7% points for ‘very free’. This means that, even in the context of some freedom of expression, individuals assume their obligation to pay tax. This finding underscores the interconnectedness between freedom of speech, trust in government, and taxpayer behaviour, illuminating how social factors play a pivotal role in shaping governance and citizen participation.
The regression results elucidate the impact of food insecurity patterns on households’ trust in their local government. The marginal effect, with other covariates held constant, indicates that a shift in food insecurity among households from ‘sometimes’ to ‘many times’ results in a change from 3% points increase in trust to 2.6% points decrease in trust in the local government, with ‘food secure’ as the reference. This implies that addressing food insecurity issues could be a crucial factor in rebuilding trust in local government institutions.
The findings of this study indicate that there is an inverse relationship between food insecurity and tax compliance. Households experiencing several times food insecurity reduce their tax compliance by 3.2% points. Households often food insecure negatively affects trust in the local government, which in turn has an impact on tax compliance. In other words, food insecurity not only affects households’ trust in political institutions but also influences their willingness to adhere to tax regulations. Similarly, the result of the regression analysis indicates that there is an inverse and significant relationship between education and trust but a direct and significant association between education and tax compliance. The levels of education of the respondents also play an important role. As stipulated in the marginal effects, those with secondary education tend to have lower levels of trust in the ruling party and local government but display a greater willingness to comply with tax administration laws. As the level of education increases from secondary to higher education, the willingness to comply with tax administration laws increases from 3.4% to 7.1% points. This suggests that education influences political trust and tax compliance behaviour, with more highly educated individuals being less trusting of the government but more inclined to follow tax regulations. It also implies that educated individuals, equipped with an understanding of the long-term benefits of tax contributions, are more inclined to comply with tax laws.
Furthermore, the results of this study show that, compared to residents of rural areas, residents of urban areas lack trust in their parliament and local government council, with compliance rates lower by 3% points and 3.5% points, respectively. In contrast, urban residents comply with tax administration laws by 5% points when rural residents are taken as the reference category. Similarly, the geographical nuances had also a positive and significant effect on tax willingness to pay. Within our sample of fragile states, Mali, Sudan, and Zimbabwe demonstrate a stronger sentiment that citizens should bear the responsibility of paying taxes compared to Guinea, a reference category.
7. Discussion
In this study, our investigation has focused on unveiling the complex links between government trust, corruption tax compliance in fragile states. The findings underscore the importance of electoral integrity in enhancing trust in the ruling party and parliament and, in turn, taxpayer compliance, particularly in fragile states. Particularly vital for fragile states,
Norris (
2011) accentuates the need for vigilant measures against biases and irregularities that can worsen fragility and undermine the integrity of the electoral system. The
Transparency International (
2020) Global Corruption Barometer reinforces the call for transparent and non-partisan elections (
Transparency International 2020). These vulnerabilities can erode trust and worsen fragility, underscoring the immediate need for transparent and non-partisan electoral processes to boost legitimacy, taxpayer compliance, and governance stability.
On the flip side, our results illuminate the impact of corruption on public trust. In countries, where governance structures are already weak, high levels of corruption wield the power to rapidly erode the trust citizens bestow upon their government. Countries with higher levels of perceived corruption tend to have lower levels of trust in their government institutions (
Vallings and Moreno-Torres 2005;
Ferreira 2017).
Our findings present a case for the differential impacts of trust in the ruling party on tax mobilisation. In states marked by fragility, where governance structures are prone to disruption (
Messner et al. 2019), the distinct effects of trust in the ruling party on tax mobilisation become even more pronounced. The inherent vulnerability of governance structures in these states elevates the role of trust in the ruling party as a stabilising factor.
The joint interaction between corruption and lack of trust significantly undermines taxpayer willingness to adhere to tax administration laws. This highlights the impact of corruption in exacerbating the effects of reduced trust on the compliance of taxpayers. The substantial significance of the interaction term, coupled with its negative coefficient, provides empirical evidence for the substantial and negative influence of corruption on tax compliance, especially where public trust in the government is weak. These findings support the notion that countries characterised by high corruption levels face heightened susceptibility to tax evasion. This suggests a nuanced relationship in which the impact of reduced trust on tax compliance is contingent on the prevailing level of corruption. Particularly in nations grappling with high corruption rates, the impact of trust deficiency on tax compliance is expected to be more pronounced. Therefore, it can be inferred that the lack of trust will have a more pronounced effect on tax compliance in countries plagued by rampant corruption.
The direct relationship between freedom of speech and trust in the ruling party, emphasised by our study, gains greater significance. In countries, where instability and political constraints often curtail open discourse (
Messner et al. 2019), the connection between freedom of speech and trust becomes a potent tool for rebuilding resilient democratic governance. The undemocratic nature of the state intensifies fears of reprisals for exposing corruption, as seen in
Figure 3. The lack of trust in ruling parties, evident in
Table 5, highlights the urgency of fostering an environment that champions freedom of speech. Ensuring this fundamental right is pivotal to enhancing transparency and cultivating public trust in governance.
Warren (
2017) underscores this nexus between freedom of speech, trust, and governance, affirming that open and inclusive political climates boost citizens’ trust, with freedom of speech catalysing transparency and accountability. The Reporters Without Borders World Press Freedom Index ranks Guinea (85), Mali (113), Zimbabwe (126), and Sudan (148) according to freedom of speech (
RSF 2023). This aligns with our argument on the positive link between freedom of speech and trust in the ruling party.
The findings of this study provide evidence of a complex relationship between education, political trust, and tax compliance behaviour. While it is initially surprising to note a negative correlation between education and trust in government, a closer examination of the data reveals an interesting finding. We can argue that as individuals become more educated, they become better informed about government activities and policies and, in some cases, result in lower trust. However, this scepticism can be seen as a positive outcome, as educated citizens are more likely to hold their government accountable for its actions, fostering a healthy democracy. The study found that more highly educated individuals are more willing to comply with tax administration laws. This suggests that despite their decreased trust in government, educated individuals still recognise the importance of tax compliance as a means of maintaining essential public services.
The results of this study indicate that, in comparison to residents of rural areas, those in urban areas exhibit lower trust levels in their parliament and local government council but demonstrate compliance with tax administration laws. The observed difference between urban and rural residents in trust toward parliament and local government councils could be attributed to bureaucratic inefficiencies, corruption concerns, or a lack of responsiveness in urban areas.
McKay et al. (
2023) found similar results and argued that at low levels of development, higher levels of trust are found among rural populations compared to those residing in urban areas. Moreover, unlike rural residents who have direct personal connections with their representatives, urban residents lack these connections with their representatives in parliament and local councils, hindering the development of a greater sense of trust. In contrast, tax administration laws are enforced more rigorously in urban settings compared to rural areas due to the concentration of businesses and financial institutions in urban settings. Like educated individuals, urban residents may have a clearer understanding of the direct and indirect benefits they receive from taxation, including improved public services.
Lack of public trust, corruption, and tax eviction presents formidable obstacles to Africa’s trajectory as a future global powerhouse. Restoring trust and mitigating corruption are essential prerequisites for attracting investments and nurturing economic growth, integral elements of Africa’s aspiration to assume global powerhouse. Robust tax revenue is imperative for investment in critical sectors such as education and healthcare, which are crucial for human advancement. Effective institutions are essential to address the build public trust in government and promoting transparent processes and accountability mechanisms. This intricate and multifaceted process demands transparent communication about the benefits of tax compliance and tangible enhancements in public services. As trust is restored, citizens’ adherence to tax law is expected to increase, generating income for critical services, and transforming Africa into a worldwide powerhouse.
8. Conclusions and Policy Implication
The pursuit of achieving the aspirations outlined in the Africa Agenda 2063 and fostering effective governance faces a critical challenge for African countries. Within this challenge, building trust and combating corruption emerges as a pivotal remedy. Recognising that restoring trust in government and fighting corruption surpasses mere legal battles demands a profound change in values, practices, and attitudes. Building public trust and promoting tax compliance result from a dedicated commitment to integrity, transparency, and accountability.
The findings of this study underscore the crucial role that trust, and perceptions of corruption play in shaping public opinions about governmental institutions. This intricate interplay takes on even greater importance in the context of state fragility, where institutions are already under strain. Corruption’s erosion of trust holds the potential to further diminish revenue generation, as citizens may be less inclined to contribute taxes when they lack confidence in compromised governance structures. Conversely, restoring trust through transparent electoral processes and robust anti-corruption measures becomes even more imperative. Citizens are more likely to cooperate when they have trust in the fairness and efficacy of government fiscal policies. Ultimately, this dynamic highlights the complex links between trust, corruption, and tax mobilisation within the broader framework of governance and public administration.
Our analysis demonstrates that corruption functions as a corrosive instrument. However, the destructive impacts of corruption go beyond governmental entities; they intertwine with the fragility of these states, further complicating their path to stability. Thus, the fight against corruption becomes not only a crucial governance step but also a lifeline for the stability of fragile states. It stands as an indispensable prerequisite for constructing a resilient governance framework that not only commands trust and encourages cooperation but also contributes to overall state stability.
As nations confront corruption, they are not merely combating an abstract concept; they are shaping the bedrock of governance and societal advancement even within precarious circumstances. This multifaceted struggle demands nurturing a cultural shift towards ethical conduct, transparency, and collective responsibility. The trajectory of trust and compliance hinges on the sincerity of these efforts. By pursuing anti-corruption measures and embracing open dialogues with citizens, governments can cultivate an environment where trust is not a fleeting sentiment but a strong and enduring cornerstone for socioeconomic transformation.
For Africa to realise its aspirations of becoming a future global powerhouse, it is imperative to address the intertwined challenges of corruption, government distrust, and state fragility. These issues not only undermine the foundations of effective governance and stability but also hinder economic growth and sustainable development. Without tackling these fundamental obstacles, Africa’s journey toward global prominence remains constrained, highlighting the pressing need for wide-ranging efforts to foster transparency, accountability, and resilient governance structures across the continent.
Although economic deterrence, fiscal exchange, and comparative treatment theories are also relevant, the findings of this study fit the theories of political legitimacy, social contract, and social effects. The findings show the relationship between election integrity and trust in government, as well as the influence of political legitimacy. Credible elections strengthen the legitimacy of the government by instilling confidence and encouraging tax compliance. The emphasis on government authority and public trust mirrors insights on eroding public trust due to corruption. The study also aligns with the social influence theory, connecting food security, education, and trust. Combating food insecurity has an influence on trust, mirroring how socio-economic factors shape trust in government.
The analysis presented in the discussion section underscores several key recommendations for addressing the intricate challenges facing Africa’s governance and development:
Given the critical role of transparent and non-partisan elections in building trust and legitimacy, African nations should prioritise electoral integrity. Implementing measures to ensure fair, credible, and accountable electoral processes can help restore citizen confidence in governmental institutions.
To counteract the pervasive issue of corruption, African governments must strengthen institutional capacity and resilience, and implement robust anti-corruption measures. Transparent governance mechanisms, rigorous oversight, and improved accountability are crucial to curb the corrosive effects of corruption on trust and stability.
Fostering an environment that champions freedom of speech is paramount. Governments should actively support open discourse, protect whistleblowers, and guarantee press freedom. This will not only rebuild trust but also promote transparency and accountability.
Recognising the deep impact of food security on trust, African governments must prioritise measures to ensure the basic needs of citizens are met. Wide-ranging social protection strategies can restore the social contract and demonstrate commitment to the well-being of citizens, thereby improving tax compliance.
Successfully addressing corruption and restoring government trust requires a sustained and long-term commitment. African leaders should prioritise these issues on national agendas, supported by concrete policy actions, transparent governance, and the participation of citizens and civil society.


