
Does Frequency or Amount Matter? An Exploratory Analysis the Perceptions of Four Universal Basic Income Proposals

 , , ,
, , ,
Abstract
:1. Introduction
2. Background
3. Perceptions
4. Methods
4.1. Study Design
4.2. Sample
4.3. Data Collection
- If every American received a payment of $500 per month with no strings attached and no matter their situation, how do you think most people would spend this money?
- If every American received a payment of $250 per month with no strings attached and no matter their situation, how do you think most people would spend this money?
- If every American received a one-time payment of $6000 with no strings attached and no matter their situation, how do you think most people would spend this money?
- If every American received a one-time payment of $3000 with no strings attached and no matter their situation, how do you think most people would spend this money?
4.4. Data Analysis
5. Results
6. Exploratory Analyses
7. Discussion
8. Conclusions
Author Contributions
Funding
Institutional Review Board Statement
Informed Consent Statement
Data Availability Statement
Conflicts of Interest
References
- Ananat, Elizabeth, Benjamin Glasner, Christal Hamilton, and Zachary Parolin. 2021. Effects of the Expanded Child Tax Credit on Employment Outcomes: Evidence from Real-World Data from April to September 2021. Working Paper No. 29823. Cambridge: National Bureau of Economic Research. [Google Scholar] [CrossRef]
- Andrade, Flavia C. D., Karen Z. Kramer, Andrew Greenlee, Adam N. Williams, and Ruby Mendenhall. 2019. Impact of the Chicago earned income tax periodic payment intervention on food security. Preventive Medicine Reports 16: 100993. [Google Scholar] [CrossRef] [PubMed]
- Barrow, Lisa, and Leslie McGranahan. 2000. The effects of the earned income credit on the seasonality of household expenditures. National Tax Journal 53: 1211–43. [Google Scholar] [CrossRef] [Green Version]
- Basic Income Earth Network. 2020. About Basic Income. Available online: https://basicincome.org/about-basic-income/ (accessed on 30 June 2022).
- Bellisle, Dylan. 2022. How the earned income tax credit sustains informal child-care arrangements with family members and helps maintain intergenerational relations. Social Service Review 96: 744–78. [Google Scholar] [CrossRef]
- Bellisle, Dylan, F. Andrade, Karen Kramer, Ruby Mendenhall, and Andrew Greenlee. 2021. Lessons from the Chicago EITC Periodic Payment Pilot and Implications for Illinois. Project for Middle Class Renewal—University of Illinois at Urbana-Champaign. Available online: http://publish.illinois.edu/projectformiddleclassrenewal/files/2021/09/Bellisle_Benefits-of-Recurring-Tax-Credit-Payments_2021.pdf (accessed on 30 June 2022).
- Bernhard, Rachel, and Sean Freeder. 2020. The More You Know: Voter Heuristics and the Information Search. Political Behavior 42: 603–23. [Google Scholar] [CrossRef]
- Board of Governors of the Federal Reserve System. 2020. Report on the Economic Well-Being of United States Households in 2019, Featuring Supplemental Data from April 2020. Available online: https://www.federalreserve.gov/publications/files/2019-report-economic-well-being-us-households-202005.pdf (accessed on 30 June 2022).
- Bruch, Sarah K., Marcia K. Meyers, and Janet C. Gornick. 2018. The consequences of decentralization: Inequality in safety net provision in the post–welfare reform era. Social Service Review 92: 3–35. [Google Scholar] [CrossRef]
- Bureau of Labor Statistics. 2019. Work Experience of the Population. US Department of Labor. Available online: https://www.bls.gov/news.release/pdf/work.pdf (accessed on 30 June 2022).
- Chandler, Jesse, Cheskie Rosenzweig, Aaron J. Moss, Jonathan Robinson, and Leib Litman. 2019. Online panels in social science research: Expanding sampling methods beyond Mechanical Turk. Behavior Research Methods 51: 2022–38. [Google Scholar] [CrossRef] [Green Version]
- Colledge, Mike, and Chris Martyn. 2017. Public Perspectives: Universal Basic Income. Ipsos. June 14. Available online: https://www.ipsos.com/en-ca/knowledge/society/public-perspectives-universal-basic-income-2017-06 (accessed on 30 June 2022).
- Data for Progress. n.d. Exploring a Working Families Tax Credit. Available online: https://www.dataforprogress.org/wftc (accessed on 3 February 2023).
- DeParle, Jason. 2021. In the Stimulus Bill, a Policy Revolution in Aid for Children. The New York Times. March 7. Available online: https://www.nytimes.com/2021/03/07/us/politics/child-tax-credit-stimulus.html (accessed on 30 June 2022).
- Epley, Nicholas, and Ayelet Gneezy. 2007. The framing of financial windfalls and implications for public policy. The Journal of Socio-Economics 36: 36–47. [Google Scholar] [CrossRef]
- Evans, David K., and Anna Popova. 2016. Cash transfers and temptation goods. Economic Development and Cultural Change 65: 189–221. [Google Scholar] [CrossRef] [Green Version]
- Farrell, Diana, Fiona Greig, and Amar Hamoudi. 2018. Deferred Care: How Tax Refunds Enable Healthcare Spending. JP Morgan Chase Institute. Available online: https://www.jpmorganchase.com/content/dam/jpmc/jpmorgan-chase-and-co/institute/pdf/institute-tax-refunds-healthcare-report.pdf (accessed on 30 June 2022).
- FINRA Investor Education Foundation. 2019. The State of United States Financial Capability: The 2018 National Financial Capability Study. Available online: https://www.usfinancialcapability.org/downloads/NFCS_2018_Report_Natl_Findings.pdf (accessed on 30 June 2022).
- Fouksman, Elizaveta, and Elise Klein. 2019. Radical transformation or technological intervention? Two paths for universal basic income. World Development 122: 492–500. [Google Scholar] [CrossRef]
- Freeland, Edward. 2019. What do Americans Think about Universal Basic Income? USC Schaeffer. August 26. Available online: https://healthpolicy.usc.edu/evidence-base/what-do-americans-think-about-universal-basic-income/ (accessed on 30 June 2022).
- Friedman, Milton. 1957. The permanent income hypothesis. In A theory of the Consumption Function. Reprint, 1. pbk. Print. Princeton: Princeton University Press, pp. 20–37. [Google Scholar]
- Ganong, Peter, and Pascal Noel. 2016. How Does Unemployment Affect Consumer Spending? Working Paper. Cambridge, MA: Harvard University. Available online: https://scholar.harvard.edu/files/ganong/files/ganong_jmp_unemployment_spending.pdf (accessed on 30 June 2022).
- Gilberstadt, Hannah. 2020. More Americans Oppose Than Favor the Government Providing a Universal Basic Income for All Adult Citizens. Pew Research Center. August 19. Available online: https://www.pewresearch.org/fact-tank/2020/08/19/more-americans-oppose-than-favor-the-government-providing-a-universal-basic-income-for-all-adult-citizens/ (accessed on 30 June 2022).
- Gilens, Martin. 2000. Why Americans Hate Welfare: Race, Media, and the Politics of Antipoverty Policy. Chicago: University of Chicago Press. Available online: https://press.uchicago.edu/ucp/books/book/chicago/W/bo3633527.html (accessed on 30 June 2022).
- Groot, Loek. 2004. Basic Income, Unemployment and Compensatory Justice. New York: Springer US. [Google Scholar] [CrossRef]
- Guzman, Gloria. 2020. Household Income: 2019. US Census Bureau. Available online: https://www.census.gov/content/dam/Census/library/publications/2020/acs/acsbr20-03.pdf (accessed on 30 June 2022).
- Halpern-Meekin, Sarah, Jennifer Sykes, Laura Tach, and Kathryn Edin. 2014. It’s Not Like I’m Poor: How Working Families Make Ends Meet in a Post-Welfare World. Berkeley: University of California Press. [Google Scholar]
- Halpern-Meekin, Sarah, Sara S. Greene, Ezra Levin, and Kathryn Edin. 2018. The rainy day Earned Income Tax Credit: A reform to boost financial security by helping low-wage workers build emergency savings. RSF: The Russell Sage Foundation Journal of the Social Sciences 4: 161–76. [Google Scholar] [CrossRef]
- Hamilton, Leah. 2020. Welfare Doesn’t Work: The Promises of Basic Income for a Failed American Safety Net. New York: Palgrave MacMillan. [Google Scholar]
- Hamilton, Leah, Meric Yorgun, and Allison Wright. 2021. “People Nowadays Will Take Everything They Can Get”: American Perceptions of Basic Income Usage. Journal of Policy Practice and Research 3: 77–95. [Google Scholar] [CrossRef]
- Hamilton, Leah, Stephen Roll, Mathieu Despard, Elaine Maag, Yung Chun, Laura Brugger, and Michal Grinstein-Weiss. 2022. The Impacts of the 2021 Expanded Child Tax Credit on Family Employment, Nutrition, and Financial Well-Being. Brookings Institution. Available online: https://www.brookings.edu/research/the-impacts-of-the-2021-expanded-child-tax-credit-on-family-employment-nutrition-and-financial-well-being/ (accessed on 30 June 2022).
- Hasdell, Rebecca. 2020. What We Know About Universal Basic Income: A Cross-Synthesis of Review. Basic Income Lab. Available online: https://basicincome.stanford.edu/uploads/Umbrella%20Review%20BI_final.pdf (accessed on 30 June 2022).
- Holder, Sarah. 2021. Guaranteed Income Gains Popularity after COVID-19. Bloomberg. January 4. Available online: https://www.bloomberg.com/news/articles/2021-01-04/guaranteed-income-gains-popularity-after-covid-19 (accessed on 30 June 2022).
- Holt, Steve, Kali Grant, and Funke Aderonmu. 2020. Matching Timing to Need: Refundable Tax Credit Disbursement Options; Georgetown Center on Poverty and Inequality. Available online: georgetownpoverty.org/issues/matching-timing-to-need (accessed on 30 June 2022).
- Hotz, Joseph V., and John K. Scholz. 2003. The Earned Income Tax Credit. In Means-Tested Transfer Programs in the United States. Chicago: University of Chicago Press. [Google Scholar]
- Jansson, Bruce S. 2014. The Reluctant Welfare State: Engaging History to Advance Social Work Practice in Contemporary Society, 8th ed. Boston: Cengage Learning. [Google Scholar]
- Johnson, Andrew F., and Katherine J. Roberto. 2020. The COVID-19 pandemic: Time for a universal basic income? Public Administration & Development 40: 232–35. [Google Scholar]
- Johnson, Richard W., and Oshua M. Wiener. 2016. A Profile of Frail Older Americans and Their Caregivers. Urban Institute, June 4. Available online: https://www.urban.org/research/publication/profile-frail-older-americans-and-their-caregivers (accessed on 30 June 2022).
- Kahneman, Daniel. 2013. Thinking, Fast and Slow, 1st ed. New York: Farrar, Straus and Giroux. [Google Scholar]
- Kandaswamy, Priya. 2021. Domestic Contradictions: Race and Gendered Citizenship from Reconstruction to Welfare Reform. Durham: Duke University Press Books. [Google Scholar]
- Kasy, Max. 2018. Why a Universal Basic Income Is Better Than Subsidies of Low-Wage Work. Available online: https://maxkasy.github.io/home/files/papers/UBI_EITC_Kasy.pdf (accessed on 30 June 2022).
- Kortenkamp, Katherine, Rob Geen, and Matthew Stagner. 2004. The role of welfare and work in predicting foster care reunification rates for children of welfare recipients. Children and Youth Services Review 26: 577–90. [Google Scholar] [CrossRef]
- Kramer, Karen Z., Flavia C. D. Andrade, Andrew J. Greenlee, Ruby Mendenhall, Dylan Bellisle, and Renee Lemons Blanks. 2019. Periodic earned income tax credit (EITC) payment, financial stress and wellbeing: A longitudinal study. Journal of Family and Economic Issues 40: 511–23. [Google Scholar] [CrossRef]
- Lake Research Partners. 2022. Public Opinion on the Child Tax Credit. Available online: https://economicsecurityproject.org/resource/public-opinion-on-the-child-tax-credit/ (accessed on 30 June 2022).
- Larson, Anita M., Shweta Singh, and Crystal Lewis. 2011. Sanctions and education outcomes for children in TANF families. Child & Youth Services 32: 180–99. [Google Scholar]
- Lau, Richard R., and David P. Redlawsk. 2001. Advantages and Disadvantages of Cognitive Heuristics in Political Decision Making. American Journal of Political Science 45: 951–71. [Google Scholar] [CrossRef] [Green Version]
- Levay, Kevin E., Jeremy Freese, and James N. Druckman. 2016. The Demographic and Political Composition of Mechanical Turk Samples. SAGE Open 6: 2158244016636433. [Google Scholar] [CrossRef] [Green Version]
- Lowrey, Annie. 2018a. Give People Money: How a Universal Basic Income Would End Poverty, Revolutionize Work, and Remake the World. Phoenix: Crown. [Google Scholar]
- Lowrey, Annie. 2018b. The Great, Overlooked Tax Policy for Getting People to work. The Atlantic. January 2. Available online: https://www.theatlantic.com/business/archive/2018/01/eitc-getting-people-to-work/549416/ (accessed on 30 June 2022).
- Mendenhall, Amy. 2006. A guide to the earned income tax credit: What everyone should know about the EITC. Journal of Poverty 10: 51–68. [Google Scholar] [CrossRef]
- Mendenhall, Ruby, Kathryn Edin, Susan Crowley, Jennifer Sykes, Laura Tach, Katrin Kriz, and Jeffrey R. Kling. 2012. The role of earned income tax credit in the budgets of low-income households. Social Service Review 86: 367–400. [Google Scholar] [CrossRef]
- Michelmore, Katherin, and Lauren Jones. 2015. Timing is money: Does lump-sum payment of tax credits induce high-cost borrowing? Proceedings of the Annual Conference on Taxation 108: 1–41. [Google Scholar]
- Moffitt, Robert A. 1979. The labor market replacement effect of a Negative Income Tax. Industrial and Labor Relations Review 33: 85–94. [Google Scholar] [CrossRef]
- Petersen, Michaek B., Daniel Sznycer, Leda Cosmides, and John Tooby. 2012. Who Deserves Help? Evolutionary Psychology, Social Emotions, and Public Opinion about Welfare. Political Psychology 33: 395–418. [Google Scholar] [CrossRef] [PubMed] [Green Version]
- Pew Research Center. 2021. Broad Public Support for Coronavirus Aid Package; Just a Third Say It Spends Too Much. Pew Research Center. Available online: https://www.pewresearch.org/politics/2021/03/09/broad-public-support-for-coronavirus-aid-package-just-a-third-say-it-spends-too-much/ (accessed on 30 June 2022).
- Quadagno, Jill. 1990. Race, class, and gender in the US welfare state: Nixon’s failed family assistance plan. American Sociological Review, 11–28. [Google Scholar] [CrossRef]
- Reinhart, R. J. 2018. Public Split on Basic Income for Workers Replaced by Robots. Gallup. February 26. Available online: https://news.gallup.com/poll/228194/public-split-basic-income-workers-replaced-robots.aspx (accessed on 30 June 2022).
- Rendleman, Hunter, and Jesse Yoder. 2019. How Do Government Benefits Affect Elections? Evidence from State Earned Income Tax Credits. Social Science Research Network 2019: 3454684. [Google Scholar] [CrossRef]
- Richards, Donald R., and Thomas L. Steiger. 2021. Value orientations and support for guaranteed income. Social Science Quarterly 102: 2733–51. [Google Scholar] [CrossRef]
- Roll, Stephen, Leah Hamilton, and Yung Chun. 2022. Expanded Child Tax Credit Payments Have Not Reduced Employment (p. 4). Social Policy Institute of Washington University in St. Louis. Available online: https://cpb-us-w2.wpmucdn.com/sites.wustl.edu/dist/a/2003/files/2021/12/CTC-and-Employment-01262022.pdf (accessed on 30 June 2022).
- Rubio, Marco. 2021. Rubio, Lee Push Pro-Work Child Tax Credit Amendment. U. S. Senator for Florida, Marco Rubio. Available online: https://www.rubio.senate.gov/public/index.cfm/2021/8/rubio-lee-push-pro-work-child-tax-credit-amendment (accessed on 30 June 2022).
- Shaefer, H. Luke, Xiaoqing Song, and Trina R. W. Shanks. 2013. Do single mothers in the United States use the Earned Income Tax Credit to reduce unsecured debt? Review of Economics of the Household 11: 659–80. [Google Scholar] [CrossRef] [Green Version]
- Shefrin, Hersh M., and Richard H. Thaler. 2004. Mental accounting, saving, and self-control. In Advances in Behavioral Economics. Princeton: Princeton University Press, pp. 395–428. [Google Scholar]
- Slack, Kristin S., Bong J. Lee, and Lance M. Berger. 2007. Do welfare sanctions increase child protection system involvement? A Cautious Answer. Social Service Review 81: 207–28. [Google Scholar] [CrossRef]
- Smeeding, Timothy M., Katherine R. Phillips, and Michael O’Connor. 2000. The EITC: Expectation, knowledge, use, and economic and social mobility. National Tax Journal 53: 1187–209. [Google Scholar] [CrossRef] [Green Version]
- Social Security Administration. 2018. Legislative History of the Social Security Disability Program. Washington, DC, USA. Available online: https://www.ssa.gov/legislation/DI%20legislative%20history.pdf (accessed on 30 June 2022).
- Soss, Joe, Richard C. Fording, and Sanford F. Schram. 2008. The color of devolution: Race, federalism, and the politics of social control. American Journal of Political Science 52: 536–53. [Google Scholar] [CrossRef] [Green Version]
- Soss, Joe, Richard C. Fording, and Sanford F. Schram. 2011. Disciplining the Poor: Neoliberal Paternalism and the Persistent Power of Race. Chicago: University of Chicago Press. [Google Scholar]
- Spotlight on Poverty and Opportunity. 2022. AEI/Brookings Working Group Calls For New Emphasis on Investments in Children. Spotlight on Poverty and Opportunity. Available online: https://spotlightonpoverty.org/spotlight-exclusives/aei-brookings-working-group-calls-for-new-emphasis-on-investments-in-children/ (accessed on 30 June 2022).
- Sykes, Jennifer, Katrin Križ, Kathryn Edin, and Sarah Halpern-Meekin. 2015. Dignity and dreams: What the earned income tax credit (EITC) means to low-income families. American Sociological Review 80: 243–67. [Google Scholar] [CrossRef]
- Taylor, Joy. 2021. Child Tax Credit 2021: Who Gets $3600? Will I Get Monthly Payments? And Other FAQs. Kiplinger. March 16. Available online: https://www.kiplinger.com/taxes/602431/child-tax-credit-2021-who-gets-3600-will-i-get-monthly-payments-and-other-faqs (accessed on 30 June 2022).
- US Census Bureau. 2019a. Age and Sex Composition in the United States: 2019. Available online: https://www.census.gov/data/tables/2019/demo/age-and-sex/2019-age-sex-composition.html (accessed on 30 June 2022).
- US Census Bureau. 2019b. United States Census Bureau QuickFacts: United States. Available online: https://www.census.gov/quickfacts/fact/table/US/PST045219 (accessed on 30 June 2022).
- Vallas, Rebecca, Melissa Boteach, and Rachel West. 2014. Harnessing the EITC and Other Tax Credits to Promote Financial Stability and Economic Mobility. Center for American Progress. Available online: https://www.americanprogress.org/issues/poverty/reports/2014/10/07/98452/harnessing-the-eitc-and-other-tax-credits-to-promote-financial-stability-and-economic-mobility/ (accessed on 30 June 2022).
- VanderWeele, Tyler J., and Maya B. Mathur. 2019. Some desirable properties of the Bonferroni correction: Is the Bonferroni correction really so bad? American Journal of Epidemiology 188: 617–18. [Google Scholar] [CrossRef]
- Ventry, Dennis J. 2000. The Collision of Tax and Welfare Politics: The Political History of the Earned Income Tax Credit, 1969–99. National Tax Journal 53: 983–1026. [Google Scholar] [CrossRef] [Green Version]
- Weber, Caroline. 2016. Does the earned income tax credit reduce saving by low-income households? National Tax Journal 69: 41–76. [Google Scholar] [CrossRef]
- West, Stacia, Amy Baker, Sukhi Samra, and Erin Coltrera. 2021. Preliminary Analysis: SEED’s First Year. Stockton Economic Empowerment Demonstration. Available online: https://static1.squarespace.com/static/6039d612b17d055cac14070f/t/603ef1194c474b329f33c329/1614737690661/SEED_Preliminary+Analysis-SEEDs+First+Year_Final+Report_Individual+Pages+-2.pdf (accessed on 30 June 2022).
- Widerquist, Karl. 2005. A failure to communicate: What (if anything) can we learn from the negative income tax experiments? Journal of Behavioral and Experimental Economics 34: 49–81. [Google Scholar] [CrossRef] [Green Version]
- Withorn, Ann. 2006. Looking up the slippery slope: Lessons from a lifetime of trying to figure out and fight poverty. In The Promise of Welfare Reform: Political Rhetoric and the Reality of Poverty in the Twenty-First Century. Edited by Keith Kilty and Elizabeth Segal. New York: The Hawthorne Press, pp. 7–21. [Google Scholar]
- Zelizer, Viviana A. 1989. The social meaning of money:” special monies”. American Journal of Sociology 95: 342–77. [Google Scholar] [CrossRef]
- Zelizer, Viviana A. 2017. The Social Meaning of Money: Pin Money, Paychecks, Poor Relief, and Other Currencies. Princeton: Princeton University Press. [Google Scholar]


| n | % | |
|---|---|---|
| Age | ||
| 18–24 | 142 | 17.0 |
| 25–29 | 140 | 16.7 |
| 30–39 | 251 | 30.0 |
| 40–49 | 154 | 18.4 |
| 50–64 | 102 | 12.2 |
| 65+ | 47 | 5.6 |
| Gender | ||
| Male | 322 | 38.5 |
| Female | 507 | 60.6 |
| Non-binary/third gender | 6 | 0.7 |
| Prefer not to say | 1 | 0.1 |
| Race/Ethnicity | ||
| White | 619 | 74.0 |
| Black or African American | 108 | 12.9 |
| American Indian or Alaska Native | 5 | 0.6 |
| Asian | 45 | 5.4 |
| Native Hawaiian or Pacific Islander | 3 | 0.4 |
| Other | 27 | 3.2 |
| Multiracial | 29 | 3.5 |
| Hispanic or Latino | ||
| Yes | 122 | 14.6 |
| No | 714 | 85.4 |
| Marriage Status | ||
| Married | 330 | 39.5 |
| Widowed | 22 | 2.6 |
| Divorced | 80 | 9.6 |
| Separated | 22 | 2.6 |
| Never married | 382 | 45.7 |
| Education | ||
| Less than a high school degree | 14 | 1.7 |
| High school degree or equivalent | 192 | 23.0 |
| Some college but no degree | 207 | 24.8 |
| Associate degree | 124 | 14.8 |
| Bachelor’s degree | 212 | 25.4 |
| Graduate degree | 87 | 10.4 |
| Employment | ||
| Employed, 1–39 h/week | 261 | 31.2 |
| Employed, 40 h/week or more | 264 | 31.6 |
| Not employed, looking for work | 110 | 13.2 |
| Not employed, not looking for work | 103 | 12.3 |
| Retired | 51 | 6.1 |
| Disabled, not able to work | 47 | 5.6 |
| Annual Household Income | ||
| $0–$9999 | 61 | 7.3 |
| $10,000–$19,999 | 76 | 9.1 |
| $20,000–$29,999 | 104 | 12.4 |
| $30,000–$39,999 | 87 | 10.4 |
| $40,000–$49,999 | 80 | 9.6 |
| $50,000–$59,999 | 108 | 12.9 |
| $60,000–$69,999 | 54 | 6.5 |
| $70,000–$79,999 | 57 | 6.8 |
| $80,000–$89,999 | 34 | 4.1 |
| $90,000–$99,999 | 37 | 4.4 |
| $100,000 or more | 138 | 16.5 |
| Total | 836 | 100 |
| Basic Income Plan | |||||||||||||
|---|---|---|---|---|---|---|---|---|---|---|---|---|---|
| $250/mth | $500/mth | $3000 Once | $6000 Once | Total | |||||||||
| Outcome | n | % | n | % | n | % | n | % | n | % | χ2 | p | V |
| Quit working or seeking work | 6 | 3.0 | 5 | 2.2 | 4 | 1.9 | 6 | 3.0 | 21 | 2.5 | 0.83 | 0.843 | 0.031 |
| Reduce working hours | 13 | 6.6 | 20 | 8.8 a | 7 | 3.3 | 3 | 1.5 b | 43 | 5.1 | 14.0 | 0.003 | 0.129 |
| Continue working as they do now | 29 | 14.6 | 22 | 9.7 | 20 | 9.5 | 14 | 7.0 | 85 | 10.2 | 6.71 | 0.082 | 0.090 |
| Put the money in savings | 15 | 7.6 | 16 | 7.0 | 17 | 8.1 | 16 | 8.0 | 64 | 7.7 | 0.20 | 0.977 | 0.016 |
| Pay down debt | 39 | 19.7 | 34 | 15.0 b | 60 | 28.4 a | 55 | 27.5 a | 188 | 22.5 | 15.4 | 0.002 | 0.136 |
| Apply the money towards education or student loans | 2 | 1.0 | 2 | 0.9 | 3 | 1.4 | 3 | 1.5 | 10 | 1.2 | 0.50 | 0.920 | 0.024 |
| Apply the money towards homeownership | 1 | 0.5 | 2 | 0.9 | 1 | 0.5 | 3 | 1.5 | 7 | 0.8 | 1.66 | 0.645 | 0.045 |
| Apply the money towards small business development | 0 | 0.0 | 2 | 0.9 | 1 | 0.5 | 3 | 1.5 | 6 | 0.7 | 3.41 | 0.333 | 0.064 |
| Apply the money towards regular expenses | 53 | 26.8 | 63 | 27.8 | 63 | 29.9 | 51 | 25.5 | 230 | 27.5 | 1.05 | 0.789 | 0.035 |
| Apply the money towards childcare | 1 | 0.5 | 0 | 0.0 | 1 | 0.5 | 1 | 0.5 | 3 | 0.4 | 1.13 | 0.771 | 0.037 |
| Apply the money towards healthcare expenses | 2 | 1.0 | 5 | 2.2 | 0 | 0.0 | 3 | 1.5 | 10 | 1.2 | 4.71 | 0.194 | 0.075 |
| Apply the money towards a major consumer purchase | 1 | 0.5 b | 13 | 5.7 a | 9 | 4.3 | 15 | 7.5 a | 38 | 4.5 | 12.2 | 0.007 | 0.121 |
| Spend it on small luxuries or non-essentials | 35 | 17.7 | 42 | 18.5 | 24 | 11.4 | 22 | 11.0 | 123 | 14.7 | 8.10 | 0.045 | 0.098 |
| Other (please explain) | 1 | 0.5 | 1 | 0.4 | 1 | 0.5 | 5 | 2.5 | 8 | 1.0 | 6.61 | 0.085 | 0.089 |
| Total | 198 | 100 | 227 | 100 | 211 | 100 | 200 | 100 | 836 | 100 | 69.4 | 0.002 | 0.166 |
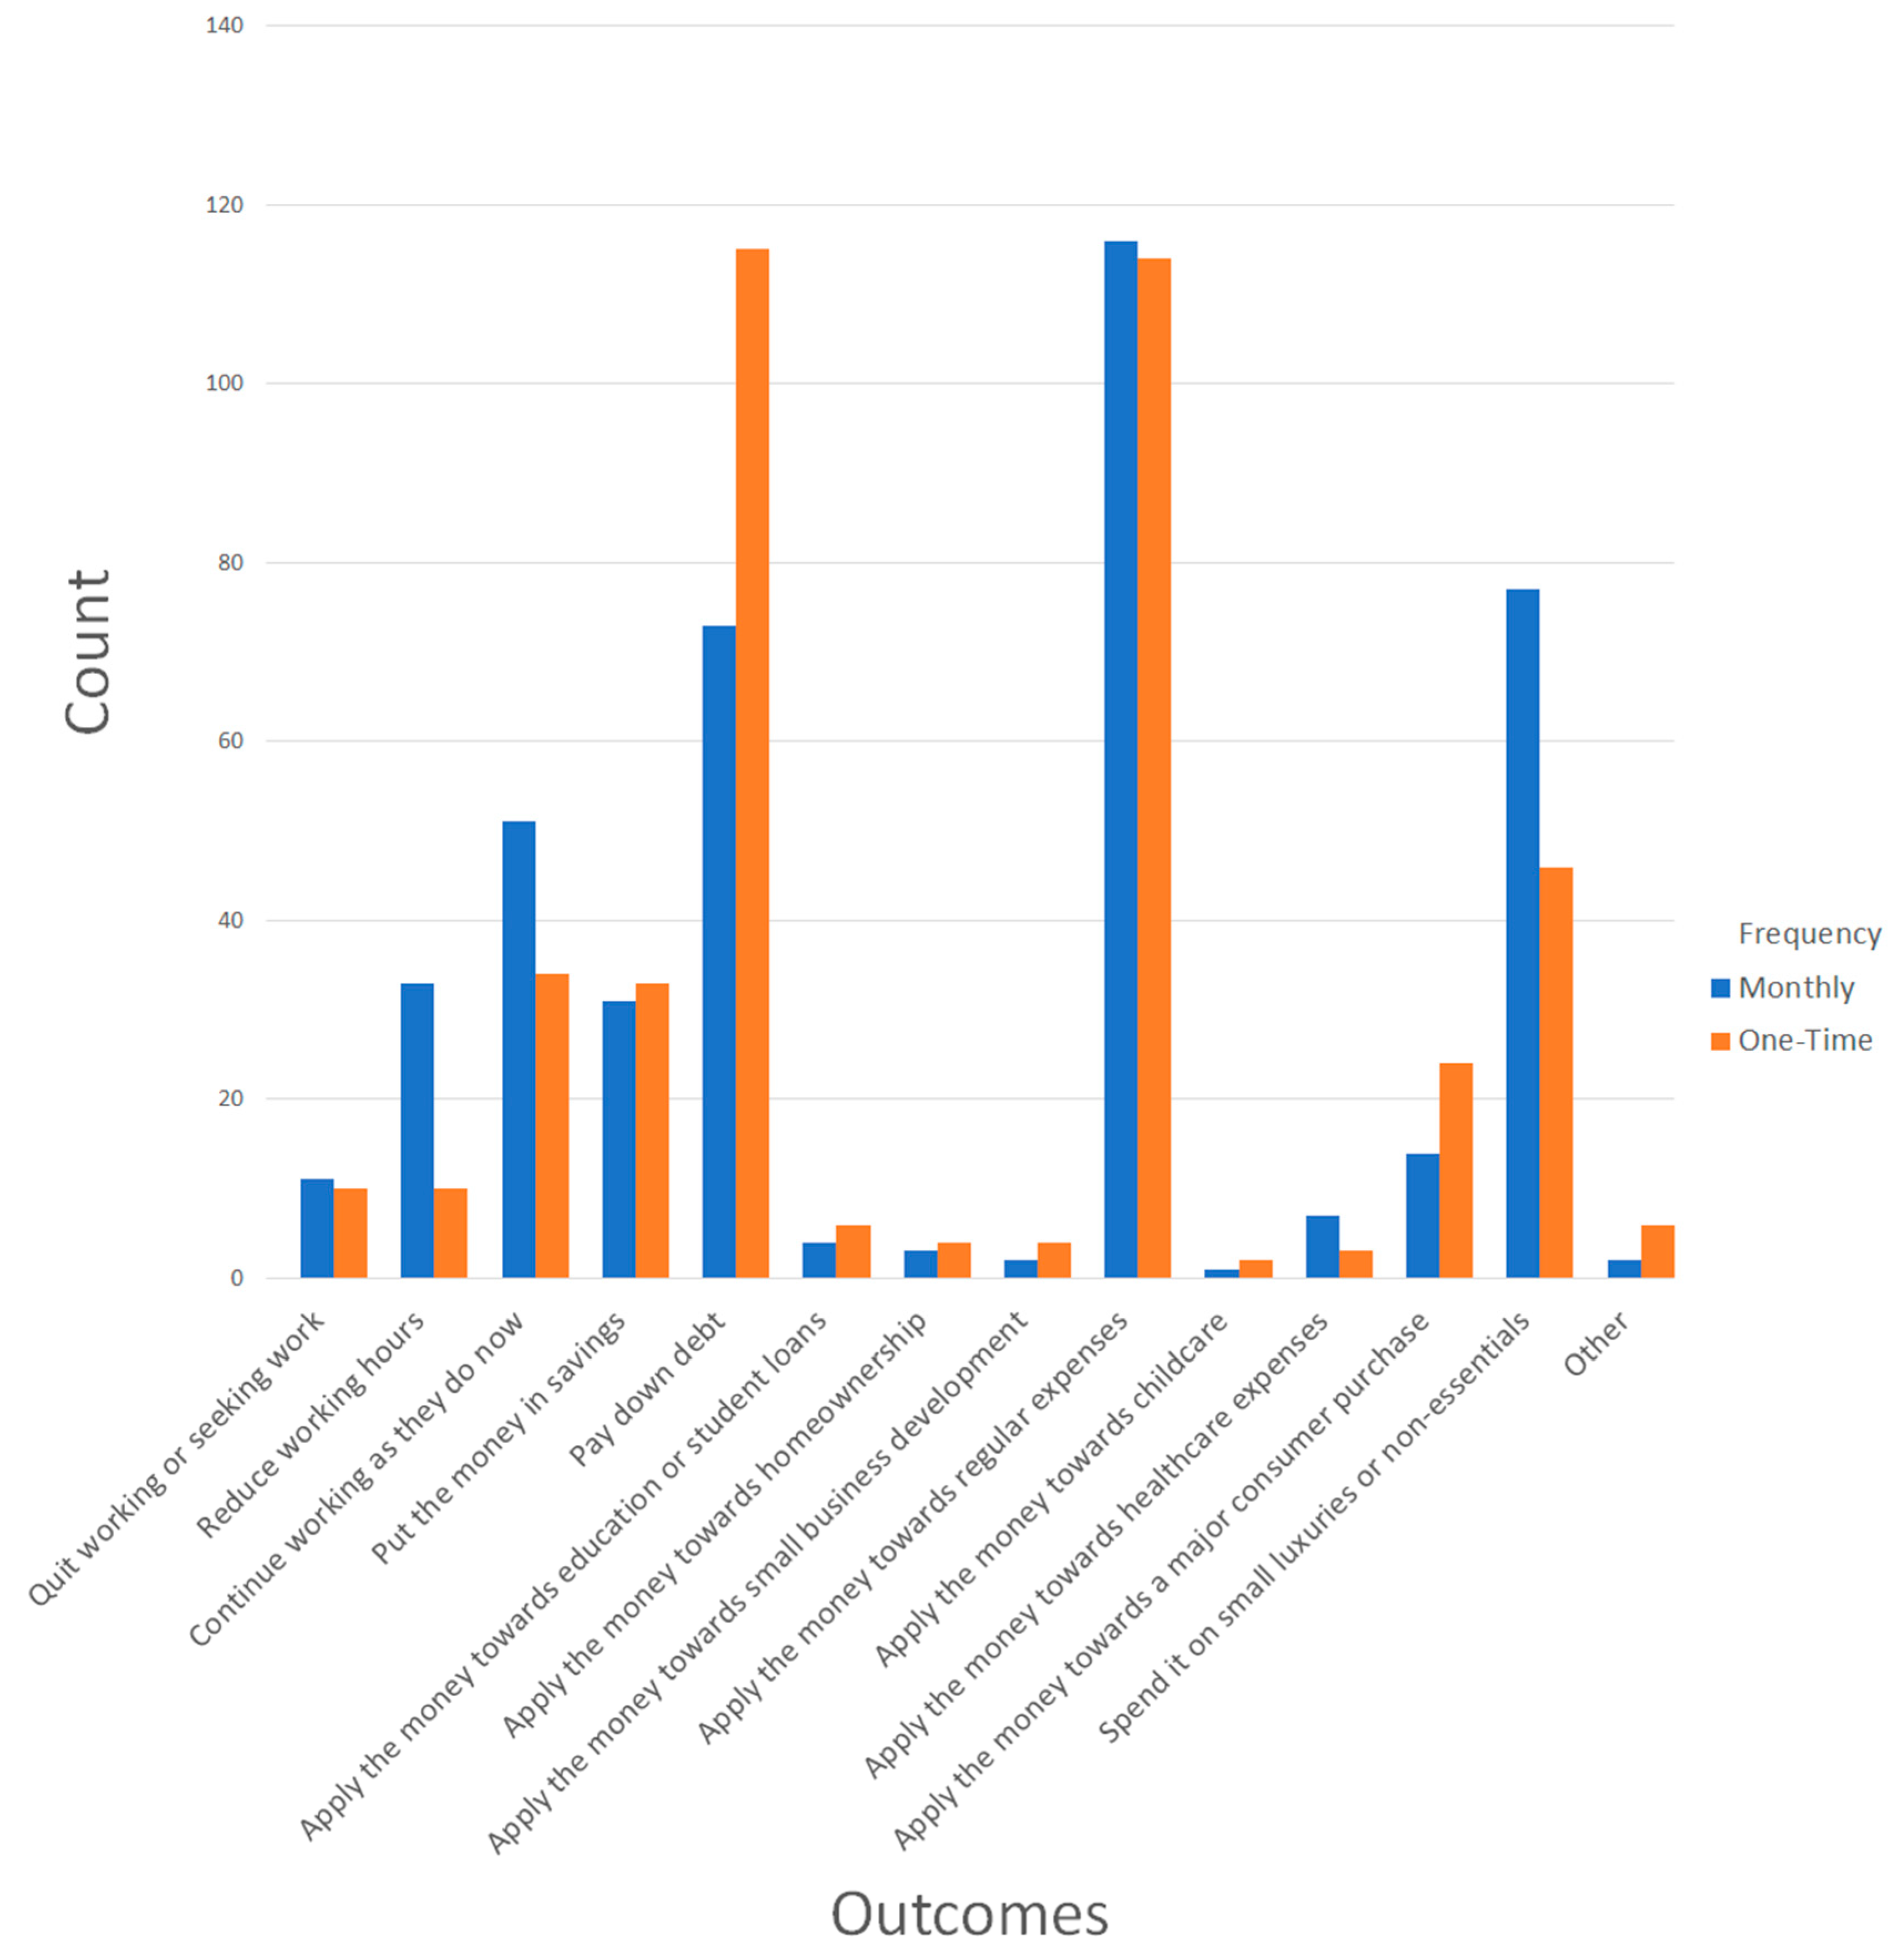
| Benefit Frequency | |||||||||
|---|---|---|---|---|---|---|---|---|---|
| Monthly | One-Time | Total | |||||||
| Outcome | n | % | n | % | n | % | χ2 | p | V |
| Quit working or seeking work | 11 | 2.6 | 10 | 2.4 | 21 | 2.5 | 0.02 | 0.886 | 0.005 |
| Reduce working hours | 33 | 7.8 a | 10 | 2.4 b | 43 | 5.1 | 12.2 | <0.001 | 0.121 |
| Continue working as they do now | 51 | 12.0 | 34 | 8.3 | 85 | 1.2 | 3.18 | 0.075 | 0.062 |
| Put the money in savings | 31 | 7.3 | 33 | 8.0 | 64 | 7.7 | 0.16 | 0.689 | 0.014 |
| Pay down debt | 73 | 17.2 b | 115 | 28.0 a | 188 | 22.5 | 14.0 | <0.001 | 0.129 |
| Apply the money towards education or student loans | 4 | 0.9 | 6 | 1.5 | 10 | 1.2 | 0.48 | 0.490 | 0.024 |
| Apply the money towards homeownership | 3 | 0.7 | 4 | 1.0 | 7 | 0.8 | 0.18 | 0.671 | 0.015 |
| Apply the money towards small business development | 2 | 0.5 | 4 | 1.0 | 6 | 0.7 | 0.74 | 0.389 | 0.030 |
| Apply the money towards regular expenses | 116 | 27.3 | 114 | 27.7 | 230 | 27.5 | 0.02 | 0.886 | 0.005 |
| Apply the money towards childcare | 1 | 0.2 | 2 | 0.5 | 3 | 0.4 | 0.37 | 0.543 | 0.021 |
| Apply the money towards healthcare expenses | 7 | 1.6 | 3 | 0.7 | 10 | 1.2 | 1.49 | 0.223 | 0.042 |
| Apply the money towards a major consumer purchase | 14 | 3.3 | 24 | 5.8 | 38 | 4.5 | 3.12 | 0.077 | 0.061 |
| Spend it on small luxuries or non-essentials | 77 | 18.1 a | 46 | 11.2 b | 123 | 14.7 | 7.99 | 0.005 | 0.098 |
| Other (please explain) | 2 | 0.5 | 6 | 1.5 | 8 | 1.0 | 2.16 | 0.142 | 0.051 |
| Total | 425 | 100 | 411 | 100 | 836 | 100 | 40.6 | <0.001 | 0.220 |
Disclaimer/Publisher’s Note: The statements, opinions and data contained in all publications are solely those of the individual author(s) and contributor(s) and not of MDPI and/or the editor(s). MDPI and/or the editor(s) disclaim responsibility for any injury to people or property resulting from any ideas, methods, instructions or products referred to in the content. |
© 2023 by the authors. Licensee MDPI, Basel, Switzerland. This article is an open access article distributed under the terms and conditions of the Creative Commons Attribution (CC BY) license (https://creativecommons.org/licenses/by/4.0/).
Share and Cite
Hamilton, L.; Despard, M.; Roll, S.; Bellisle, D.; Hall, C.; Wright, A. Does Frequency or Amount Matter? An Exploratory Analysis the Perceptions of Four Universal Basic Income Proposals. Soc. Sci. 2023, 12, 133. https://doi.org/10.3390/socsci12030133
Hamilton L, Despard M, Roll S, Bellisle D, Hall C, Wright A. Does Frequency or Amount Matter? An Exploratory Analysis the Perceptions of Four Universal Basic Income Proposals. Social Sciences. 2023; 12(3):133. https://doi.org/10.3390/socsci12030133
Chicago/Turabian StyleHamilton, Leah, Mathieu Despard, Stephen Roll, Dylan Bellisle, Christian Hall, and Allison Wright. 2023. "Does Frequency or Amount Matter? An Exploratory Analysis the Perceptions of Four Universal Basic Income Proposals" Social Sciences 12, no. 3: 133. https://doi.org/10.3390/socsci12030133