Article

“The Only Thing We Have to Fear Is Fear Itself”: Predicting College Students’ Voting Behavior Using the Extended Parallel Process Model

1
Hugh Downs School of Human Communication, Arizona State University, Tempe, AZ 85281, USA
2
W. P. Carey School of Business, Arizona State University, Tempe, AZ 85287, USA
*
Author to whom correspondence should be addressed.
Soc. Sci. 2023, 12(11), 628; https://doi.org/10.3390/socsci12110628
Submission received: 31 August 2023 / Revised: 10 October 2023 / Accepted: 3 November 2023 / Published: 10 November 2023
(This article belongs to the Special Issue Political Communication and Emotions)

Abstract

:
This longitudinal study examines how well the EPPM predicts and explains college students’ voting behavior. One-hundred-and-seventy-eight undergraduate students filled out a survey at two points in time: (1) four weeks before and (2) one week after the 2022 midterm election. As hypothesized, the EPPM accurately predicted danger control outcomes (i.e., severity, susceptibility, self-efficacy, and response efficacy predicted voting intentions, and voting intentions predicted voting behavior). The EPPM also predicted one fear control outcome (though only the path between severity and fear was significant). More specifically, the EPPM explained 45.7% of the variance in intention, 81.7% of the variance in behavior, 77% of the variance in contesting, and 33.6% of the variance in suppression.

1. Introduction

Political commentators have noted the pervasive attitude of fear marking divisions in modern American politics. In a recent popular analysis, political organizer Eric Liu clarified the stakes of growing divisiveness between American political parties by saying, “The United States does not get to assume it lasts forever” (Brownstein 2023). Brownstein (2023) explained that contentious issues like abortion and gun rights are perceived not just as differences in political opinions but also as threats to fundamental worldviews. The 2022 midterm elections were selected as they were marked by (1) contention over key issues including reproductive healthcare (Lewis and Stryker 2023), (2) the possibility of a so-called red wave (Frey 2022), and (3) political conflicts stemming from continued claims of a stolen 2020 election (Hodge et al. 2023). Perhaps now like never before, Americans fear what will become of their lives if the other party wins an election. In this context, our study investigated the relationship between fear and voting behavior among American college students during the 2022 midterm elections.

1.1. Fear in Political Communication and Decision Making

Using fear to persuade an audience has a long but fraught history in rhetoric and communication studies. Fear appeals have been criticized for their ethical implications and their tendency to promote irrational, emotional reasoning. Plato and Aristotle famously debated the appropriateness of fear-building rhetoric, with Plato in favor of avoiding emotion-based decision making (Pfau 2007). More recently, Hastings et al. (2004) criticized fear appeals for producing maladaptive responses such as chronic anxiety. In response, rhetoricians recommend combining fear appeals with messaging that builds self-efficacy or confidence in a fearful person’s ability to resolve the threat (Pfau 2007). Fear appeals in persuasive communication are common in recent political (Widmann 2021), marketing (Shen and Kim 2022), and health contexts (Chen and Yang 2018).
Today, it may seem that politics are already irrational and emotional enough, as American Democrats and Republicans are increasingly critical of members of the other party. Americans view members of their own party as more moral, open-minded, and honest (Pew Research Center 2022). This may be related to how fear is neurologically processed. Recent neuroimaging evidence suggests that encountering political information that contradicts core beliefs activates the amygdala, the fear control center of the brain (Kaplan et al. 2016). This study suggests deep biological roots of fear-based political judgments. For some, fear is also evoked by election results. After the 2016 U.S. presidential election, sexual and gender minorities feared an increase in structural stigma, hate speech, and discrimination (Fredrick et al. 2022; Veldhuis et al. 2018). Fear may be an integral component of political decision making because political decisions seem justifiably to induce fear.
Given the salient consequences of political processes, fear becomes highly relevant in persuasive communication and decision making. From a Hobbesian perspective, electing a government is a process of controlling fear to create a civil, governed society which relieves voters from life’s chaotic true nature (Blits 1989). From early rhetoric and philosophy, fear emerges as an intrinsic and persuasive component of political decision making. Fear is theorized to be particularly motivating in decision making because it interrupts well-formed habits and increases information seeking (Wagner and Morisi 2019). In this way, fear can aid or enhance decision making.
Perhaps for this reason, fear appeals routinely appear in a variety of political communication contexts. While deploying threatening communication is deemed theoretically ill advised, it nevertheless remains popular among politicians to grab the public’s attention (Peters et al. 2013). While politicians generally use emotional appeals to connect with voters, fear appeals are particularly common among populist politicians (Widmann 2021) and challengers rather than incumbents (Brader 2006). When used strategically, fear appeals can help politicians overcome partisan habits to attract voters from a wide range of ideologies (Scheller 2019). In summary, fear appeals serve a variety of functions for political communicators.
Evoking negative emotions motivates citizens’ behavioral responses. In times of national crisis, such as after the September 11 terrorist attacks, fearful people had higher risk perceptions and took more precautionary measures (Lerner et al. 2003). In the same study, fear was also found to predict greater pessimism. Lerner et al. (2003) explained that if people have a pessimistic outlook, they are even more fearful of an opposing politician’s victory. In a study of presidential elections from 1980 to 2008, anger was consistently found to motivate political participation beyond voting, including attending a rally, donating to, or working for a campaign. Relatedly, anxiety was found to have effects on political participation, motivating smaller actions like talking to others about voting (Valentino et al. 2011).
Health communication also demonstrates the persuasiveness of fear appeals. Developing the extended parallel processing model (EPPM), Witte (1992) tested the effect of fear on cognitive and emotional responses to AIDS prevention. Fear appeals were found to be most successful when they activate cognitive, rather than strictly emotional, responses. An early meta-analysis of 98 studies showed that stronger fear responses made messages more persuasive (Witte and Allen 2000). Recent research debates the effectiveness of fear appeals for persuasion, noting that triggering defensive reactions can undermine health behavioral change (Moussaoui et al. 2021). Nevertheless, fear appeals are routinely utilized in health contexts including anti-drunk driving (Lewis et al. 2007), smoking cessation (Emery et al. 2014), skin cancer prevention (Shi and Smith 2016), and breast cancer self-examination (Chen and Yang 2018).
Given the empirical evidence for the persuasiveness of fear, integrating decision-making theory helps explain how fear motivates information processing and behavioral responses. In this respect, the EPPM has been predominantly applied to health contexts. However, given the model’s mapping of message processing and appraisal to outcomes, the EPPM lends explanatory and predictive power to studies of political behavior. In an age of political divisiveness and contention, the EPPM offers insights into how perceptions of danger and fear influence voting behavior. Accordingly, our study used a two-wave longitudinal survey design to test the EPPM with a sample of college students. A detailed discussion of the EPPM and the resulting hypotheses follows.

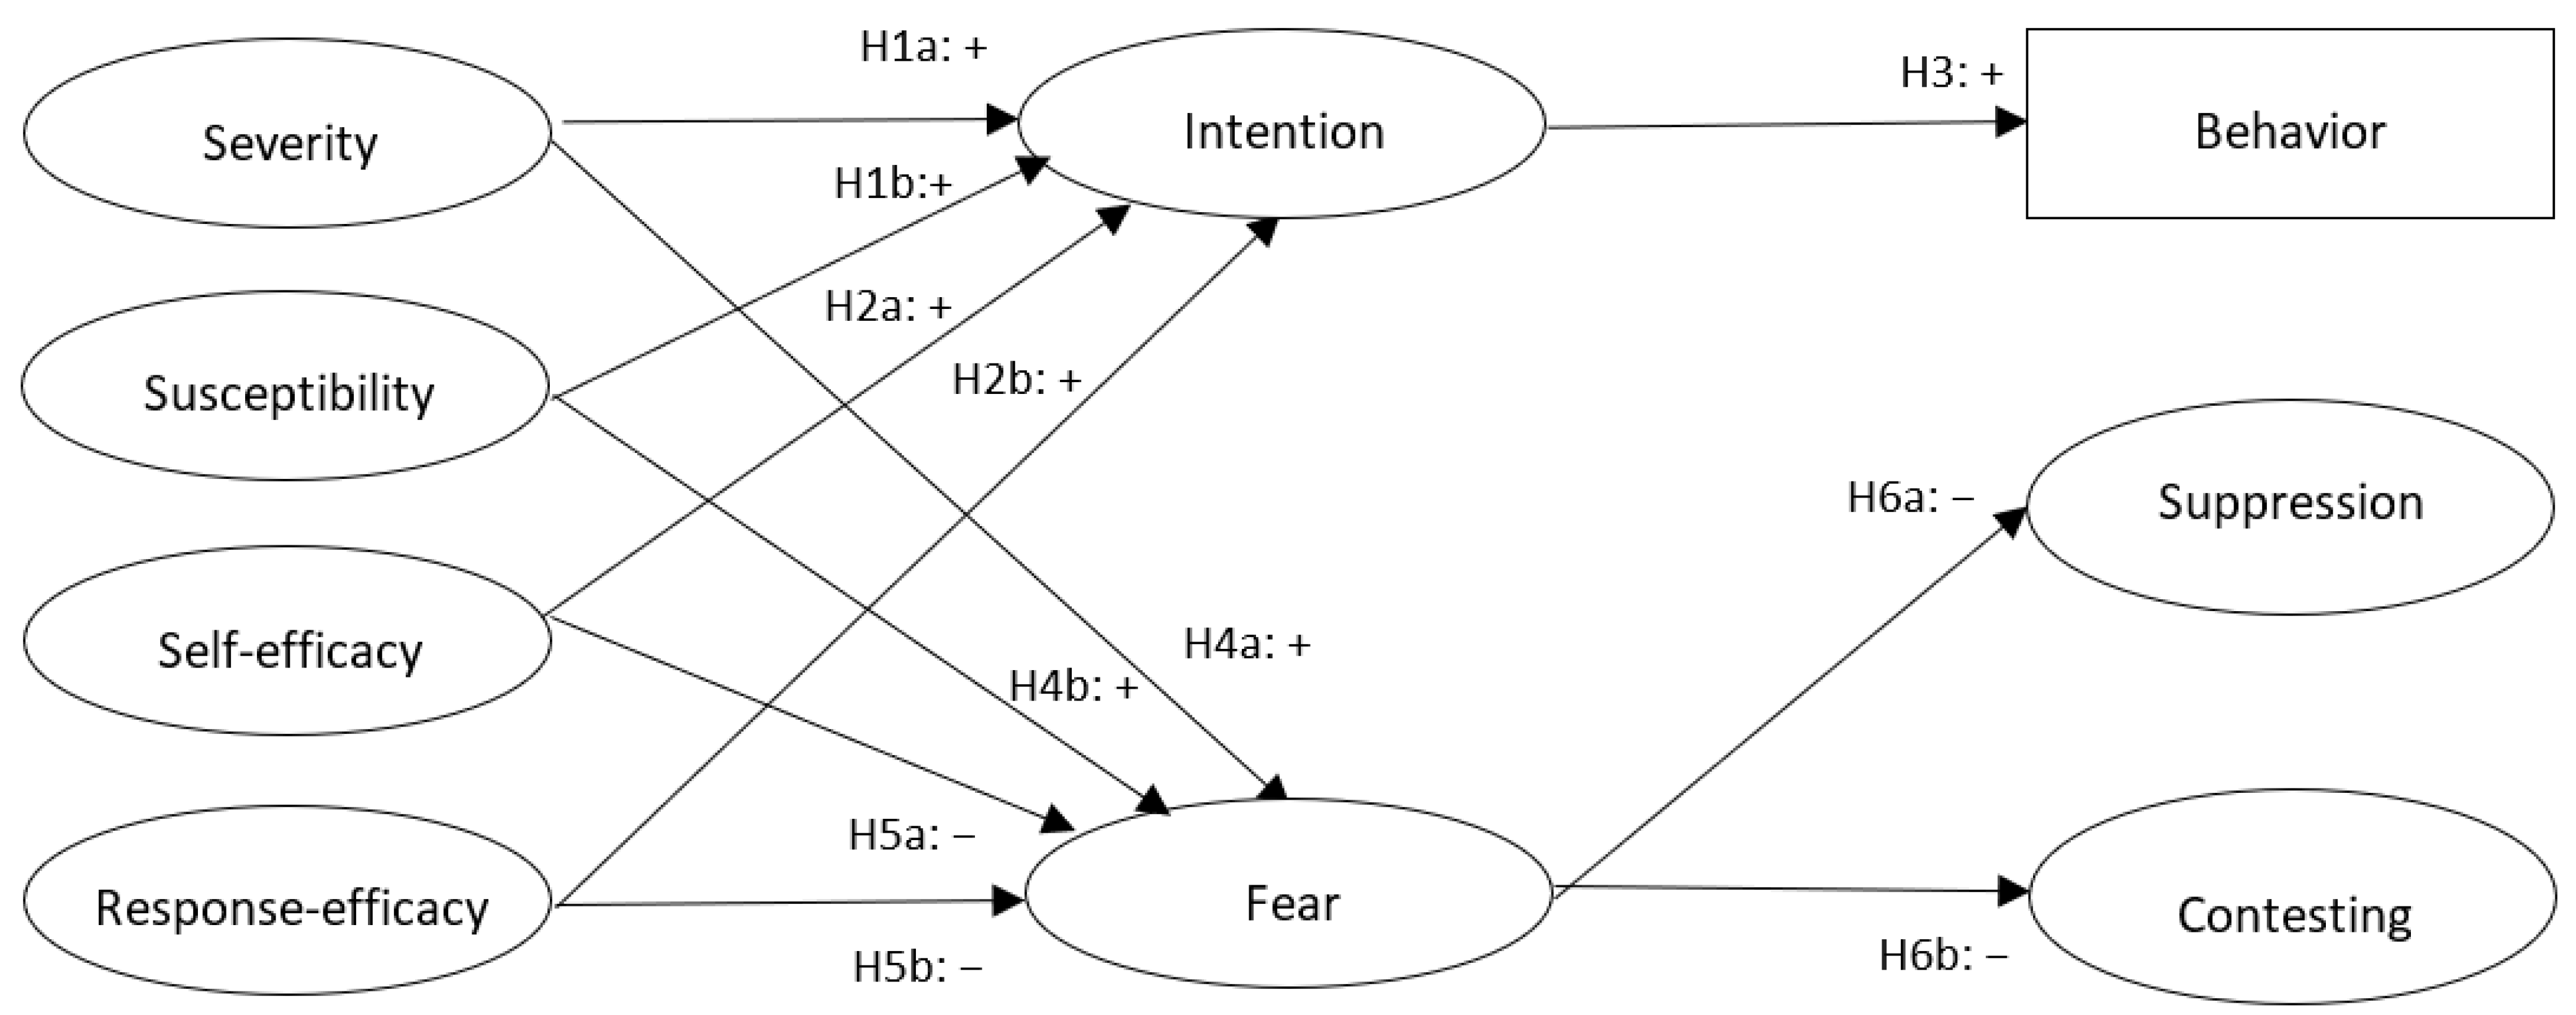
1.2. The Extended Parallel Process Model

The EPPM (Witte 1992) was developed to advance our understanding of the impact of perceived threat and perceived efficacy on intentions and behaviors. The EPPM posits a process by which individuals evaluate fear appeal messages. A fear appeal is a persuasive message designed to change intentions or behaviors by producing the emotional response of fear through the depiction of a significant and personally relevant threat. For a fear appeal to be persuasive, the message must also outline feasible ways in which audience members can reduce or avoid the threat (Mongeau 2012). The EPPM suggests a fear appeal consists of three key components: (a) threat, (b) efficacy, and (c) fear (Witte 1992; Witte and Allen 2000). These three key components will be discussed below.
Perceived threat occurs when an individual believes a danger exists in their environment that may be harmful to health or well-being (Witte 1992). In the context of voting, perceived threat involves the risk of an individual’s preferred political party losing an election and the consequences that might follow. The EPPM posits that perceived threat is composed of two key dimensions: (a) severity and (b) susceptibility. Perceived severity involves beliefs about how much harm the threat will cause (i.e., the seriousness of the threat) (e.g., “My preferred party losing the 2022 midterm elections would have serious consequence for this country”). Perceived susceptibility is the likelihood that an individual will experience the threat (e.g., “My preferred party is at risk of losing the 2022 midterm elections”).
According to the EPPM, when both severity and susceptibility are high, individuals become motivated and take action to reduce the threat (Witte 1992; Witte and Allen 2000). However, when perceived threat is low, individuals are not motivated to process the message further and no intention or behavioral change occurs.
The second key component to fear appeals is perceived efficacy, which relates to how effective the recommended response will be in avoiding the threat (Witte 1992). Perceived efficacy is also composed of two components: (a) response efficacy and (b) self-efficacy. Perceived response efficacy refers to an individual’s thoughts about how effective the message’s recommended response will be in averting the threat (e.g., “Voting in the 2022 midterm election is an effective way to make sure my preferred party will win the election”). Perceived self-efficacy focuses on the message recipients’ beliefs about their ability to perform the recommended response and avoid the threat (e.g., “I am able to vote in the 2022 midterm elections”). These two components of efficacy regulate whether individuals become motivated to control their fear or the danger of the threat (Witte and Allen 2000).
The last essential component of a fear appeal is fear, which can be considered a negatively valenced internal emotional reaction that is accompanied by physiological arousal (Witte and Allen 2000; Mongeau 2012). This negative, subjective experience occurs when individuals are exposed to a personally relevant and severe threat. According to the EPPM, different combinations of threat and efficacy can lead to two different responses: (a) a danger control (i.e., adaptive) response or (b) a fear control (i.e., maladaptive) response (Witte 1992). A discussion of the differing ways in which each EPPM variable can interact to elicit either adaptive or maladaptive responses follows. In addition, a rationale is provided for each hypothesis and research question posited.

1.2.1. Danger Control

When an individual perceives high threat and high efficacy, they will be motivated to control the danger (Witte and Allen 2000). This adaptive danger control response is a cognitive problem-solving process in which individuals become motivated to protect themselves from a given threat (Witte 1992).
The EPPM suggests that danger control (i.e., protection motivation) processes are dominant and tend to elicit message acceptance and intention or behavioral change when both threat and efficacy are high (Witte 1992). Stated differently, when both threat and efficacy are high individuals should experience (a) greater protection motivation changes (i.e., intention) and (b) adaptive behavioral changes (Witte 1992). It is important to note that the proposed relationship between intention and behavior is also consistent with differing theoretical perspectives such as the Reasoned Action Approach (Fishbein and Ajzen 2010) and Social Cognitive Theory (Bandura 2004). Given these predictions by the EPPM, the following hypotheses are posited:
H1a. 
Severity will be positively related to voting intention.
H1b. 
Susceptibility will be positively related to voting intention.
H2a. 
Self-efficacy will be positively related to voting intention.
H2b. 
Response efficacy will be positively related to voting intention.
H3. 
Voting intention will be positively related to voting behavior.

1.2.2. Fear Control

In contrast, maladaptive fear control processes begin to dominate over danger control processes when an individual has high perceived threat but low perceived efficacy (i.e., doubting recommended response or ability to perform recommended response) (Witte and Allen 2000). Fear control processes are considered an emotional coping process consisting of psychological reactions (Witte 1992). The following sections will explicate the relationship between threat, efficacy, and fear when fear control processes dominate.
As previously mentioned, fear is the result of exposure to a personally relevant or severe threat and can be considered a negatively valenced emotional reaction accompanied by psychological reaction (Witte and Allen 2000; Mongeau 2012). Witte (1992) notes that when perceived threat is high, “the greater the fear aroused” (p. 339). Meta-analytic results are consistent with this prediction (e.g., Witte and Allen 2000). Given the consistent findings from these meta-analyses, the following hypotheses are posited:
H4a. 
Severity will be positively related to fear.
H4b. 
Susceptibility will be positively related to fear.
The EPPM also suggests that when perceived efficacy is low, fear will be increased (Witte 1992). Although, to our knowledge, many fewer studies (and no meta-analyses) have examined the efficacy–fear relationship, past research suggests that, following exposure to an efficacy message, fear significantly decreases (Dillard et al. 2017). However, in each of these studies, fear was found to have little or no relationship with efficacy in SEM models. Results from more recent research suggest a negative association between perceived efficacy and fear, but it did not reach significance (Roberto 2022; Roberto et al. 2021). Given the conflicting results from past studies examining the efficacy–fear relationship, the following hypotheses are posited:
H5a. 
Self-efficacy will be negatively related to fear.
H5b. 
Response efficacy will be negatively related to fear.
Furthermore, the EPPM posits that when fear control processes dominate and there is high perceived threat but low perceived efficacy, defensive motivation occurs. Stated differently, individuals that do not have the efficacy to eliminate the threat will use defensive reactions to reduce their fear (Dillard et al. 2018). However, findings from past research seem to be contradictory or inconsistent regarding the fear control processes within the EPPM (e.g., Birmingham et al. 2015; Popova 2012; Roberto et al. 2021; Roberto and Zhou 2023). Defensive motivation causes individuals to reduce fear through suppression, contesting, fatalism, denial, or the occasional boomerang effect (Dillard and Shen 2005). Given that suppression and contesting are the most studied (Dillard et al. 2017), the current study focuses on these two fear control processes in the context of voting behavior.
Suppression (also called defensive avoidance) occurs when an individual consciously minimizes or suppresses thoughts of danger (Dillard et al. 2018). Contesting (also called reactance or message derogation) involves rejecting the message and/or source or message derogation (Dillard and Shen 2005; Dillard et al. 2018). These actions taken to reduce fear typically result in no intention or behavioral change. Hence, the following hypotheses are posited:
H6a. 
Fear will be negatively related to suppression.
H6b. 
Fear will be negatively related to contesting.
A graphic representation of all hypotheses can be found in Figure 1.

2. Methods

A longitudinal study on college student voting behavior was conducted during the Fall 2022 semester. To be eligible to take part in this study, participants had to be U.S. citizens and at least 18 years old. Time 1 data were collected over a seven-day period 30–40 days before the election, and Time 2 data were collected over a seven-day period immediately following the election.

2.1. Participants

Undergraduate students enrolled in eight undergraduate communication classes at a large southwestern university were invited to participate in this study. Overall, 381 participants completed the Time 1 survey; 187 (49.1%) of these participants completed the Time 2 survey, and we were able to link 178 (95.2%) of the Time 2 participants’ data using our linking questions (see below). Therefore, the hypotheses will be tested, and the research questions will be answered, using these 178 participants.
The final sample was 37.5% male, 62.5% female, with a mean age of 19.94 (SD = 2.91). The sample was 76.1% white, 12.5% Asian, 5.1% black or African American, 15.04% other. Further, 26.3% of participants identified as Hispanic or Latino/a. In terms of political philosophy, 50.6% described themselves as “very”, “somewhat”, or “a little” liberal, 19.9% described themselves as “neither liberal nor conservative”, and 29.6% described themselves as “very”, “somewhat”, or “a little” conservative. Further, 41.5% described themselves as democrats, 27.8% described themselves as independents, 24.4% described themselves as republicans, and 6.3% described themselves as “something else”. Finally, 75.6% of participants said that they were registered to vote.

2.2. Instrumentation

Full information for each measure is presented below. All constructs were measured at Time 1, except for voting behavior, which was measured at Time 2. Table 1 contains mean values, standard deviations, Cronbach’s alphas, and survey items for all Time 1 constructs.

2.2.1. Threat and Efficacy

The threat and efficacy measures were adapted from Witte et al.’s (1996) Risk Behavior Diagnostic Scale (RBDS) (see also Roberto 2022; Roberto et al. 2021; Roberto and Zhou 2023). All four threat and efficacy constructs were measured using four five-point Likert-type items ranging from “strongly disagree” to “strongly agree”.

2.2.2. Fear

Fear was measured using procedures outlined by Witte et al. (1996). Specifically, participants were asked how their preferred party losing the midterm elections made them feel using six items. Response options ranged from “none of this feeling” to “a great deal of this feeling”.

2.2.3. Danger Control (i.e., Voting Intention and Behavior)

Intention was measured at Time 1 using four five-point Likert-type items ranging from “strongly disagree” to “strongly agree” (Fishbein and Ajzen 2010). Behavior was measured at Time 2 by asking, “Did you vote in the 2022 midterm election?” (Fishbein and Ajzen 2010). The response options for the behavior item were “yes” (selected by 50.6% of participants) and “no” (selected by 48.9% of participants).

2.2.4. Fear Control (i.e., Suppression and Contesting)

The suppression and contesting items were assessed with three five-point Likert-type items ranging from “strongly disagree” to “strongly agree” (Dillard et al. 2018).

2.2.5. Linking Questions

To link participants’ Time 1 and Time 2 responses, we created a unique code for each participant (Schnell et al. 2010). This code was created using the answers to the following questions: (1) “on what day of the month were you born?” (response categories ranged from 01 to 31), and (2) “what are the last two digits of your phone number?” (response categories ranged from 00 to 99). When identical codes were generated for multiple participants, responses to questions regarding gender, age, or last digit of their student ID were used to match participants’ responses.

2.3. Procedures

Data collection took place at two points in time using Qualtrics Survey Software. Participants received extra credit for each survey they submitted. All procedures were approved by the sponsoring university’s IRB. The 2022 midterm elections were held on November 8th. Time 1 data were collected between 27 September and 4 October 2022 (i.e., 30–40 days prior to the election), and Time 2 data were collected between 9 November 9 and 14 November 2022 (immediately after the election).

2.4. Data Analytics Plan
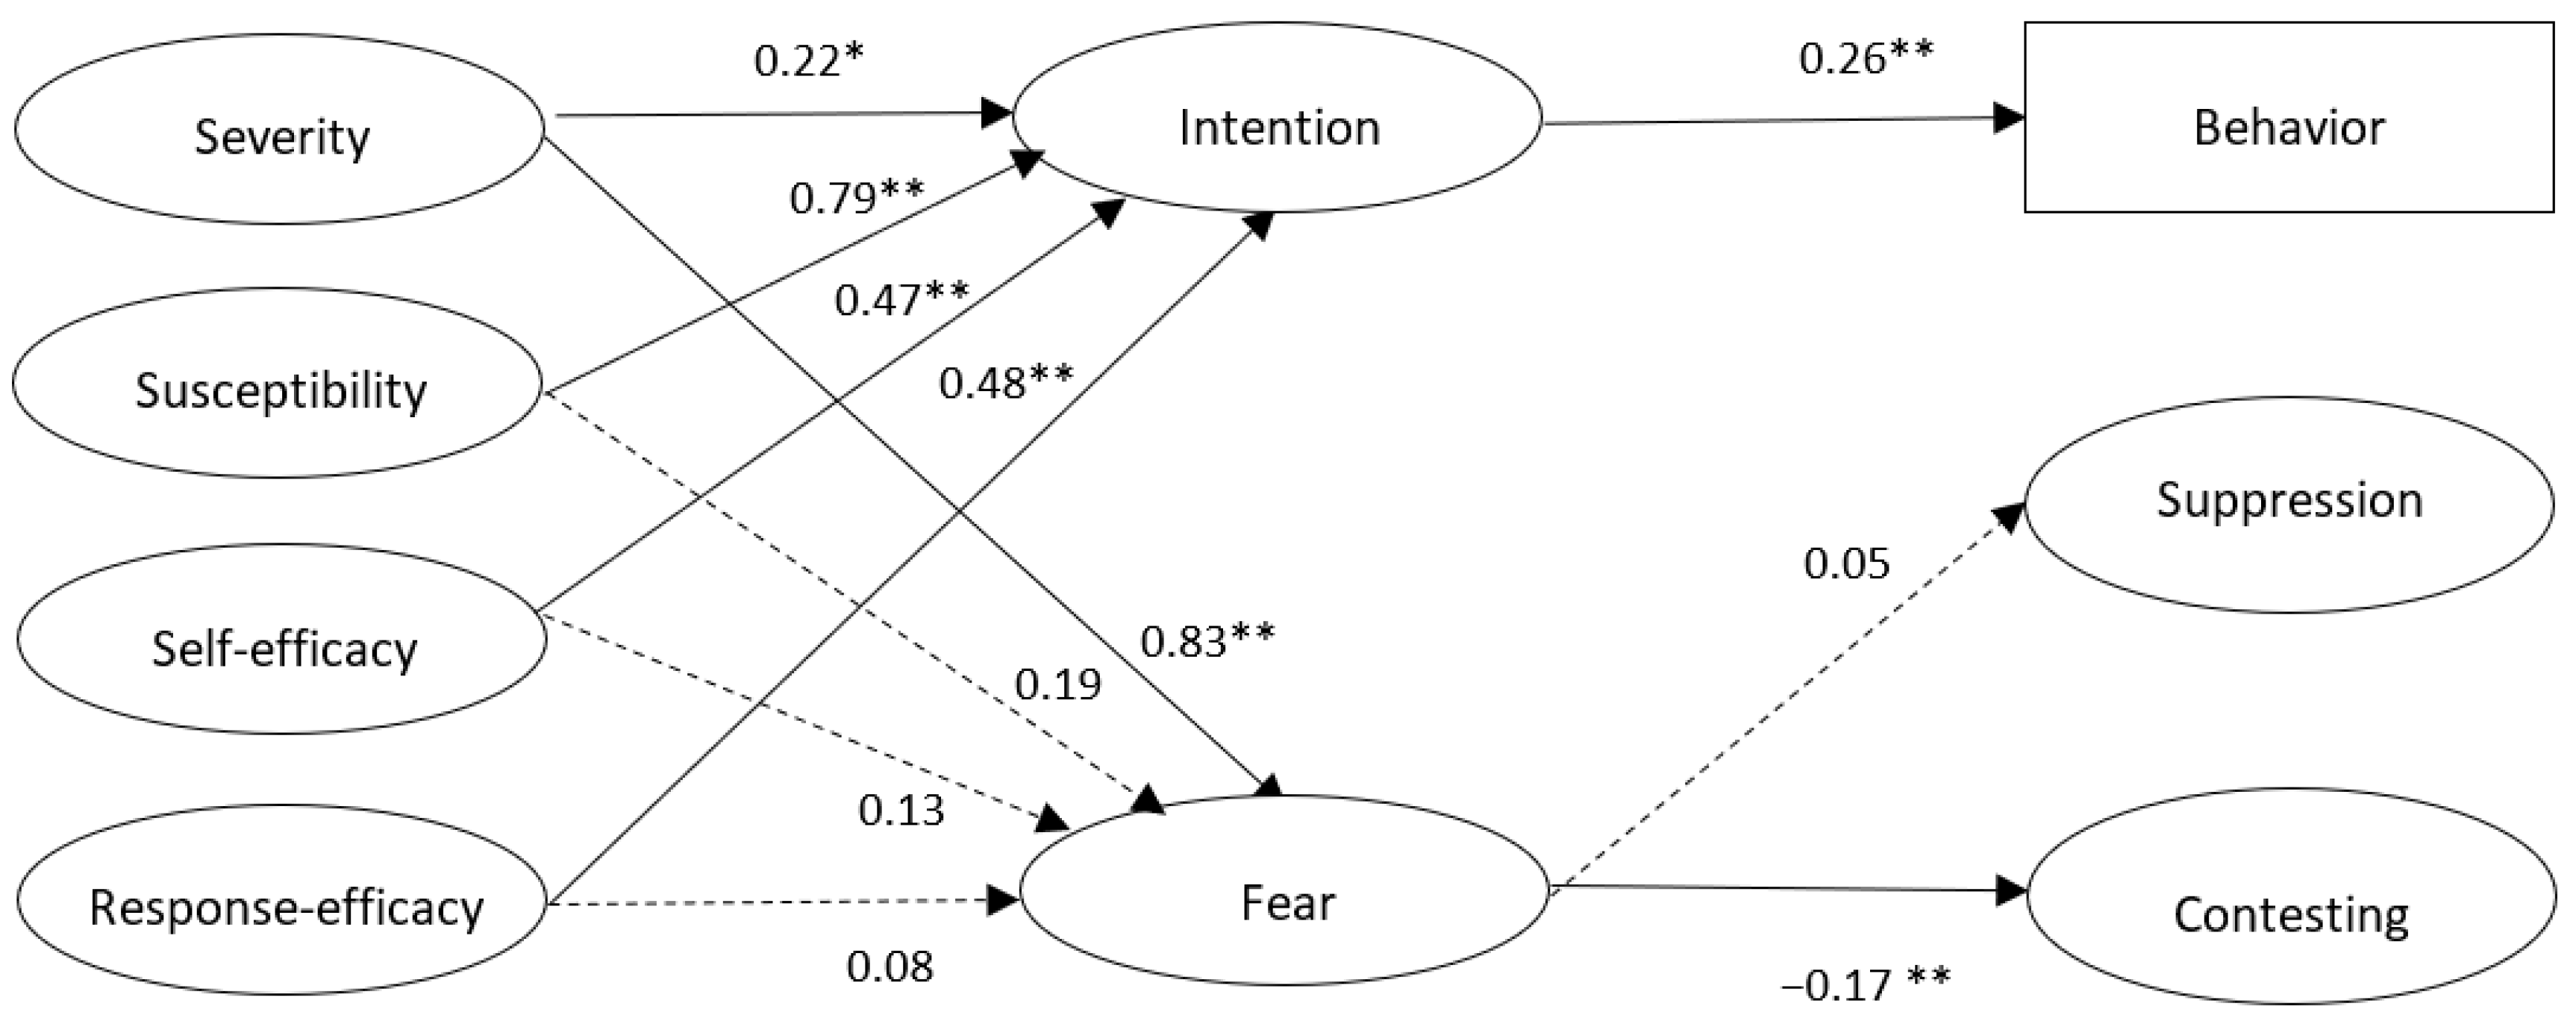
We plan to use Structural Equation Modeling (SEM) to assess the data fit to the proposed theoretical model by using the “lavaan” package (Rosseel 2012) in R (RStudio Team 2020). We follow a two-step procedure by first specifying the measurement models through confirmatory factor analysis and then completing the estimation of structural models (Kline 2016). We use the Full Information Maximum Likelihood (FIML) to address missing data (Enders 2010). We use the following fit indices to evaluate model fit: the χ2/df ratio, the comparative fit indices (CFI), root-mean-square error of approximation (RMSEA), and standardized root-mean-square residual (SRMR). An acceptable fit model must meet the following criteria: the χ2/df ratio ≤ 5, CFI ≥ 0.90, RMSEA ≤ 0.08, and SRMR ≤ 0.08 (Hu and Bentler 1999; Kline 2016). We report the fit indices of the measurement model and final structural model in Figure 2.

3. Results

The confirmatory factor analysis showed that the measurement model fit the data well (χ2/df = 1.95, CFI = 0.90, RMSEA = 0.08, SRMR = 0.08). The final structural model also demonstrated an acceptable fit to the data (χ2/df = 1.92, CFI = 0.89, RMSEA = 0.08, SRMR = 0.09). Path coefficients of the structural model are reported in Figure 2. Overall, the EPPM constructs explained 45.7% of the variance in intention, 81.7% of the variance in behavior, 33.5% of the variance in suppression, and 77% of the variance in contesting.

3.1. Adaptive Danger Control Response

Hypothesis 1 stated that perceived severity (H1A) and perceived susceptibility (H1N) would be positively related to intention. As expected, perceived severity (β = 0.22, p = 0.004) and perceived susceptibility (β = 0.79, p < 0.001) were significantly and positively associated with intention.
Hypothesis 2 stated that perceived self-efficacy (H2A) and perceived response efficacy (H2B) would be positively related to intention. As expected, perceived self-efficacy (β = 0.47, p < 0.001) and perceived response efficacy (β = 0.48, p < 0.001) were significantly and positively associated with intention.
Hypothesis 3 stated that intention would be positively related to future voting behavior. The results indicated that intention was significantly and positively related to intention (β = 0.26, p < 0.001).

3.2. Maladaptive Fear Control Response

Hypothesis 4 stated that perceived severity (H4a) and perceived susceptibility (H4b) would be positively related to fear. As expected, perceived severity (β = 0.83, p < 0.001) was significantly and positively. However, perceived susceptibility (β = 0.19, p = 0.348) was not significantly associated with fear.
Hypothesis 5 stated that perceived self-efficacy (H2a) and perceived response efficacy (H2b) would be negatively related to fear. The results show that neither perceived self-efficacy (β = 0.13, p = 0.272) nor perceived response efficacy (β = 0.08, p = 0.441) were associated with fear.
Hypothesis 6 stated that fear would be negatively related to suppression (H6a) and contesting (H6b). The results showed that fear was not associated with suppression (β = 0.05, p = 0.423), but fear was significantly and negatively associated with contesting (β = −0.17, p < 0.001).1

4. Discussion

This longitudinal study assessed the extended parallel process model’s ability to predict and explain college students’ voting behavior. Results were consistent with the danger control portion of the EPPM. Specifically, severity and susceptibility predicted voting intention, and intention predicted voting behavior. However, results were largely inconsistent with the fear control portion of the EPPM. Specifically, severity (but not susceptibility, self-efficacy, or response efficacy) predicted fear. Further, while the fear-contesting relationship was consistent with our hypotheses and previous research indicating that these constructs tend to be negatively related, it is inconsistent with EPPM predictions that these constructs should be positively related. In summary, the EPPM appears to explain the danger control process excellently, but it explains the fear control process inadequately.

4.1. Theoretical Implications

The current study examined how the EPPM variables elicited either adaptive (i.e., danger control) or maladaptive (i.e., fear control) responses during the 2022 midterm elections. Our findings supported the EPPM’s predictions regarding danger control processes. Specifically, threat and efficacy predicted intention, and intention predicted behavior. Therefore, our results support the notion that when both perceived threat and perceived efficacy are high, individuals should experience (a) greater protection motivation changes (i.e., intention) and (b) adaptive behavioral changes (Witte 1992). Given these findings, high threat and high efficacy messages may be an effective means for changing college students’ voting behavior.
In relation to fear control, however, results mostly conflicted with the EPPM’s predictions. When fear control processes dominate, the EPPM predicts the following: (a) threat positively predicts fear, (b) efficacy negatively predicts fear, and (c) fear positively predicts fear control (Witte 1992). However, findings from the current study indicate that while severity positively predicts fear, susceptibility, self-efficacy, and response efficacy have no association with fear. In addition, rather than fear positively predicting fear control, results indicate that fear negatively predicts contesting and has no relationship with suppression.
It remains unclear why perceived severity predicted fear while perceived susceptibility, perceived self-efficacy, and perceived response efficacy had no association with fear. Findings from past research indicate that when individuals experience an external threat, they become motivated to seek relevant information to reduce uncertainty (Zoizner et al. 2022). The current study did not collect data on participants’ media exposure prior to voting. However, it is quite possible that the amount and type of media exposure prior to voting influenced both perceived susceptibility and perceived efficacy’s relationship with fear. These conflicting results might also be attributable to the fact that participants are humans who naturally change over time. Although there were only 30 days between the T1 and T2 surveys, it is quite possible that fear, perceived susceptibility, and perceived efficacy changed over time.
In addition, when an individual experiences fear, it is due to a direct external threat in their environment and they become motivated to protect themselves. In the context of voting, when an individual experiences fear, it is due to environmental changes that occur indirectly and do not cause a threat to one’s health or well-being. It becomes clear that perceived threat, perceived efficacy, and fear may manifest differently in the context of voting. Although findings regarding fear control processes are not consistent with the EPPM, a growing body of literature suggests a negative relationship between fear and numerous fear control processes (see Birmingham et al. 2015; De Meulner et al. 2015; Popova 2012; Roberto et al. 2021; Roberto and Zhou 2023).
Further, Dillard et al. (2018) identified a comprehensive list of eight defensive avoidance reactions: cognitive suppression, emotional suppression, fatalism, source/issue derogation, denial, bolstering, counterarguing, and risk normalization. The researchers then placed four of these defensive avoidance reactions into three categories, thus leaving the four defensive avoidance strategies of suppression (i.e., emotional and cognitive suppression), reappraisal (i.e., risk normalization and fatalism), contesting (i.e., counterarguing, source/issue derogation, and denial), and bolstering (Dillard et al. 2018). In the current study, two out of the original eight defensive avoidance reactions were tested. It is quite possible that participants engaged in different fear control processes not measured in the current study. Future research should consider measuring each of the eight originally proposed strategies by Dillard et al. (2018) to ensure the EPPM is falsifiable (Shoemaker et al. 2004).
As previously mentioned, the proposed intention–behavior relationship within the EPPM is consistent with the Reasoned Action Approach (Fishbein and Ajzen 2010). The development of the Integrative Behavior Model extended the theory to include contextual/background factors in the prediction of behaviors and intentions. The purpose of including contextual/demographic factors (e.g., engagement with media messages, membership of religious communities, interaction with family) was to improve the prediction of intentions and behaviors. When applying the EPPM to contexts outside of healthcare, the inclusion of contextual/background factors may increase the accurate prediction of behavior. Future research should consider including contextual/demographic factors within the EPPM to further explicate the unfolding of the processes. It becomes clear that the relationships posited by the EPPM need to be more clearly explicated to ensure the model is parsimonious, testable, and holds explanatory power (Fiske 2004; Shoemaker et al. 2004).
Finally, it is worth noting that the processes within the EPPM might manifest differently based upon political affiliation. The current study had a small sample size and could not examine how these relationships differ between groups based upon political affiliation. Future research should consider collecting sufficiently large samples to examine between-group differences. It is quite possible that the relationship between both perceived threat and perceived efficacy manifest differently based upon political affiliation. This may also be a beneficial approach when trying to further understand fear control processes in contexts outside of healthcare. The role that fear appeals play in influencing voting behavior remains a popular area for research. Practical implications and directions for future research will be discussed below.

4.2. Practical Implications

Our results suggest that when college students perceive political elections as high-threat and high-efficacy situations, they have greater intention to vote. That is, students who are concerned about potential impacts of elections are also generally invested in voting as an efficacious method to mitigate this threat. Therefore, we expect that fear appeals combined with efficacy-building messaging should increase intention to vote and voting behavior. Political communicators could use this finding strategically to increase voter participation in elections. According to data from the Annie E. Casey Foundation (2022), young Americans are voting in increasing numbers. This segment of the U.S. population may be of particular interest for targeted voting messaging. This might be achieved with messaging that emphasizes (1) the possibility of a party losing an election, (2) the consequences of a party losing an election, (3) the ease of voting in an election, and (4) the ability of even a single vote to influence election outcomes. Based on EPPM theory and our empirical results, establishing the potential threat of a lost election and building voters’ perceptions of efficacy in mitigating this threat should increase intention to vote and voting behavior.
Strategic political messaging that establishes the stakes of an election and explains opportunities to vote aligns with broader rhetorical recommendations. Civic fear, developed from Aristotelian ethics, refers to a form of fear which inspires deliberation and action by a motivated citizenry (Pfau 2007). Evoking similar reasoning to the EPPM’s approach to fear appeals, civic fear messaging should construct the threat as contingent, not guaranteed. In this case, a negative election outcome is something to fear, with its possible implications for policies governing American life. Communicators should, moreover, stress that this fearful outcome can be offset by taking the due action of voting. In this way, communicators seeking to increase voting should not envision fear as the dominant response to their message. Offering opportunities to resolve or reduce some election-based fear (i.e., by voting) could help avoid the risks of ethical concerns (Hastings et al. 2004), defensive reactions (Moussaoui et al. 2021), and emotion-dependent reasoning (Witte 1992) that can be associated with fear appeals.
With some Americans reflecting fear of election results (Fredrick et al. 2022; Veldhuis et al. 2018), mitigating the discomfort and anxiety associated with this fear itself is also a worthwhile endeavor. During periods of heightened political tension, such as before or during an election, messages affirming response efficacy (i.e., that voting increases the odds of a favorable election outcome) could be particularly useful. Given that election fear contributes to partisan and ideological divisiveness (Brownstein 2023), using efficacy-based messaging to alleviate election anxiety could serve the dual purpose of soothing fearful Americans while smoothing some of the sharp edges that define the modern political system.

4.3. Strengths and Limitations

This study benefits from several notable strengths. For example, it is theory-based, it extends the EPPM to a new context (i.e., political communication and emotions), it measured both danger control and fear control, it used a longitudinal survey design, and it measured actual voting behavior. As with any investigation, this study also had a few limitations. For example, it studied a convenience sample of college students, the sample size did not allow us to run separate analysis for individuals with different political philosophies, and the susceptibility and contesting measures had lower alphas. Considered together, we believe the strengths of applying a well-regarded theory to a new and important context outweigh these disadvantages. Nonetheless, future research would clearly benefit from studying different samples, recruiting larger sample sizes, and including additional items for the susceptibility and contesting measures to increase measurement reliability.

Author Contributions

Conceptualization, A.J.R.; methodology, A.J.R., X.Z.; formal analysis, X.Z.; data curation, A.J.R., L.D.M., P.A.V.F.; writing—original draft preparation, A.J.R., L.D.M., P.A.V.F., X.Z.; writing—review and editing, A.J.R., L.D.M., P.A.V.F., X.Z. All authors have read and agreed to the published version of the manuscript.

Funding

This research received no external funding.

Institutional Review Board Statement

This study was conducted in accordance with the Declaration of Helsinki and approved by the Institutional Review Board of Arizona State University (protocol code STUDY00016589 on 9/21/22).

Informed Consent Statement

Informed consent was obtained from all subjects involved in this study.

Data Availability Statement

The dataset generated for this study is available from the corresponding author on reasonable request.

Conflicts of Interest

The authors declare no conflict of interest.

Note

1
The full sample of 175 participants was used for the results reported in the main body of this manuscript. We believe that this is the appropriate analysis given participants had plenty of time to both register to vote and to vote before Time 2 data were collected. However, to be thorough, we also ran the analysis using only the 133 participants who were registered to vote. The SEM results were very similar to those found in the original analysis (χ2/df = 1.71, CFI = 0.89, RMSEA = 0.08, SRMR = 0.09); the only substantive difference was the loss of the self-efficacy–intention path.

References

  1. Annie E. Casey Foundation. 2022. Young Adult Turnout nearly Doubled in the 2018 Midterm Elections. Can It Be Maintained in 2022? The Annie E. Casey Foundation. February 17. Available online: https://www.aecf.org/blog/civic-participation (accessed on 7 November 2023).
  2. Bandura, Albert. 2004. Health promotion by social cognitive means. Health Education & Behavior 31: 143–64. [Google Scholar] [CrossRef]
  3. Birmingham, Wendy C., Man Hung, Watcharaporn Boonyasiriwat, Wendy Kohlmann, Scott T. Walters, Randall W. Burt, Antoinette M. Stroup, Sandie L. Edwards, Marc D. Schwartz, Jan T. Lowery, and et al. 2015. Effectiveness of the extended parallel process model in promoting colorectal cancer screening. Psycho-Oncology 24: 1265–78. [Google Scholar] [CrossRef]
  4. Blits, Jan H. 1989. Hobbesian fear. Political Theory 17: 417–31. [Google Scholar] [CrossRef]
  5. Brader, Ted. 2006. Campaigning for Hearts and Minds: How Emotional Appeals in Political Ads Work. Chicago: University of Chicago Press. [Google Scholar]
  6. Brownstein, Ronald. 2023. Why the US ‘Does Not Get to Assume It Lasts Forever’. CNN. July 4. Available online: https://www.cnn.com/2023/07/04/politics/american-political-divisions-july-fourth/index.html (accessed on 7 November 2023).
  7. Chen, Liang, and Xiaodong Yang. 2018. Using EPPM to evaluate the effectiveness of fear appeal messages across different media outlets to increase the intention of breast self-examination among Chinese women. Health Communication 34: 1369–76. [Google Scholar] [CrossRef]
  8. De Meulner, Sarah, Patrick De Pelsmacker, and Nathalie Dens. 2015. Have no fear: How individuals differing in uncertainty avoidance, anxiety, and change belief process health risk messages. Journal of Advising 44: 114–25. [Google Scholar] [CrossRef]
  9. Dillard, James P., Eric Meczkowski, and Chun Yang. 2018. Defensive reactions to threatening health messages: Alternative structures and next questions. International Journal of Communication 12: 973–95. [Google Scholar]
  10. Dillard, James P., and Lijiang Shen. 2005. On the nature of reactance and its role in persuasive health communication. Communication Monographs 72: 144–68. [Google Scholar] [CrossRef]
  11. Dillard, James P., Ruobing Li, Eric Meczkowski, Chun Yang, and Lijiang Shen. 2017. Fear response to threat appeals: Functional form, methodological considerations, and correspondence between static and dynamic data. Communication Research 44: 997–1018. [Google Scholar] [CrossRef]
  12. Emery, Sherry L., Glen Szczypka, Euliàlia P. Abril, Yoonsang Kim, and Lisa Vera. 2014. Are you scared yet? Evaluating fear appeal messages in tweets about the tips campaign. Journal of Communication 64: 278–95. [Google Scholar] [CrossRef]
  13. Enders, Craig K. 2010. Applied Missing Data Analysis. New York: Guilford Press. [Google Scholar]
  14. Fishbein, Martin, and Icek Ajzen. 2010. Predicting and Changing Behavior: The Reasoned Action Approach. New York: Psychology Press. [Google Scholar]
  15. Fiske, Sussan T. 2004. Mind the gap: In praise of informal sources of formal theory. Personality and Social Psychology Review 8: 132–37. [Google Scholar] [CrossRef]
  16. Fredrick, Emma G., Abbey K. Mann, Byron D. Brooks, and Jameson K. Hirsch. 2022. Anticipated to enacted: Structural stigma against sexual and gender minorities following the 2016 presidential election. Sexuality Research and Social Policy 19: 345–54. [Google Scholar] [CrossRef]
  17. Frey, William H. 2022. Midterm Exit Polls Show That Young Voters Drove Democratic Resistance to the “Red Wave”. Available online: https://policycommons.net/artifacts/4145207/midterm-exit-polls-show-that-young-voters-drove-democratic-resistance-to-the-red-wave/4953224/ (accessed on 7 November 2023).
  18. Hastings, Gerard, Martine Stead, and John Webb. 2004. Fear appeals in social marketing: Strategic and ethical reasons for concern. Psychology & Marketing 21: 961–86. [Google Scholar] [CrossRef]
  19. Hodge, James G., Leila Barraza, Jennifer L. Piatt, and Erica N. White. 2023. Midterm maelstrom: Public health legal impacts of election 2022. Journal of Law, Medicine & Ethics 51: 208–12. [Google Scholar] [CrossRef]
  20. Hu, Li-tze, and Peter M. Bentler. 1999. Cutoff criteria for fit indexes in covariance structure analysis: Conventional criteria versus new alternatives. Structural Equation Modeling: A Multidisciplinary Journal 6: 1–55. [Google Scholar] [CrossRef]
  21. Kaplan, Jonas T., Sarah I. Gimbel, and Sam Harris. 2016. Neural correlates of maintaining one’s political beliefs in the face of counterevidence. Scientific Reports 6: 39589. [Google Scholar] [CrossRef]
  22. Kline, Rex B. 2016. Principles and Practice of Structural Equation Modeling, 4th ed. New York: Guilford Press. [Google Scholar]
  23. Lerner, Jennifer S., Roxana M. Gonzalez, Deborah A. Small, and Baruch Fischhoff. 2003. Effects of fear and anger on perceived risks of terrorism: A national field experiment. Psychological Science 14: 144–50. [Google Scholar] [CrossRef]
  24. Lewis, Ioni, Barry Watson, and Richard Tay. 2007. The role of fear appeals in improving driver safety: A review of the effectiveness of fear-arousing (threat) appeals in road safety advertising. International Journal of Behavioral Consultation and Therapy 3: 203–22. [Google Scholar] [CrossRef]
  25. Lewis, Jarrett, and Brian Stryker. 2023. The role of health care in the 2022 midterm elections. JAMA Health Forum 4: e225489. [Google Scholar] [CrossRef]
  26. Mongeau, Paul A. 2012. Fear appeals. In The SAGE Handbook of Persuasion: Developments in Theory and Practice. Edited by James P. Dillard and Lijiang Shen. Thousand Oaks: Sage Publications, Inc., pp. 184–99. [Google Scholar]
  27. Moussaoui, Lisa S., Nancy Claxton, and Oliver Desrichard. 2021. Fear appeals to promote better health behaviors: An investigation of potential mediators. Health Psychology and Behavioral Medicine 9: 600–18. [Google Scholar] [CrossRef]
  28. Peters, Gjalt-Jorn Y., Robert A. C. Ruiter, and Gerjo Kok. 2013. Threatening communication: A critical re-analysis and a revised meta-analytic test of fear appeal theory. Health Psychology Review 7: S8–S31. [Google Scholar] [CrossRef]
  29. Pew Research Center. 2022. As Partisan Hostility Grows, Signs of Frustration with the Two-Party System. Pew Research Center. Available online: https://www.pewresearch.org/politics/wp-content/uploads/sites/4/2022/08/PP_2022.09.08_partisan-hostility_REPORT.pdf (accessed on 7 November 2023).
  30. Pfau, Michael W. 2007. Who’s Afraid of Fear Appeals? Contingency, Courage, and Deliberation in Rhetorical Theory and Practice. Philosophy & Rhetoric 40: 216–37. [Google Scholar]
  31. Popova, Lucy. 2012. The extended parallel process model: Illuminating the gaps in research. Health Education and Behavior 39: 455–73. [Google Scholar] [CrossRef] [PubMed]
  32. Roberto, Anthony J. 2022. Public Health Communication: Science and Practice. Dubuque: Kendall/Hunt Publishing. [Google Scholar]
  33. Roberto, Anthony J., and Xin Zhou. 2023. Predicting college student’s COVID-19 vaccination behavior: An application of the extended parallel process model. Journal of Behavioral Medicine 46: 76–87. [Google Scholar] [CrossRef]
  34. Roberto, Anthony. J., Xin Zhou, and Anya Hommadova-Lu. 2021. The effects of perceived threat and efficacy on college students’ social distancing behavior during the COVID-19 pandemic. Journal of Health Communication 26: 264–71. [Google Scholar] [CrossRef]
  35. Rosseel, Yves. 2012. Lavaan: An R package for structural equation modeling and more. Version 0.5-12 (BETA). Journal of Statistical Software 48: 1–36. [Google Scholar] [CrossRef]
  36. RStudio Team. 2020. RStudio: Integrated Development Environment for R. Boston: RStudio, PBC. Available online: http://www.rstudio.com/ (accessed on 7 November 2023).
  37. Scheller, Simon. 2019. The strategic use of fear appeals in political communication. Political Communication 36: 586–608. [Google Scholar] [CrossRef]
  38. Schnell, Rainer, Tobias Bachteler, and Jörg Reiher. 2010. Improving the use of self-generated identification codes. Evaluation Review 34: 391–418. [Google Scholar] [CrossRef]
  39. Shen, Bin, and Yana Kim. 2022. Green With fear: Fear appeals and temporal framing in eco-friendly clothing advertising. Clothing and Textiles Research Journal 40: 154–68. [Google Scholar] [CrossRef]
  40. Shi, Jingyuan, and Sandi Smith. 2016. The Effects of fear appeal message repetition on perceived threat, perceived efficacy, and behavioral intention in the extended parallel process model. Health Communication 31: 1–12. [Google Scholar] [CrossRef]
  41. Shoemaker, Pamela J., James W. Tankard Jr., and Dominic L. Lasorsa. 2004. How to Build Social Science Theories. New York: SAGE Publications, Inc. [Google Scholar]
  42. Valentino, Nicholas A., Ted Brader, Eric W. Groenendyk, Krysha Gregorowicz, and Vincent L. Hutchings. 2011. Election night’s alright for fighting: The role of emotions in political participation. The Journal of Politics 73: 156–70. [Google Scholar] [CrossRef]
  43. Veldhuis, Cindy B., Laurie Drabble, Ellen D. B. Riggle, Angie R. Wootton, and Tonda L. Hughes. 2018. “We won’t go back into the closet now without one hell of a fight”: Effects of the 2016 presidential election on sexual minority women’s and gender minorities’ stigma-related concerns. Sexuality Research and Social Policy 15: 12–24. [Google Scholar] [CrossRef]
  44. Wagner, Markus, and Davide Morisi. 2019. Anxiety, fear, and political decision making. In Oxford Research Encyclopedia of Politics. Edited by Markus Wagner and Davide Morisi. Oxford: Oxford University Press. [Google Scholar] [CrossRef]
  45. Widmann, Tobias. 2021. How emotional are populists really? Factors explaining emotional appeals in the communication of political parties. Political Psychology 42: 163–81. [Google Scholar] [CrossRef]
  46. Witte, Kim. 1992. Putting the fear back into fear appeals: The extended parallel process model. Communication Monographs 59: 329–49. [Google Scholar] [CrossRef]
  47. Witte, Kim, and Mike Allen. 2000. A meta-analysis of fear appeals: Implications for effective public health campaigns. Health Education & Behavior: The Official Publication of the Society for Public Health Education 27: 591–615. [Google Scholar] [CrossRef]
  48. Witte, Kim, Kenzie A. Cameron, Janet K. McKeon, and Judy M. Berkowitz. 1996. Predicting risk behaviors: Development and validation of a diagnostic scale. Journal of Health Communication 1: 317–41. [Google Scholar] [CrossRef]
  49. Zoizner, Alon, Tamir Sheafer, Laia Castro, Toril Aalberg, Ana S. Cardenal, Nicoleta Corbu, Claes de Vreese, Frank Esser, David N. Hopmann, Karolina Koc-Michalska, and et al. 2022. The effects of COVID-19 outbreak on selective exposure: Evidence from 17 countries. Journal of Political Communication 39: 674–96. [Google Scholar] [CrossRef]
Figure 1. Structural model with hypothesized relationships.
Socsci 12 00628 g001
Figure 2. Results for structural model. Solid lines indicate significant paths (* p < 0.01, ** p < 0.001). Dashed line indicates insignificant path.
Socsci 12 00628 g002
Table 1. Descriptive statistics, Cronbach’s alphas, and scale items for all Time 1 constructs.
VariableM (SD)αItems
Severity3.30 (0.92)0.94
  • My preferred party losing the 2022 midterm elections would be a serious threat to this country.
  • My preferred party losing the 2022 midterm elections would be dangerous for this country.
  • My preferred party losing the 2022 midterm elections would be harmful to this country.
  • My preferred party losing the 2022 midterm elections would have serious consequence for this country.
Susceptibility3.48 (0.47)0.68
  • It is possible that my preferred party will lose the 2022 midterm elections.
  • My preferred party losing the 2022 midterms election is something that could happen.
  • My preferred party is at risk of losing the 2022 midterm elections.
  • My preferred party is likely to lose the 2022 midterm elections.
Self-efficacy3.76 (0.72)0.77
  • I know how to vote in the 2022 midterm elections.
  • Voting in the 2022 midterm elections is easy.
  • I am able to vote in the 2022 midterm elections.
  • Voting in the 2022 midterm elections is simple.
Response efficacy3.44 (0.69)0.80
  • Voting in the 2022 midterm election would make it more likely that my preferred party will win the election.
  • Voting in the 2022 midterm election will increase the chances that my preferred party will win the election.
  • Voting in the 2022 midterm election is an effective way to make sure my preferred party will win the election.
  • Voting in the 2022 midterm election is a good way prevent my preferred party from losing the election.
Fear2.73 (1.21)0.96How do you feel about what will happen to the country when think about your preferred party losing during the midterm elections?
  • Anxious
  • Scared
  • Fearful
  • Afraid
  • Worried
  • Concerned
Intention3.88 (1.03)0.97
  • I plan to vote in the 2022 midterm election.
  • I will try to vote in the 2022 midterm election.
  • I intend to vote in the 2022 midterm election.
  • I am likely to vote in the 2022 midterm election.
Suppression2.95 (0.79)0.76
  • I try NOT to think about what will happen if my preferred party loses the 2022 midterm elections.
  • I avoid thinking about what will happen if my preferred party loses the 2022 midterm elections.
  • If thoughts about my preferred party losing the 2022 midterm elections come to mind, I try to think about something else.
Contesting3.05 (0.71)0.64
  • The media have blown the importance of my preferred party winning the 2022 midterm elections all out of proportion.
  • In general, people are overreacting when it comes to the importance of my preferred party winning the 2022 midterm elections.
  • Most of what I hear about the importance of my preferred party winning the 2022 midterm elections is exaggerated.
All variables except fear were measured on a five-point scale ranging from (1) “strongly disagree” to (5) “strongly agree.” Fear was measured on a five-point scale ranging from (1) “none of this emotion” to (5) “a great deal of this emotion”.
Disclaimer/Publisher’s Note: The statements, opinions and data contained in all publications are solely those of the individual author(s) and contributor(s) and not of MDPI and/or the editor(s). MDPI and/or the editor(s) disclaim responsibility for any injury to people or property resulting from any ideas, methods, instructions or products referred to in the content.

