1. Introduction
Recent years have seen a growth of electoral support for populist right-wing political parties and candidates in North America (
Jardina 2019;
Mutz 2018;
Sides et al. 2018) and Europe (
Betz 1998;
Norris 2005;
Norris and Inglehart 2019) and also radical left-wing parties, especially in Europe, which have doubled their level of support since the 1980s (
Krause 2020). Thus, it would be conceivable that news media have reflected in their content the apparent growth of political extremism in the wider society.
In some limited cases, the role of partisan media in driving political extremism has been suggested because new partisan media sources come bundled with cable laid in some homes but not others, creating quasi-control and treatment groups (
DellaVigna and Kaplan 2006). Some authors have also shown partial evidence that exposure to ideological homogeneity in news media can drive attitude extremism (
Warner 2010). Yet, the full role of news media in driving and/or responding to political extremism remains unclear.
The rise of political candidates and parties outside of the ideological mainstream has occurred in tandem with largely exogenous changes in the media landscape that stem from technological change and the lifting of regulations such as the Fairness Doctrine (
Pickard 2018). The link between news media and right-wing extremism has been comparatively explored at greater length than the link between news media and religious extremism or between news media and left-wing political extremism (
Alvares and Dahlgren 2016;
Müller and Schulz 2021). The role of financial incentives in the manufacturing of political extremism by news media has been suggested before (
Bandyopadhyay et al. 2015). Nevertheless, the causal impact of an increasingly decentralized and deregulated mass media—from talk radio to cable TV to the new pay-per-click online revenue model—on political extremism is underdetermined (
Klein 2020).
Numerous studies show that those who consume partisan media display greater issue sorting, extremism and negative partisanship than those who do not (
Bruine de Bruin et al. 2020;
Levy 2021;
Martin and Yurukoglu 2017). Ideological extremism has been associated with a preference for news media consumption through social media that leverages social curation via ideological peers to avoid dissonant information from mainstream media sources (
Möller et al. 2020). In fact, a common feature among holders of political extremist beliefs is their negative perception of mainstream news media (
Baugut and Neumann 2019;
Fawzi 2019).
It is well established that news media can play an important
agenda-setting role in public opinion (
McCombs 2005). The increasing prominence in news media of terrorism, crime or prejudice has been shown to precede increased public concern about terrorism, crime or prejudice, irrespective of the actual prevalence of terror incidents, crime rates or prejudicial attitudes in society (
Callanan 2012;
Lowry et al. 2003;
Rozado et al. 2021;
Smith et al. 2019). The
agenda-setting literature also finds that trends in prestigious news outlets seem to precede similar tendencies in less prominent media organizations, as most journalists strive to emulate trends in prestige media (
McCombs 2005).
Previous work has reported how the stigmatization of political parties by news media reduces their electoral support (
van Spanje and Azrout 2019). Thus, news media elites could be tempted to undermine political attitudes they dislike by portraying them in terms that suggest extreme political beliefs for
agenda-setting purposes (
McCombs 2005). Indeed, some members of the public, according to political or religious orientation, have been shown to favor controversial journalistic practices such as politically biased reporting as means to combat political extremism (
Baugut and Scherr 2021).
Methodologically, we address a glaring gap in the survey- and election-data-based literature on political extremism by introducing a big data measure of discursive prevalence in news media of terms suggestive of political extremism. Computational content analysis of news outlets' content can be useful to analyze the dynamics of patterns embedded in journalistic discourse (
Caliskan et al. 2017;
Kozlowski et al. 2019;
Rozado and al-Gharbi 2021). Plotting word frequencies from a longitudinal corpus of news outlets’ written content tracks the time course of historical phenomena and can illuminate the cultural context in which such texts were produced (
Rozado 2020;
Rozado et al. 2021).
The observational methodology used in this work is limiting since it does not allow us to make causal inferences about what is driving the observed media trends over time. That is, we cannot elucidate whether news media is exaggerating the prevalence of political extremism by increasingly characterizing political factions they dislike as extreme or if the media is simply responding to actual rising political extremism in society. Thus, our aim is mostly descriptive in our attempt at longitudinally documenting the frequency of terms denoting far-right and far-left political extremism across a large and representative set of written news and opinion articles from news media outlets popular in the United States and the United Kingdom.
2. Materials and Methods
The textual content of news and opinion articles from the 54 outlets analyzed, listed in
Figure S1 and Table S1 of the Supplementary Materials (SM), is available in the outlets’ online domains and/or public cache repositories such as Google cache, The Internet Wayback Machine (
Notess 2002) or Common Crawl (
Mehmood et al. 2017). The textual content included in our analysis is circumscribed to the articles’ headline and main text. This work has not analyzed video or audio content from news media organizations, except when an outlet explicitly provides a transcript of such content in article form. Targeted articles’ URLs were located using a variety of methods such as online indexes, pagination, search engine searches by date of publication tag or crawling/parsing of public online domains or public cache repositories. The targeted textual content was located in HTML raw data using outlet-specific XPath expressions. Tokens were lowercased prior to estimating frequency counts.
To prevent outlets with sparse text content for a year from distorting average yearly frequency counts across outlets, we only include outlet frequency counts from years for which the outlet has at least 1 million words of articles’ textual content available. This threshold was chosen to maximize inclusion in our analysis of outlets with low article volume per year, such as Reason, AlterNet or The American Spectator, while simultaneously maintaining a large enough sample size of words to obtain accurate frequency counts per outlet/year.
Yearly frequency usage of a target word or n-gram in an outlet was estimated by dividing the number of occurrences of the target word/n-gram in all articles within a given year by the total number of all words in all articles of that year. This method of estimating frequency accounts for the variable volume of total article output over time.
The temporal coverage of article availability in different online news outlets is not uniform. For most media organizations, substantial news article availability in online domains or Internet cache repositories becomes sparse in earlier years. This is not the case for a few news outlets, such as
The New York Times or
The Washington Post, where online availability of news articles goes back as far as the 1970s. Still, frequency data of news media word usage is constrained in its representativeness since most news outlets do not have online availability of news article content in their online domains prior to the year 2000.
Figures S3 and S4 in the Supplementary Materials illustrate the time ranges of article data analyzed based on news outlets’ online articles availability and the number of words and articles per outlet/year fulfilling our minimum total yearly word count inclusion criteria.
In a small percentage of articles, outlet-specific XPath expressions failed to properly capture the content of the article due to the heterogeneity of HTML elements and CSS styling combinations with which the articles’ text content is arranged in outlets’ online domains. As a result, the total and target word count metrics for a small subset of articles might not be precise.
Most of the incorrect frequency counts were only minor deviations from the actual counts, such as, for instance, counting a target word in an article footnote or sidebar that the XPath expression mistakenly included as the content of the article’s main text. Some additional outlet-specific inaccuracies that we could identify occurred in The Hill and Newsmax news outlets, where XPath expressions were suboptimal at precisely capturing articles’ content. For The Hill, in the years 2007–2009, XPath expressions failed to capture the complete text of the article in about 40% of the articles. This does not necessarily result in incorrect frequency counts for that outlet but in a sample of articles’ words that is about 40% smaller than the total population of articles words for those years. In the case of NewsMax, the issue was that for some articles, XPath expressions mistakenly captured the entire text of the article twice. This again does not result in incorrect frequency counts. If a word appears times in an article with a total of words, the same frequency count will still be derived when the script counts the word times in the version of the article with a total of words.
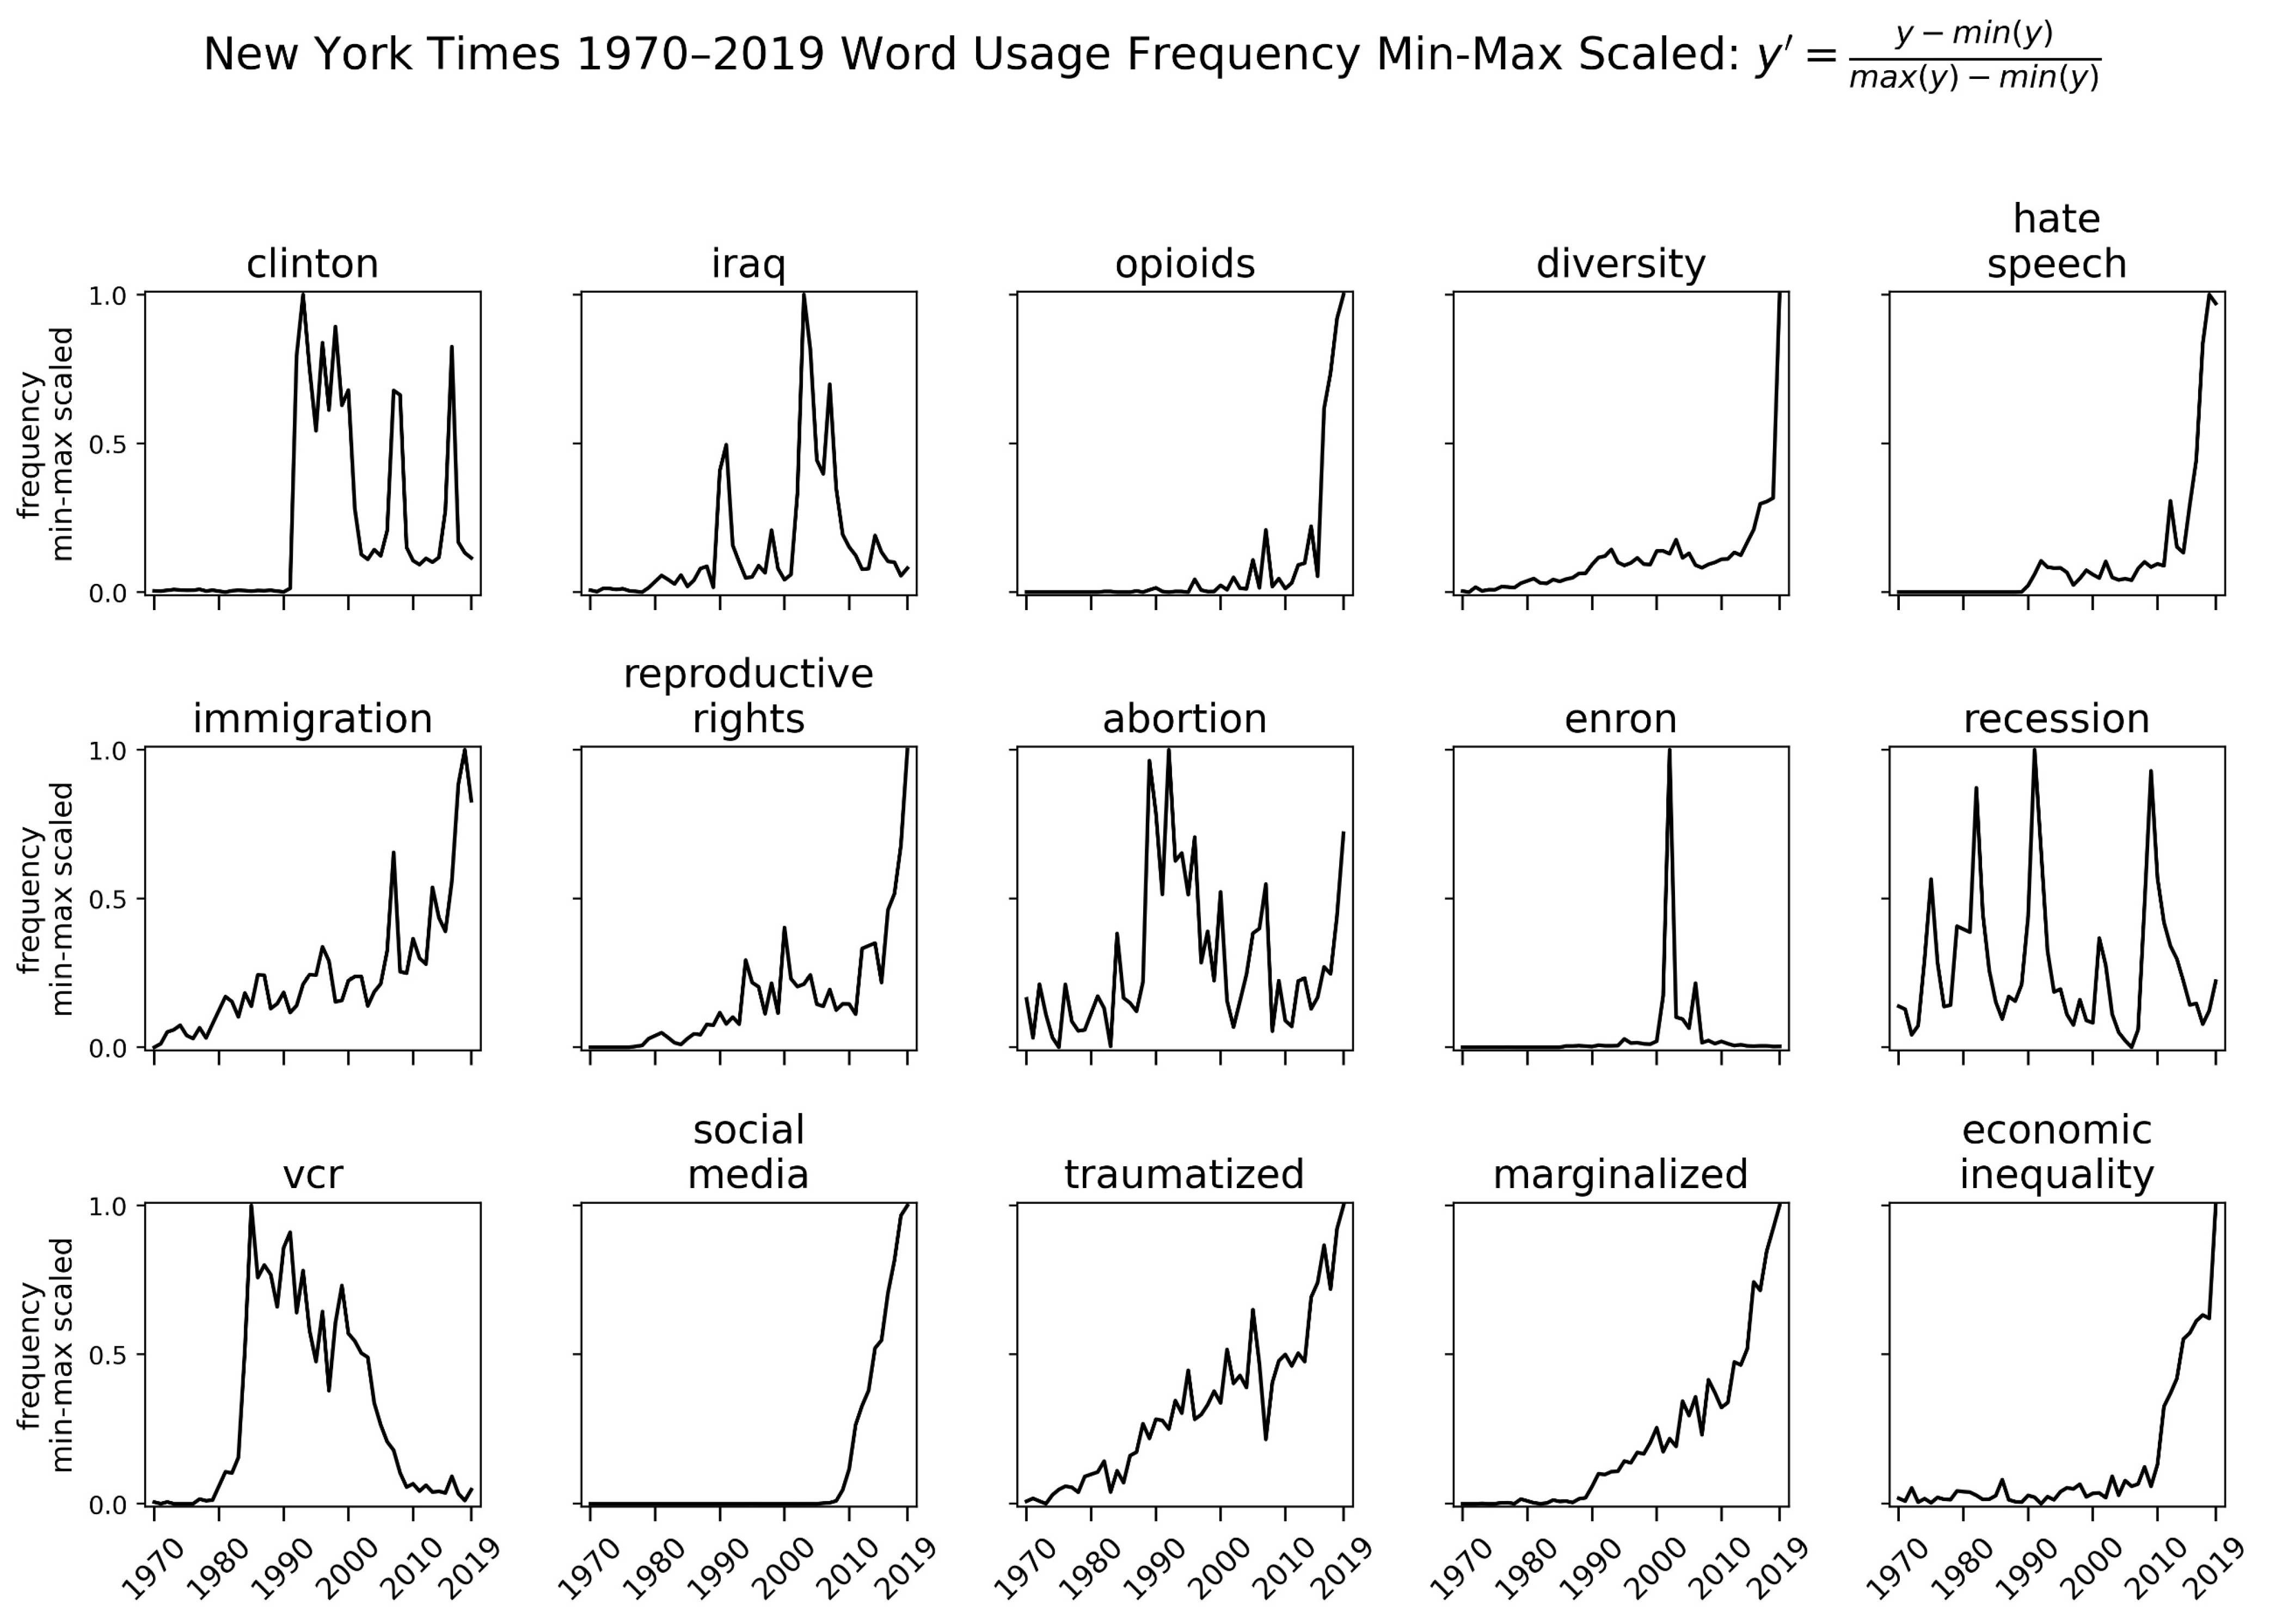
In a data analysis of millions of articles, we cannot manually check the correctness of frequency counts for every single article, and one hundred percent accuracy at capturing articles’ content is elusive due to the small number of difficult-to-detect edge cases, such as noncompliant HTML markup syntax in online domains. Overall, however, our derived frequency metrics appear to be representative of word prevalence in print news media content, as illustrated by
Figure 1.
Figure 1 shows the min-max scaled yearly frequencies of several illustrative words in
The New York Times content during the past 50 years. Min-max scaling is a common way to normalize time series. The method rescales the range of the data to a scale between 0 and 1 using the formula shown in Equation (1), where
is the original frequency count for a given word, and
is its normalized/scaled value. Min-max scaling of frequency counts allows for the comparison of minimum and maximum temporal prevalence across terms in the corpus irrespective of their absolute/relative frequency ranges.
Our set of target terms denoting right and left political extremism was selected by emphasizing symmetry (i.e., far-right/far-left, right-wing/left-wing extremism, etc.) to attempt a fair comparison when documenting the prevalence of terms signifying political extremism in news media content. While our methodology is not perfect, we are not aware of a better or more rigorous methodology for evaluating bespoke words used by each side of the political spectrum to refer to extremism on the opposite side.
We used external human ratings of outlet ideological leanings to classify outlets by their political leanings. For U.S.-based outlets, we used the comprehensive AllSides Media Bias Chart 2019 v1.1 (
AllSides 2019). For U.K.-based news outlets, we used a majority voting of human ratings from Ad Fontes Media, YouGov and AllSides Media Bias Chart 2019 v1.1 (
Andrew McGee 2021;
YouGov 2021;
AllSides 2019); see
Supplementary Materials for details.
Bartlett’s test of sphericity confirmed that the frequency-time series of our target far-right- and far-left-denoting terms were highly correlated, thus suggesting the potential of factor analysis to derive latent factors. A Kaiser–Meyer–Olkin (KMO) test confirmed the suitability of the far-right terms time series for factor analysis (KMO = 0.75). The Kaiser–Meyer–Olkin test for the far-left terms time series was slightly suboptimal (KMO = 0.55). The number of factors to extract was determined using an eigenvalue cutoff of 2 to establish a minimum threshold for how much of the total time series each factor explains. Factor estimation was carried out using varimax rotations. A factor loading cutoff of 0.5 was used to ascribe terms to a factor. Chronbach alphas to determine if the resulting factors appeared coherent were all above 0.82.
3. Results
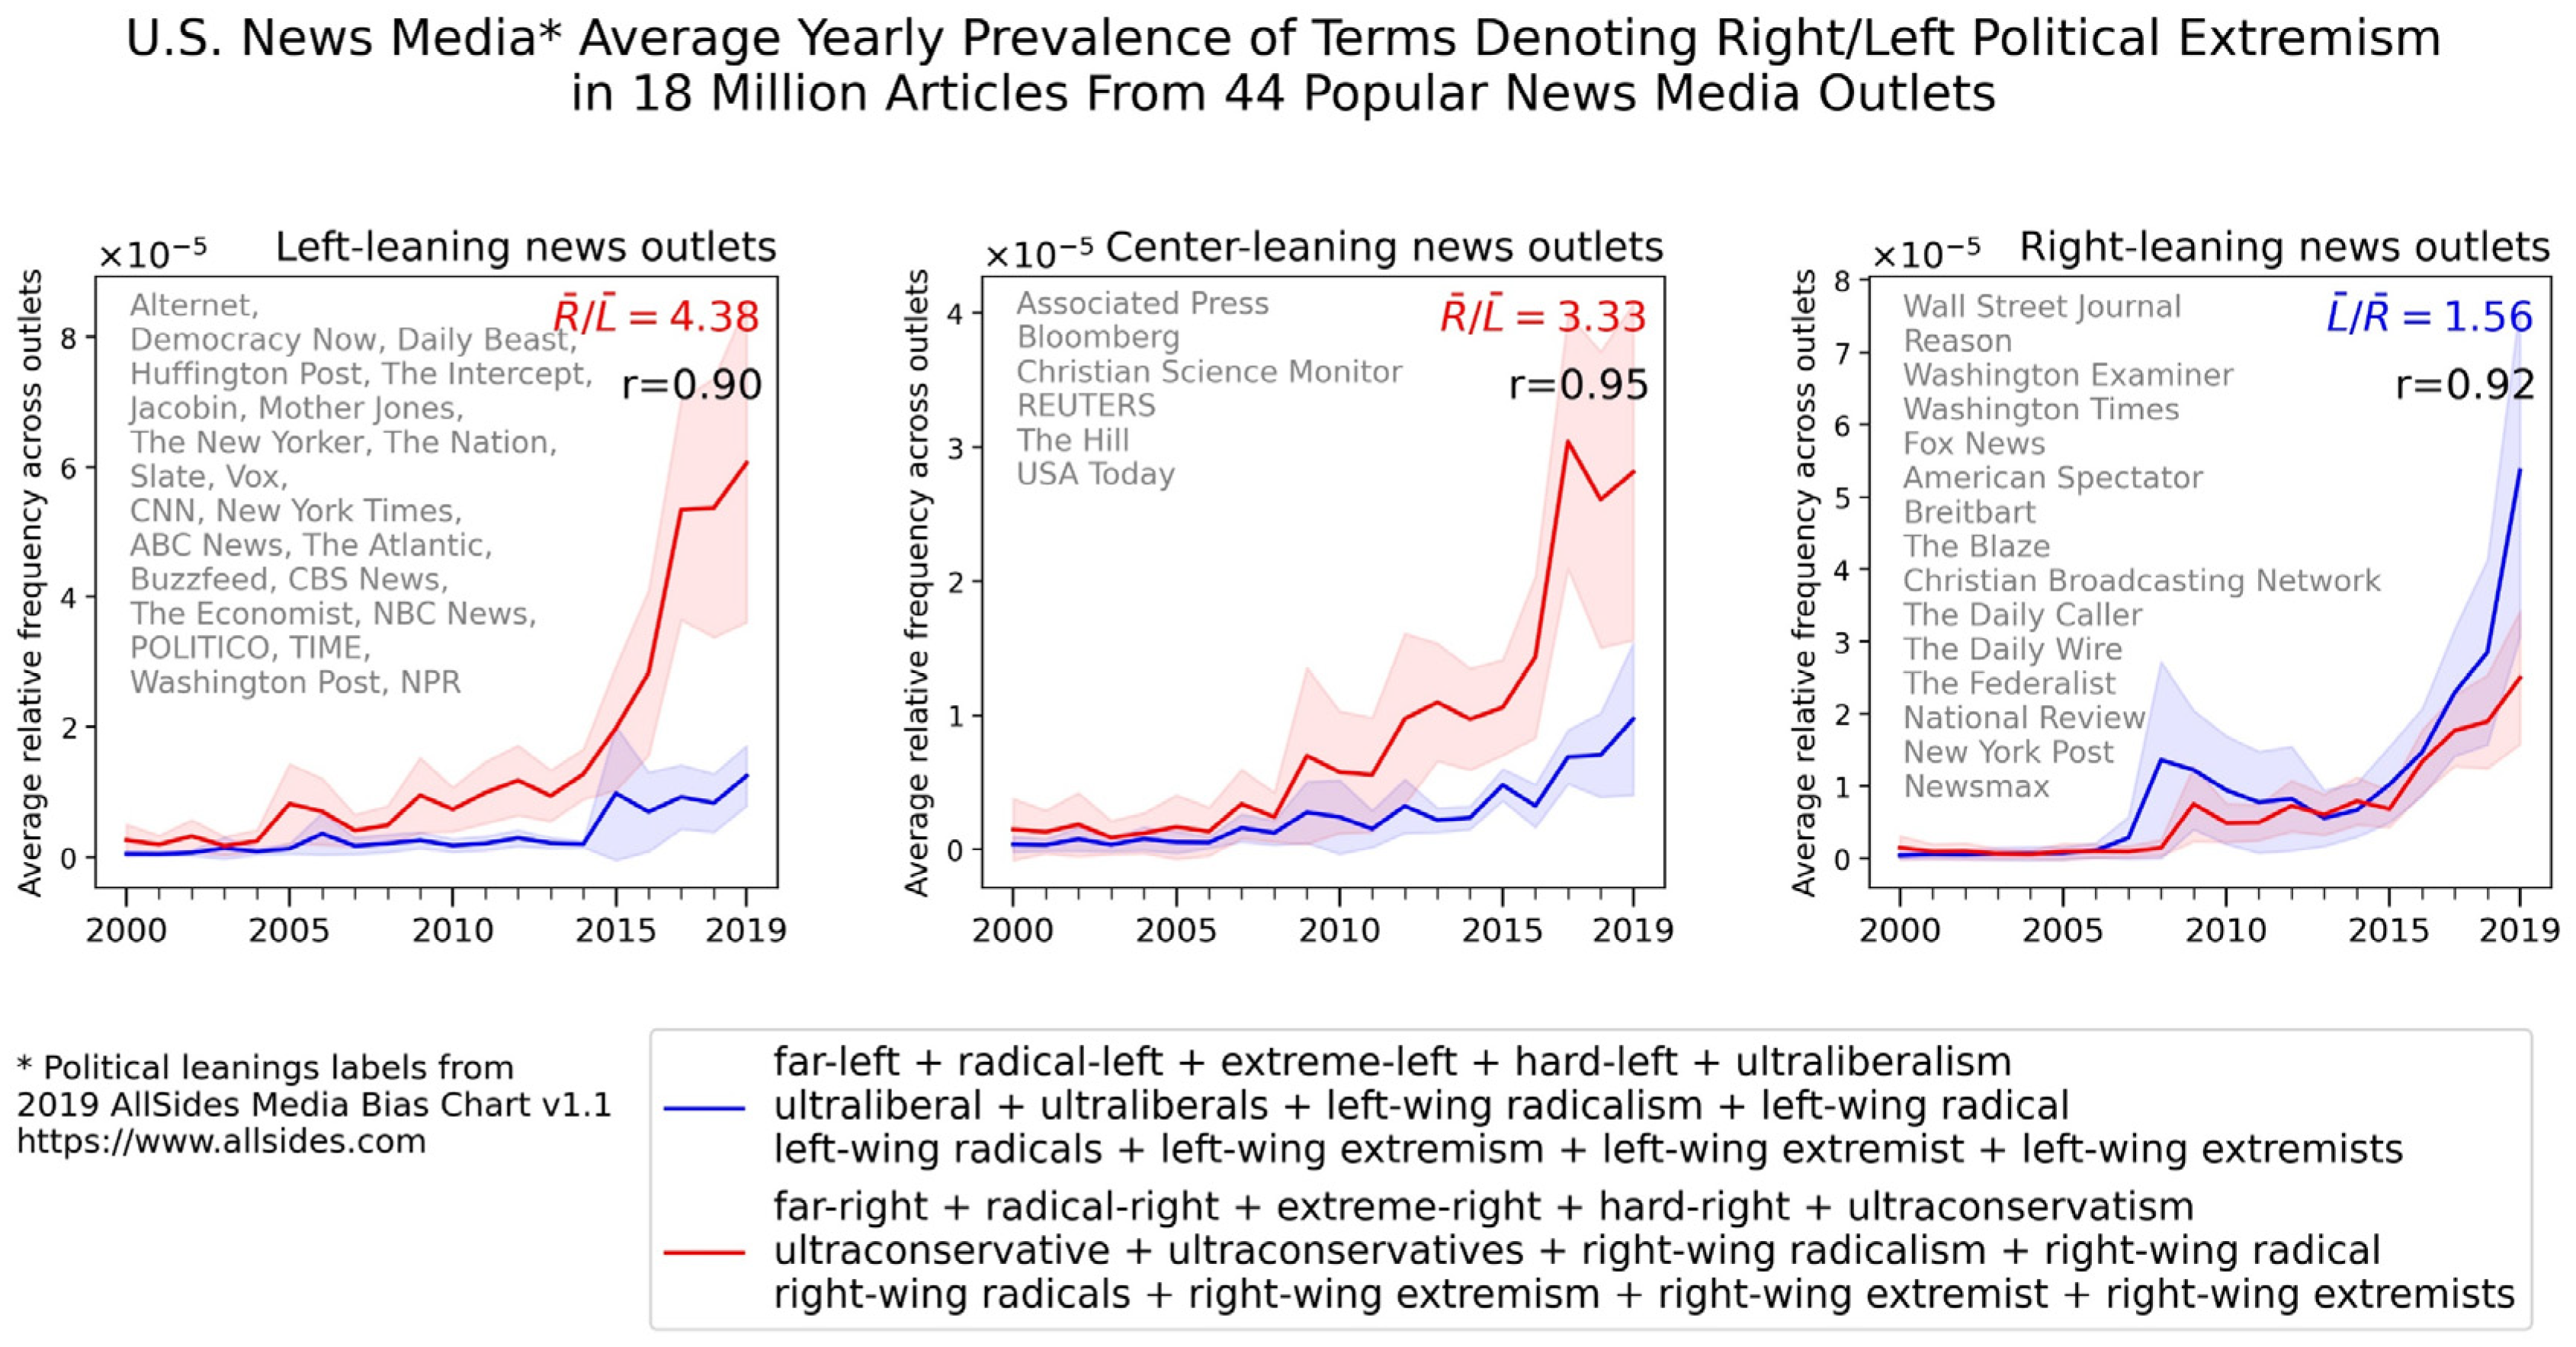
The average yearly prevalence of words denoting left- and right-wing political extremism across 44 U.S. news media outlets’ content arranged by outlets’ ideological leanings according to human ratings from AllSides Media Bias Chart 2019 v1.1 (
AllSides 2019) is shown in
Figure 2. Left-leaning news outlets have tended to use terms that denote far-right political extremism, on average, four times more often than terms that denote far-left political extremism for the time period 2000–2019 (ratio of average far-right to average far-left terms frequency:
/
). There is an increasing trend in the usage of terms denoting right-wing political extremism in left-leaning news outlets prior to 2015, but the pattern appears to accelerate after that pivotal year, which saw the political emergence of Donald Trump. A similar trend is observable in human-rated center-leaning news outlets, with the average prevalence of far-right-denoting terms being, on average, more than three times higher than the prevalence of far-left political extremism (
/
). For left- and center-leaning outlets, the
/
ratio also appears to be increasing over time. Conversely, right-leaning outlets use, on average, terms denoting far-left political extremism only slightly more often than they use terms denoting far-right political extremism (
).
The usage of both far-right and far-left denoting terms appears to be rising across outlets regardless of their ideological leanings, but the pattern is more pronounced for far-right denoting terms. There is a mild uptick in the usage of terms denoting far-left political extremism in right-leaning outlets coinciding with Barack Obama’s victory in the U.S. presidential election of 2008, though this is much less pronounced than the recent rise in terms denoting far-right political extremism in left-leaning outlets. Another noteworthy feature of these results is that, on average, right-leaning news outlets are about two times more likely to talk about right-wing political extremism than left-leaning news outlets are to talk about left-wing political extremism. Across the political spectrum, the correlation between the time series representing the usage of terms denoting left- and right-wing political extremism terms is high.
A potential confound in
Figure 2 is the decreasing availability of news articles’ content in outlets’ online domains for earlier years and the fact that some influential outlets in 2019 did not exist in the early 2000s (see
Supplementary Materials for metrics of articles availability per outlet/year). However, replicating the analysis in
Figure 2 for the 27 media outlets with continuous news content available since at least 2010 shows the same trends as those in
Figure 2 (see
Supplementary Materials for details). We also replicated the analysis in
Figure 2 with the 10 U.S. outlets in our data set with continuous article content available since the year 2000. The results are very similar to those in
Figure 2 for left-leaning and center-leaning news outlets. In contrast, the three right-leaning news outlets (
The Wall Street Journal,
The New York Post and
The Washington Times) fulfilling the inclusion criteria for this analysis showed a higher prevalence of far-right-denoting terms than far-left-denoting terms in recent years’ content (see
Supplementary Materials).
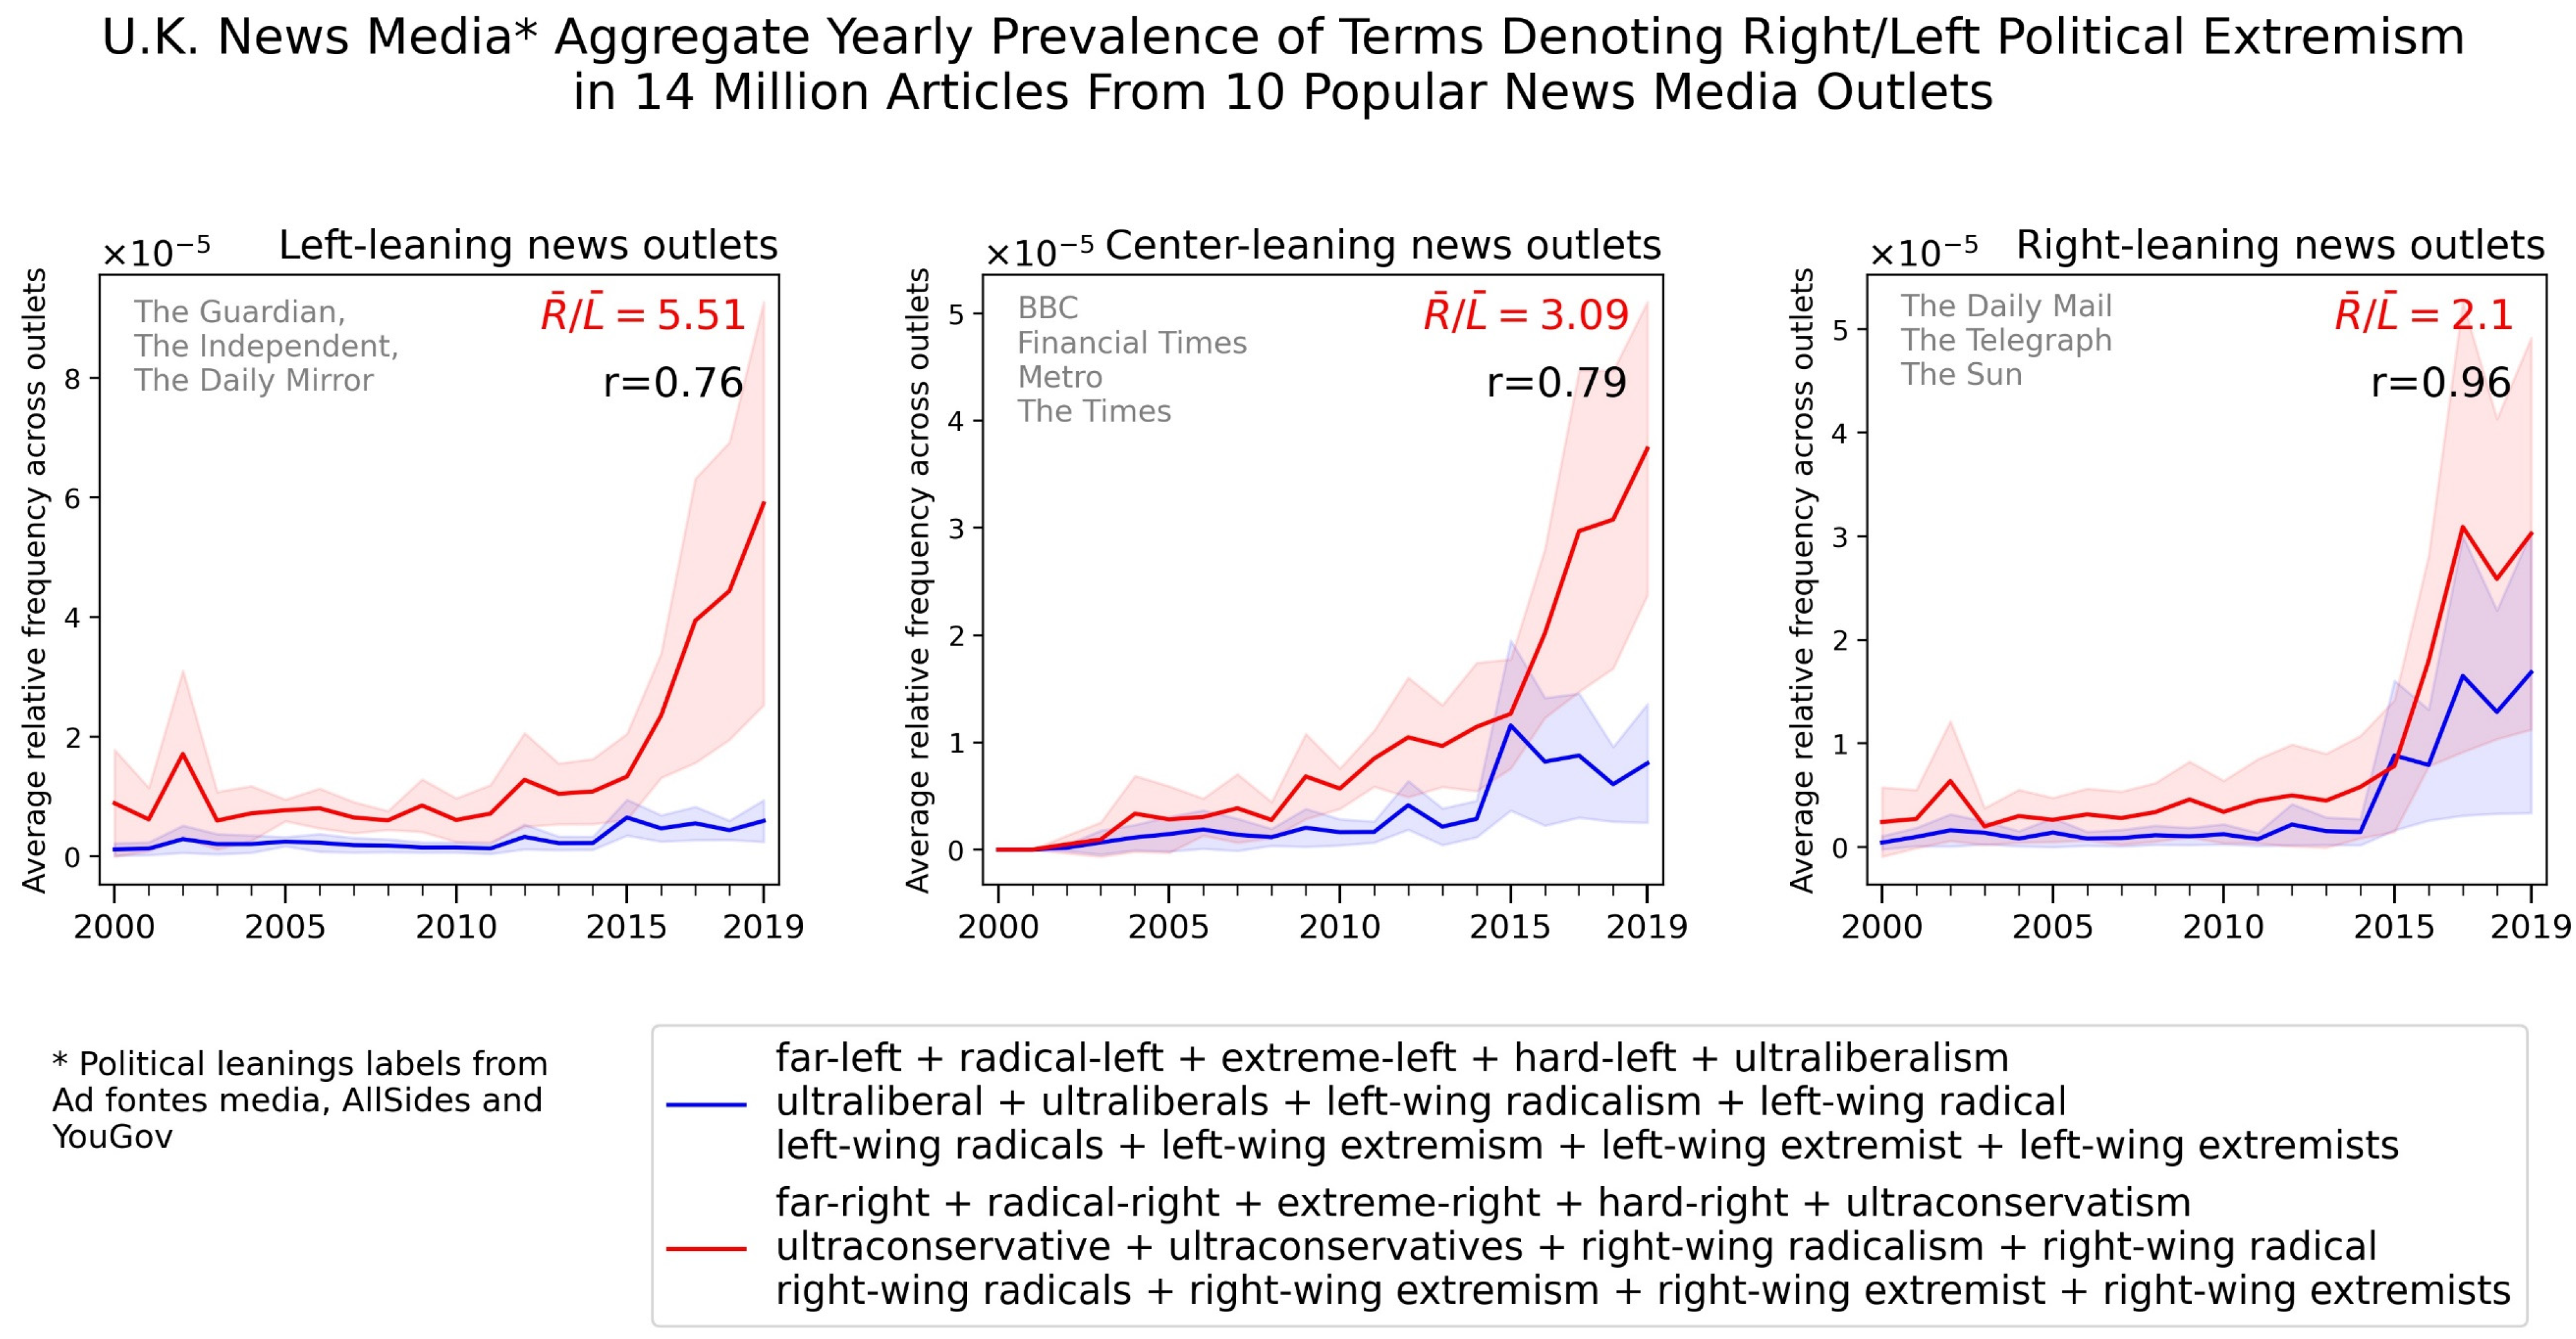
We replicated the analysis above for 10 popular news media outlets based in the United Kingdom. The results are very similar to those from U.S. news outlets (see
Figure 3), with rising usage of terms denoting political extremism, a higher overall prevalence of far-right-denoting terms than far-left-denoting terms and even right-leaning news media using far-right-denoting terms more often than they use far-left-denoting terms. Right-leaning news outlets in the U.K. are, on average, five times more likely to use far-right denoting terms than left-leaning news outlets are to use far-left denoting terms. Replicating these analyses for the 6 U.K. news outlets with continuous availability of news content since the mid-2000s generates similar results (see
Supplementary Materials).
Figure 4 shows the prevalence of far-right- and far-left-denoting terms in all the individual U.S. outlets studied. This disaggregation by source shows that the growing usage of terms denoting political extremism is visible within most outlets, thus confirming the consistency of the trend across media organizations. The trend of left-leaning and center-leaning news outlets using far-right denoting terms substantially more often than far-left denoting terms is likewise apparent. Right-leaning outlets display a more moderate and diverse pattern. Similar to their left-leaning counterparts, some right-leaning outlets such as
The Wall Street Journal,
The Washington Times or
The New York Post tend to use far-right denoting terms more often than they use far-left denoting terms. Other right-leaning news outlets, like
Breitbart or
National Review, tend to use extreme-left denoting terms more often than extreme-right denoting terms. However, the ratio of the political out-group being characterized as extreme tends to be more moderate in right-leaning than in left-leaning news outlets. Whether this disparity stems from biased news media perceptions or the empirical reality of more far-right than far-left activity is beyond the scope of this analysis. It could also be that right-wing partisan outlets use a wider set of terms to refer to the far-left than vice-versa. However, as there is no clear methodology for compiling a list of comparable bespoke terms, we opted to use a consistent set of pairings that emphasize symmetry between the two sets of terms denoting right and left political extremism.
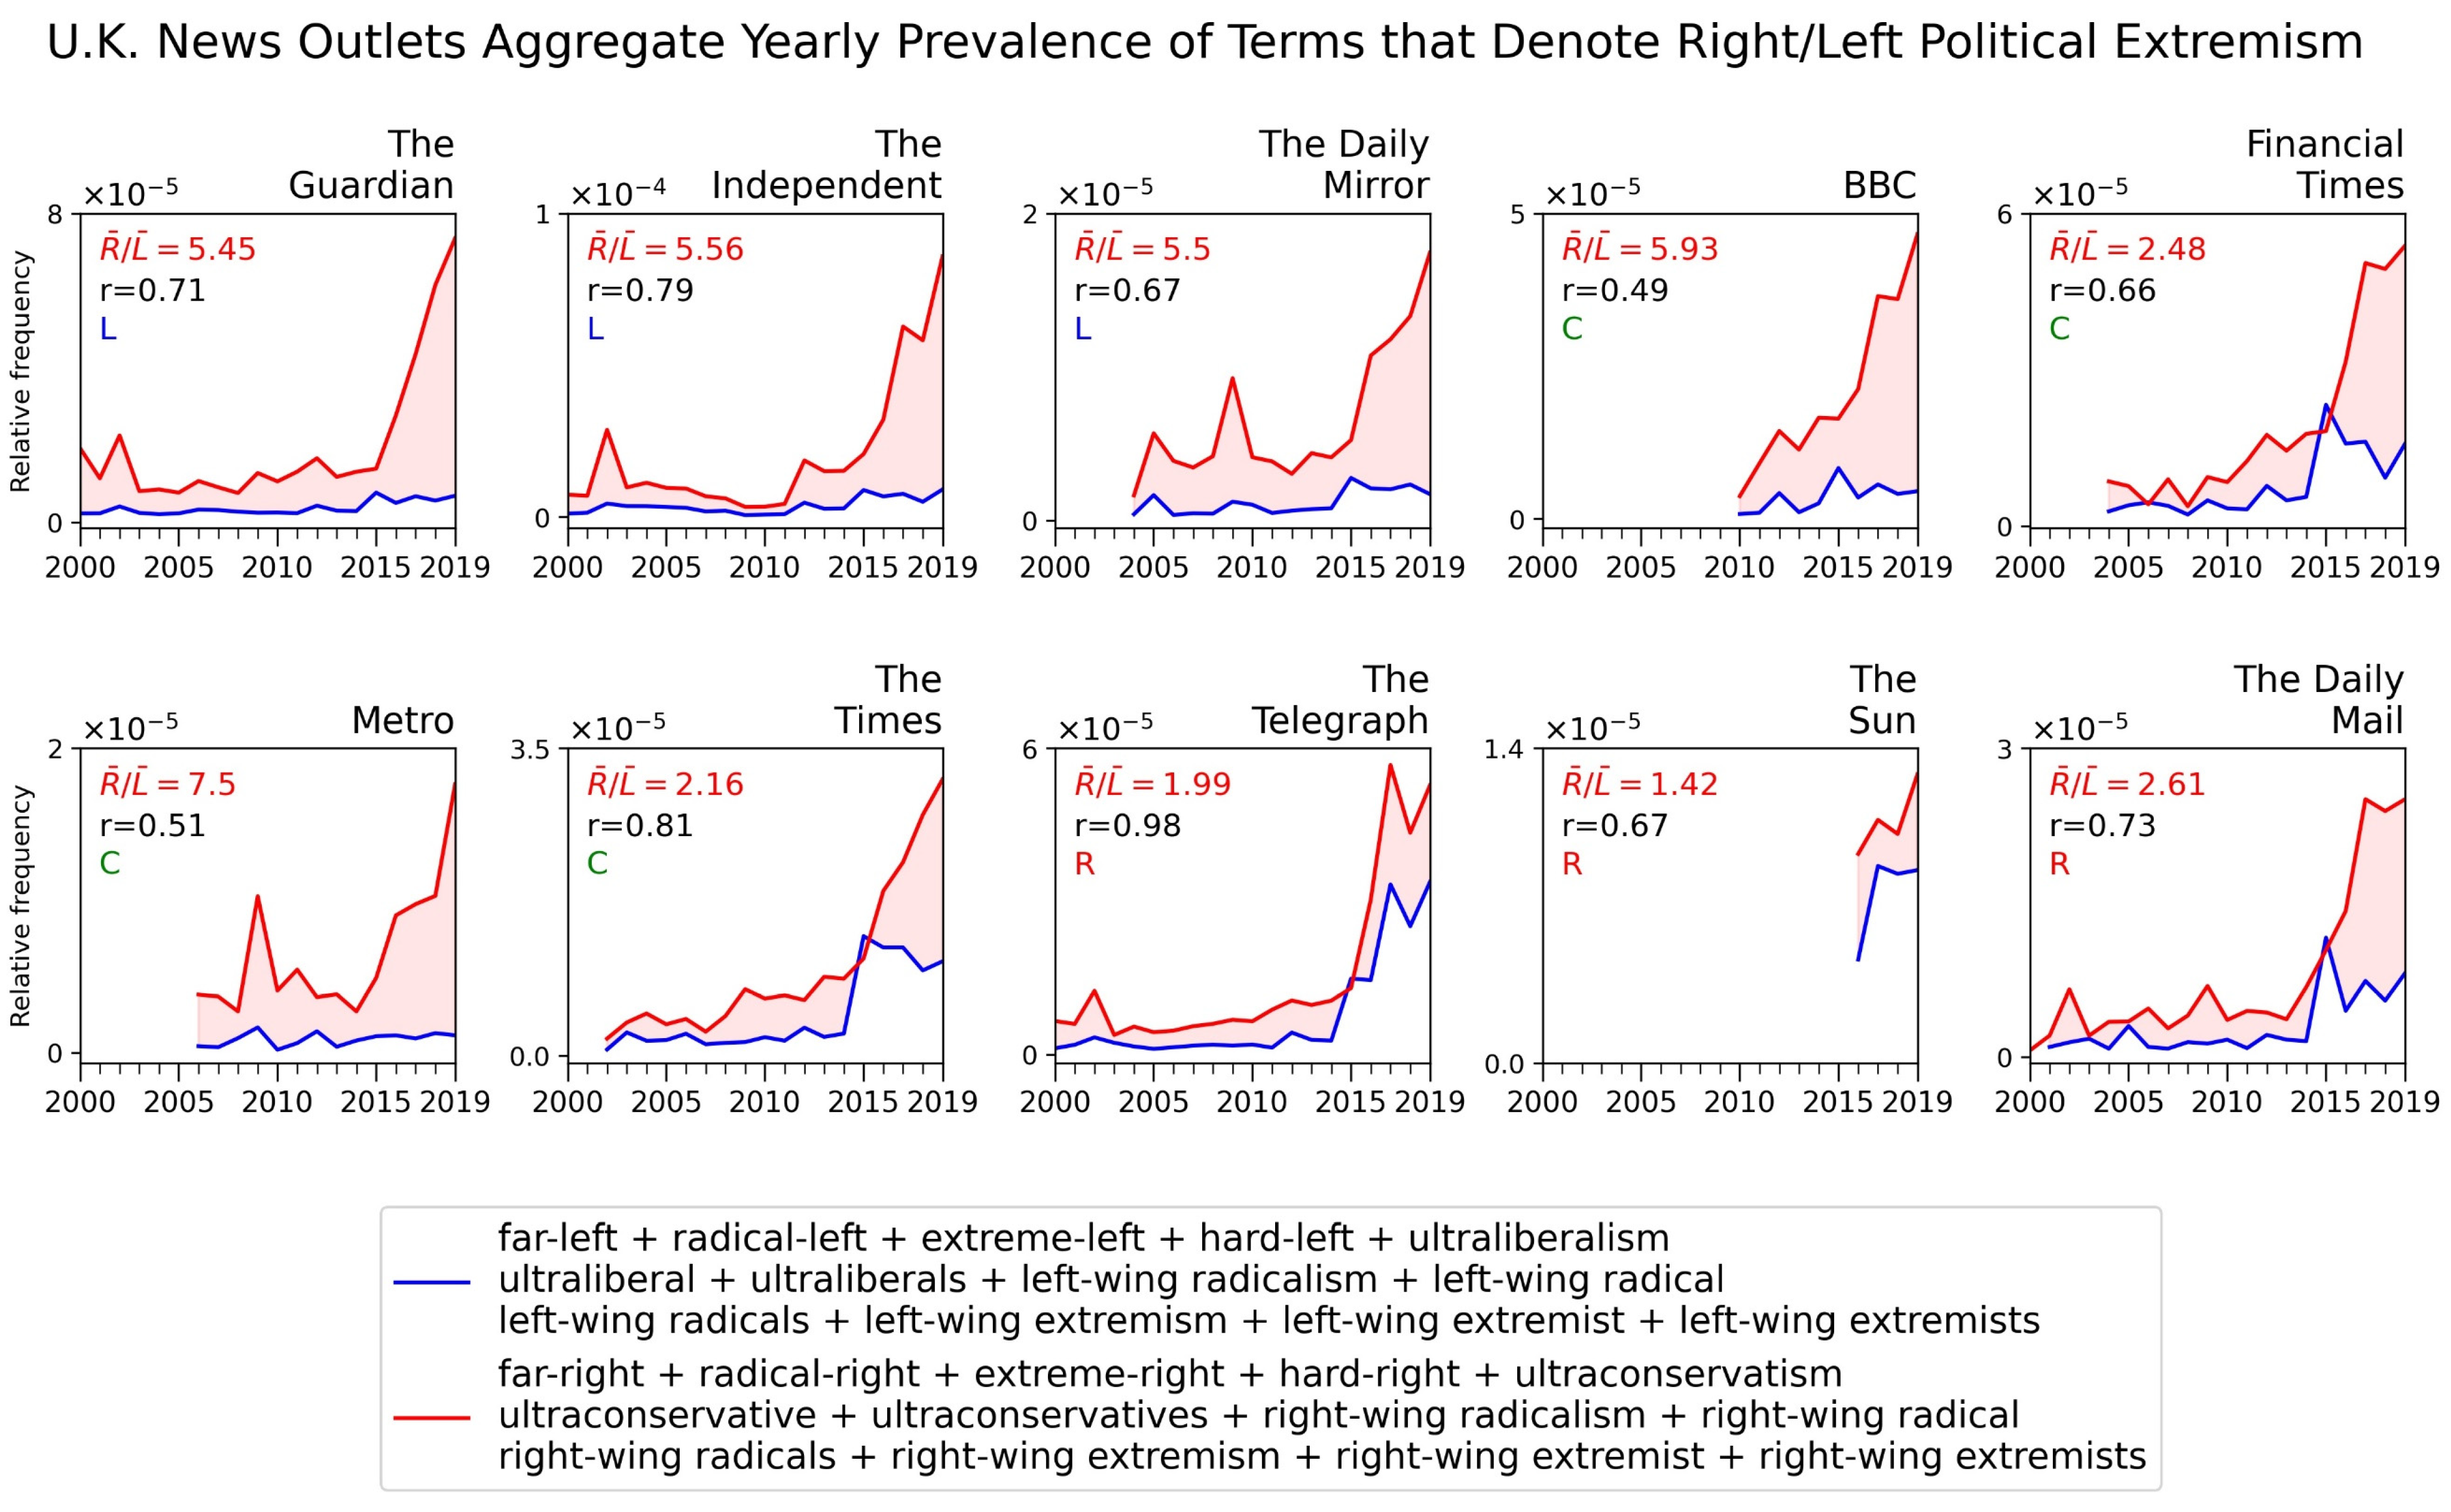
Replicating the analysis above for all the individual outlets in the U.K. generates similar results; see
Figure 5. All ten outlets analyzed, including right-leaning sources, use terms denoting far-right political extremism more often than they use terms denoting far-left political extremism.
Figure 2 and
Figure 3 only display the prevalence patterns of political extremism denoting terms in news media content for the time interval 2000–2019. We next examine the prevalence of such terms for a longer time frame. Only two influential news outlets in our data set have substantial news articles content available online all the way back to the 1970s:
The New York Times and
The Washington Post. Thus, we replicate the analysis in
Figure 2 above for just those outlets for the time range encompassing 1970–2019; see
Figure 6.
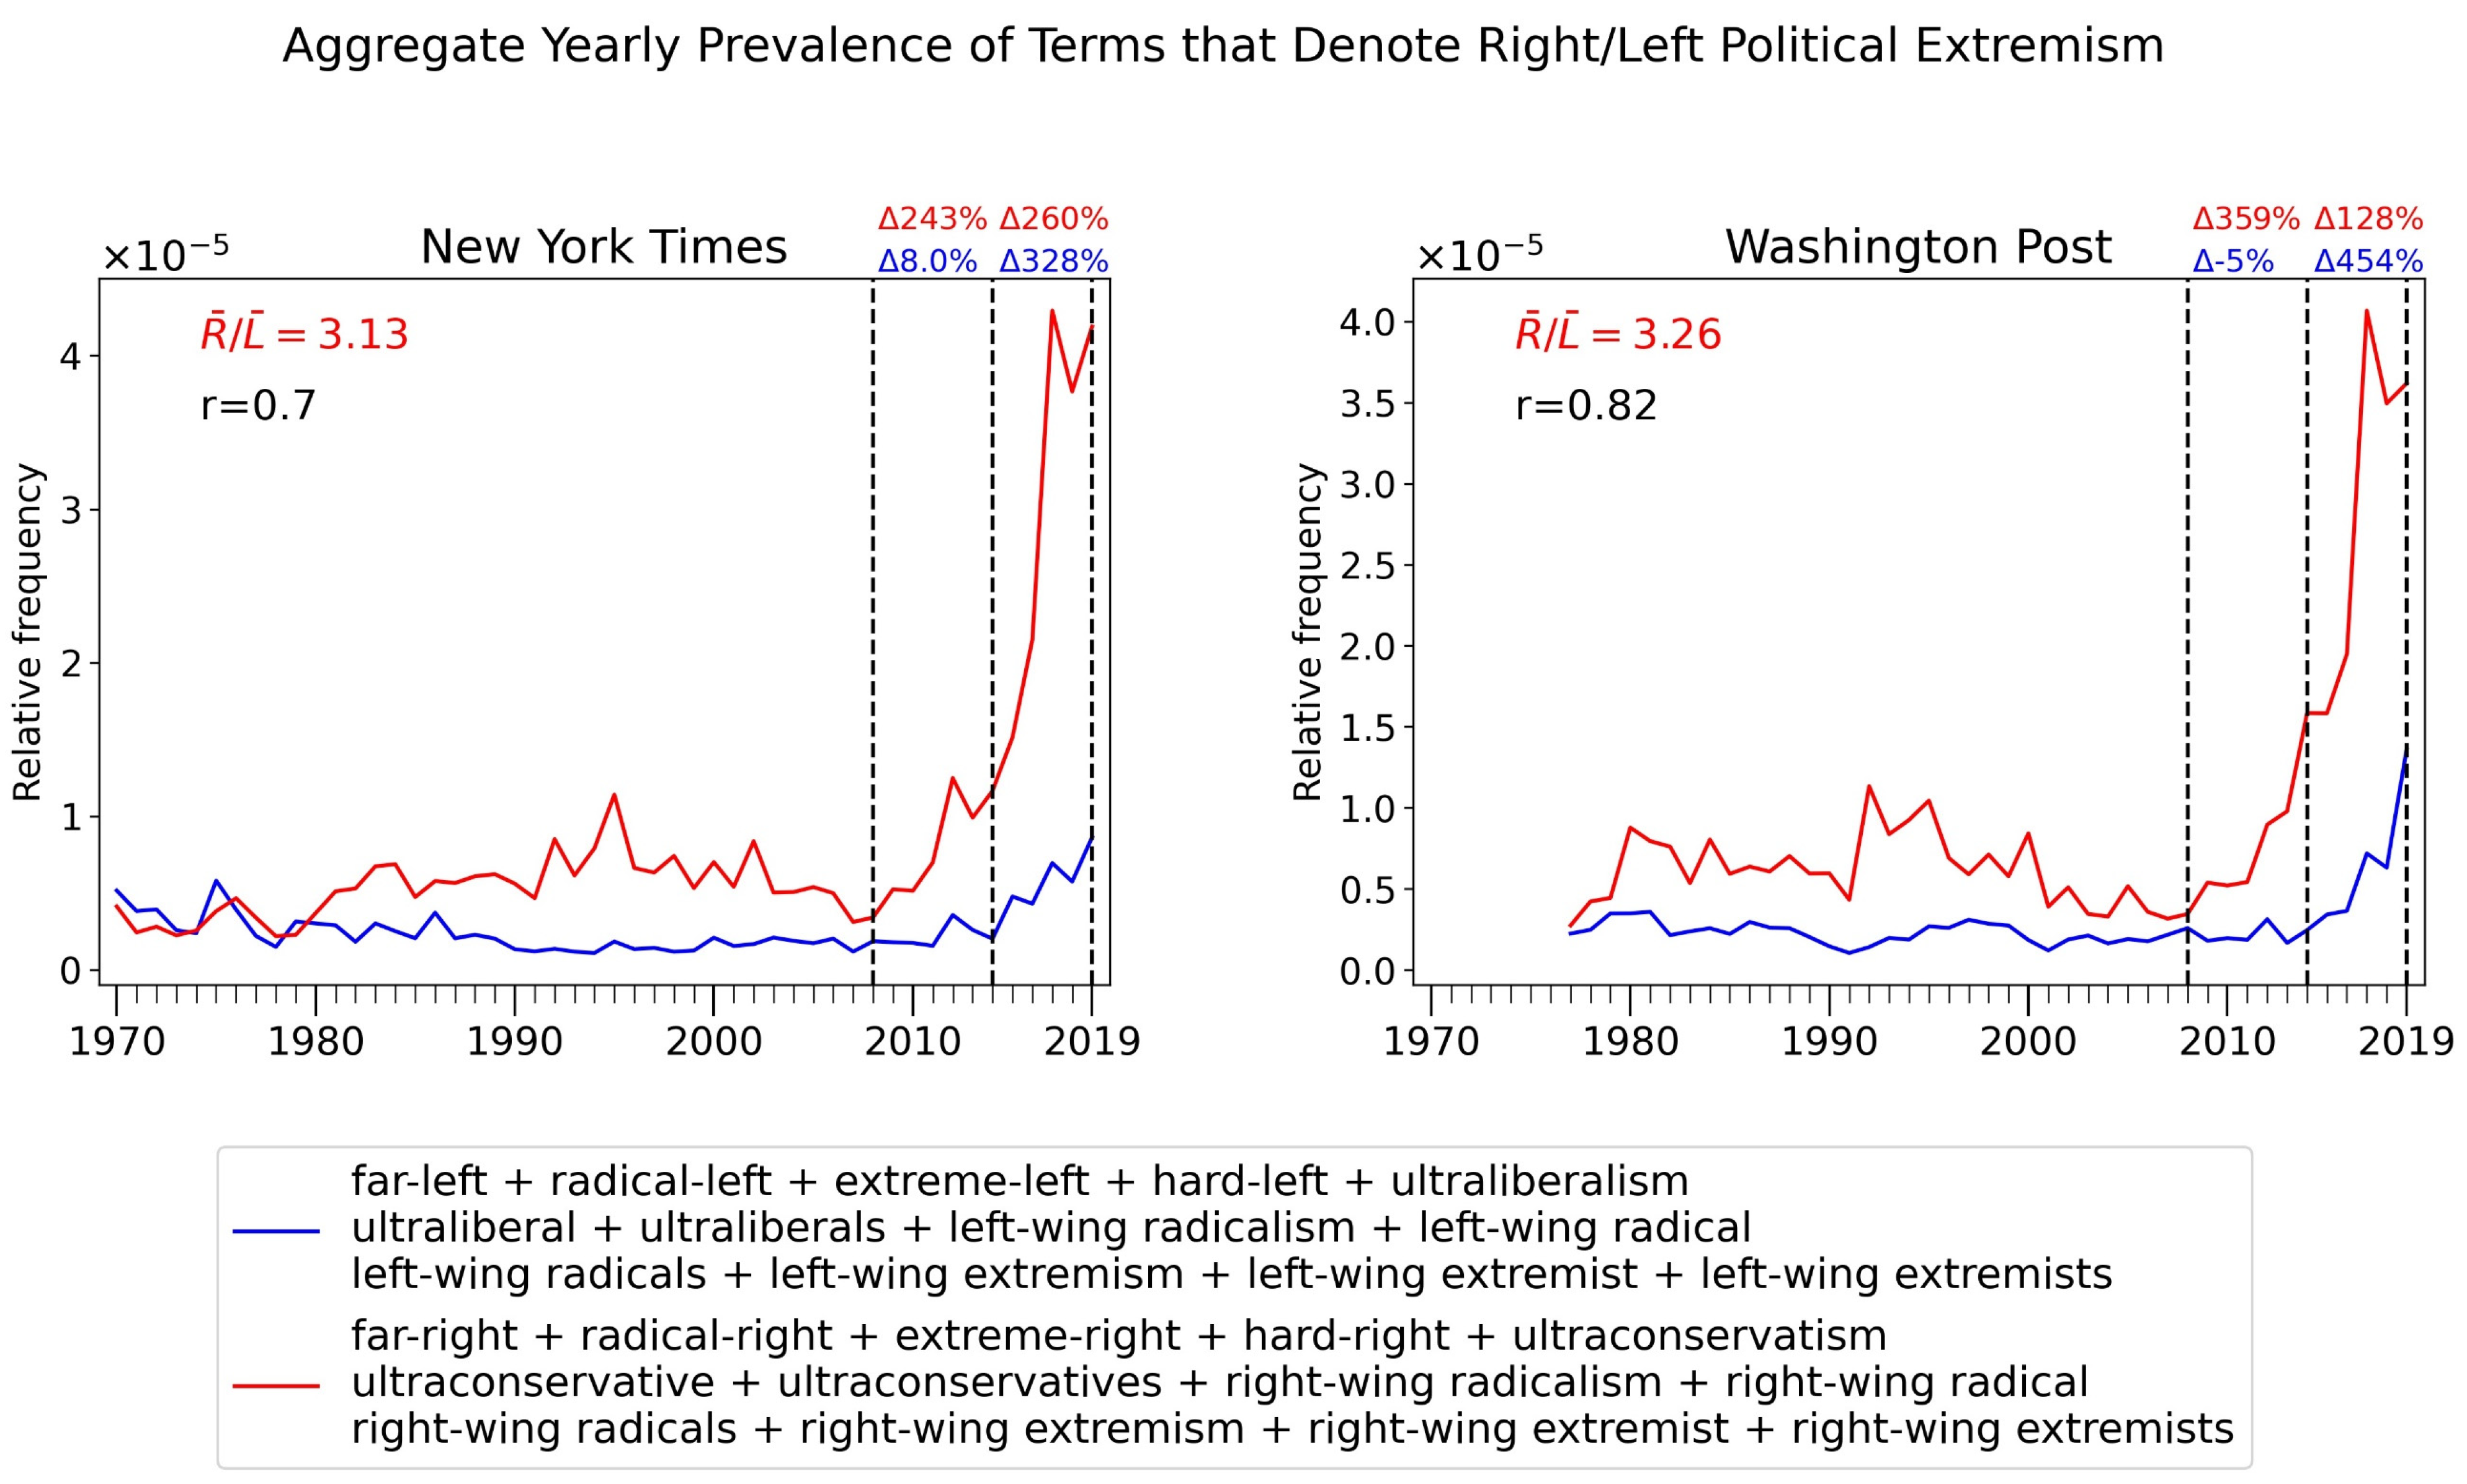
In the 1970s,
The New York Times used terms denoting far-right and far-left political extremism at a comparable rate. Since the 1980s, however, both in
The New York Times and in
The Washington Post, the prevalence of right-wing-extremism-denoting terms has been, on average, more than three times higher than the prevalence of terms denoting left-wing extremism. Usage of terms denoting right-wing political extremism has been relatively stable from the 1980s until around 2010, with a mild prevalence peak in the mid-1990s. Usage of terms denoting far-left political extremism has been relatively stable since the 1980s, but the usage of such terms started to grow in 2015.
Figure 6 highlights with vertical dashed lines three relevant years: 2008, when Barack Obama won for the first time the U.S. presidential election; 2014, the year prior to the 2015 entrance of Donald Trump into the U.S. political scene and 2019, the final year of our analysis. The usage of far-right-denoting terms grew substantially from 2008 to 2014 (243% and 359% in
The New York Times and
The Washington Post, respectively) and continued to increase from 2015 to 2019 (260% and 128%). These patterns indicate a strong polarizing dynamic arising before Trump, with his arrival in 2015–2016 arguably serving as a reinforcer.
In contrast, far-left-denoting terms did not grow in prevalence in either outlet between 2008 and 2014. However, between 2014 and 2019, the prevalence of such terms increased markedly (328% in the New York Times and 454% in the Washington Post), indicating rising far-left activity in society or a growing concern with the far-left in these moderate left-leaning outlets. Despite the latter increase, the prevalence of far-right-denoting terms in the year 2019 remained almost 4 times higher than far-left-denoting terms in The New York Times and 3 times higher in The Washington Post. The correlation between the right and left political extremism-denoting terms in the two outlet-specific time series is large.
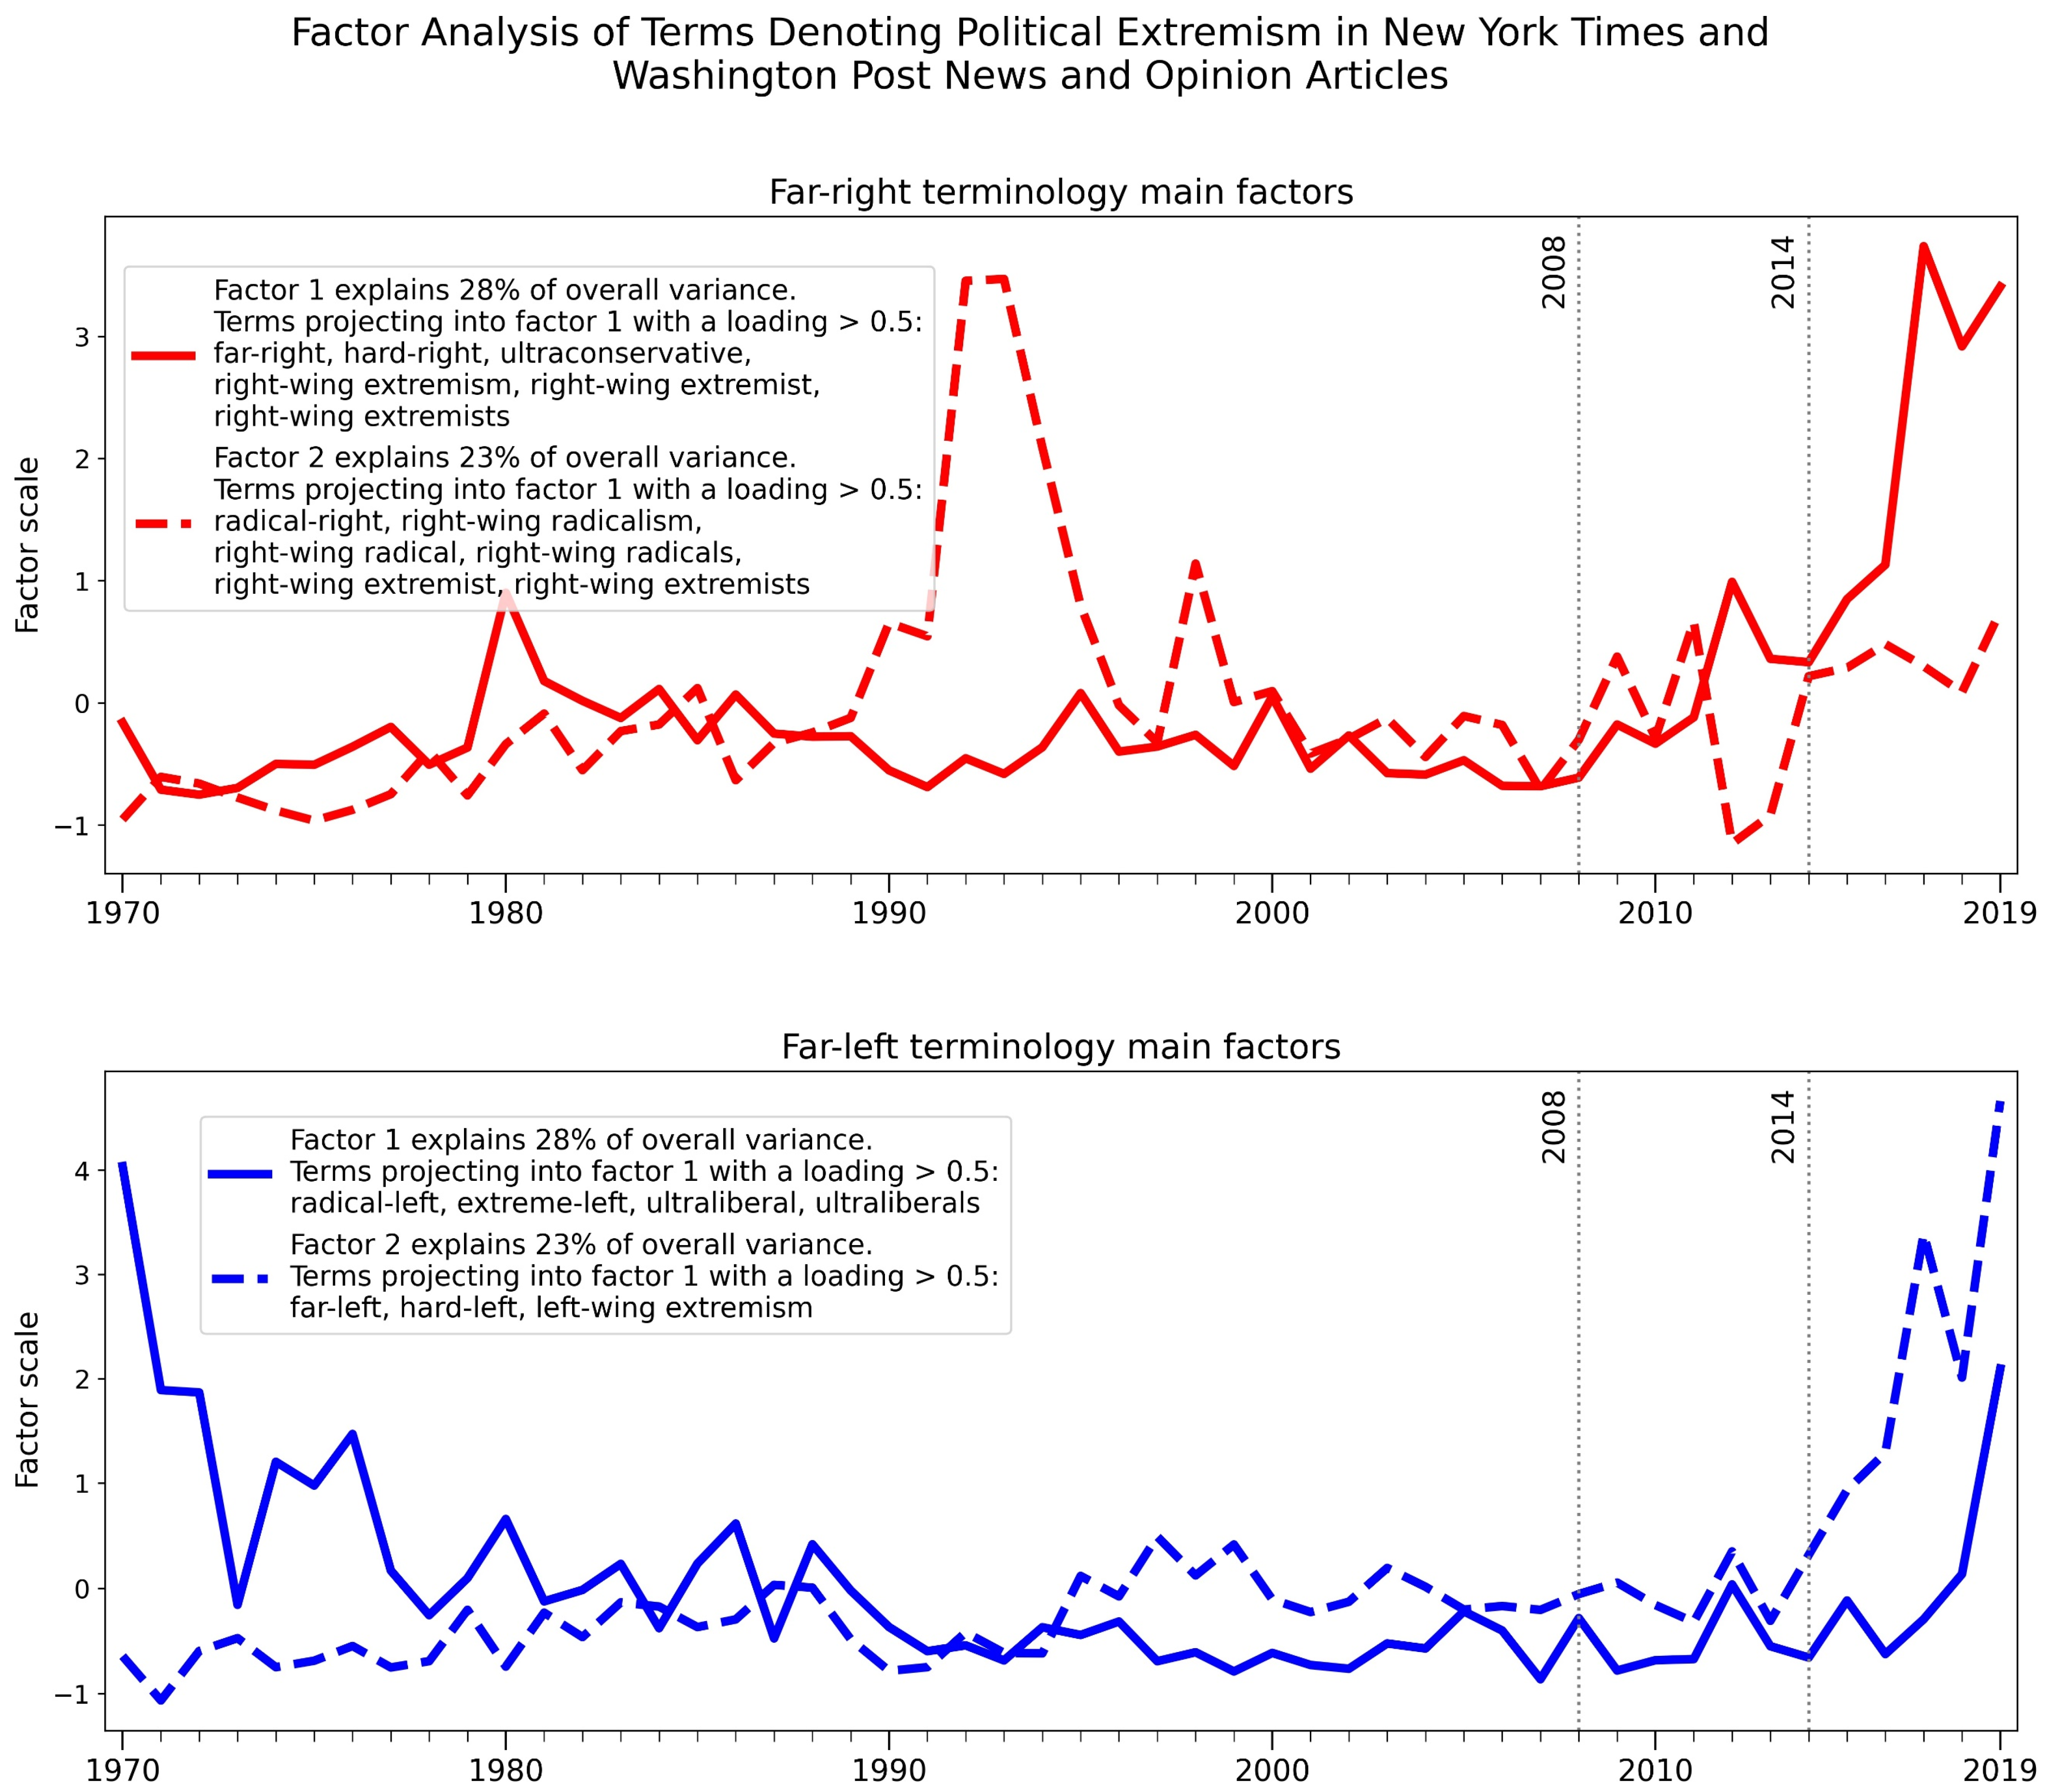
Adding up the relative frequencies of related terms denoting right and left political extremism is useful to quantify the overall prevalence of each theme in the corpus. However, such aggregate metrics can obscure the temporal dynamics of individual terms within the set since the specific dynamics of lower prevalence terms can be masked by terms with larger prevalence. To provide another vantage point of the phenomena under study, we carry out a factor analysis of the target terms for the two newspapers with the longer frequency time-series data available,
The New York Times and
The Washington Post; see
Figure 7. The results confirm our previous conclusions but add detail. The prominence of several terms denoting far-right extremism increased substantially in both newspapers between 2008 and 2014 and then accelerated further post-2014. In the early 1990s, a reduced set of far-right-denoting terms such as
radical-right,
right-wing radicals or
right-wing extremists experienced peak usage coinciding with the deadly sieges at Ruby Ridge, Idaho, in 1992 and Waco, Texas, in 1993. Some far-left-denoting terms such as
radical-left decreased in prominence in
The New York Times during the early 1970s. Increasing usage of far-left denoting terms picked up again only post-2014 in both outlets.
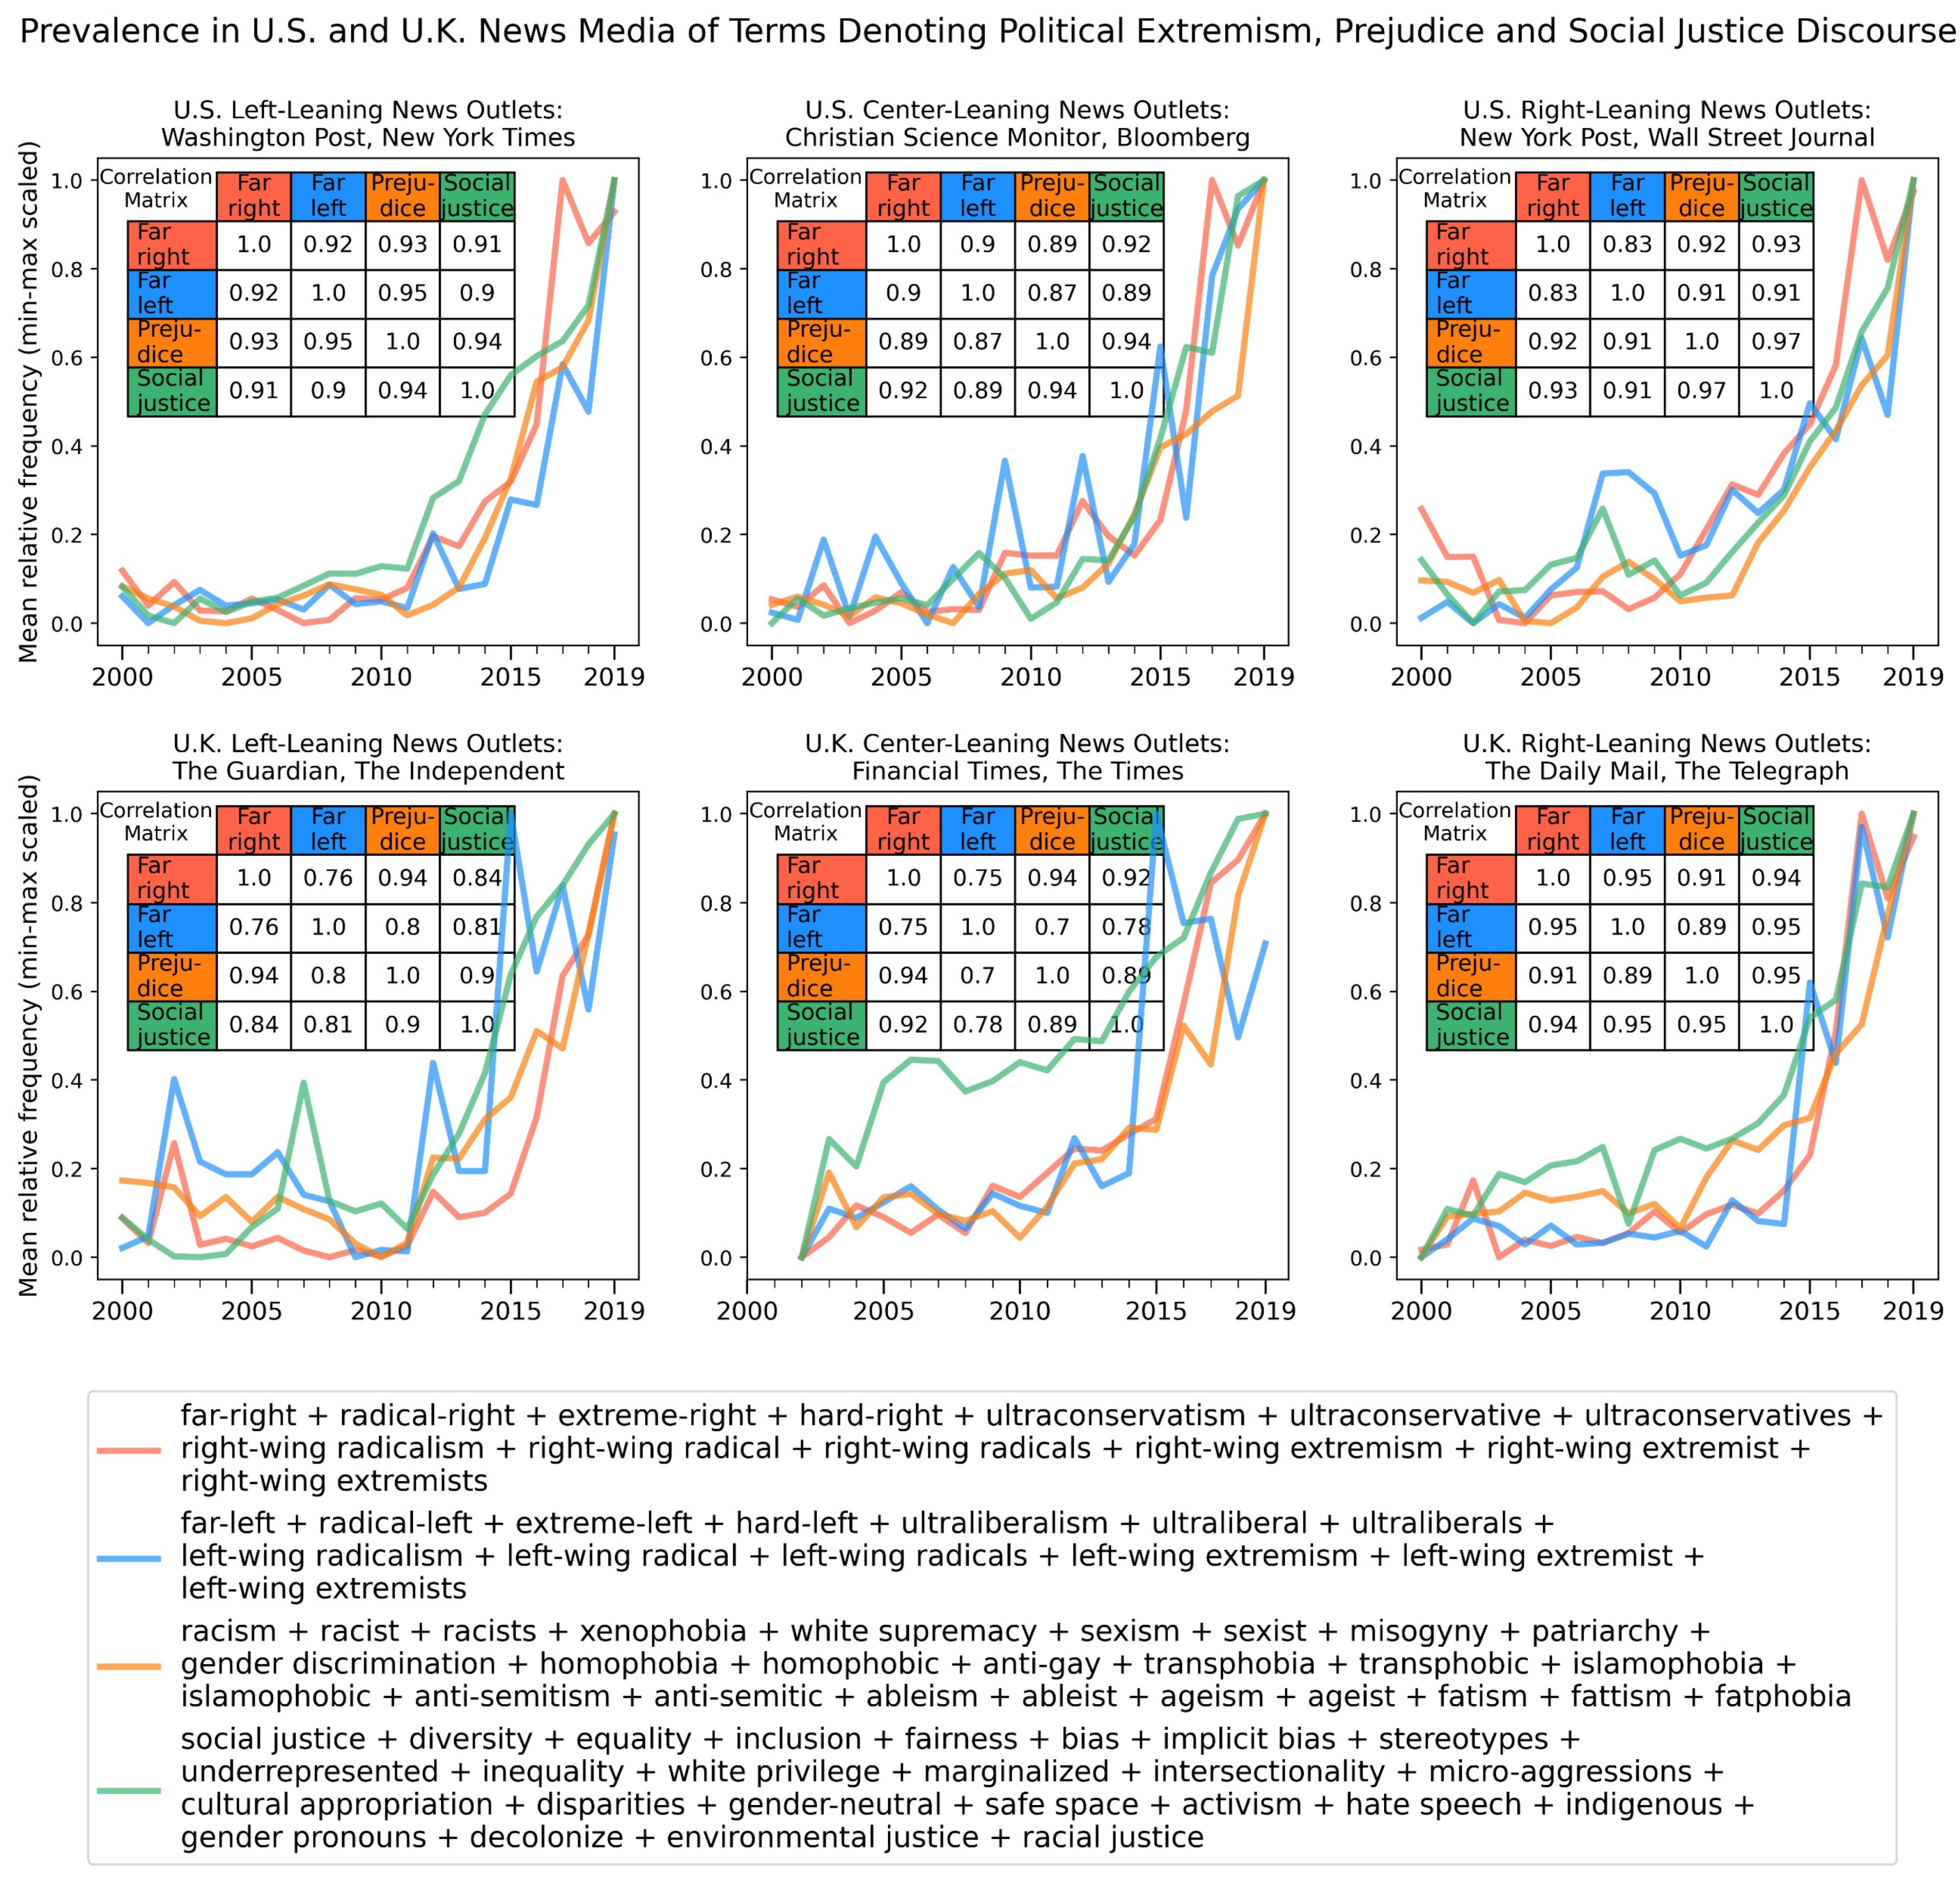
Finally, we note that the growing prevalence of terms denoting political extremism in U.S. and U.K. news media is strongly associated with concomitant trends documented previously (
Rozado 2020;
Rozado et al. 2021) about the rising use of terms denoting prejudice and social justice discourse in news media content; see
Figure 8. The figure shows the most widely read news outlets in our data set with complete and continuous data availability since the year 2000. An exception had to be made for the U.K. center-leaning outlets
The Times and the
Financial Times, for which online data availability only started in the years 2002 and 2004, respectively.
4. Discussion
Our results indicate that the prevalence of terms denoting political extremism in U.S. and U.K. news media has been increasing dramatically since at least 2008 and that this trend is particularly acute for terms denoting far-right extremism. We also noted that the increasing usage of terms denoting political extremism is strongly associated with the previously documented rising prevalence of terms denoting prejudice and social justice discourse in news media content. This connection suggests the potential existence of a common latent factor simultaneously driving news media’s usage of terms denoting political extremism, social justice discourse and prejudice. Our results also illustrate that mainstream news media is, on average, substantially more likely to use far-right-denoting terms than far-left-denoting terms. A natural follow-up question is the reasons for this disparity.
In chronological terms, the sharp increase in the prevalence of far-right-denoting terms in news media content appears to have begun during the Obama presidency, with very substantial increases in the prevalence of far-right-denoting terms in news outlets between 2008 and 2014. The political emergence of Donald Trump in 2015 might have reinforced this trend. Nevertheless, it is important to emphasize that the growth began prior to the political rise of Donald Trump. This largely parallels the rising prevalence in news media of terms denoting prejudice and social justice discourse that have been identified as also rising prior to 2015 (
Rozado 2020;
Rozado et al. 2021).
The biggest limitation of this work is that we cannot elucidate whether the media’s increasing use of terms denoting political extremism is driving, exaggerating or merely responding to concomitant rising political extremism in society. It is conceivable that far-right activity in society could have increased more markedly than far-left activity, justifying news media concern about it. It is, however, challenging to establish an Archimedean point of political neutrality to use as a reference for determining precisely what counts as political extremism.
That is, while it is indisputable that groups which are labeled hard-right have been increasingly prominent in U.S. and European politics, it is also plausible that the center of gravity in established media newsrooms, as in other elite professions (
Heterodox Academy 2017), has been shifting leftwards, especially as prestige news media is increasingly organized and edited by graduates from elite universities who tend to hold increasingly socially liberal beliefs (
Pew Research 2016). Indeed, journalists have been found to lean left more than the general population (
Benson 2005;
Call et al. 2021;
Dennis 1997;
Hopmann et al. 2010;
West 2021). Therefore, a plausible explanation for the asymmetry in the prevalence of terms denoting left and right political extremism in news media content could be due to the ideological imbalance in newsrooms that might shape journalists’ choices of political adjectives so as to trigger negative associations with political actors or attitudes that they dislike.
Another potential explanatory factor for the rising incidence of political extremism-denoting terms in news media is the existence of financial incentives for media organizations to maximize the diffusion of news articles through social media channels. It has been demonstrated that user engagement in social media can be increased by news content that triggers negative sentiment/emotions (
Hansen et al. 2011). Furthermore, political out-group animosity has been shown to drive engagement in social media-based news consumption (
Rathje et al. 2021). Thus, a perverse incentive might have emerged in which news outlets are incentivized to use terminology denoting political extremism to maximize the engagement and spread of their news content through social media.
All of the aforementioned hypotheses (rising political extremism in society, the political biases of news media professionals shaping what gets labeled as political extremism and financial incentives motivating the usage of emotionally charged language) are plausible and consistent with our results on the rising prevalence of political extremism terminology in news media content. Yet, our methodology cannot discriminate among them. This is, therefore, an open question for future research.
An important question raised by our results concerns the social consequences of news media's increasing usage of adjectives denoting extreme political beliefs. If political attitudes are indeed becoming more radical, news media institutions are fulfilling their role of reporting social trends to their readership. If, however, people are not leading the change, but rather newsrooms are responding to economic or ideological factors that incentivize the usage of extreme political adjectives, this could be contributing to rising political animosity in society. The fact that U.K. media trends are similar to those in the U.S. suggests the existence of common factors driving these trends internationally.
A methodological limitation of this work is our inability to control for changes in the language used to signify political extremism. That is, contemporary discourse terminology used to describe political extremism might have undergone semantic shifts compared to previous decades. In addition, different terms employed to signify political extremism might have increased or decreased in popularity over time. While our analysis does not explicitly control for these factors, our usage of different vantage points from which to observe the studied trends, such as factor analysis, allowed us to distinguish increases and decreases in the popularity of specific right- and left-wing extremism-denoting terms over time.
Another limitation of our analysis is the human ratings of outlets’ ideological biases that we used to classify publications as left, centrist or right-leaning. We used static labels for outlets’ ideological bias based on contemporary human ratings. It is possible that some outlets have changed their ideological leanings over time, creating the potential risk of using recent ratings on historical data. However, such changes have probably been rare and relatively mild, like an outlet gravitating from centrist leanings toward left-of-center. Thus, we find it unlikely that such occasional shifts would substantially alter the main findings reported here.
To conclude, we find a rising prevalence in news content since at least 2008, and especially since 2015, of terms that denote extreme left- and right-wing ideologies. This holds in both the U.S. and the U.K., and among left-, centrist- and right-leaning outlets. Furthermore, for at least the past two decades, most news media outlets across the U.S. and the U.K. have tended to use terms that denote far-right political inclinations substantially more often than those pertaining to the far-left. The rising usage of terms denoting political extremism in news media is analogous to the concomitant growing usage of terms denoting prejudice and social justice discourse.


