
Barriers to Adopting New Technologies within Rural Small and Medium Enterprises (SMEs)


Department of Economics, University of Molise, 86100 Campobasso, Italy
Soc. Sci. 2021, 10(11), 430; https://doi.org/10.3390/socsci10110430
Submission received: 20 September 2021
/
Revised: 1 November 2021
/
Accepted: 2 November 2021
/
Published: 9 November 2021
(This article belongs to the Section Social Economics)
Abstract
:The adoption of technologies by small and medium enterprises (SMEs) that operate in several business sectors in rural areas is a crucial issue because they often need financial and technical incentives and support from public and local authorities. The question of whether and how innovation can be replicated and applied in a wider context is strictly connected to the understanding of those factors and mechanisms capable of determining the success or failure of the introduction of innovation itself. In this paper, the attention is focused on the impact of new technologies in order to increase SMEs’ competitiveness and productivity among the firms. For this purpose, only recent resources, research and studies that have been implemented during the last twenty years are taken into account. Firstly, based on these studies, the main disruptive technologies were selected. Secondly, the evidence is drawn from stakeholder data discussions of the Interreg Europe project “Regional policies for innovation driven competitiveness and growth of rural SMEs—INNOGROW”, covering eight European countries (Bulgaria, Czech Republic, Greece, Hungary, Italy, Latvia, Slovenia and the United Kingdom). Descriptive statistics were applied to describe the case identities. The cases’ needs, enablers and barriers in different groups were analyzed using a chi-square test and Mann–Whitney U Test. The results of this study are important for both researchers as well as small business practitioners (including government agencies and owners/managers) in order to provided policy recommendations, concerning how to establish favourable conditions and offer incentives to SMEs to integrate innovative solutions into their business models.
1. Introduction
In several studies, the innovativeness of growing firms has been discovered to be important in value and job creation (Acs and Mueller 2008; Autio and Hoeltzl 2008; Autio and Acs 2009; Bigliardi 2013; Delmar et al. 2013; Fieldsen 2013; Henrekson and Johansson 2010; Parker et al. 2010). Other studies usually focus on creative activities and the role of research and development (RandD) investments and public RandD funding as positive factors in the overall growth, success and survival of a firm. (Branzei and Vertinsky 2006; Calvo 2006; Forsman and Annala 2011; Freel and Robson 2004; Hölzl 2009; Koellinger 2008; Thornhill and Gellatly 2005; Thornhill 2006). A key conclusion is that there is a positive correlation between innovativeness and growth. However, the types of innovation adopted by firms that operate in rural economies have received relatively little scholarly attention. As a result, the main aim of this paper is to fill this research gap. Indeed, the objective of this contribution is to assess whether and how the adoption of new technologies by small and medium enterprises (hereinafter SMEs), operating in rural economies, can generate growth in their competitiveness and profitability and, consequently, to propose recommendations for policymakers. For this purpose, derived from the previous literature, the impact of new technologies suitable for rural economy SMEs are identified, on the basis of the stakeholders’ discussion, the enablers and barriers for adopting each technology and the way to support the rural economy, and useful recommendations on how to establish favourable conditions and offer incentives to SMEs for integrating innovative solutions in their business models are provided to public authorities.
This work reports the results of the regional policies for innovation driven competitiveness and growth of rural SMEs (INNOGROW Interreg Europe Project 2016–2021), carried out by nine partners (Territorial Development Agency of the Stara Zagora region, Territorial Development Agency of the Pardubice region, Thessaly region, Territorial Development Agency of the Western Transdanubia region, Lombardy Foundation for the Environment, Molise Chamber of Commerce, Semgallia region, Territorial Development Agency of the Upper Carniola region, Newcastle University) in eight countries (Bulgaria, Czech Republic, Greece, Hungary, Italy, Latvia, Slovenia and the United Kingdom). The project promotes the adoption of innovation by rural economy SMEs, through sharing practices/experiences between regions and actors relevant to this sector (https://www.interregeurope.eu/innogrow/) (accessed on 12 April 2021).
The findings of this study are expected to help SMEs in these countries and other areas, by providing an insight into the benefits of the adoption and use of sound technology that can help maximize business margins. Moreover, the findings of the study are expected to help planners and policymakers strengthen or adjust their position in business policy formulation.
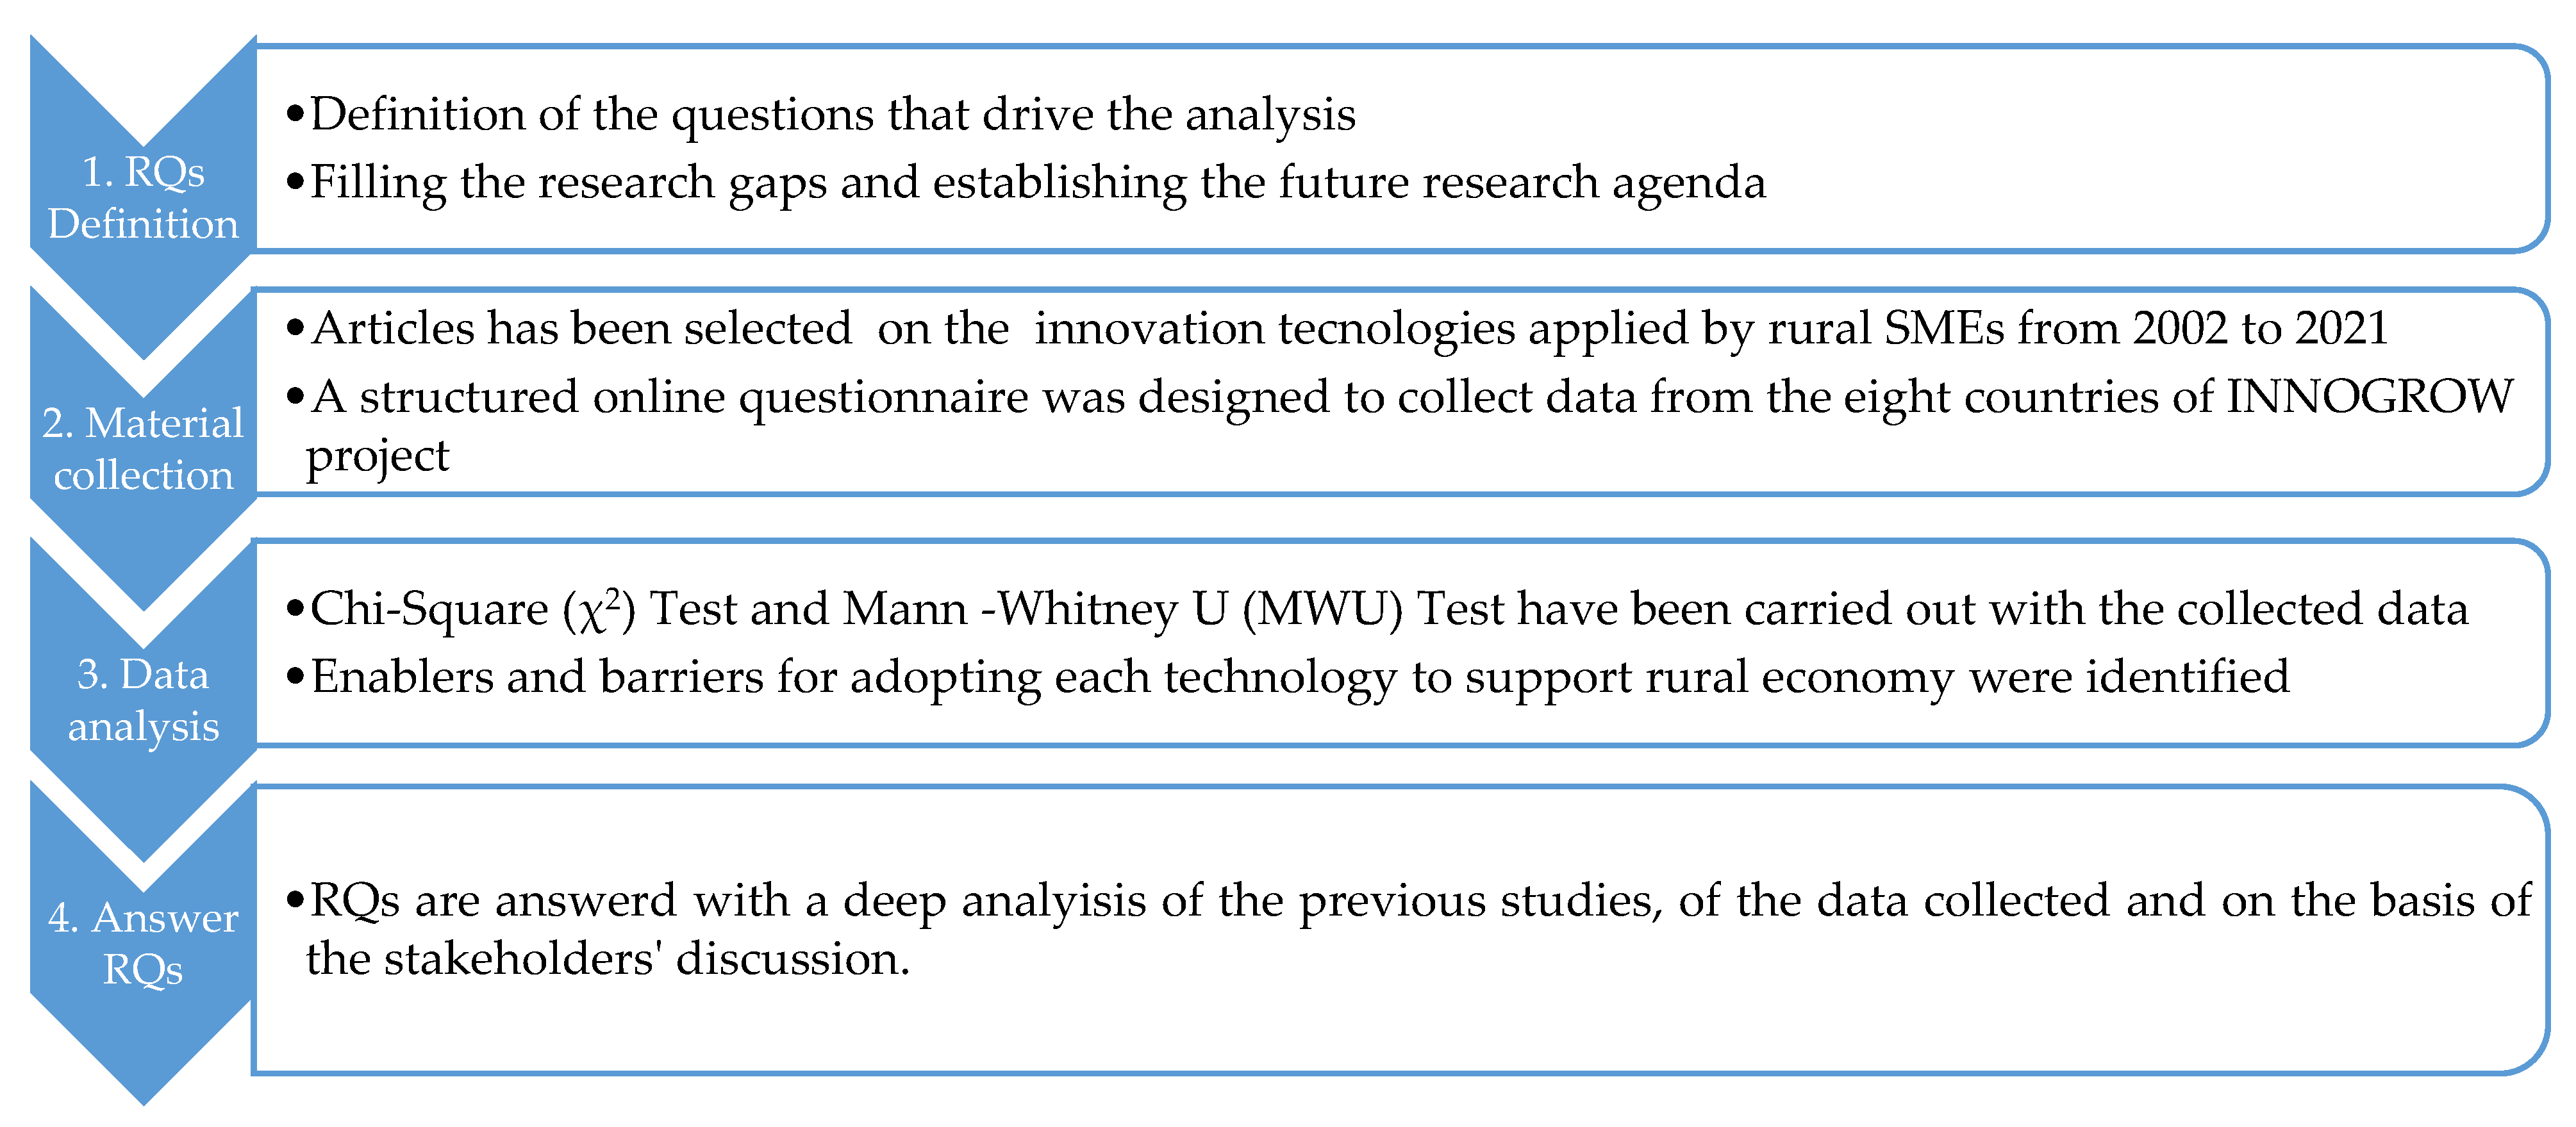
The paper is organised as follows: First, some former studies from which the Research Questions (RQs) and selected technologies are derived are examined; thereafter, the data and methodology are explained; then the results are analyzed and discussed with previous studies; and finally the conclusions and implications are presented together with the limitations of the study (Figure 1).
2. Theoretical Framework and the Formulation of the RQs
The information that was gathered to produce a knowledge base about the main disruptive technologies that have considerable impact on the competitiveness and productivity of rural SMEs was based primarily on research from the countries considered in the analysis. Evidence was gathered from previously published related work such as studies, surveys, industry reports, European Union (EU) projects, databases and online resources. Only recent resources, research studies and projects that have been implemented during the last twenty years were taken into account. The analysis of the literature study was focused on new/innovative technologies that have been implemented from 2002 to 2021. These innovative technologies have been grouped in the following three categories.
2.1. Innovative Production Technologies
Several studies (Afranta et al. 2002; Bergman et al. 2006; Bigliardi and Galati 2013; Capitano et al. 2010; De Jong and Vermeulen 2006; Mark-Herbert 2004; Munday et al. 2011; Niggli et al. 2008; Padel et al. 2015; Pretty et al. 2000; Pretty 2001; Seelan et al. 2003; Sima 2009; Triguero et al. 2013) have found that the adoption of innovative production technologies (e.g., organic farming, renewable energy, precision agriculture, etc.) have significantly influenced SMEs’ competitiveness and profitability. These types of technologies have had a positive environmental impact, have increased the number of customers and have led to access to new markets.
2.2. Technologies Supporting Product Distribution
Studies (Baourakis et al. 2002; Fanelli 2020; Fanelli and Romagnoli 2020; Henchion and McIntyre 2005; Holt et al. 2007; Policy 2013; Simpson and Docherty 2004; Siu 2000; Stratigea 2011) have acknowledged that firms that support product distribution have a competitive advantage.
2.3. Technologies Supporting Product Safety
The technologies that support product safety can also influence a firm’s competitiveness and at the same time contribute to the improvement of the consumers’ status (Gungor et al. 2013; Michailidis et al. 2011; Opara 2003; Ozer 2004; Stoces et al. 2016; Subrahmanya et al. 2010). These technologies have been adopted by SMEs that operate in rural areas and have contributed to the Gross Domestic Product (GDP) of these areas, are connected with rural specific activities and are driven by or based on a natural capital/rural environment.
Based on the assumption that the type of technologies to be adopted depends on specific goals that entrepreneurs want to achieve (e.g., increase access to new markets, increase competitive advantage, provide more information to the final consumer), the first two RQs were formulated:
- RQ1: What type of technology is adopted by rural SMEs?
- RQ2: What goals are most crucial for entrepreneurs?
Furthermore, it is important to report the main factors that affect the innovativeness of growing SMEs. Some studies have argued that locational diversity and the industrial sector would create diverse opportunities to innovate and to exploit the resulting innovations (Almus 2002; Hoogstra and Van Dijk 2004; Hölzl 2009; Mendonca et al. 2004). Innovation capability is considered to be a one-dimensional phenomenon including the actions that could be implemented to enhance the performance of SMEs (Castela et al. 2018), the utilization of experience and ideas from distinct origins (Zhang and Hartley 2018), the external environment and structural factors as well as enterprise-specific characteristics (Laforet 2011). It is possible to hypothesize that there are different barriers that pose obstacles to the introduction of innovations by SMESs, according to the country in which they are located.
Another factor that has been long debated in innovation and growth studies is the size and stage of a firm’s development (Gilmore et al. 2001). Large firms tend to have a resource advantage over smaller ones when it comes to exploiting new technologies (Bhattacharya and Bloch 2004) and for SMEs, finance represents the most commonly identified barrier to innovation (North et al. 2001). However, one of the most influential instruments is the public RandD fund. Investment in RandD creates a platform for the commercialization of new products and processes, because a high distance from the major national and international markets is another competitive disadvantage faced by rural SMEs operating in rural areas (Uvarova and Vitola 2019). Furthermore, information and communication technologies (ICT) allow them to reach customers or business partners all over the world. The Internet might be used for trading, brand building, advertising and marketing, as well as for business networking (Galloway 2007).
This prompted the formulation of the third and fourth RQs:
- RQ3: What are the enablers and barriers for adopting each technology to support the rural economy?
- RQ4: How to establish favourable conditions and offer incentives to SMEs for integrating innovative solutions.
3. Materials and Methods
The methodological approach to examine the impact of the selected new technologies in order to increase SMEs’ competitiveness and productivity among the countries is based on a number of case studies.
For this purpose, a structured online questionnaire was designed to collect evidence and draw on the expertise of target respondents related to cases of innovative technology adoption by firms in remote and accessible rural areas. The questionnaire was structured into two main sections.
Section A included questions to identify the regions in which the enterprises were operating, the primary core business and the dimensions of rural SMEs.
Section B dealt with issues related to the use of particular innovation technologies, the type of innovation used and what barriers and enabling factors can hinder and support the adoption and dissemination of new technologies, respectively.
The respondents were owners and/or managers of SMEs opening in remote and marginal areas of the eight countries. Sixty-eight respondents returned the questionnaires. In general, the number of firms responding was comparable with other region-specific studies of this nature, which used around 50 observations (Fanelli 2018; Kingsley and Malecki 2004; Romijn and Albaladejo 2002; Romijn and Albu 2002).
Using the respondents’ data, descriptive statistics were applied to describe the case identities in Section A. Section B was analysed using a chi-square (χ2) test and Mann–Whitney U (MWU) Test. The chi-square test of independence (also known as the Pearson chi-square) is one of the most useful statistics for testing hypotheses when the variables are nominal. Unlike most statistics, the chi-square (χ2) can provide information not only on the significance of any observed differences, but also provides detailed information on exactly which categories account for any differences found. Thus, the amount and detail of information this statistic can provide renders it one of the most useful tools in the researcher’s array of available analysis tools (Dobrovic et al. 2018; McHugh 2013). Furthermore, the χ2 statistic is strong with respect to the distribution of the data as is the case with all nonparametric statistics (Sharpe 2015). Specifically, it does not require equality of variance among the study groups or homoscedasticity in data. It permits the evaluation of both dichotomous independent variables and of multiple group studies (McHugh 2013) and the determination of the degree of reliability of the relationship between two categorical variables (Pollák and Markovič 2021). To draw out some of the key features of the main needs/objectives that lead rural SMEs to adopt the new technology, the questionnaires were designed to give answers at the categorical level, so the χ2 statistic can be appropriately used. To investigate the difficulties/barriers SMEs encountered during the integration or adoption of new technology, questions were designed as a Likert Scale. The scale used was 1–5, where 1 = no difficulties and 5 = most important difficulty. Data were measured on an ordinal scale, which are nonparametric, so Mann–Whitney U (MWU) was applied, which is also known as the Mann–Whitney–Wilcoxon (MWW) test (Mann and Whitney 1947; Wilcoxon 1945) to analyse the difference between rural SMEs with and without job generation, with and without improved ability to access new markets and with and without improved profitability.
There is a plethora of empirical articles related to the application of this nonparametric test that have shown how it is commonly used to compare means of two different groups from the same population (Milenovic 2011; Nachar 2008). It is used when data do not meet the requirements for a parametric test (i.e., t-test, ANOVA). For example, data are not normally distributed, the variances for two conditions are noticeably different, or data are measured on an ordinal scale. It is noted that the results of the MWU are presented in group rank differences rather than group mean differences.
4. Results and Discussion
The paper is based on a quantitative study of a sample of SMEs located in the eight countries that have participated in the INNOGROW project from 1 April 2016 to 31 March 2021. Table 1 shows the responses, mainly from owners or directors of enterprises that completed the online questionnaire.
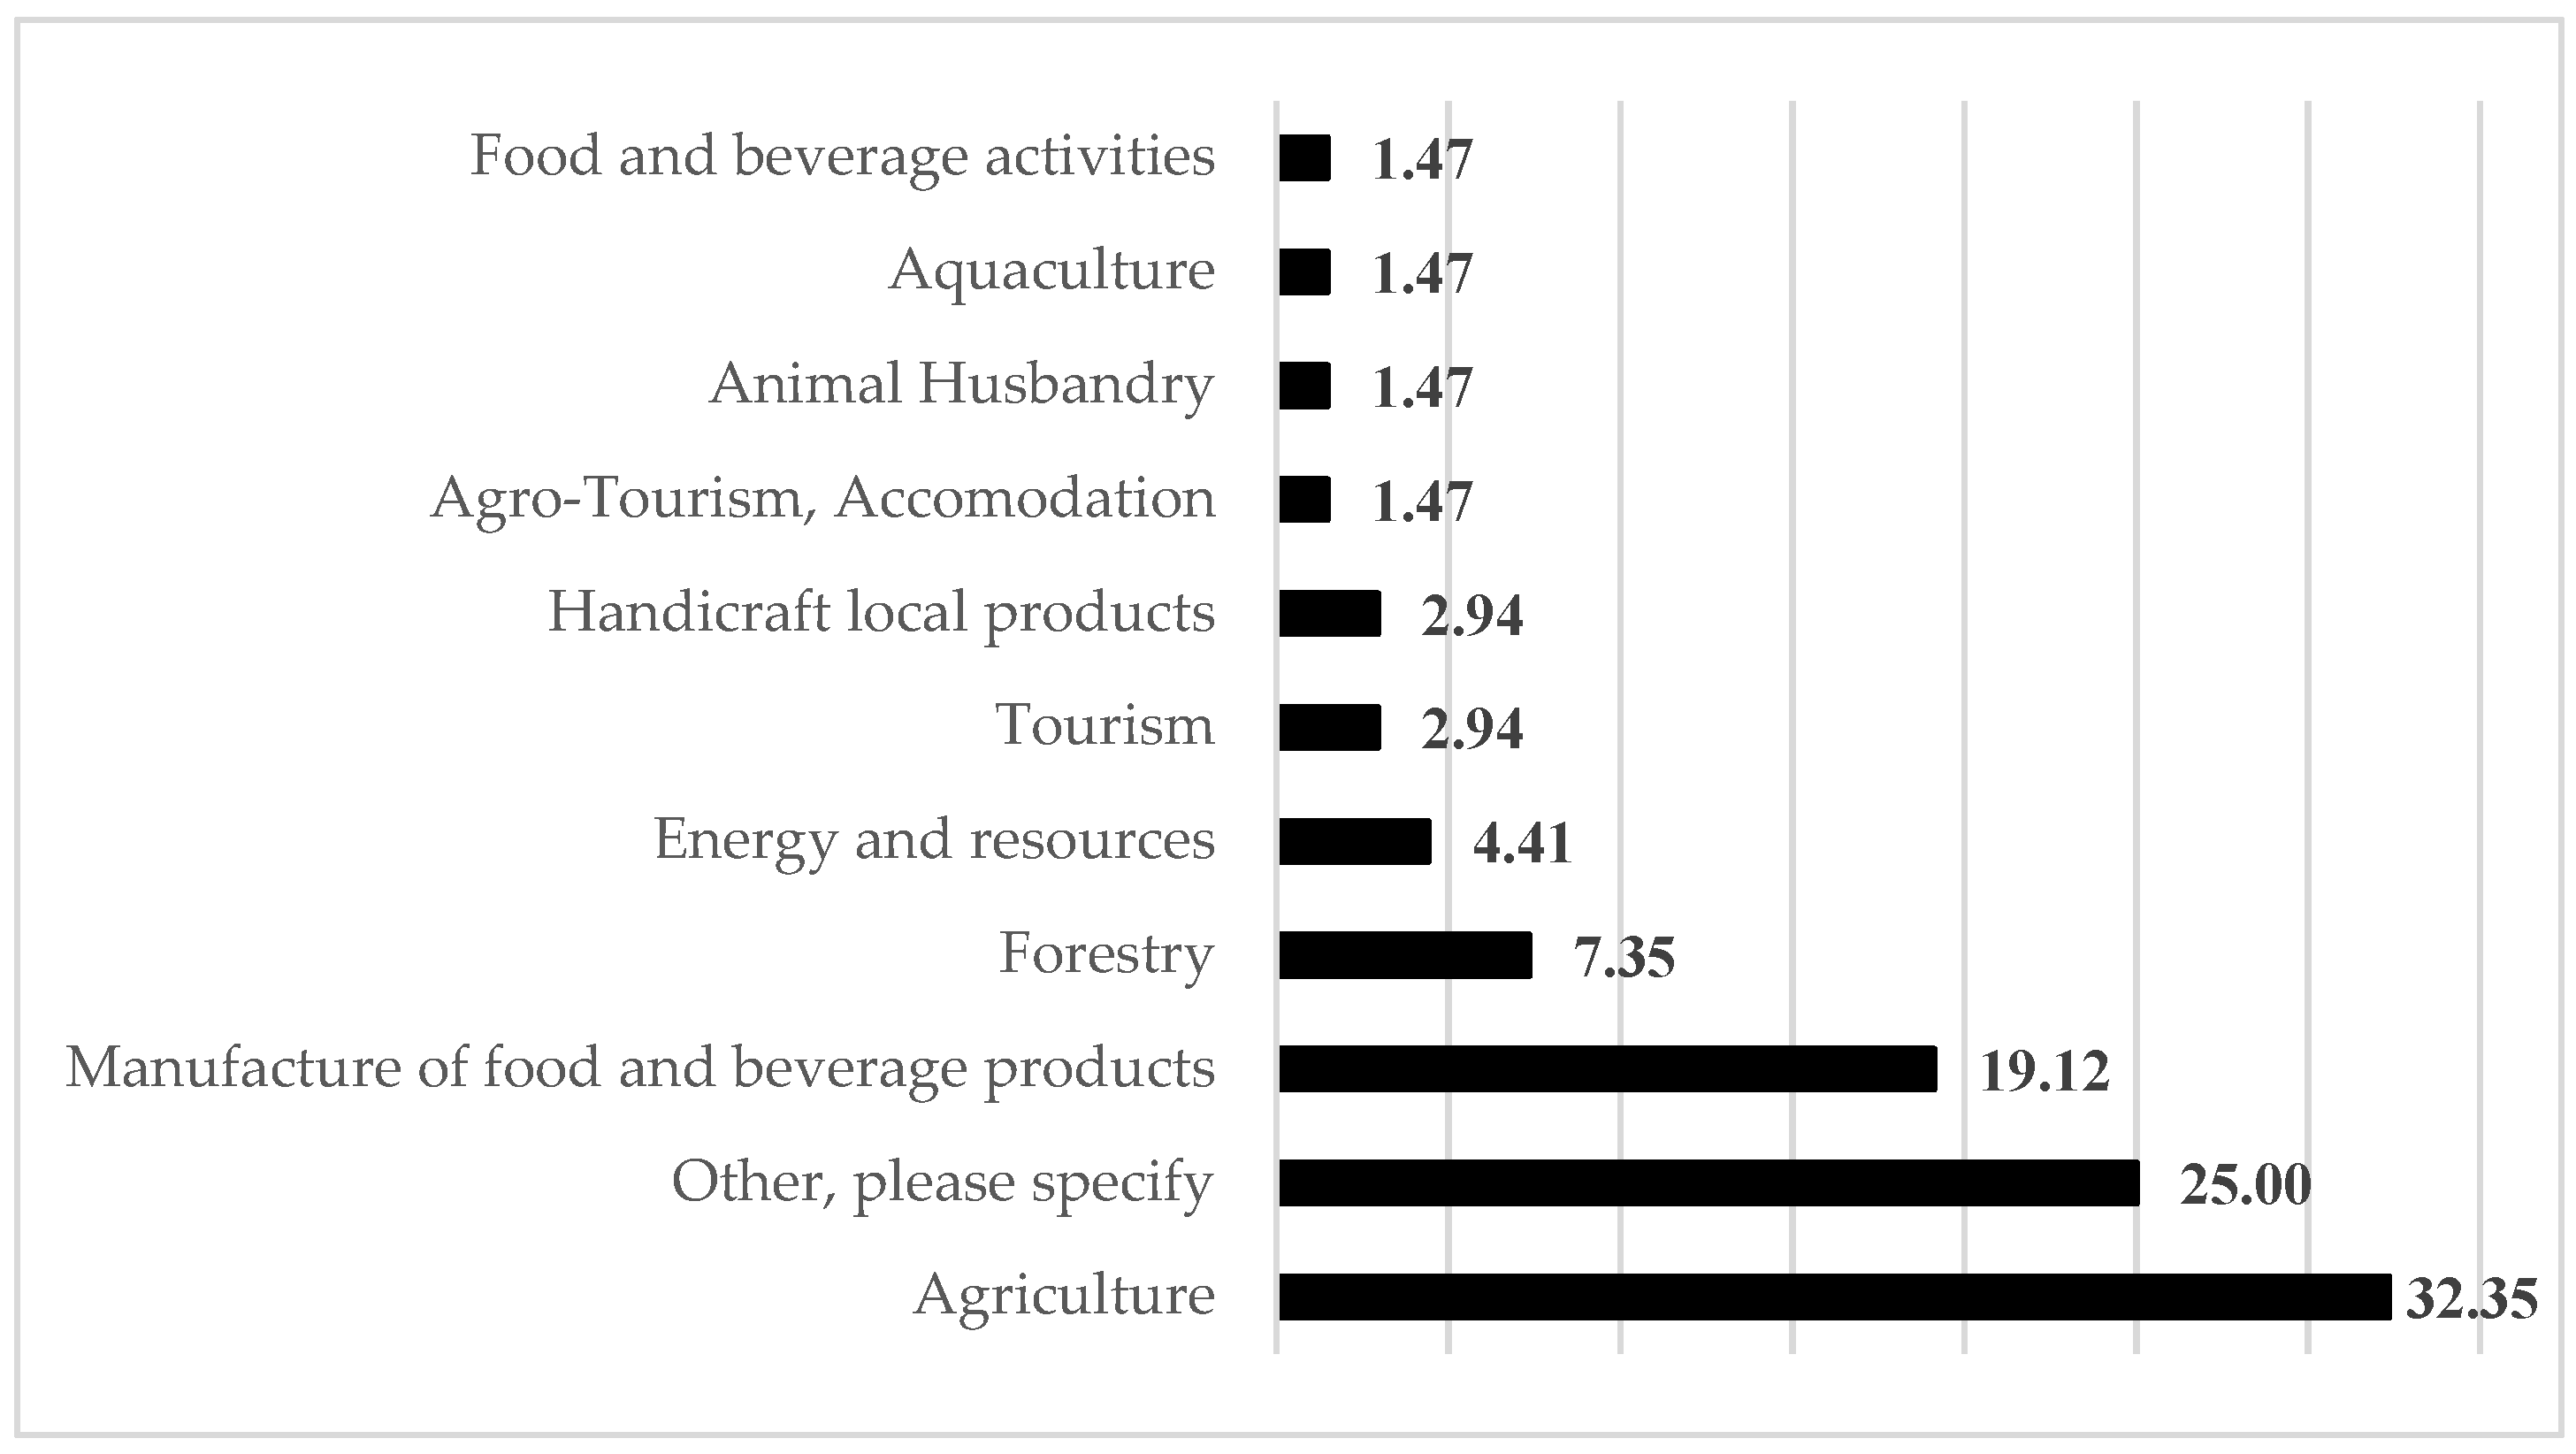
Rural SMEs considered in this study mainly operate in agriculture with 32.4%, this is followed by the category other (e.g., information technology, water management, construction, 25%), then manufacture of food and beverage products (19.1%) and forestry (7.4%) located outside the metropolitan areas. The SMEs have been grouped into three categories, namely primary, secondary and tertiary sectors that are useful for the analysis. Agriculture, forestry, animal husbandry and aquaculture are grouped as the primary sector. The secondary sector includes the manufacture of food and beverage products, energy and resources. Tourism and others are specified as the tertiary sector (Figure 2).
With the permanent decline of employment in agriculture and other traditional rural industries, the identification and encouragement of new sources of jobs for those living in rural communities have become a key priority for rural development. However, low densities characterize rural areas. In such circumstances, entrepreneurship is particularly difficult. Today, a relatively small group of fast growing, innovative SMEs (Storey 1994) generate the majority of new jobs. The analyses of the survey data showed that approximately 57.4% of the rural SMEs had less than 10 employees, followed by 10–49 employees (26.5%) and 50–249 employees (14.7%), respectively. Only one firm had 250 employees or more. For turnover, instead, the majority of rural SMEs registered less than 2 million EUR per annum (69.7%), and only 21.2% and 9.1% registered 2–10 and 10–50 million EUR, respectively. The survey also revealed that no firms reported an annual turnover of more than 50 million EUR.
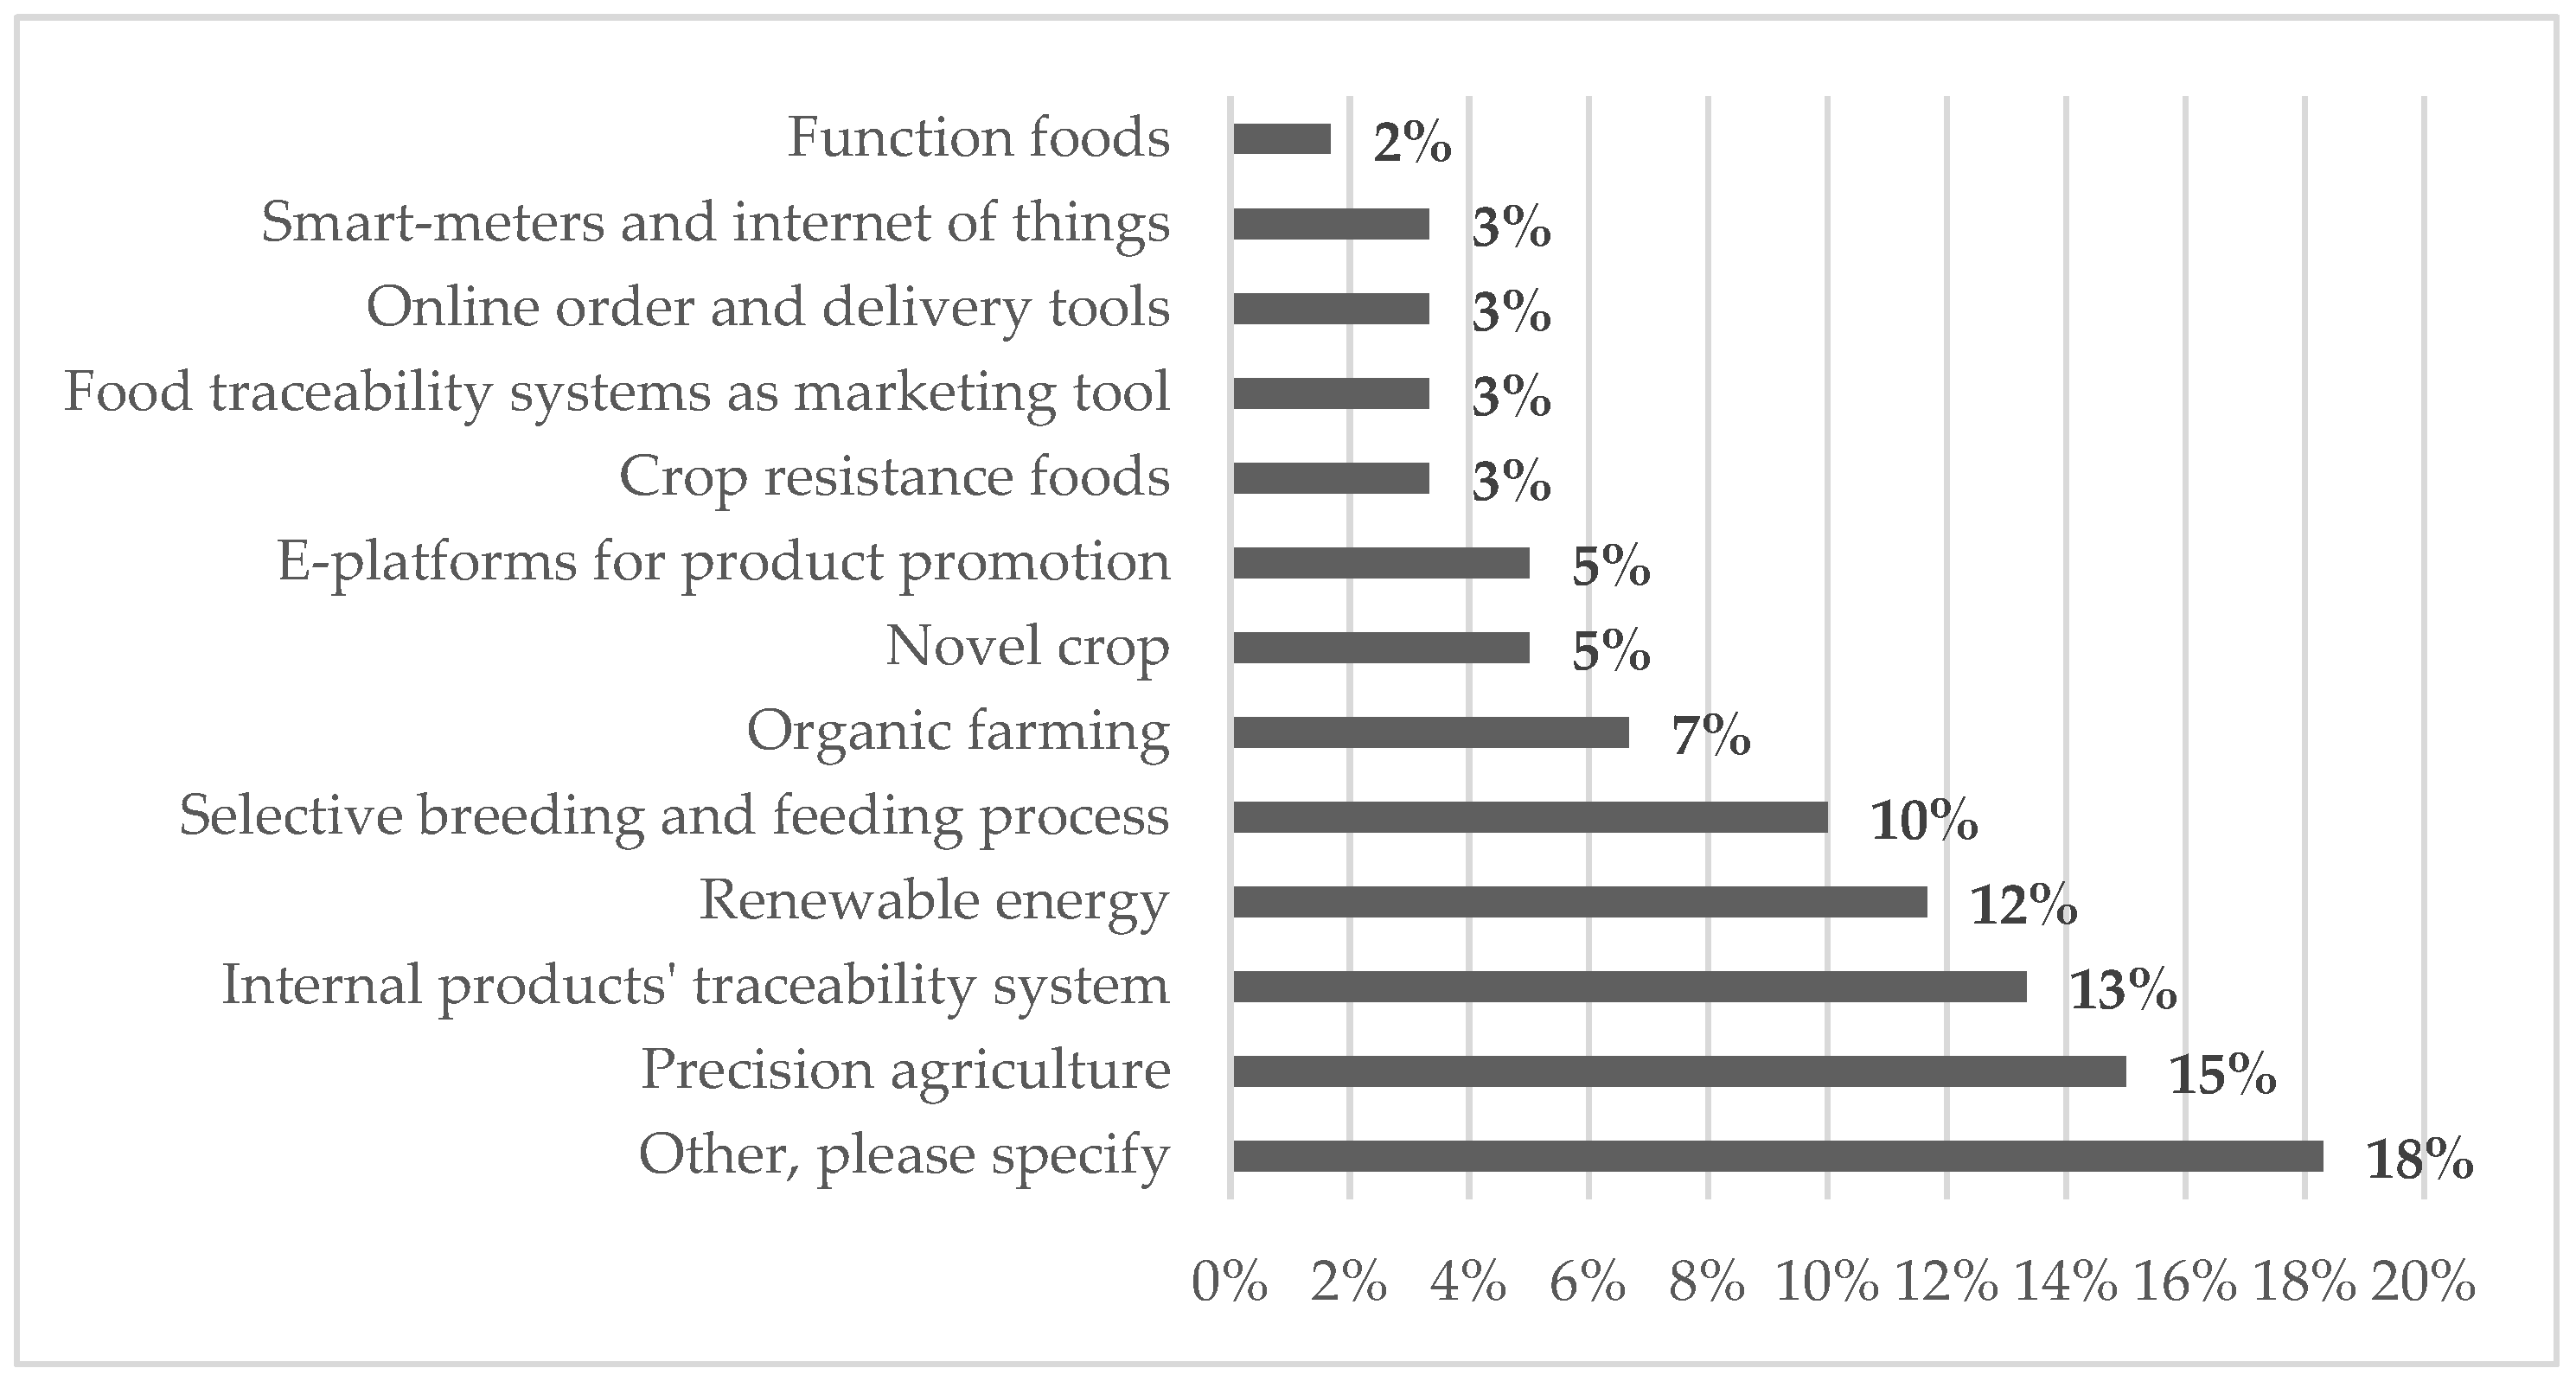
To study the impacts of technology adoption on rural SMEs’ competitiveness and productivity, it is important to understand what type of technology is adopted by firms. Approximately 18% of the rural firms highlight other types of technology, with examples including an environmental monitoring network, harvesting technology and innovative vender machines. Precision agriculture is the second most popular technology adopted by sampled firms at 15%. Around 13% of the firms adopted traceability systems and renewable energy, respectively. Only 1.7% of the surveyed firms used functional food as an innovative technology (Figure 3). These types of innovative technologies have been adopted in different years. Rural SMEs are more likely to have started implementing the new technology between 2012 and 2016. The highest proportion of firms adopted new technology in the year 2016 with 13.3%, followed by the years 2015 and 2012 (11.7%) and the years 2010 and 2005 (10%). The adoption of innovative technology may result in an increase of rural SMEs’ competitiveness and productivity.
In order to identify the factors that may inhibit SMEs in rural areas from innovating in this sector, the chi-square (χ2) statistic was applied to analyse group differences when the dependent variable was measured at a nominal (categorical) level (Lu et al. 2014). The dependent variables are here classified into three groups: (1) job generation and no job generation, (2) access to new markets and no access to new markets, and (3) firm profitability and no firm profitability. It permits the evaluation of both dichotomous independent variables and of multiple group studies (Preacher 2001).
Table 2 shows the key features of the main objectives when rural SMEs implement new technology, comparing firms who declared the new technology had impacted positively on their numbers of employees and those where no positive impact on numbers had been registered. The results showed no statistically significant differences in objectives for adoption in terms of derived impact on job generation (p > 0.05). A chi-square test was performed, and no relationship was found between the two groups of firms and the frequency of main needs/objectives, χ2 (1, n = 51) = 4.12, p value = 0.85. The impact of the adoption of the new technologies on the creation of job generation was not significantly different between the two groups of firms (with and without job generation), so the null statistical hypothesis can be rejected. The main reason for both groups to adopt the new technology is accessing new markets/identified market opportunities, which applied to 53.3% of firms that had job generation and 50.0% that had no job generation. In firms where new technology had led to an increase of employees with important needs/objectives related to responding to competition, an improvement of environmental impact/resource efficiency and personal interest in the new technology were registered.
There are statistically important differences between the second groups in terms of their objectives to access new markets/identified market opportunities and satisfy customers’ needs. A chi-square test highlighted a statistically significant relationship between the firm and the frequency of the main needs/objectives, χ2 (1, N = 53) = 11.6, p value = 0.17. Approximately 76% of rural SMEs with an improved ability to access markets aimed to adopt the new technology for access to new markets/identified market opportunities compared to only 13% of rural SMEs without an improved ability. A higher percentage of rural SMEs with an improved ability to access markets also aimed to adopt new technology to satisfy customers’ need. Other main objectives for SMEs that have improved their ability to access new markets are a positive environmental impact/resource efficiency (48.3%) and a personal interest in the new technology (48.3%).
For the third group’s impacts on firm profitability as a result of new technology, the main needs/objectives of rural firms to adopt the new technology are as follows. Personal interest in the new technology is the only objective where there is a significant difference between firms that experienced an impact on profitability. Approximately 56% of rural SMEs that adopted the new technology for personal interest in the new technology had experienced a positive impact on profitability compared to only 26% for rural SMEs without profitability. A chi-square test was performed, and a statistically significant relationship was found between the firm and the frequency of their main needs/objectives, χ2 (1, N = 51) = 8.08, p value = 0.33.
The χ2 is applied again to find key enablers, local conditions and success factors of rural firms that support the adoption of new technology. The three groups of technology impacts are again used to compare these features: (1) job generation and no job generation, (2) access to new markets and no access to new markets, (3) firm profitability and no firm profitability.
A key finding of interest on the enablers for rural firms that support new technology, is that a higher level (40%) of firms that experienced job generation from adoption, identified private, external funding (e.g., bank, investor, venture capital) as supporting the adoption of the new technology, compared to firms without job generation (13.9%). Both firms with and without job generation identified internal capital (from a firm and its owners) as supporting their new technologies (Table 3).
For access to new markets, Table 3 (group 2) shows that rural SMEs with an improved ability to access markets are more likely to identify the importance of existing employees with knowledge and skills (30%) compared to the firms without an improved ability (4.3%). Additionally, advisory services are statistically more significant for firms that have experienced improved ability access to new markets. Both groups of firms identified the importance of internal capital (from a firm and its owners) to support the adoption of new technology.
When comparing enablers between rural firms, according to their improved profitability as a result of adoption, there are no statistically significant differences between the two groups (Table 3, group 3). Both groups are more likely to identify internal capital (from a firm and its owners) and public funding as supporting their new technology adoption. Firms with improved profitability are more likely to highlight collaboration with other businesses and private, external funding (e.g., bank, investor, venture capital).
To investigate the difficulties/barriers SMEs encountered during the integration of new technology, questions were designed as a Likert Scale where 1 = no difficulties and 5 = most important difficulty. Data were measured as an ordinal scale, which was nonparametric, as such, the Mann–Whitney U (MWU) test was applied to analyse the differences between the groups of rural SMES. The MWU test is a nonparametric test that is commonly used to compare means of two different groups from the same population (Sanders and Galloway 2013).
Comparing the difficulties or barriers experienced by rural SMEs in relation to job generation from technology adoption (Table 4), there were no statistically significant differences between the two groups, implying that rural firms with and without job generation, as a result of applying the new technology, do not differ in terms of difficulties/barriers experienced.
Table 5 presents the MWU test results of the barriers experienced by rural firms with and without an improved ability to access new markets as a result of new technology. The MWU tests found that significant differences existed between rural firms and a lack of improved ability to access new markets in relation to funding, lack of financial resources, lack of customer demand or limited interest from stakeholders and competition in the industry. The firms without improved access to new markets were more likely to face the first two barriers. However, firms with access to new markets highlighted competition in the industry as a barrier.
Table 6 indicates the difficulties/barriers experienced by rural SMEs, paying attention to any potential differences between those with or without improved profitability as a result of technology adoption. The MWU test indicates that rural SMEs with improved profitability are statistically and significantly different from the SMEs without improved profitability in terms of regulation/limited support by local policy makers, funding, lack of financial resources, lack of customer demand or limited interest from stakeholders and difficulties in establishing effective collaboration with supply chain partners. The firms without improved profitability had a mean rank of 32.5 on facing regulation/limited support by local policy makers, while the firms with profitability had a mean rank of 22.1. Likewise, for funding and lack of financial resources, the firms without profitability had a mean rank of 36.3, while the firms with profitability had a mean rank of 19.9. A higher mean rank of the firms without profitability than the firms with profitability face a lack of customer demand or limited interest from stakeholders with 31.8 and 22.5, respectively. In addition, the rural firms without profitability are more likely to experience difficulties in establishing effective collaboration with supply chain partners (mean rank = 30.2) than those with profitability from adoption (mean rank = 22.8).
5. Conclusions and Study Limitations
This paper contributes to the growing body of literature on the innovative activities and information sourcing practices of small firms in a rural context. It is suggested that a quantitative survey be carried out to enhance the generalizability of the model. The results of this study are important for both researchers and small business practitioners (including government agencies and owners/managers). The findings of this study extend the SMEs, information technology, and innovation literatures and help build a foundation for further understanding the impact of new technologies on SMEs competitiveness and productivity.
The main aim of this research was to give an answer to the following questions:
(1) What type of technology is adopted by rural SMEs from 2002 to 2016? Approximately 18% of the rural firms highlight other types of technology, with examples including environmental monitoring networks, harvesting technology and innovative vender machines. Precision agriculture is the second most popular technology adopted by sampled firms at 15%. Around 13% of the firms adopted traceability systems and renewable energy.
These results are in accordance with findings from the previous literature in which the most common type of innovation pursued, especially in the food production sector, was innovation in processes (Afranta et al. 2002; Capitano et al. 2010; Triguero et al. 2013).
(2) What goals are most crucial for entrepreneurs? With this research question, it was found that approximately 26% of rural firms stated that the top priority was to increase their market share. Around 22% of the rural SMEs aimed to increase consumer satisfaction, 20.5% wanted to access new markets. For 17% and around 15% of rural firms it was important to improve the firm’s efficiency and business profitability. These findings, in accordance with Siu (2000), state that market orientation has a positive effect on firm survival and competitiveness.
(3) What are the enablers and barriers for adopting each technology to support the rural economy? Most SMEs interviewed (28%), in fact, denounced the lack of financial resources necessary to make technological innovations and the considerable difficulty in accessing public and private funding. The results, in line with North et al. (2001), argue that finance represented one of the biggest barriers to SMEs to adopt innovation.
Furthermore, whether the performance of SMEs, in terms of growth and profitability, is related to the introduction of different types of innovation has also been analysed. The results of the investigation between the three groups of rural SMEs highlight that for the first group of the firm (job generation vs. no job generation), the rural SMEs experiencing job generation as a result of technology adoption are likely to be generating more turnover with respect to the firms. In terms of the industrial sectors, rural SMEs are more likely to generate jobs from technology adoption in the primary and tertiary sectors, than in the secondary sector. For the second group (access to new markets vs. no access to new markets) there is an indication that the rural firms with improved market accessibility are more likely to be generating higher turnover after integrating new technologies in their business. The number of firms with an improved ability to access new markets in both the secondary and tertiary sectors is higher than that of firms without an improved ability to access new markets. Finally, for the third group (firm profitability vs. no firm profitability) approximately 63% of rural SMEs generate a profit after implementing new technologies, but around 37% do not. They indicate how each variable is related to the function. Only lack of funding resources and limitations of regulation/limited support by local policy makers have a negative correlation with firm profitability.
Lastly, (4) How to establish favourable conditions and offer incentives to SMEs for integrating innovative solutions. For SMEs to fully develop and use this potential, they need specific policy measures to ensure that technological services can be provided and requisite infrastructures are available. Further, research and development institutions that are publicly funded should be encouraged to target the technology needs of SMEs. At the same time, some typical characteristics of the rural environment exist, such as the availability of business premises, transport infrastructure, small size local markets, features of rural labour markets and access to information and finance (Smallbone and Welter 2006).
The limitations of the study are that the analysis is based on self-reported data provided by a small sample of entrepreneurs. Moreover, the study is only one part of a larger long-term project investigating the drivers and barriers to new technology adoption by SMEs. Further research is currently being undertaken in order to overcome some of the limitations outlined previously.
Funding
This research received no external funding.
Conflicts of Interest
The author declares no conflict of interest.
References
- Acs, Zoltan J., and Pamela Mueller. 2008. Employment Effects of Business Dynamics: Mice, Gazelles and Elephants. Small Business Economics 30: 85–100. [Google Scholar] [CrossRef] [Green Version]
- Afranta, Oscar, Ruth Rama, and N. Von Tunzelmann. 2002. A patent analysis of global food and beverage firms: The persistence of innovation. Agribusiness 18: 349–68. [Google Scholar]
- Almus, Matthias. 2002. What characterizes a fast-growing firm? Applied Economics 34: 1497–508. [Google Scholar] [CrossRef]
- Autio, Erkko, and Zoltan J. Acs. 2009. Institutional influences on strategic entrepreneurial behavior. Strategic Entrepreneurship Journal 4: 234–51. [Google Scholar] [CrossRef]
- Autio, Erkko, and Walter Hoeltzl. 2008. Europe Innova Gazelles Panel Final Report. In EU DG Innovation, Europe Innova Panel Reports. Brussels: EU DG Innovation. [Google Scholar]
- Baourakis, George, Markos Kourgiantakis, and Athanasios Migdalas. 2002. The impact of e-commerce on agro-food marketing: The case of agricultural cooperatives, firms and consumers in Crete. British Food Journal 104: 580–90. [Google Scholar] [CrossRef]
- Bergman, Ariel, Nick Hanley, and Robert Wright. 2006. Valuing the attributes of renewable energy investments. Energy Policy 34: 1004–14. [Google Scholar] [CrossRef]
- Bhattacharya, Mita, and Harry Bloch. 2004. Determinants of innovation. Small Business Economics 22: 155–62. [Google Scholar] [CrossRef]
- Bigliardi, Barbara. 2013. The effect of innovation on financial performance: A research study involving SMEs. Innovation 15: 245–55. [Google Scholar] [CrossRef]
- Bigliardi, Barbara, and Francesco Galati. 2013. Innovation trends in the food industry: The case of functional foods. Trends in Food Science & Technology 31: 118–29. [Google Scholar]
- Branzei, Oana, and Ilan Vertinsky. 2006. Strategic Pathways to Product Innovation Capabilities in SMEs. Journal of Business Venturing 21: 75–105. Available online: https://ssrn.com/abstract=1503207 (accessed on 24 May 2021). [CrossRef]
- Calvo, José L. 2006. Testing Gibrat’s Law for Small, Young and Innovating Firms. Small Business Economics 26: 117–24. [Google Scholar] [CrossRef]
- Capitano, Fabian, Adele Coppola, and Stefano Pascucci. 2010. Product and process innovation in the Italian food industry. Agribusiness 26: 503–18. [Google Scholar] [CrossRef]
- Castela, Bernardo M. S., Fernando A. F. Ferreira, João J. M. Ferreira, and Carla S. E. Marques. 2018. Assessing the innovation capability of small-and medium-sized enterprises using a non-parametric and integrative approach. Management Decision 56: 1365–83. [Google Scholar] [CrossRef]
- De Jong, Jeroen P. J., and Patrick A. M. Vermeulen. 2006. Determinants of product innovation in small firms. A comparison across industries. International Small Business Journal 24: 587–609. [Google Scholar] [CrossRef]
- Delmar, Frédéric, Alexander McKelvie, and Karl Wennberg. 2013. Untangling the relationships among growth, profitability and survival in new firms. Technovation 33: 276–91. [Google Scholar] [CrossRef] [Green Version]
- Dobrovic, Jan, Maya Lambovska, Peter Gallo, and Veronika Timkova. 2018. Non-financial indicators and their importance in small and medium-sized enterprises. Journal of Competitiveness 10: 41. [Google Scholar] [CrossRef]
- Fanelli, Rosa M., and Luca Romagnoli. 2020. Customer Satisfaction with Farmhouse Facilities and Its Implications for the Promotion of Agritourism Resources in Italian Municipalities. Sustainability 12: 1749. [Google Scholar] [CrossRef] [Green Version]
- Fanelli, Rosa M. 2018. Rural Small and Medium Enterprises Development in Molise (Italy). European Countryside 10: 566–89. [Google Scholar] [CrossRef] [Green Version]
- Fanelli, Rosa M. 2020. Seeking Gastronomic, Healthy, and Social Experiences in Tuscan Agritourism Facilities. Social Sciences 9: 1–15. [Google Scholar] [CrossRef] [Green Version]
- Fieldsen, Andrew F. 2013. Rural Renaissance: An Integral Component of Regional Economic Resilience. Studies in Agricultural Economics 115: 85–91. [Google Scholar] [CrossRef] [Green Version]
- Forsman, Helena, and Ulla Annala. 2011. Small enterprises as innovators: Shift from a low performer to a high performer. International Journal of Technology Management 56: 154–71. [Google Scholar] [CrossRef]
- Freel, Mark S., and Paul J. A. Robson. 2004. Small firm innovation, growth and performance. International Small Business Journal 22: 561–75. [Google Scholar] [CrossRef]
- Galloway, Laura. 2007. Can Broadband Access Rescue the Rural Economy? Journal of Small Business and Enterprise Development 14: 641–53. [Google Scholar] [CrossRef]
- Gilmore, Audrey, David Carson, and Ken Grant. 2001. SME marketing in practice. Marketing Intelligence & Planning 19: 6–11. [Google Scholar]
- Gungor, V. Cagri, Dilan Sahin, Taskin Kocak, Salih Ergut, Concettina Buccella, Carlo Cecati, and Gerhard P. Hancke. 2013. A survey on smart grid potential applications and communication requirements. IEEE Transactions on Industrial Informatics 9: 28–42. [Google Scholar] [CrossRef] [Green Version]
- Henchion, Maeve, and Bridin McIntyre. 2005. Market access and competitiveness issues for food SMEs in Europe’s lagging rural regions (LRRs). British Food Journal 107: 404–22. [Google Scholar] [CrossRef]
- Henrekson, Magnus, and Dan Johansson. 2010. Gazelles as job creators: A survey and interpretation of the evidence. Small Business Economics 35: 227–44. [Google Scholar] [CrossRef]
- Holt, Georgina, C. Maeve Henchion, Christopher Reynolds, Benlloch Baviera, Generosa Janny Calabrese, Laura Contini, Crispin Cowan, Tomasz Dowgielwicz, Cornelius Luscher, Antonello Maraglino, and et al. 2007. Research agenda for SMEs in electronic platforms for the European food industry. Foresight 9: 42–53. [Google Scholar] [CrossRef] [Green Version]
- Hölzl, Werner. 2009. Is the R&D behaviour of fast-growing SMEs different? Evidence from CIS III data for 16 countries. Small Business Economics 33: 59–75. [Google Scholar]
- Hoogstra, Gerke J., and Jouke Van Dijk. 2004. Explaining firm employment growth: Does location matter? Small Business Economics 22: 179–92. [Google Scholar] [CrossRef]
- INNOGROW Interreg Europe Project. 2016–2021. Available online: https://www.interregeurope.eu/innogrow/ (accessed on 12 April 2021).
- Kingsley, Gordon, and Edward J. Malecki. 2004. Networking for competitiveness. Small Business Economics 23: 71–84. [Google Scholar] [CrossRef]
- Koellinger, Philipp. 2008. Why are some entrepreneurs more innovative than others? Small Business Economics 31: 21–37. [Google Scholar] [CrossRef] [Green Version]
- Laforet, Sylvie. 2011. A framework of organisational innovation and outcomes in SMEs. International Journal of Entrepreneurial Behaviour & Research 17: 380–408. [Google Scholar]
- Lu, Tong-Yu, Wai-Yin Poon, and Siu Hung Cheung. 2014. A unified framework for the comparison of treatments with ordinal responses. Psychometrika 79: 605–20. [Google Scholar] [CrossRef] [PubMed]
- Mann, Henry B., and Donald R. Whitney. 1947. On a test of whether one of two random variables is stochastically larger than the other. The Annals of Mathematical Statistics 18: 50–60. [Google Scholar] [CrossRef]
- Mark-Herbert, Cecilia. 2004. Innovation of a new product category-functional foods. Technovation 24: 713–19. [Google Scholar] [CrossRef]
- McHugh, Mary L. 2013. The chi-square test of independence. Biochemia Medica 23: 143–49. [Google Scholar] [CrossRef] [PubMed] [Green Version]
- Mendonca, Sandro, Tiago Santos Pereira, and Manuel Mira Godinho. 2004. Trademarks as an indicator of innovation and industrial change. Research Policy 33: 1385–404. [Google Scholar] [CrossRef] [Green Version]
- Michailidis, Anastasios, Maria Partalidou, Stefanos A. Nastis, Aphrodite Papadaki-Klavdianou, and Chrysanthi Charatsari. 2011. Who goes online? Evidence of internet use patterns from rural Greece. Telecommunications Policy 35: 333–43. [Google Scholar] [CrossRef]
- Milenovic, Zivorad. 2011. Application of Mann-Whitney U Test in research of professional training of primary school teachers. Metodički obzori/Methodological Horizons 6: 73–79. [Google Scholar] [CrossRef] [Green Version]
- Munday, Max, Gill Bristow, and Richard Cowell. 2011. Wind farms in rural areas: How far do community benefits from wind farms represent a local economic development opportunity? Journal of Rural Studies 27: 1–12. [Google Scholar] [CrossRef]
- Nachar, Nadim. 2008. The Mann-Whitney U: A Test for Assessing Whether Two Independent Samples Come from the Same Distribution. Tutorials in Quantitative Methods for Psychology 4: 13–20. [Google Scholar] [CrossRef]
- Niggli, Urs, Anamarija Slabe, Otto Schmid, Niels Halberg, and Marco Schlüter. 2008. Vision for an Organic Food and Farming Research Agenda to 2025. Brussels: IFOAM-EU and FiBL. [Google Scholar]
- North, David, David Smallbone, and Ian Vichers. 2001. Public sector support for innovating SMEs. Small Business Economics 16: 303–17. [Google Scholar] [CrossRef]
- Opara, Linus U. 2003. Traceability in agriculture and food supply chain: A review of basic concepts, technological implications, and future prospects. Journal of Food Agriculture and Environment 1: 101–6. [Google Scholar]
- Ozer, Muammer. 2004. The role of the Internet in new product performance: A conceptual investigation. Industrial Marketing Management 33: 355–69. [Google Scholar] [CrossRef]
- Padel, Susanne, Mette Vaarst, and Konstantinos Zaralis. 2015. Supporting innovation in organic agriculture: A European perspective using experience from the SOLID project. Sustainable Agriculture Research 4: 32–41. [Google Scholar] [CrossRef] [Green Version]
- Parker, Simon C., David J. Storey, and Arjen van Witteloostuijn. 2010. What happens to gazelles? The importance of dynamic management strategy. Small Business Economics 35: 203–26. [Google Scholar] [CrossRef]
- Policy, Urban. 2013. Regional policy for smart growth of SMEs. [Google Scholar]
- Pollák, František, and Peter Markovič. 2021. Size of Business Unit as a Factor Influencing Adoption of Digital Marketing: Empirical Analysis of SMEs Operating in the Central European Market. Administative Sciences 11: 71. [Google Scholar] [CrossRef]
- Preacher, Kristopher J. 2001. Calculation for the Chi-Square Test: An Interactive Calculation Tool for Chi-Square Tests of Goodness of Fit and Independence [Computer Software]. Available online: http://quantpsy.org (accessed on 20 September 2021).
- Pretty, Jules. 2001. The rapid emergence of genetic modification in world agriculture: Contested risks and benefits. Environmental Conservation 28: 248–62. [Google Scholar] [CrossRef]
- Pretty, Jules N., Craig Brett, David Gee, Rachel Elizabeth Hine, Christopher F. Mason, James I. L. Morison, Hugh Raven, Matt D. Rayment, and Gert van der Bijl. 2000. An assessment of the total external costs of UK agriculture. Agricultural Systems 65: 113–36. [Google Scholar] [CrossRef]
- Romijn, Henny, and Manuel Albaladejo. 2002. Determinants of innovation capability in small electronics and software firms in Southeast England. Research Policy 31: 1053–106. [Google Scholar] [CrossRef]
- Romijn, Henny, and Mike Albu. 2002. Innovation, networking and proximity: Lessons from small high technology firms in the UK. Regional Studies 36: 81–86. [Google Scholar] [CrossRef]
- Sanders, John, and Laura Galloway. 2013. Rural small firms’ website quality in transition and market economies. Journal of Small Business and Enterprise Development 20: 788–806. [Google Scholar] [CrossRef] [Green Version]
- Seelan, Santhosh K., Soizik Laguette, Grant M. Casady, and George A. Seielstad. 2003. Remote sensing applications for precision agriculture: A learning community approach. Remote Sensing of Environment 88: 157–69. [Google Scholar] [CrossRef]
- Sharpe, Donald. 2015. Chi-square test is statistically significant: Now what? Practical Assessment, Research, and Evaluation 20: 8. [Google Scholar]
- Sima, Elena. 2009. Impact of organic farming promotion upon the sustainable rural development. Agricultural Economics and Rural Development 2: 217–23. [Google Scholar]
- Simpson, Mike, and Anthony J. Docherty. 2004. E-commerce adoption support and advice for UK SMEs. Journal of Small Business and Enterprise Development 11: 315–28. [Google Scholar] [CrossRef]
- Siu, Wai-sum. 2000. Marketing and company performance of Chinese small firms in Hong Kong. Marketing Intelligence & Planning 18: 292–307. [Google Scholar]
- Smallbone, David, and Friederike Welter. 2006. Conceptualising entrepreneurship in a transition context. International Journal of Entrepreneurship and Small Business 3: 190–206. [Google Scholar] [CrossRef]
- Stočes, Michal, Jiří Vanek, Jan Masner, and Jan Pavlík. 2016. Internet of Things (IoT) in Agriculture-Selected Aspects. AGRIS On-Line Papers in Economics and Informatics 8: 83. [Google Scholar] [CrossRef] [Green Version]
- Storey, David J. 1994. Understanding the Small Business Sector. London: Routledge. [Google Scholar]
- Stratigea, Anastasia. 2011. ICTs for rural development: Potential applications and barriers involved. Netcom. Réseaux, Communication et Territoires 25: 179–204. [Google Scholar] [CrossRef]
- Subrahmanya, Mungila Hillemane Bala, Muthu Mathirajan, and Kannan N. Krishnaswamy. 2010. Importance of Technological Innovation for SME Growth. Evidence from India. Working Paper No. 2010/03. [Online]. Available online: http://www.wider.unu.edu/publications/working-papers (accessed on 31 May 2021).
- Thornhill, Stewart. 2006. Knowledge, innovation and firm performance in high-and low-technology regimes. Journal of Business Venturing 21: 687–703. [Google Scholar] [CrossRef]
- Thornhill, Stewart, and Guy Gellatly. 2005. Intangible assets and entrepreneurial finance: The role of growth history and growth expectations. The International Entrepreneurship and Management Journal 1: 135–48. [Google Scholar] [CrossRef]
- Triguero, Ángela, David Córcoles, and María C. Cuerva. 2013. Differences in innovation between food and manufacturing firms: An analysis of persistence. Agribusiness 29: 273–92. [Google Scholar] [CrossRef]
- Uvarova, Inga, and Alise Vitola. 2019. Innovation challenges and opportunities in European Rural SMEs. Public Policy and Administration 18: 152–66. [Google Scholar] [CrossRef] [Green Version]
- Wilcoxon, Frank. 1945. Individual Comparisons by Ranking Methods. Biometrics Bulletin 1: 80–83. [Google Scholar] [CrossRef]
- Zhang, Man, and Janet L. Hartley. 2018. Guanxi, IT systems, and innovation capability: The moderating role of proactiveness. Journal of Business Research 90: 75–86. [Google Scholar] [CrossRef]
Figure 1.
Research path.

Figure 2.
Sectoral background of surveyed rural SMEs. Source: own processing of survey.

Figure 3.
The type of technology adopted by rural SMEs. Source: own processing of survey.


Table 1.
Questionnaire responses by country.
| Country | No. of Questionnaire Responses | No. of Questionnaire Responses That Completed All Questions | % |
|---|---|---|---|
| Bulgaria | 5 | 5 | 9.43 |
| Czech Republic | 20 | 13 | 24.53 |
| Greece | 2 | 1 | 1.89 |
| Hungary | 1 | 1 | 1.89 |
| Italy | 6 | 6 | 11.32 |
| Latvia | 10 | 10 | 18.87 |
| Slovenia | 16 | 9 | 16.98 |
| United Kingdom | 8 | 8 | 15.09 |
| EU-8 | 68 | 53 | 100 |
Source: own processing of survey.
Table 2.
The main needs/objectives for rural SMEs to adopt the new technology.
| Number of Business | |||||||||
|---|---|---|---|---|---|---|---|---|---|
| I Group | II Group | III Group | |||||||
| Main Needs/Objectives | No Job Generation | Job Generation | Total | No Access to New Market | Access to New Market | Total | No Firm Profitability | Firm Profitability | Total |
| Reduce production costs | 13 36.1% | 5 33.3% | 18 35.3% | 10 43.5% | 8 27.6% | 18 34.6% | 5 26.3% | 14 43.8% | 19 35.3% |
| Respond to competition | 13 36.1% | 7 46.7% | 20 39.2% | 8 34.8% | 13 44.8% | 21 40.4% | 7 36.8% | 13 40.6% | 20 39.2% |
| Access new markets/identified market opportunity | 18 50.0% | 8 53.3% | 26 49.0% | 3 13.0% | 22 75.9% | 25 48.1% | 8 42.1% | 15 46.9% | 23 46.0% |
| Increase profitability, revenue | 16 44.4% | 6 40.0% | 22 43.1% | 9 39.1% | 13 44.8% | 22 42.3% | 5 26.3% | 16 50.0% | 21 42.6% |
| Satisfy customers’ need | 17 47.2% | 5 35.7% | 22 43.1% | 6 26.1% | 17 58.6% | 23 44.2% | 10 52.6% | 12 37.5% | 22 43.1% |
| Positive environmental impact/resource efficiency | 15 41.6% | 7 46.6% | 22 43.1% | 8 34.8% | 14 48.3% | 22 42.3% | 7 36.8% | 18 40.6% | 23 45.1% |
| Personal interest in the new technology | 17 47.2% | 7 46.6% | 24 47.1% | 10 43.5% | 14 48.3% | 24 46.2% | 5 26.3% | 18 56.3% | 23 45.1% |
| Meet legislative/policy changes | 6 16.6% | 1 6.7% | 7 13.7% | 2 8.7% | 5 17.2% | 7 13.5% | 4 21.0% | 2 6.3% | 6 11.8% |
| Other | 0 0.00% | 1 7.1% | 1 2.0% | 0 0.0% | 1 3.4% | 1 1.9% | 0 | 0 | 0 |
| Total | 36 | 15 | 51 | 23 | 30 | 53 | 19 | 32 | 51 |
Source: own processing of survey.
Table 3.
Enablers of rural SMEs for supporting the adoption of the new technology.
| Number of Business | |||||||||
|---|---|---|---|---|---|---|---|---|---|
| (1) Group: χ2 (1, N = 51) = 4.12; p Value = 0.85 | (2) Group χ2 (1, N = 53) = 11.6; p Value = 0.17 | (3) Group χ2 (1; N = 51) = 8.08 ; p Value = 0.33 | |||||||
| Enablers | No Job Generation | Job Generation | Total | No Access to New Market | Access to New Market | Total | No Firm Profitability | Firm Profitability | Total |
| Public funding | 16 (44.4%) | 4 (26.7%) | 20 (39.2%) | 6 (26.1%) | 14 (46.7%) | 20 (37.7%) | 8 (42.1%) | 11 (34.4%) | 19 (37.3%) |
| Internal capital | 28 (77.8%) | 8 (53.3%) | 36 (70.6%) | 17 (73.9%) | 20 (66.7%) | 37 (69.8%) | 15 (78.9%) | 22 (68.8%) | 37 (72.5%) |
| Private, external funding | 5 (13.9%) | 6 (40.0%) | 11 (21.6%) | 3 (13.0%) | 8 (26.7%) | 11 (20.8%) | 3 (15.8%) | 7 (21.9%) | 10 (19.6%) |
| Market potential | 10 (27.8%) | 3 (20.0%) | 13 (25.5%) | 3 (13.0%) | 10 (33.3%) | 13 (24.5%9 | 3 (15.8%) | 10 (33.3%) | 13 (24.5%) |
| Existing employees with relevant knowledge and skills | 5 (13.9%) | 4 (26.7%) | 9 (17.6%) | 1 (4.3%) | 9 (30.0%) | 10 (18.9%) | 3 (15.8%) | 6 (18.8%) | 9 (17.6%) |
| Hiring new employees with relevant knowledge and skills | 3 (8.3%) | 2 (13.3%) | 5 (9.8%) | 2 (8.7%) | 4 (13.3%) | 6 (11.3%) | 1 (5.3%) | 4 (12.5%) | 5 9.8%) |
| Collaboration with other business | 8 (22.2%) | 4 (26.7%) | 12 (23.5%) | 4 (17.4%) | 8 (26.7%) | 12 (22.6%) | 3 (15.8%) | 8 (25.0%) | 11 (21.6%) |
| Adversary service | 2 (5.6%) | 3 (20.0%) | 5 (9.8%) | 0 (0.0%) | 6 (20.0%) | 6 (11.3%) | 1 (5.3%) | 3 (9.4%) | 4 (7.8%) |
| Other | 3 (8.3%) | 1 (6.7%) | 4 (7.8%) | 3 (13.0%) | 1 (3.3%) | 4 (7.5%) | 2 (10.5%) | 2 (6.3%) | 4 (7.8%) |
| Total | 36 | 15 | 51 | 23 | 30 | 53 | 19 | 32 | 50 |
Source: own processing of survey.
Table 4.
Difficulties/barriers of rural SMEs during the adoption/integration of new technology—job generation.
Table 4.
Difficulties/barriers of rural SMEs during the adoption/integration of new technology—job generation.
| Difficulties/Barriers | Mean Rank | Mann–Whitney U | p-Value | |
|---|---|---|---|---|
| No Job Generation | Job Generation | |||
| Regulation/limited support by local policy makers | 26.56 | 24.67 | 250.0 | 0.662 |
| Funding, lack of financial resource | 27.44 | 22.53 | 218.0 | 0.270 |
| Lack of expertise/skills of existing employees within the firm | 27.47 | 22.47 | 217.0 | 0.252 |
| Inability to hire new employees with relevant skills/expertise | 25.54 | 27.10 | 253.5 | 0.722 |
| Lack of customer demand or limited interest from stakeholders | 26.17 | 25.60 | 264.0 | 0.891 |
| Lack of appropriate external advice/technological skills | 25.83 | 24.64 | 240.0 | 0.781 |
| High integration costs | 26.15 | 21.81 | 192.5 | 0.333 |
| Difficulties in establishing effective collaboration with supply chain partners | 25.50 | 27.20 | 252.0 | 0.691 |
| Competition in the industry | 24.53 | 29.53 | 217.0 | 0.246 |
Source: own processing of survey.
Table 5.
Difficulties/barriers of rural SMEs during the adoption/integration of new technology—access to new market.
Table 5.
Difficulties/barriers of rural SMEs during the adoption/integration of new technology—access to new market.
| Difficulties/Barriers | Mean Rank | Mann–Whitney U | p-Value | |
|---|---|---|---|---|
| No Access to New Market | Access to New Market | |||
| Regulation/limited support by local policy makers | 27.46 | 25.74 | 311.5 | 0.669 |
| Funding, lack of financial resource | 31.35 | 22.66 | 222.0 | 0.035 |
| Lack of expertise/skills of existing employees within the firm | 27.22 | 26.83 | 340.0 | 0.926 |
| Inability to hire new employees with relevant skills/expertise | 27.28 | 25.88 | 315.5 | 0.730 |
| Lack of customer demand or limited interest from stakeholders | 30.13 | 23.62 | 250.0 | 0.091 |
| Lack of appropriate external advice/technological skills | 27.71 | 23.90 | 258.0 | 0.328 |
| High integration costs | 24.55 | 26.19 | 284.5 | 0.685 |
| Difficulties in establishing effective collaboration with supply chain partners | 26.36 | 25.72 | 311.0 | 0.871 |
| Competition in the industry | 21.59 | 29.34 | 222.0 | 0.051 |
Source: own processing of survey.
Table 6.
Difficulties/barriers of rural SMEs during the adoption/integration of new technology—firm profitability.
Table 6.
Difficulties/barriers of rural SMEs during the adoption/integration of new technology—firm profitability.
| Difficulties/Barriers | Mean Rank | Mann–Whitney U | p-Value | |
|---|---|---|---|---|
| No Improvement in Firm Profitability | Improved Firm Profitability | |||
| Regulation/limited support by local policy makers | 32.47 | 22.16 | 181.0 | 0.011 |
| Funding, lack of financial resource | 36.26 | 19.91 | 109.0 | 0.000 |
| Lack of expertise/skills of existing employees within the firm | 24.42 | 26.94 | 274.0 | 0.543 |
| Inability to hire new employees with relevant skills/expertise | 24.61 | 26.83 | 277.5 | 0.592 |
| Lack of customer demand or limited interest from stakeholders | 31.84 | 22.53 | 193.0 | 0.070 |
| Lack of appropriate external advice/technological skills | 26.50 | 24.20 | 246.5 | 0.566 |
| High integration costs | 25.47 | 24.75 | 264.0 | 0.862 |
| Difficulties in establishing effective collaboration with supply chain partners | 30.22 | 22.84 | 203.0 | 0.066 |
| Competition in the industry | 25.50 | 25.50 | 288.0 | 1.000 |
Source: own processing of survey.
Publisher’s Note: MDPI stays neutral with regard to jurisdictional claims in published maps and institutional affiliations. |
© 2021 by the author. Licensee MDPI, Basel, Switzerland. This article is an open access article distributed under the terms and conditions of the Creative Commons Attribution (CC BY) license (https://creativecommons.org/licenses/by/4.0/).
Share and Cite
MDPI and ACS Style
Fanelli, R.M. Barriers to Adopting New Technologies within Rural Small and Medium Enterprises (SMEs). Soc. Sci. 2021, 10, 430. https://doi.org/10.3390/socsci10110430
AMA Style
Fanelli RM. Barriers to Adopting New Technologies within Rural Small and Medium Enterprises (SMEs). Social Sciences. 2021; 10(11):430. https://doi.org/10.3390/socsci10110430
Chicago/Turabian StyleFanelli, Rosa Maria. 2021. "Barriers to Adopting New Technologies within Rural Small and Medium Enterprises (SMEs)" Social Sciences 10, no. 11: 430. https://doi.org/10.3390/socsci10110430
Note that from the first issue of 2016, this journal uses article numbers instead of page numbers. See further details here.