1. Introduction
The development of digital tools has created new options for future architectural design, especially in regards to digital tools that operate as open-source. Therefore, the designers take an interest in exploring such tools for a variety of design tasks. “The emerging open-source attitude over proprietary information may lead to “the true” digital revolution” [
1]. By using a digital, computer-based approach to design, factors, such as specific weather conditions, or topographic conditions of the individual design sites, can be incorporated into the form-finding process early in the design phase. All of the above can complement the vision of the architect, with the result being nature-conscious architecture. From being merely a “statue” inserted into a given location, these design tools can help architecture to become a more complex mechanism that originates from, and is bound up with, its surroundings.
1.1. Natural Environment
As climate change continues to create shifting weather patterns, it is of great importance that architecture becomes an integral part of its surrounding environment. The latest assessment by the Intergovernmental Panel on Climate Change (IPCC) [
2] warned that global warming is unequivocal and is caused most certainly by human activity. As a consequence, not only is the world uniting in the political sphere to find solutions for cities to resist climate change [
3], but also architecture has begun to center on creating a reciprocal relationship with nature. Innovative design strategies that focus on incorporating climatic circumstances into the design process are resulting in environmentally-responsive architecture. In the ever-changing environment, it seems to be a fair assumption that adapting building design to climate change is unavoidable. However, questions regarding the extent of the change required and how we can achieve such change remain unanswered. By acting proactively, we can make adjustments to current design strategies that can help to mitigate the worst-case scenarios for the future environment [
4,
5,
6,
7]. Temperature rises are the most evident effect of global warming, demanding a reaction from the architectural field. However, wind storms and sudden wind gusts are much harder to predict, due to their chaotic nature. A flexible architectural response is required in various architectural disciplines, including urbanism, architecture, or dynamic structures.
1.2. Wind-Formed Architecture
Wind is a fluctuating element of nature, its speed and direction can change quickly and, as such, it can have a very significant impact on both the natural and artificial environment. The phenomenon of wind erosion contributes to shaping the natural environment. Similarly, the built (artificial) environment is affected by wind flow and reciprocally, by the relative position and shape of buildings, alters wind flow. By taking this premise into account early in the conceptual design stage, improvements or modifications can be made to the local wind situation. Regarding architectural obstacles to the wind, the flow of the wind can be deflected, concentrated, diffused, harvested, or minimally changed [
8]. Aerodynamically designed buildings, for instance, contribute to reducing deflections of the wind and the resonance caused by the wind. On an urban scale, wind-related planning can help to avoid the occurrence of wind tunnel effects, as well as lower the air pressure on buildings [
6]. By optimizing the shape and dimensions of buildings, natural ventilation can be enhanced [
9]. However, the negative effects of wind can be a concern for planners for several other reasons. Dry wind carries sand and dust particles, which can cause damage to building surfaces and clog filters and ventilation ducts. Moreover, humid sea wind in coastal areas contains sodium chloride, which can cause corrosion [
5].
1.3. Performative Architecture
For an environmentally-adapted design, the wind and/or lighting criteria are an inseparable part of the form-finding process. The interconnection of wind flow and architecture, specifically internal and external airflow simulations, are receiving increased prominence in architectural design [
10]. Based on the wind or solar simulation outcomes, the performance of the design can be continuously improved until the most suitable solution is chosen.
“Performance-based design is an approach that leverages iterative simulation as a way of exploring design options” [
10]. Digital tools provide an opportunity to support performance-based conceptual design and enable researchers to create complex simulations, such as computational fluid dynamics (CFD) and wind analysis, and substitute a physical wind tunnel. Wind-related architectural performance-based design is usually carried out in the final design stage with very few possible alterations to the actual design. Nevertheless, it is necessary to adopt this approach from the initial phase of planning if the goal is to improve the environmental performance of the design [
11]. Additionally, apart from high-rise buildings, it is not general practice to analyze other types of buildings.
Furthermore, employing digital tools in the design process enables researchers to conduct parametric studies, and to generate multiple design options. This allows for the evaluation of several design options with different sets of parameter variables. However, as the number of possible alternative solutions grows, it becomes infeasible for the designer to assess every proposed solution, which might be perceived as a drawback [
12,
13]. One solution for this could be the optimization of buildings by using genetic algorithms as a form-finding method. This type of method might lead to an improved design and a way to entirely avoid subjective design decisions [
13,
14]. However, in most cases the planner can reasonably determine which of the various parametrically-generated design options (form generation based on geometric constraints) [
15] suits the design situation the best and can then choose it for further work.
1.4. CFD (Computational Fluid Dynamics) Analysis in Architecture
If the wind is the main driving factor in the parametric form-finding process, the desired interaction of architecture and the wind determines how the parameters are set to achieve a wind-responsive final design. Simultaneously, the wind performance of the various design alternatives is investigated. Several examined design alternatives created using parametric software, such as the visual programming language
Grasshopper for
Rhino and consequently tested using CFD can lead to the improved building shape or urban layout. On the one hand, such wind analysis in the early design stage, coupled with parametric designing is not yet smoothly integrated into the design loop [
16]. On the other hand, “many projects have demonstrated the usefulness of parametric studies with CFD simulations both for identifying the key parameters in the simulation, as well as for exporting different design alternatives”, as Malkawi et al. remarked already in 2005 [
17].
CFD has rapidly improved over the last 30 years [
18]; it has become gradually accessible to design practices [
19], and is slowly penetrating into the architectural and civil engineering area [
20]. The fact that the positive and negative space of buildings in an urban layout shapes air movement was addressed in 1998 [
21]. Consequently, the application of CFD simulations on building structures exhibits great potential for not only understanding, but also improving the dynamic interactions of the wind with the built environment [
22].
The wind flow’s potential to generate the shapes of building envelopes is examined in the following case study. This design strategy investigates the parametric shape generation of an airport terminal and subsequently examines the wind performance of three shape alternatives using open-source plug-ins for Rhino. The interaction of the proposed shapes with the wind will be observed, alongside their effect on the pedestrian wind comfort near the intended entrance.
2. Materials and Methods
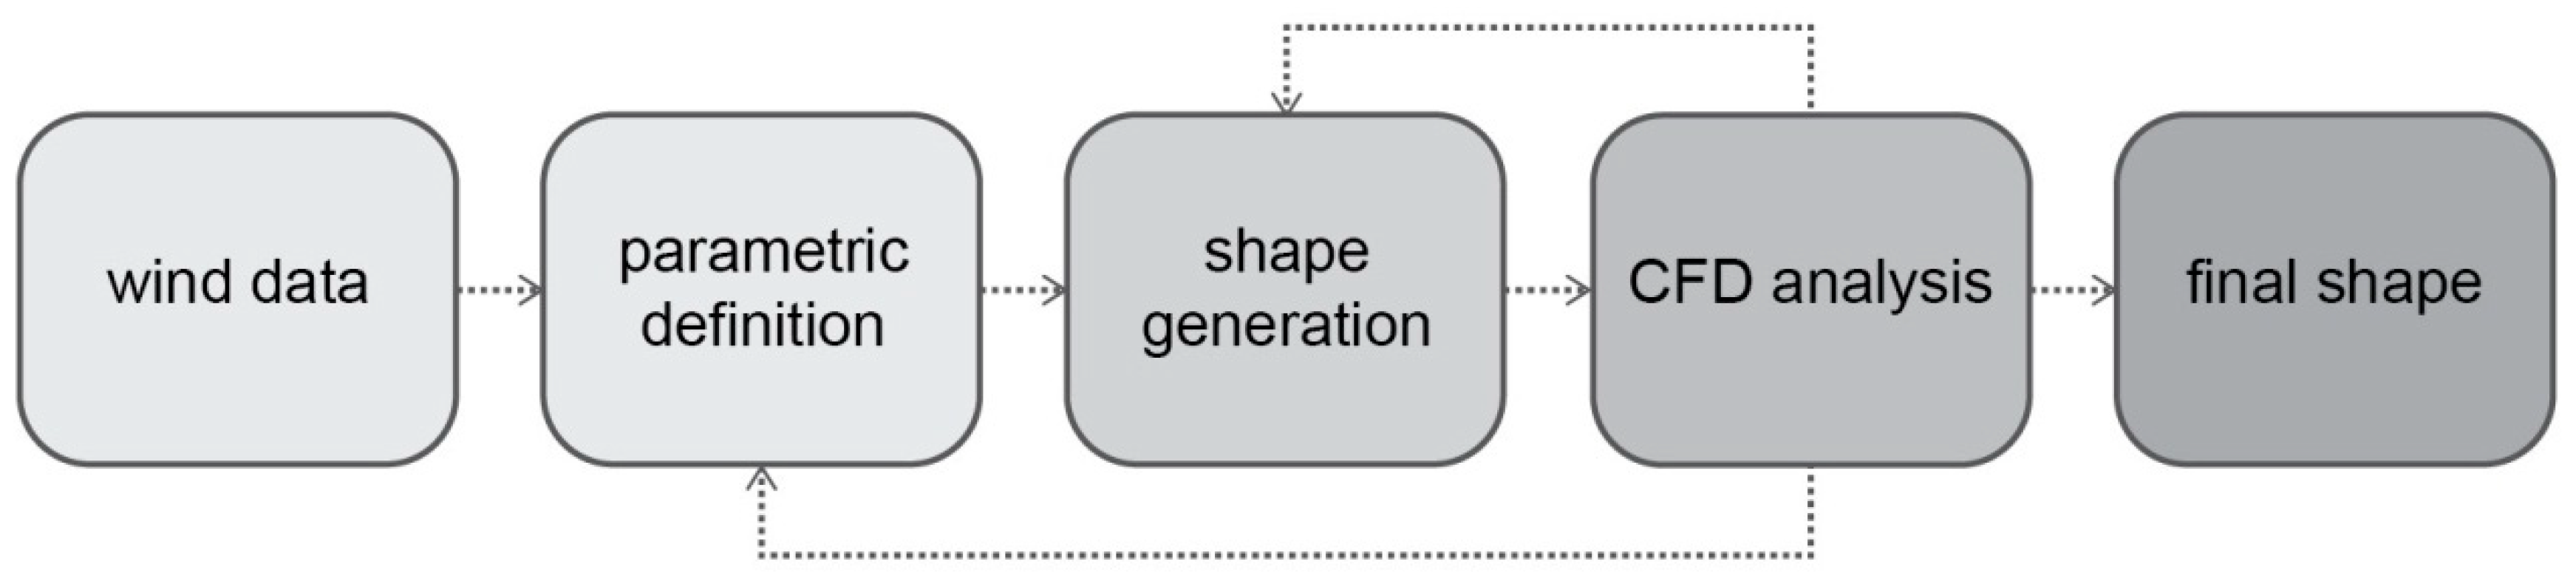
The methodology presented in this research is utilized to find the best performing building envelope in the specific wind conditions. At the same time, however, this step-by-step architectural design method proposing a design loop for creating building envelopes is the intention of this study.
Figure 1 is a scheme of the developed methodology incorporating the detailed analysis of the wind situation through parametrically creating various shape alternatives, and subsequent CFD testing to finally selecting the best-performing geometry, decided by the designer according to the initial goals.
For an illustration of the design loop that enables us to search for the optimal wind-influenced architectural shape in the iterative process, the airport in Reykjavik is selected as a case study site. The airport location is selected for the following reasons: (1) Iceland is a remote island very close to the North Polar Circle (Arctic Circle), which influences its climatic conditions; (2) the airport has interesting micro-climatic conditions caused by the high hill on the east and the bay on the south-west; (3) the old airport building, shaped as a simple block with a pitched roof is placed very close to the short runways [
23] and creates an obstacle to the wind. Instead, an aerodynamically-shaped alternative is sought within the framework of this case study.
2.1. Wind Speed in the Last Decades
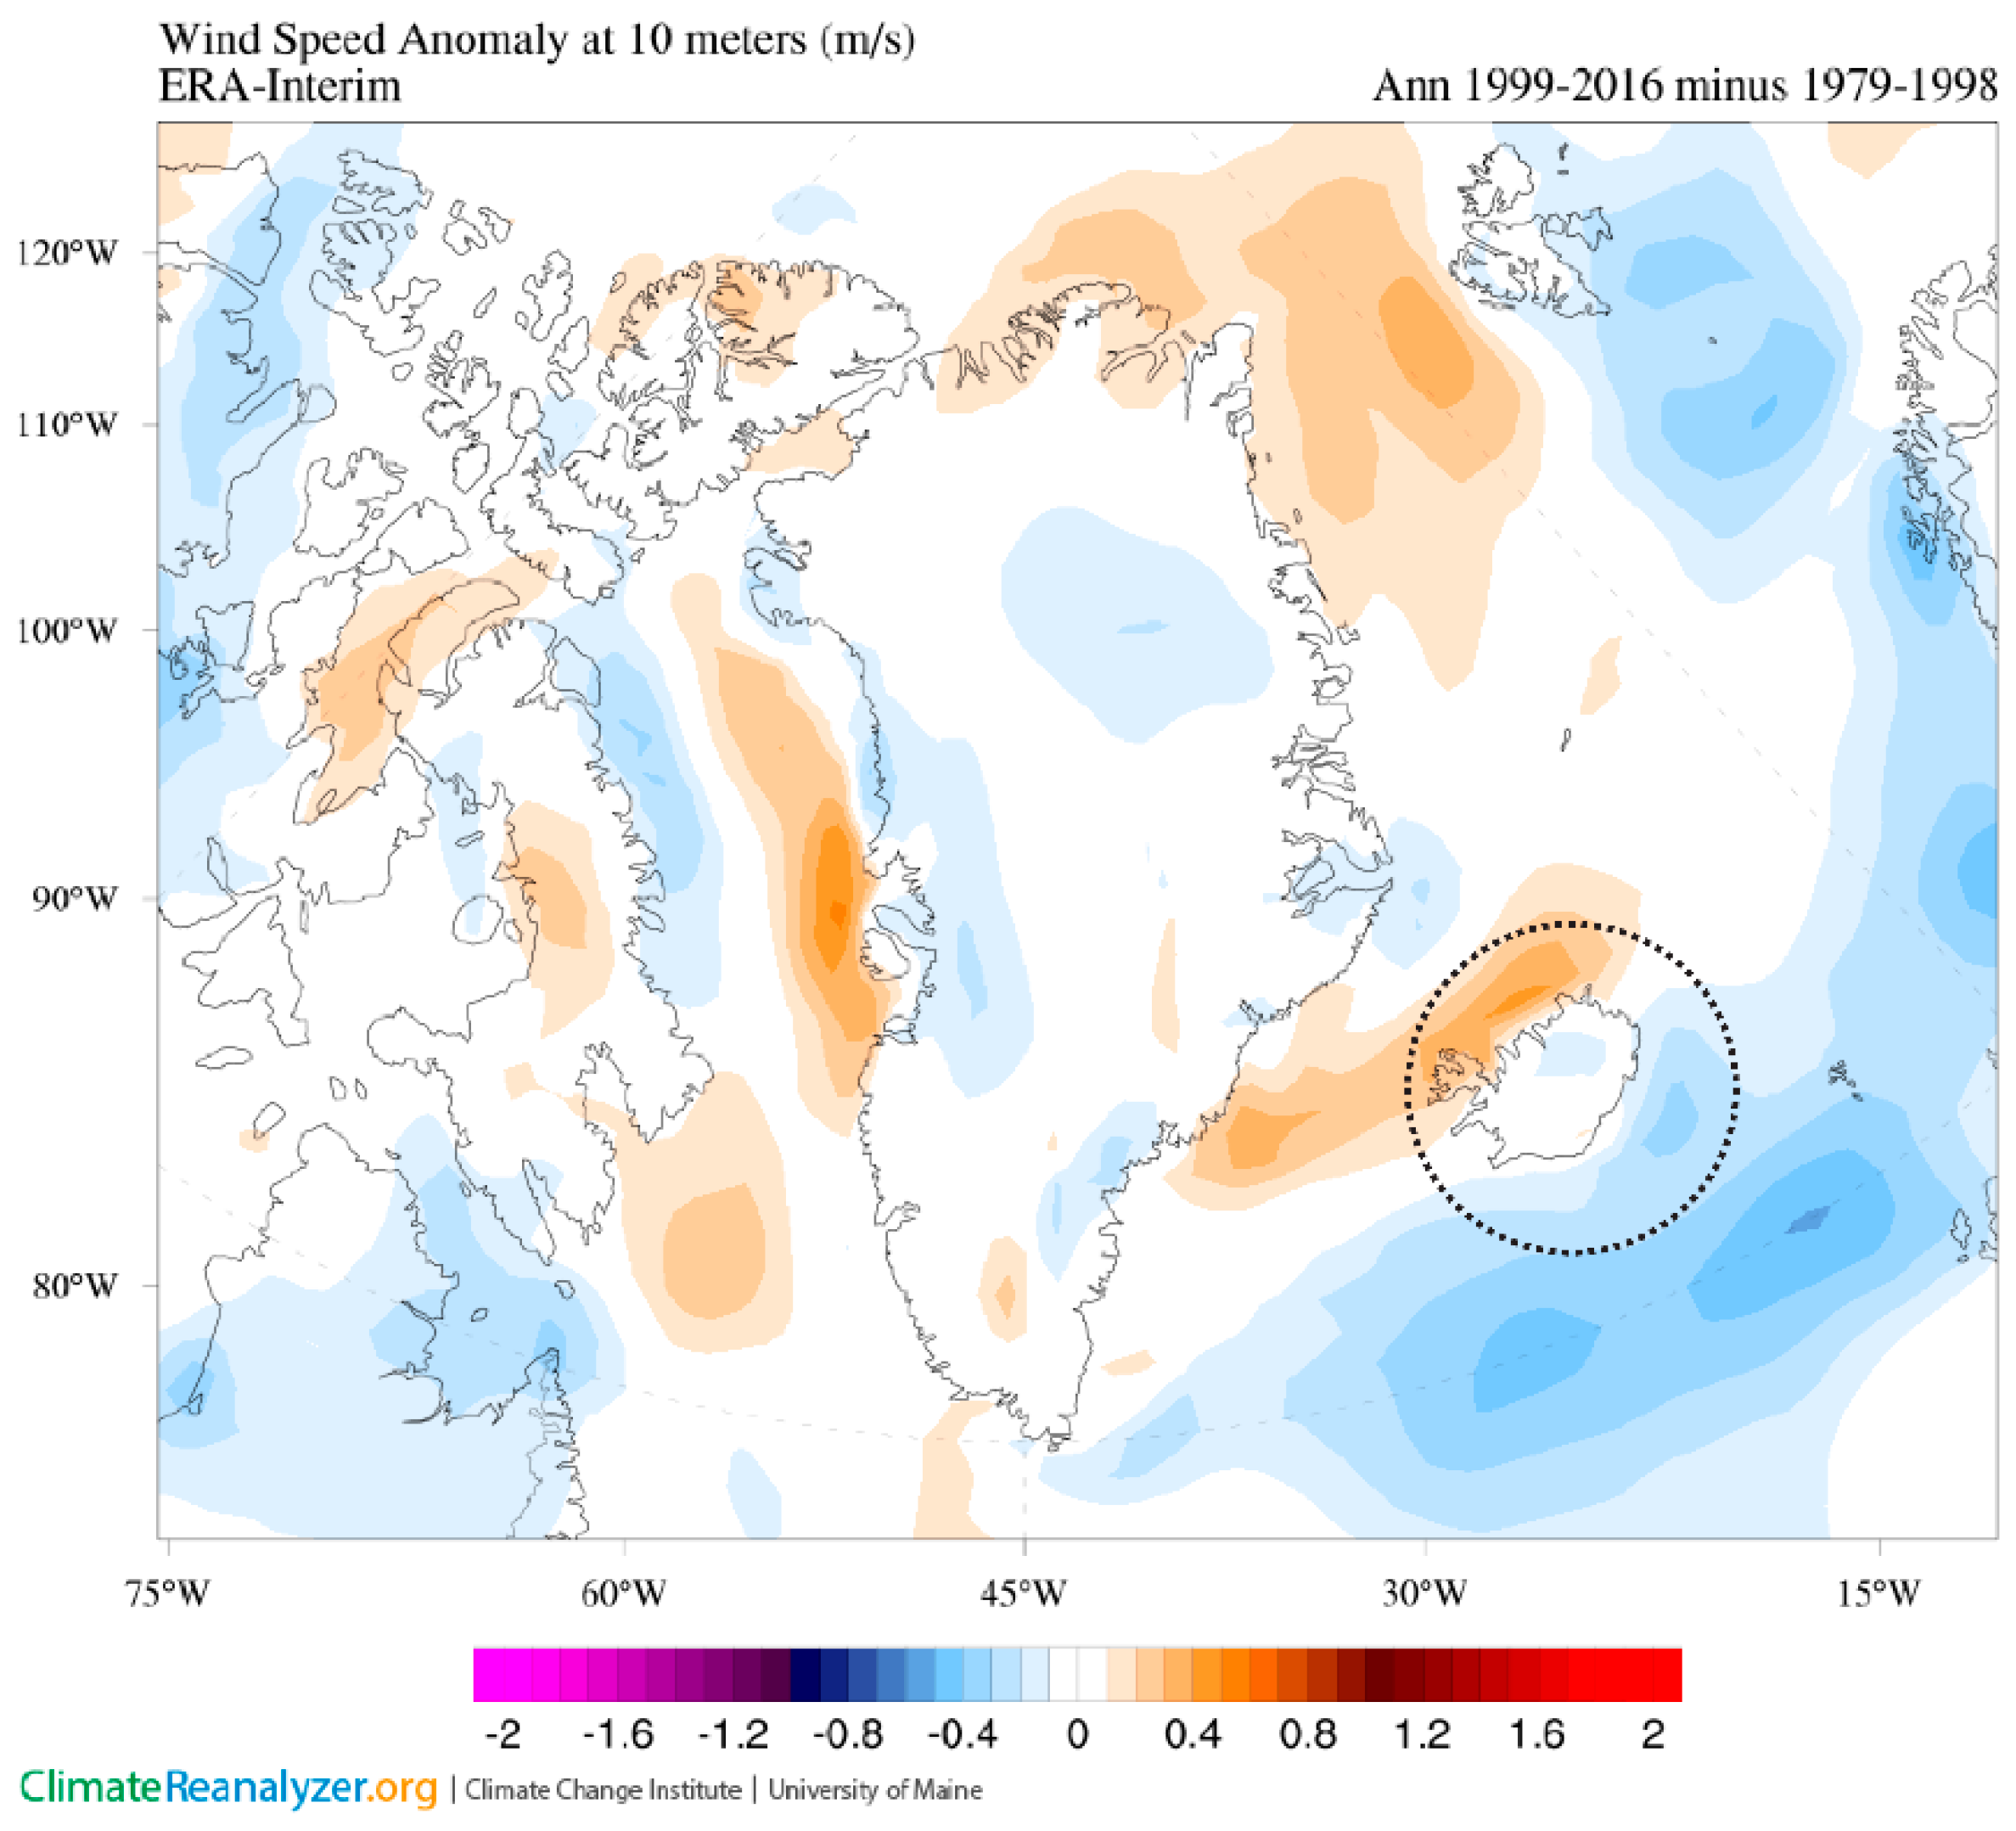
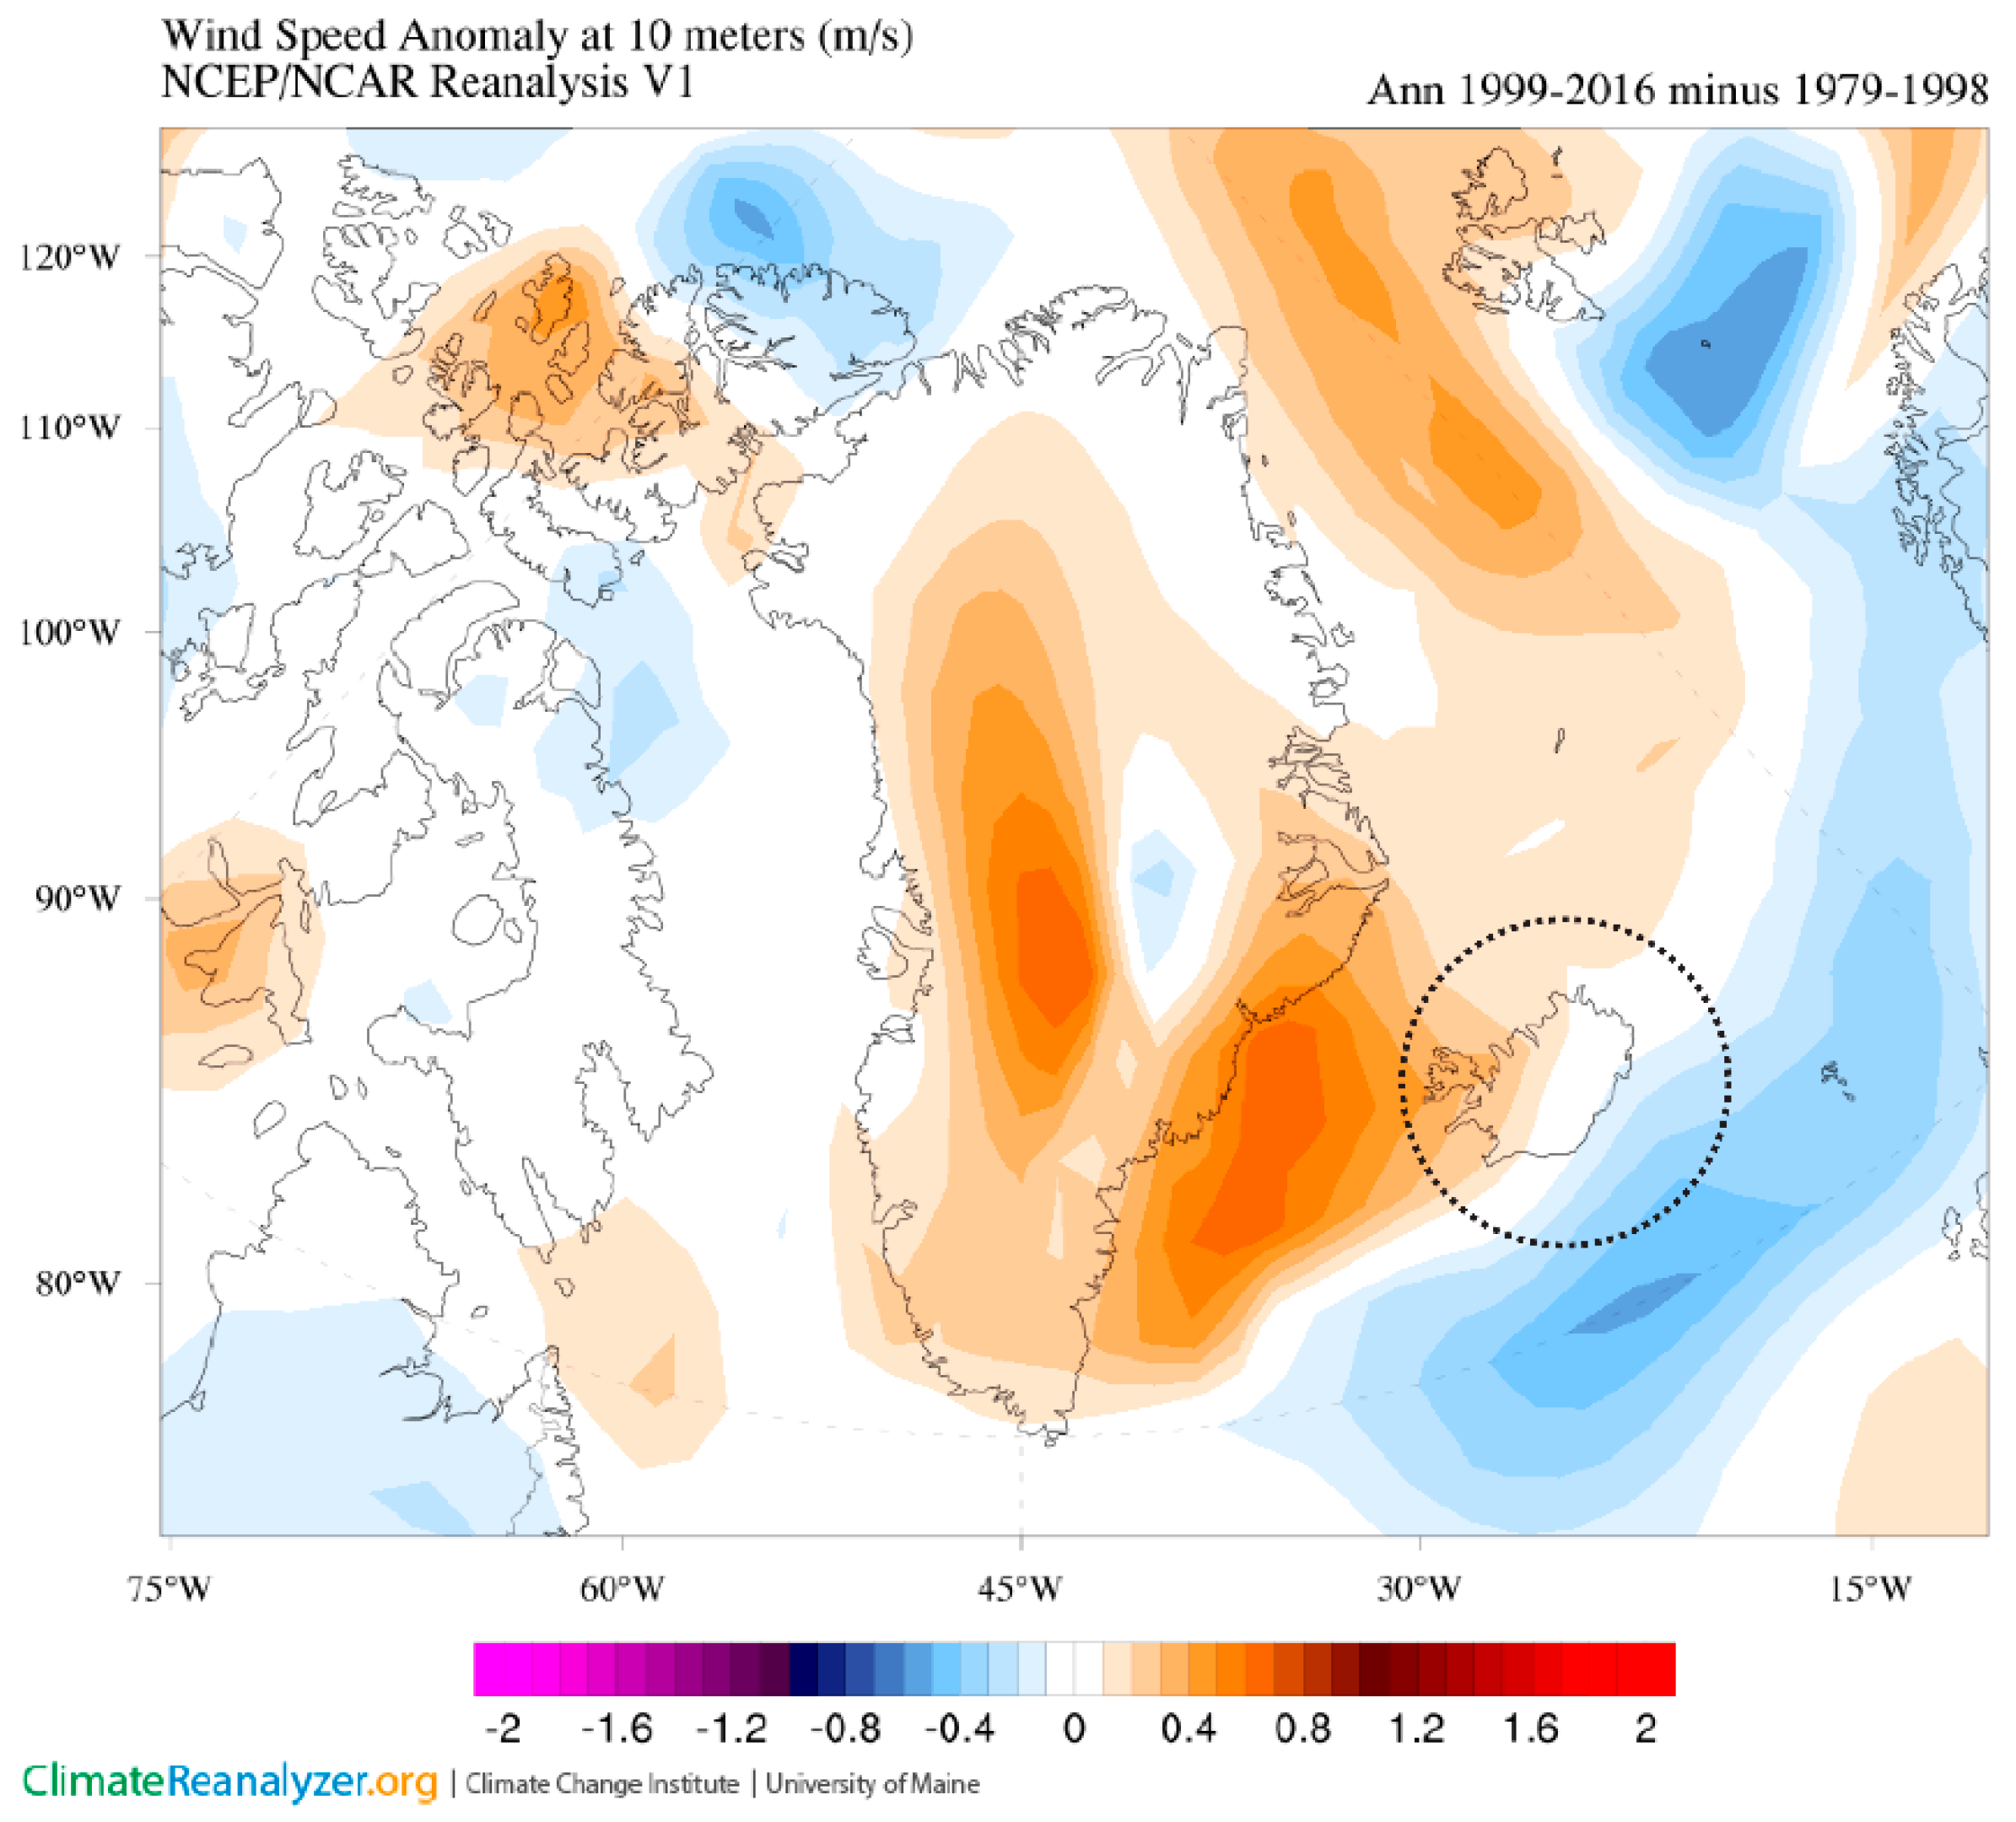
Firstly, we want to understand the climatic circumstances, particularly the wind situation in Iceland and the micro-climatic conditions in Reykjavik. Scientists use several types of climatic models for climatic data evaluation. Climate Reanalyzer is a free weather map web database, created by the University of Maine [
24]. In this case study, the maps are used to find the correlation of two time periods of 1999-2016, and 1979-1998. The data are exported as images using two different climatic models, ERA-Interim and NCEP/NCAR Reanalysis VI (
Figure 2 and
Figure 3). The figures show the tendency of the wind speed at a 10 m height above the ground. Two selected climatic models interpret the changes with slight differences. Both of them, however, indicate higher wind speeds in the last years compared to the period from 1979 to 1998, at least over a part of Iceland. In this area, the strong wind is the most frequent weather phenomenon that often impacts airport operations [
23]. Based on the known facts, we can assume a tendency of accelerating wind in this location. Nevertheless, the wind behavior is fluctuating and complex, and the predictions for the future development of the wind speed are even more unclear.
2.2. Weather Data Statistics
This project works only with the digitally-accessible data, as this first stage of the project is conducted in a digital, computer-based way. The weather data for Reykjavik were downloaded as an *epw weather file from the EnergyPlus online weather database [
25]. The file contains representative data for the chosen location.
3. Reykjavik Airport Analysis
Reykjavik (RKV) airport is the second largest airport in Iceland and is only 50 kilometers away from Keflavik (KEF) airport. The location for the city’s international airport was selected in 1940, and the small airport terminal was constructed in 1948. In the 1960s, the two main flight companies moved their operations to Keflavik, while keeping domestic flights in Reykjavik. The Reykjavik airport is slated for closure in 2024, with the main reason being the possible development of the area, which is close to the city center. In any case, no final decision has yet been taken.
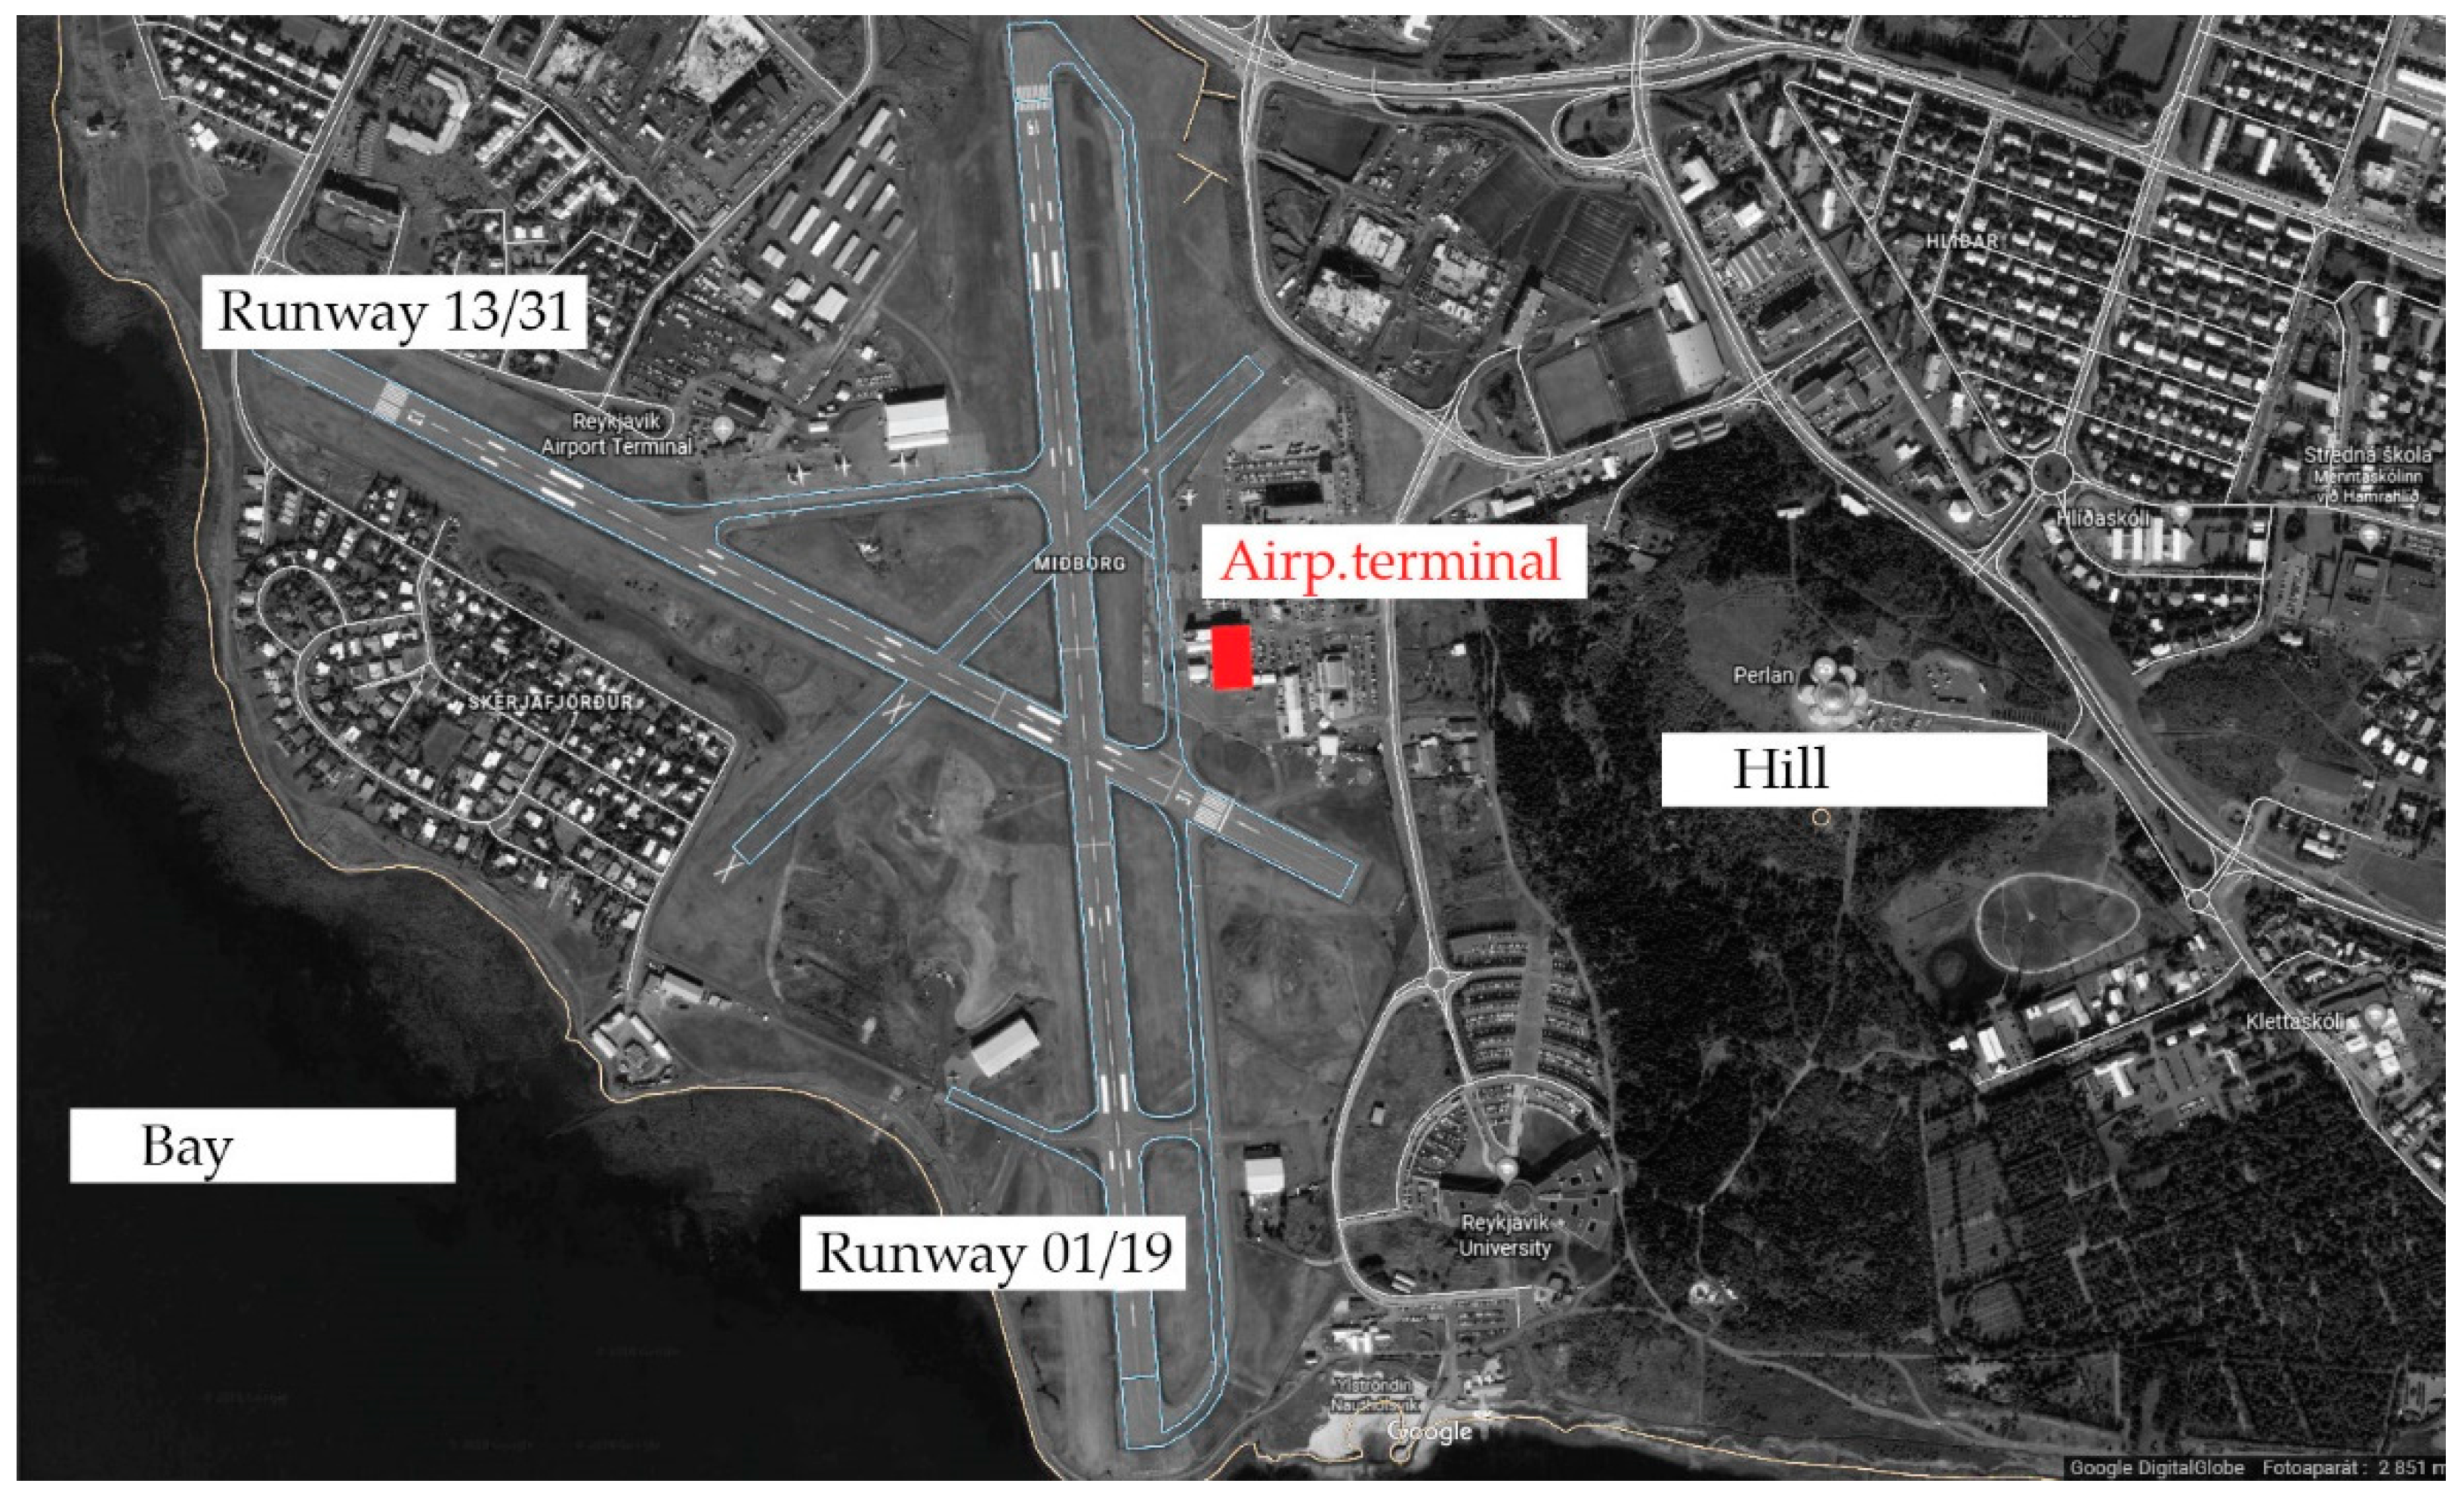
The airport has three short runways; two of them are active, but the shortest (869 meters long) runway, was closed in 2016 (
Figure 4). The other two runways are 01/19, which is 1567 m long, and 13/31, which is 1230 m long. Surrounded by the bay from the south-west side and a 60-meter high mountain from the east side, the airport has, naturally, a flattened morphology. Family houses are located north of the airport [
23]. The airport in Reykjavik had 376 347 passengers last year, which was 5.5% less than the year before that [
26].
The airport site serves as a case study site. The placement of the new terminal building is considered at the same location as the old terminal, close to runway 01/19.
Wind Rose
As mentioned above, EnergyPlus is used to obtain the *epw weather file that is subsequently imported to
Grasshopper.
Ladybug for
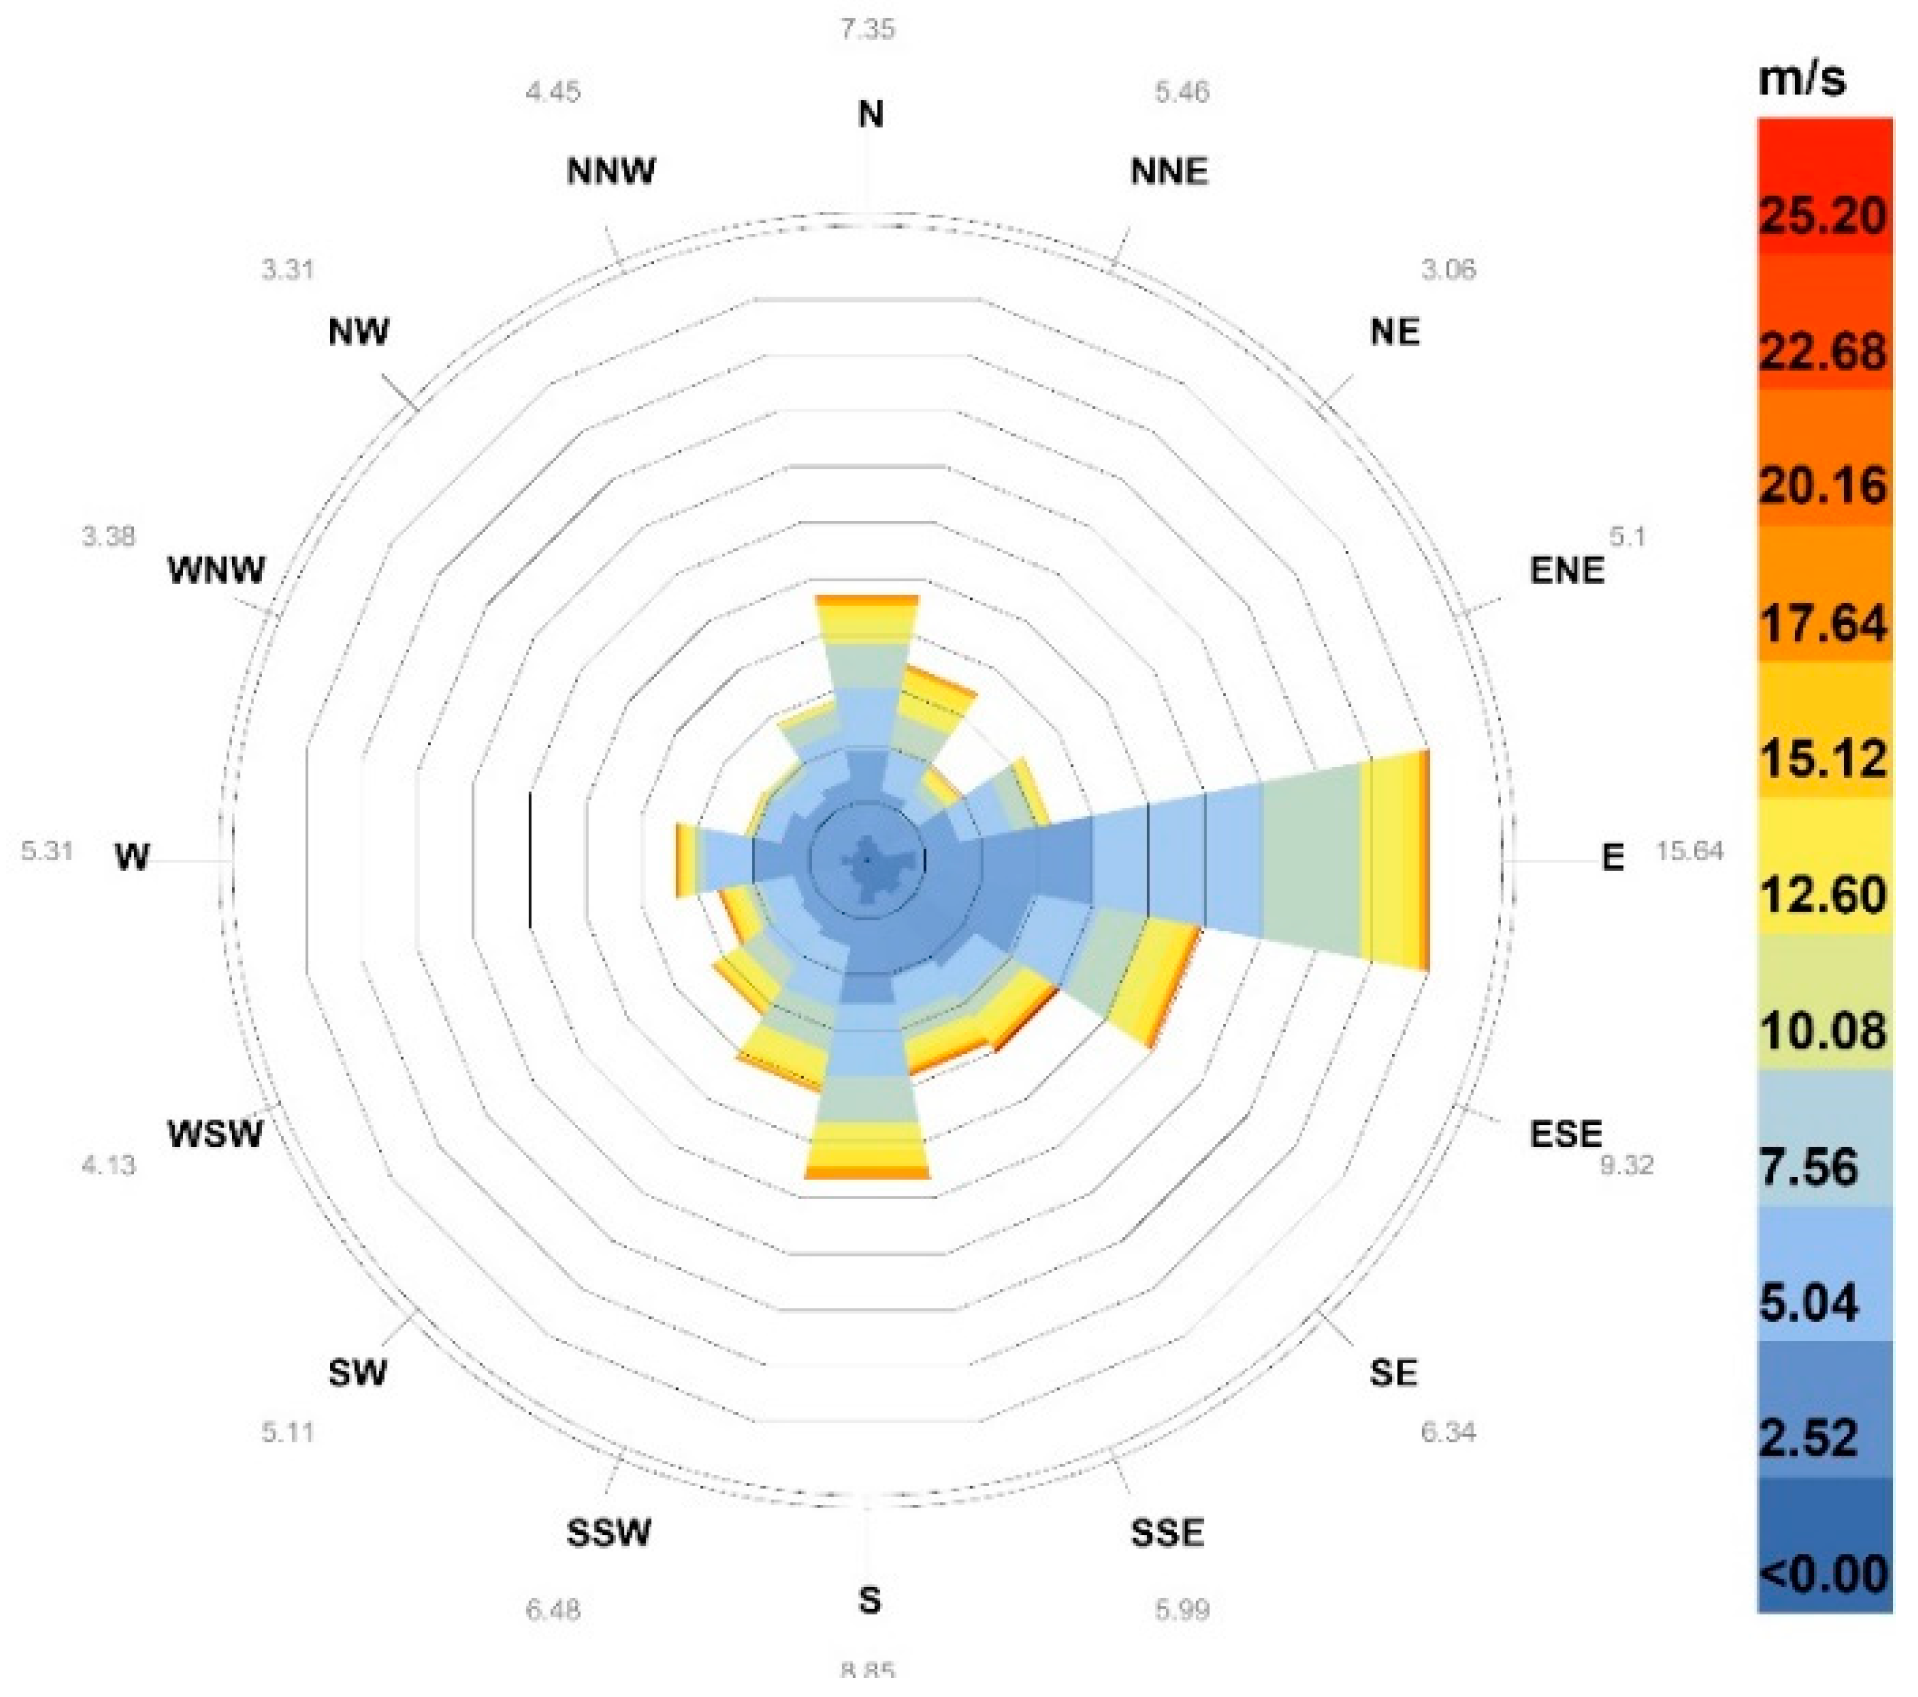
Grasshopper is a collection of free environmental design applications that can convert a weather file into a graphical form of wind rose. The wind speed and direction can be displayed for a specified period throughout the year, while also showing the frequency of winds (
Figure 5). The analysis indicates that easterly winds are prevailing (15.64% of the time per year) at the airport in Reykjavik. The wind gust speed can reach 25 m/s and more in all wind directions. Barely 0.72% of the time, which accounts for 63 hours per year, there is no wind in the given area. The average wind speed for easterly winds is 6.2 m/s. This value can be obtained from the weather file and is used for wind analysis in the following chapters. According to a different data source available on the Icelandic Meteorological Office’s website based on the measured values in the years 1949-2017, the average wind speed for all wind directions in Reykjavik is 5.53 m/s [
27].
According to data from the EnergyPlus website, the average wind speed for all wind directions is around 5.89 m/s, which is only a slightly different value. This data source is hence chosen, due to its convenient usage in
Grasshopper. The prevailing easterly winds are stronger than 5 m/s for 9.38% of hours per year. For all wind directions, the wind speed is higher than 5 m/s for 52.4% of hours per year. Moreover, the wind speed exceeds 15 m/s for 2.59% of hours per year, with the south-east direction encountering the strongest wind gusts. According to the Dutch Standard (NEN 8100: Wind comfort and wind danger in the built environment) that sets the threshold values for pedestrian wind comfort, if the value of 5 m/s is exceeded more than 20% of the time, the conditions for outdoor pedestrian activities are poor. If the wind speed is higher than 15 m/s for 0.3% hours per year, the conditions become dangerous [
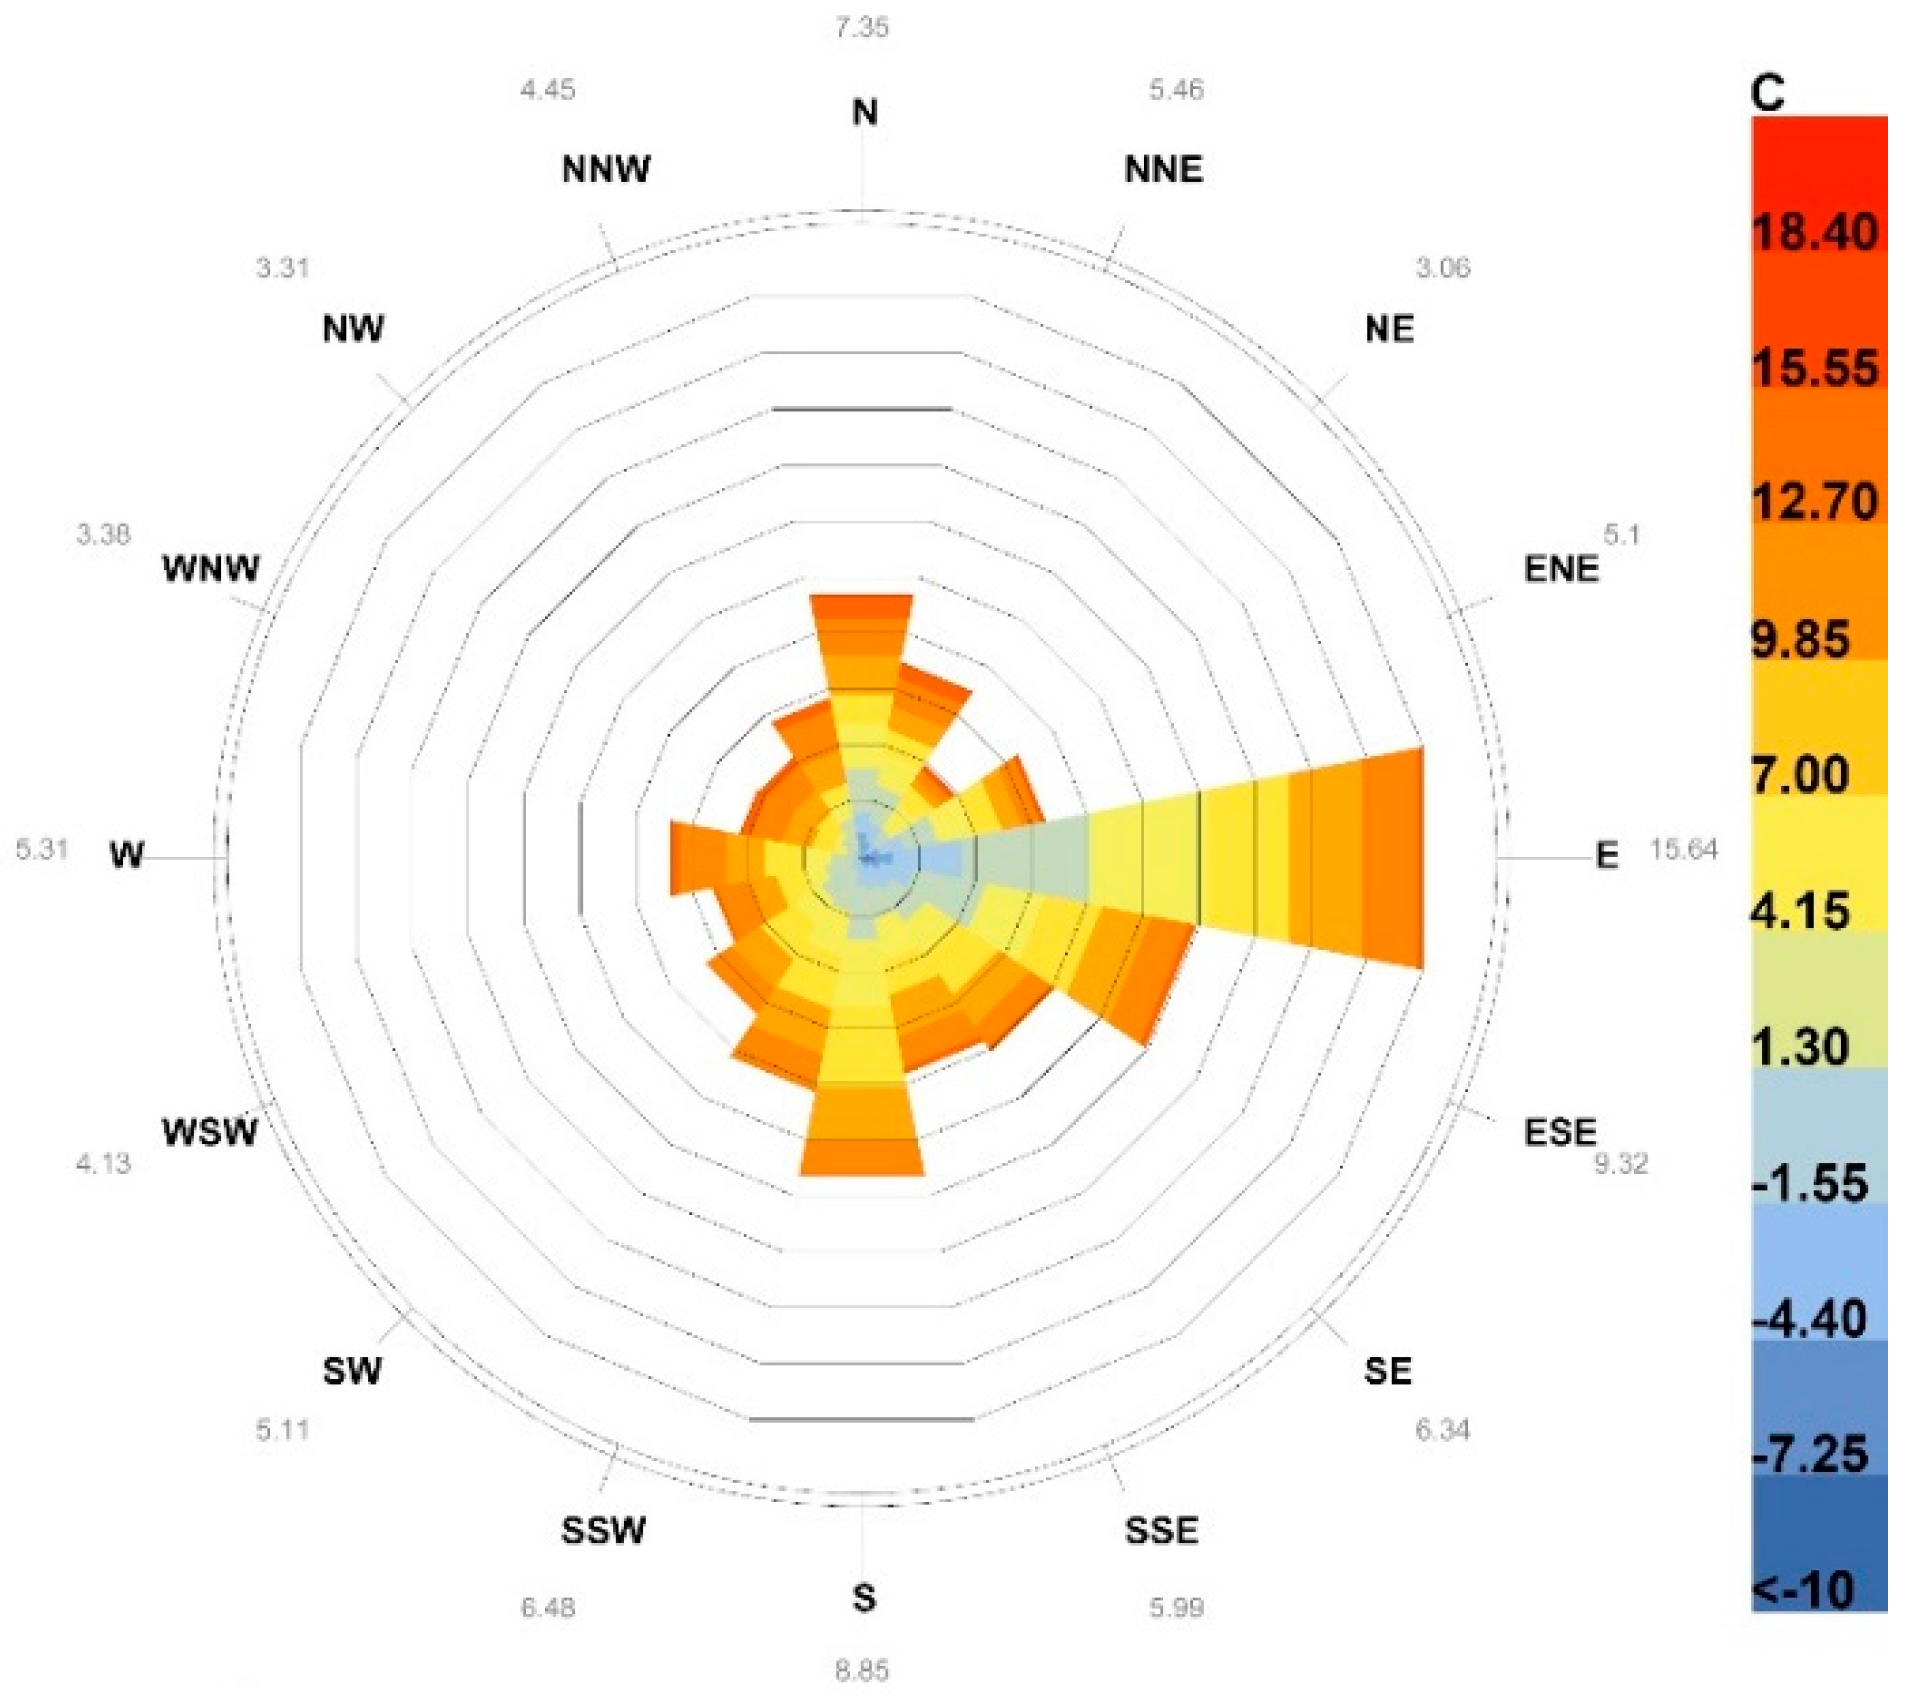
28]. The average wind temperature in Reykjavik is relatively low which contributes to the pedestrian discomfort in the outdoor environment (
Figure 6). Only for 13.57% of hours per year is the temperature of the winds higher than 10 °C.
These observations are taken into account in the new airport building design.
4. Parametrically-Controlled Design
Parameter-based algorithmic modeling offers greater freedom for designers in the exploration of possible solutions and the creation of best-fitting alternatives [
1]. Determining the geometry-generating process, which of the parameters can change, and how they influence the final design is key to environment-reactive solutions.
In the given microclimate of Reykjavik’s airport, based upon the idea of the interaction with the wind, a wind-shaped airport terminal is designed. It is intended as a conjunction of the finger/pier and the linear airport terminal concept [
29], but the building program is not elaborated further, as it is not relevant for this phase of the research. The Reykjavik’s airport terminal currently in service is a two-floor rectangular building, with a floor plan size of around 80 × 50 meters. A possible slight increase in the number of passengers is accounted for in the design. Regarding the relation to the wind, the new terminal is designed as a streamlined body. The dimensions differ a little for every shape modification (
Table 1). An optimal shape is sought to interact with the wind with minimum resistance to the flow, providing a pleasant outdoor climate around the entrance to the airport terminal, as well as the outdoor wind shelters, while not influencing airplanes’ take-offs and landings on the runways in the proximity of the terminal.
Airport Terminal
The parametric control of the design and the overall shape generation is performed by utilizing
Grasshopper. The airport terminal’s shape is created from a single, closed planar curve. The shape formation is also dependent on ‘shape-influencing’ points, behaving as attractors. These core elements are variable and are designed and set at the beginning of the wind-influenced form-finding process, based on the knowledge of the site’s wind situation (
Figure 7). The proposed parametric definition consists of the following main steps:
(1) The designed planar curve is defined by the constant number of control points. In this research, the number is set to 25.
(2) The proximity (the distance) of curve control points to the ‘shape-influencing’ points located on the same plane is determined.
(3) Based on the ascertained distances, each control point is lifted in the z-direction in the pre-specified height range.
(4) A double-curvature shape of the morphing roof/façade is created by moving the ‘shape-influencing’ attractor points that represent the shaping power of the wind flow and the vision of the designer at the same time. The designer can set any number of shape-influencing points for integration into the form-finding process. In this research, there are three points used. The closer the points are to the curve, the more the shape is closed to the wind flow, and ergo the curve control points are kept at zero height. The curve control points can move only in the z-direction and only to the maximum height, restricted to 20 meters.
(5) In the next step, the volume is created consisting of slices of various extrusion heights, set by the designer (
Table 1).
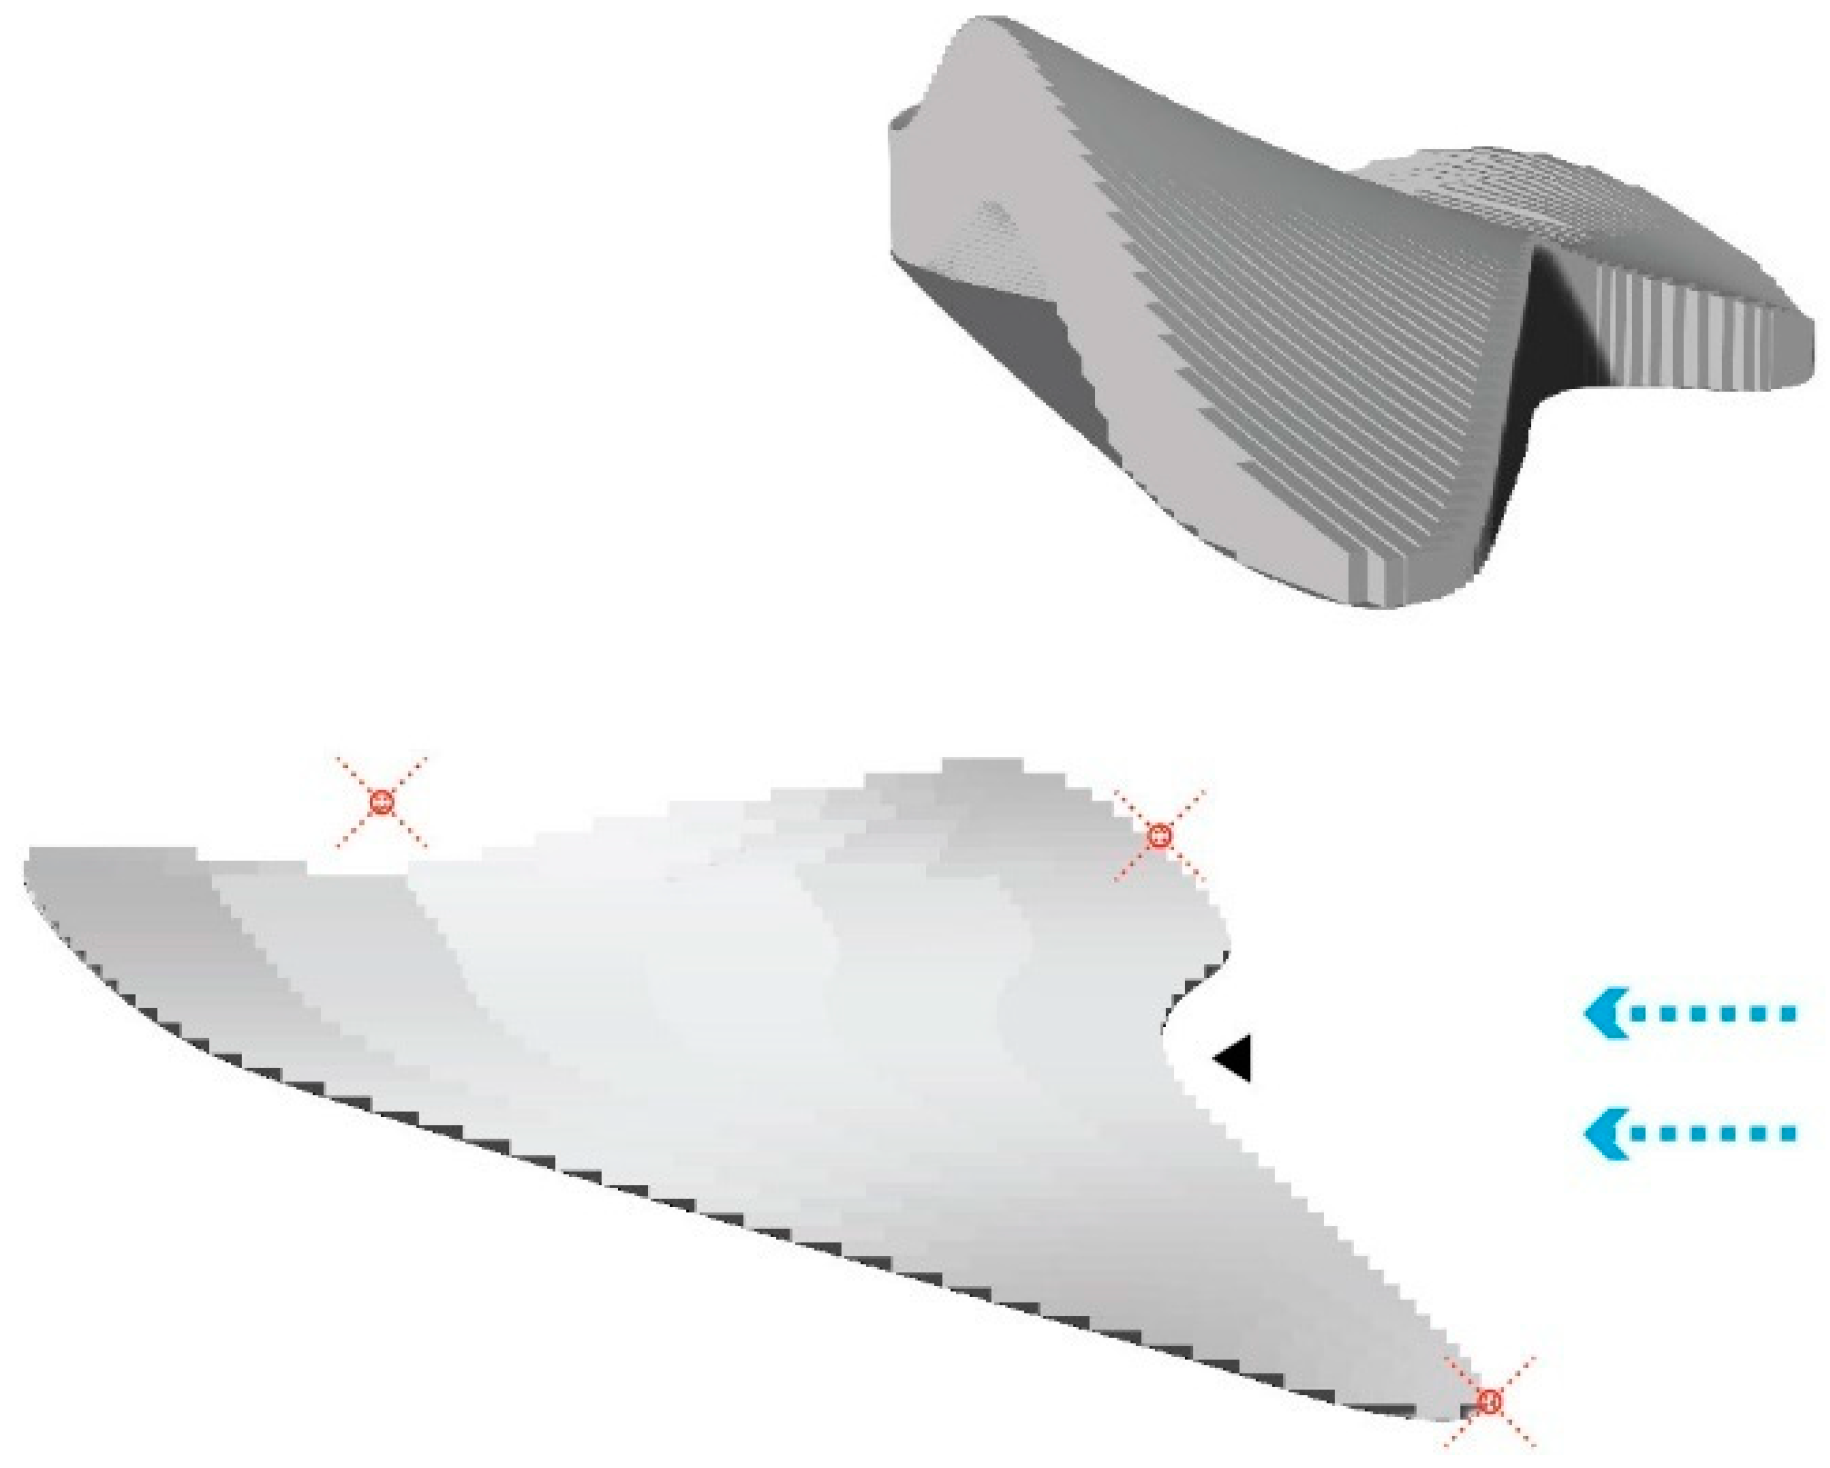
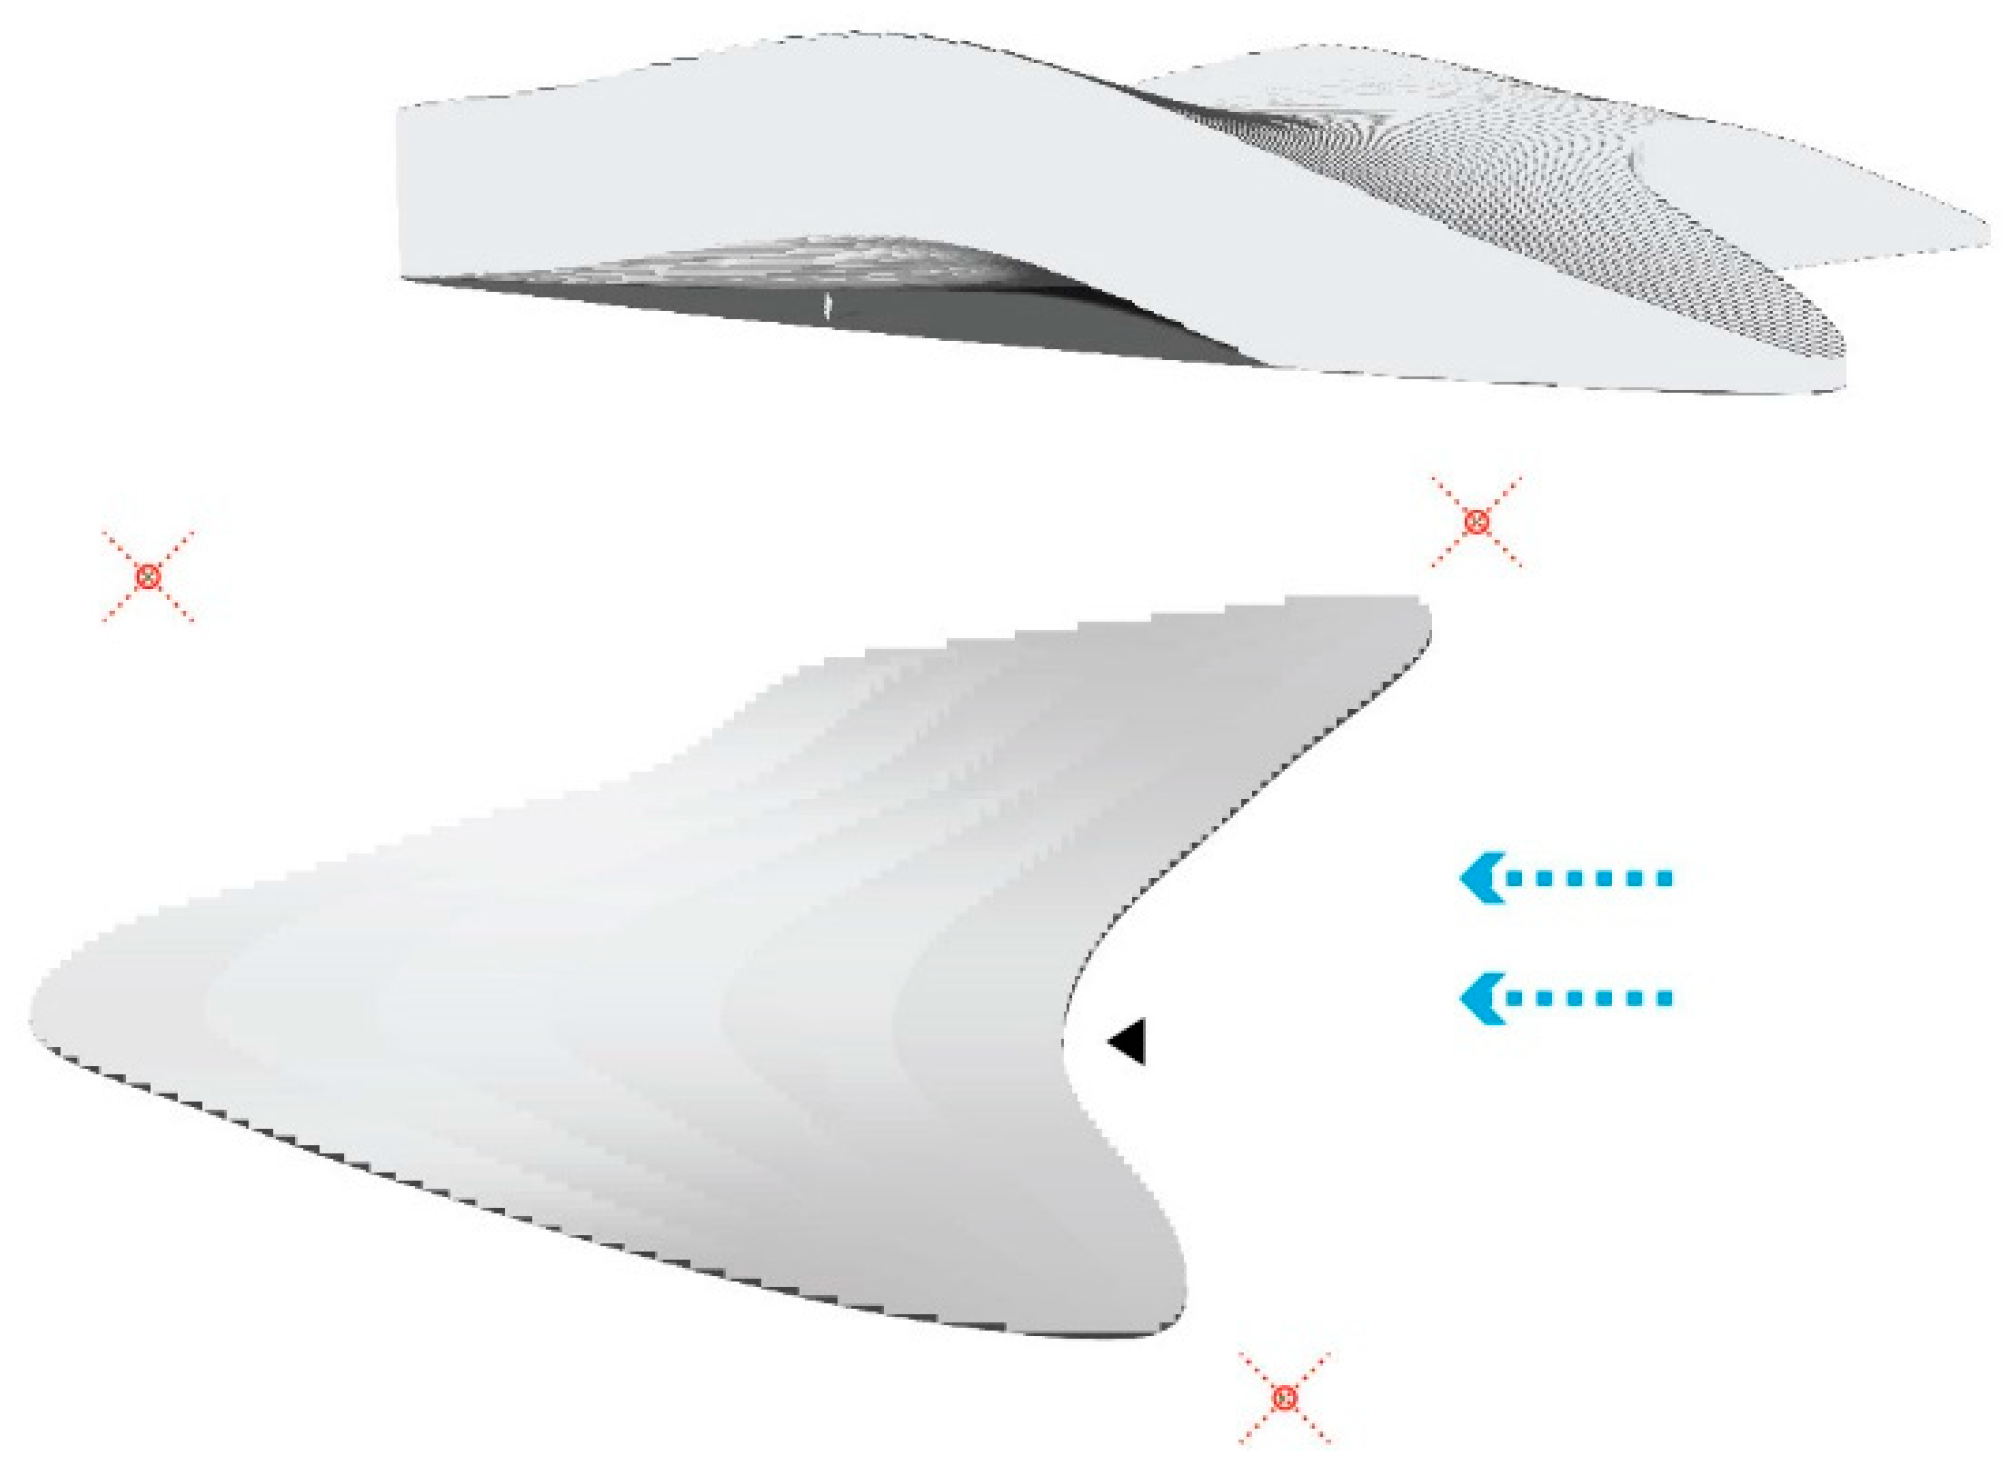
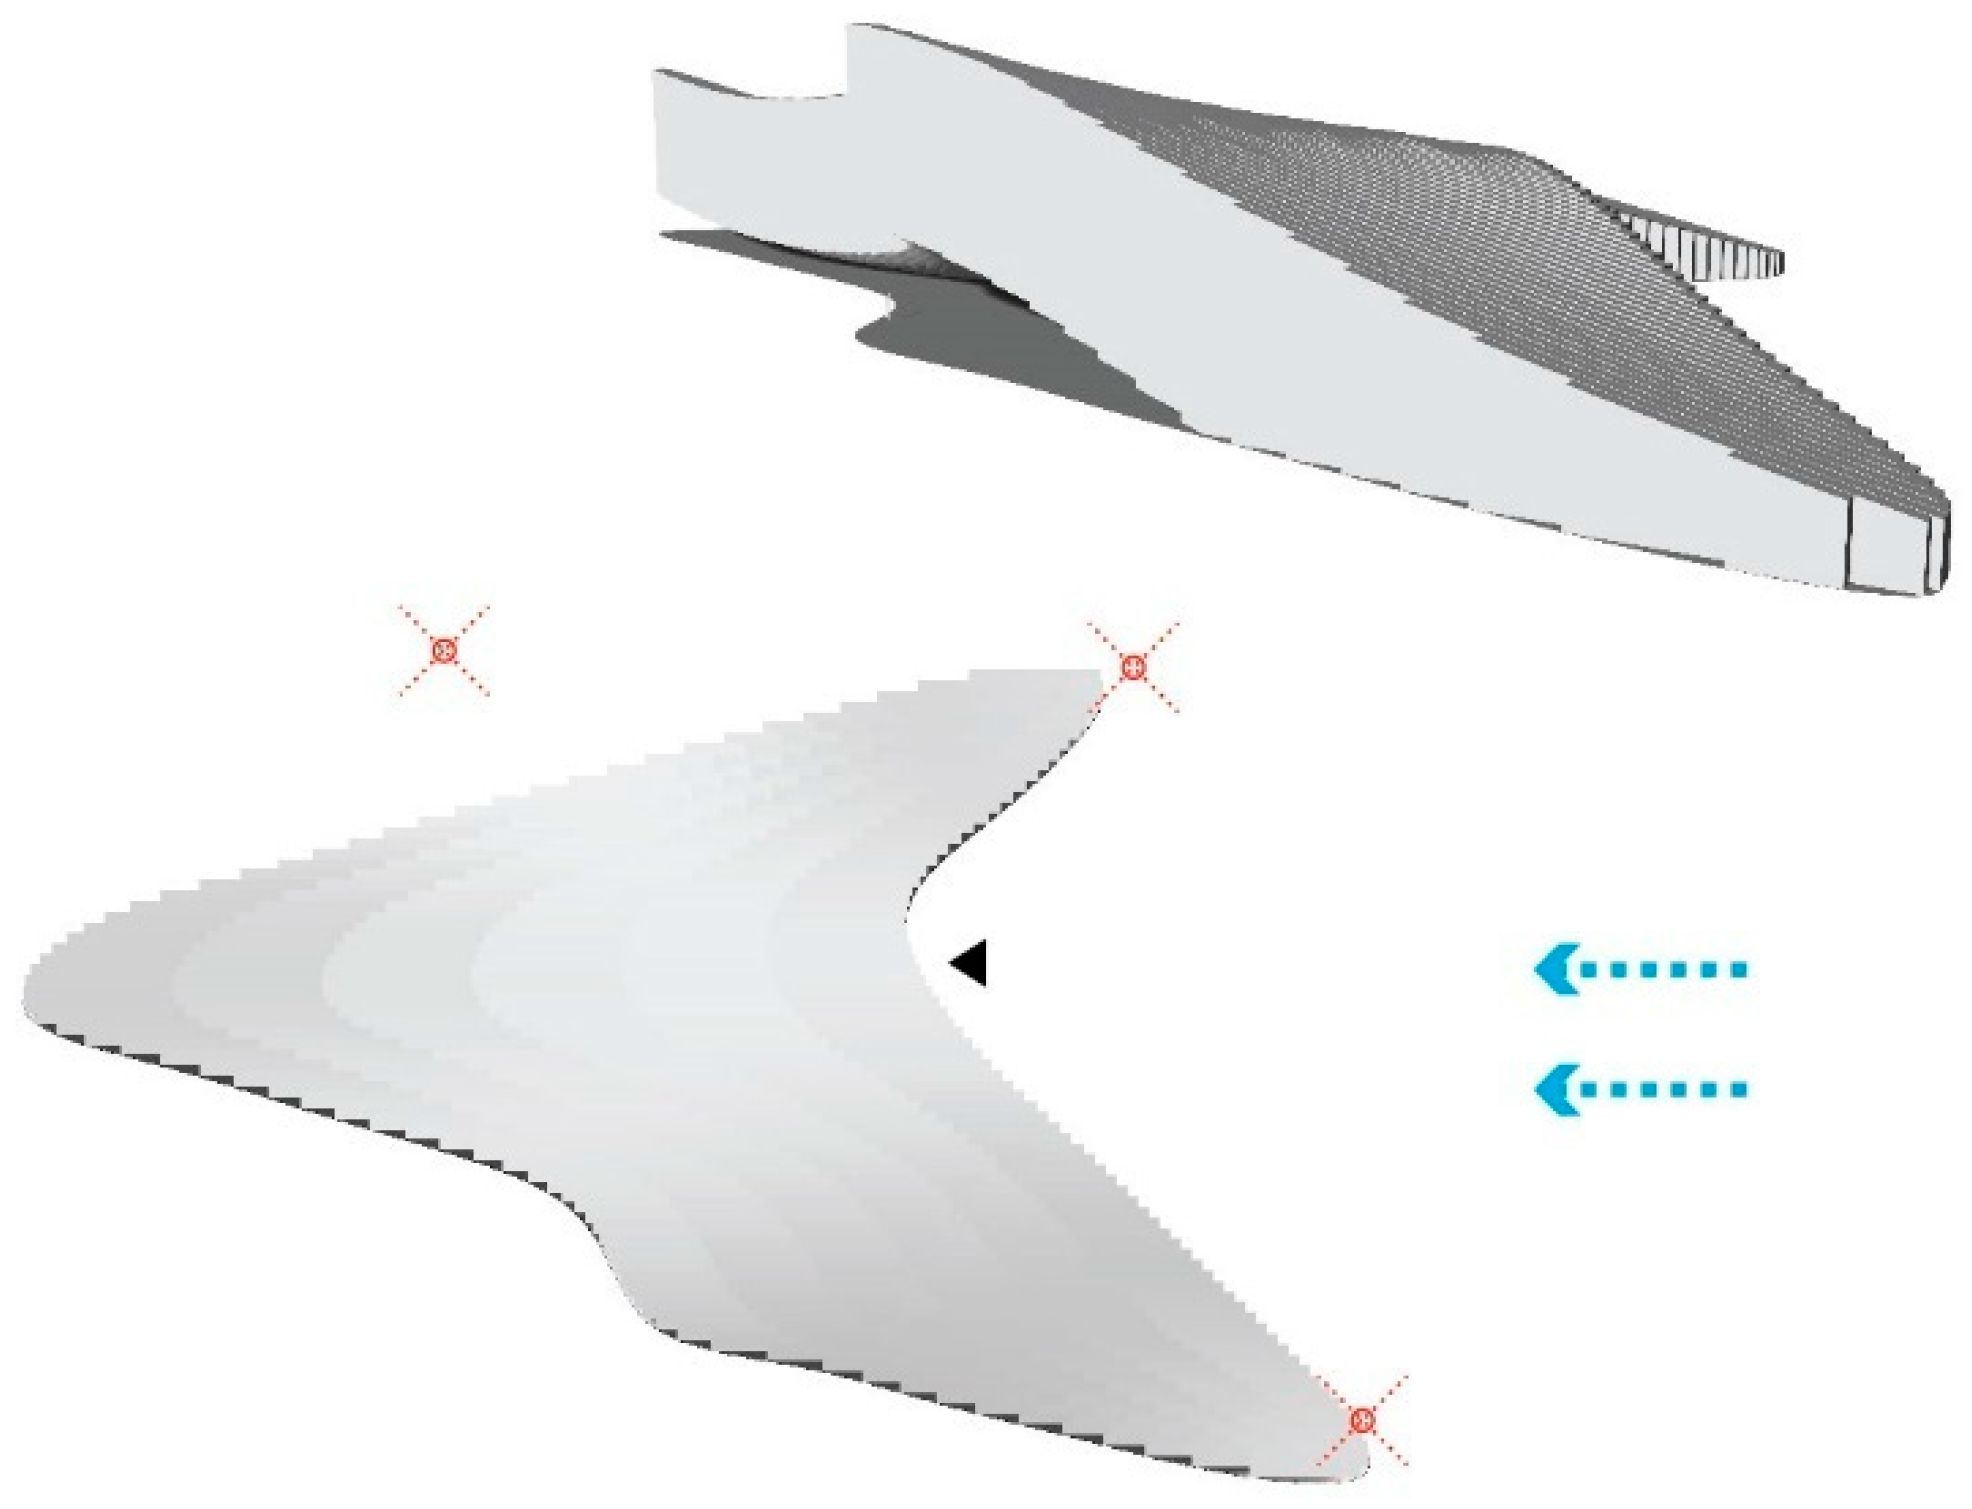
After the preliminary tests of several diversified base curves, only one type is selected for the further elaboration. Three shape modifications of the previously selected closed planar curve with different positions of the shape-influencing points (three parameters sets) generate the three airport terminal shapes tested in this paper.
The generated shapes are displayed in
Figure 8,
Figure 9 and
Figure 10. The sliced, rough geometry is intended to decelerate the wind flow. The geometry of the airport terminal is at some points lifted above the ground and at some points touches the ground to create a sheltered open-air space.
5. CFD simulations in Swift
Swift CFD software is used to perform the wind tests of the three parametrically-controlled shape alternatives. The simulation results are compared in Paraview, an external open-source software necessary for visualizing the CFD results. Despite the wind speed and direction fluctuating in time, there is a clear prevailing easterly wind direction at Reykjavik’s airport. This wind direction and the average wind velocity of 6.2 m/s are used in the simulations.
5.1. Swift Software
ODS Engineering has developed the Swift CFD tool for the working environment of Grasshopper. It runs on the platform of OpenFOAM (open source CFD toolbox). Originally, ODS Studio, combining powerful engines, such as OpenFOAM, Radiance, and EnergyPlus into one simulation tool, was developed for Blender. Swift is a new plug-in for Grasshopper that functions on an Ubuntu virtual machine running on Windows 10. The process of installation requires following the YouTube tutorial provided by ODS Engineering. A big advantage of this new CFD software integrated with Grasshopper is that the whole design process, starting from an architectural idea, through the parametric control of the model and subsequent CFD simulation of every modification, can be done in one environment. Another benefit is the programming approach to the setup of CFD cases based on the OpenFOAM syntax rules. Swift, however, requires Paraview external software for the visualization of the calculated results. Also, there is almost no online support, or a guide for the beta version of Swift, which remains a disadvantage at this moment, although a user can study instructions for OpenFOAM in general and make use of them in Swift.
For this research, the ‘SimpleFoam’ (semi-implicit method for pressure-linked equations) algorithm is used as an iterative algorithm for solving the Navier-Stokes equations, whereas RAS (Reynolds-averaged stress) is used as a turbulence model for a steady-state simulation [
30]. Block Mesh and Snappy HexMesh utilities are used to mesh the examined geometry.
5.2. Input Settings and Boundary Conditions
The simple external CFD’ algorithm, accessible online, is used. The following changes in the boundary conditions are made: (1) the inlet wind speed is set to 6.2 m/s at the maximum
x; (2) the wind tunnel walls are set to ‘wall slip’; and (3) after several trial attempts, the solver is set to terminate after 250 iterations when the residual of the equations reaches the convergence tolerance of 10
−5 for the velocity components,
Ux,
Uy, and
Uz [
30].
The minimum level of geometry meshing is set to 4, whereas the wind tunnel cell size is set to 3 meters. According to the best CFD guides, the wind tunnel dimensions should be integral multiples of the tested geometry height. Upwind and downwind, the size of the domain is 5H, and 15H, respectively, while the sides, as well as the height, is 5H [
31].
Swift settings cannot precisely control the geometry placement in the wind tunnel, which is why the CFD guidelines cannot be applied here. The geometry is centered in the
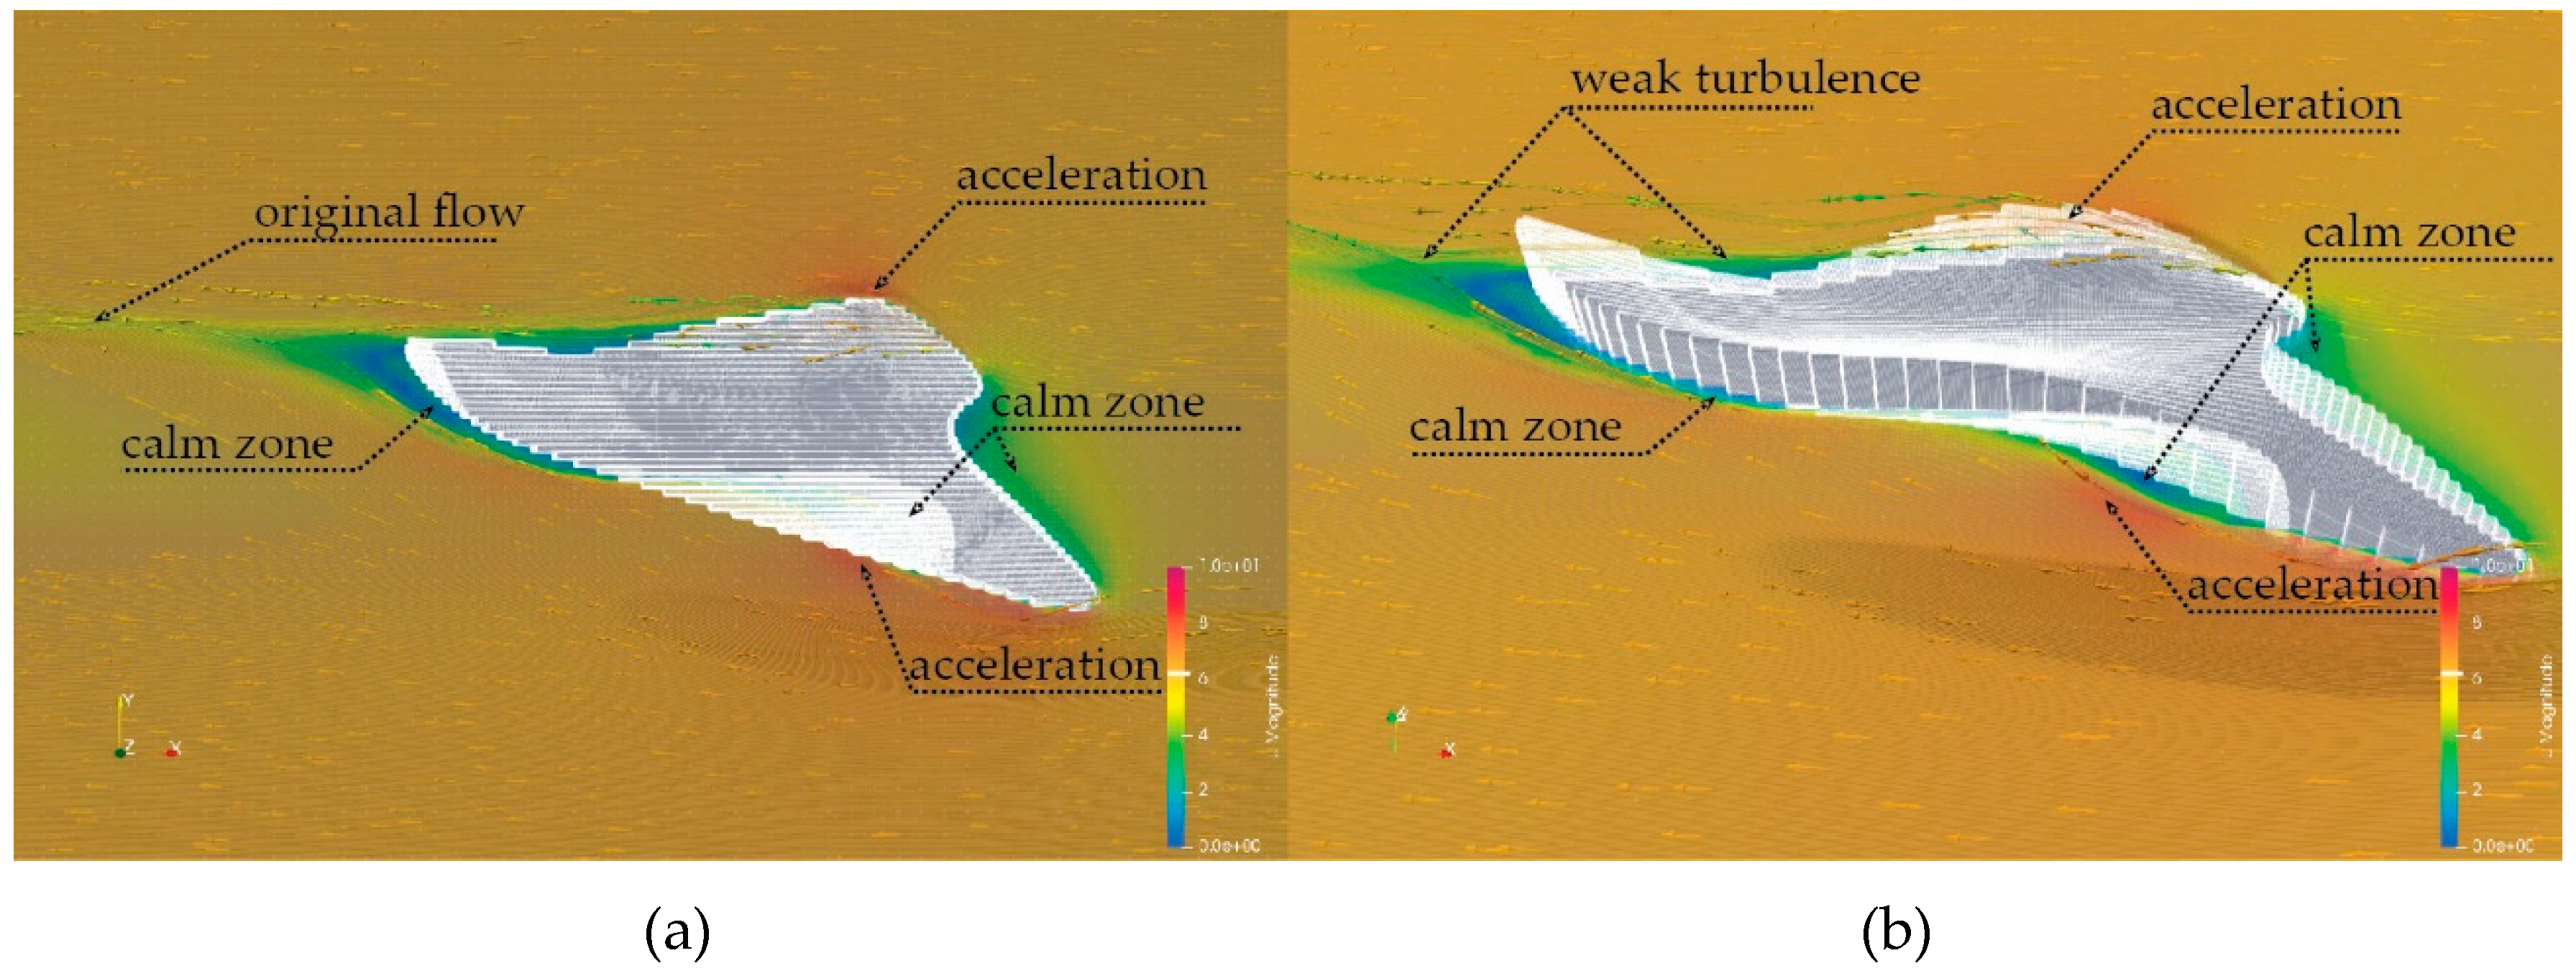
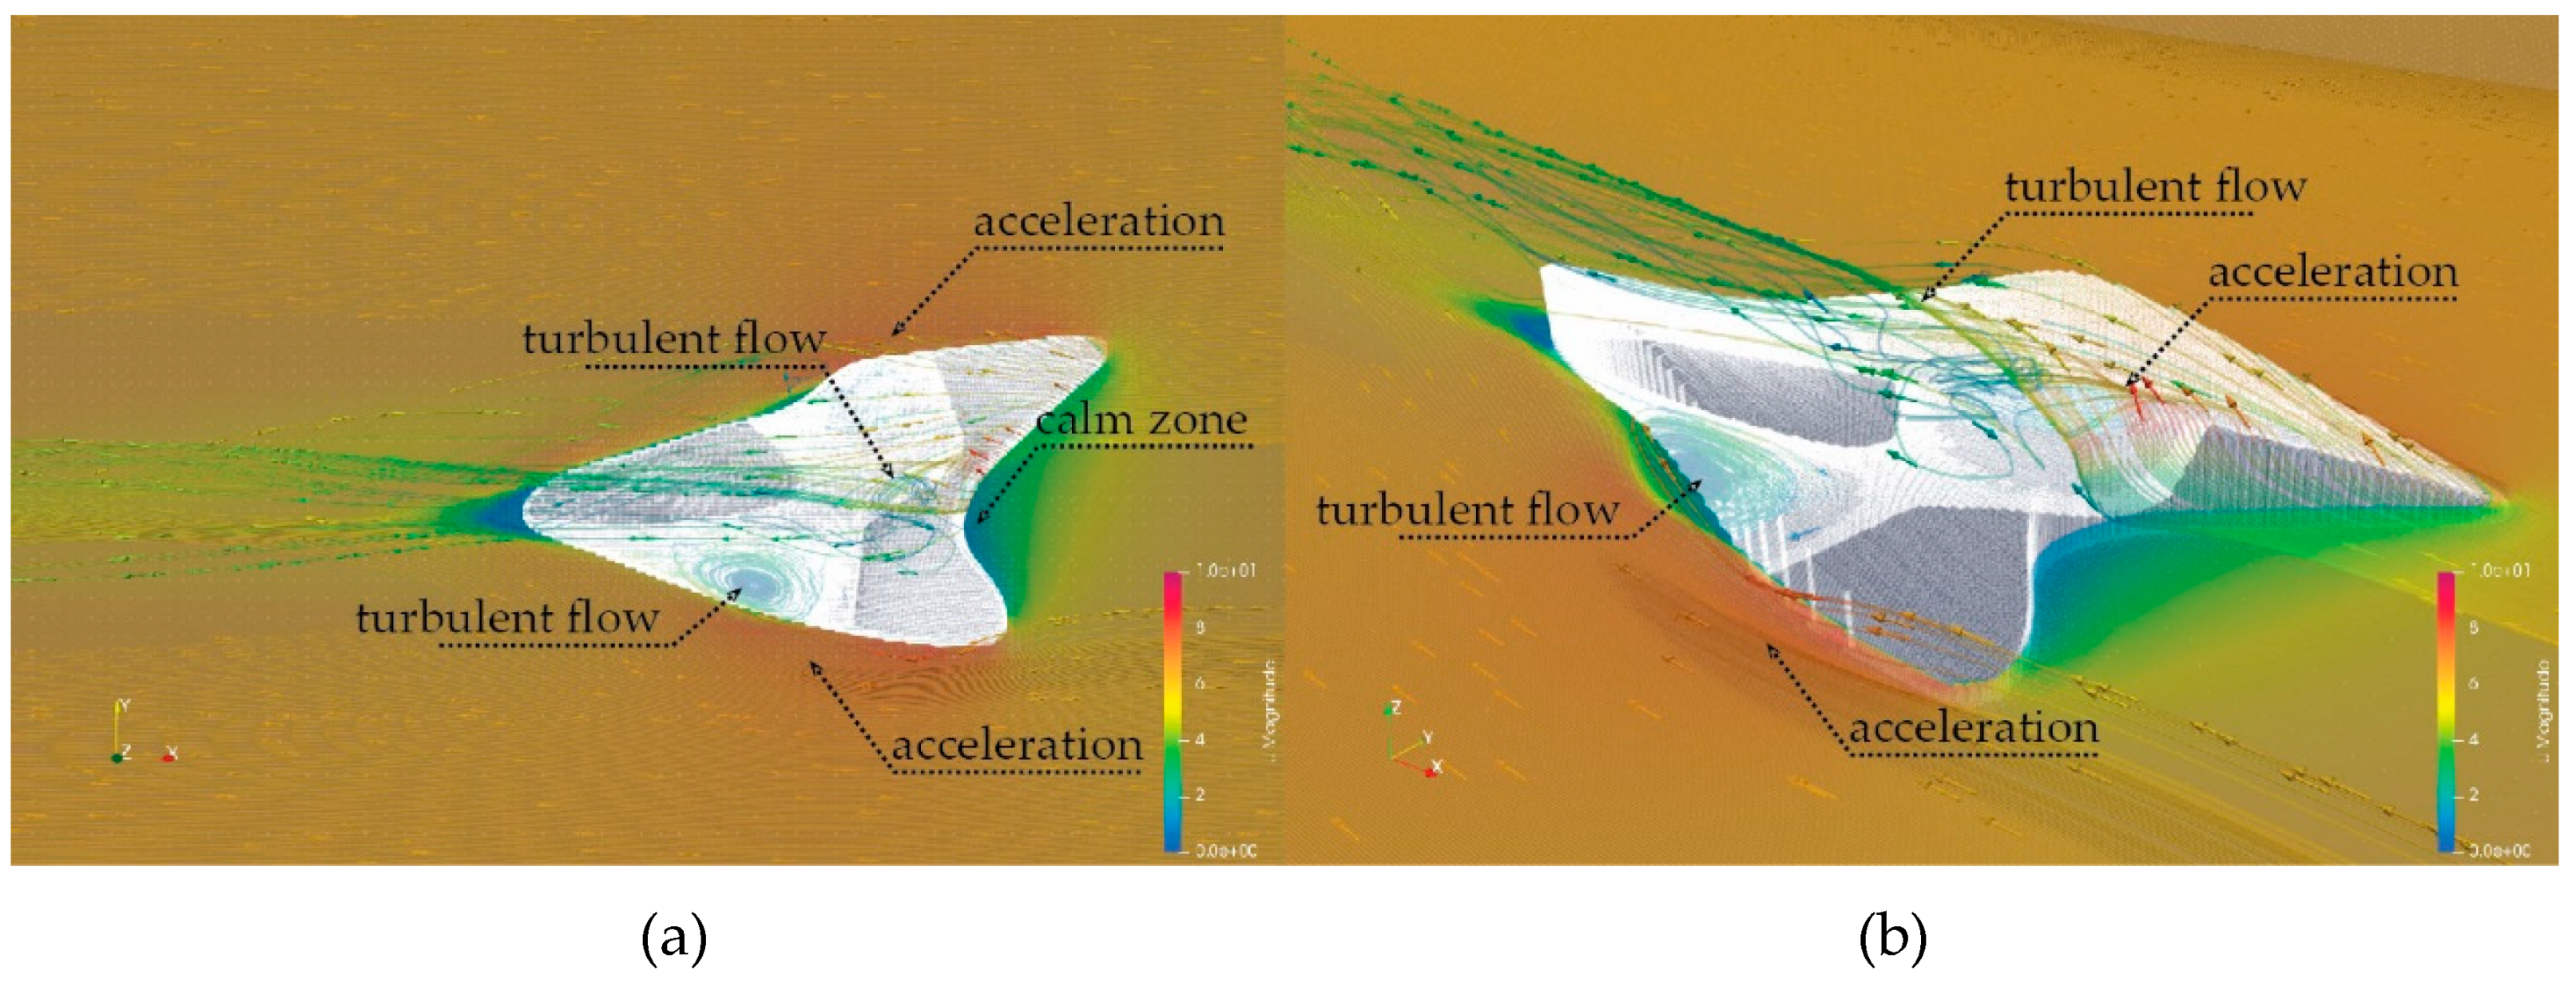
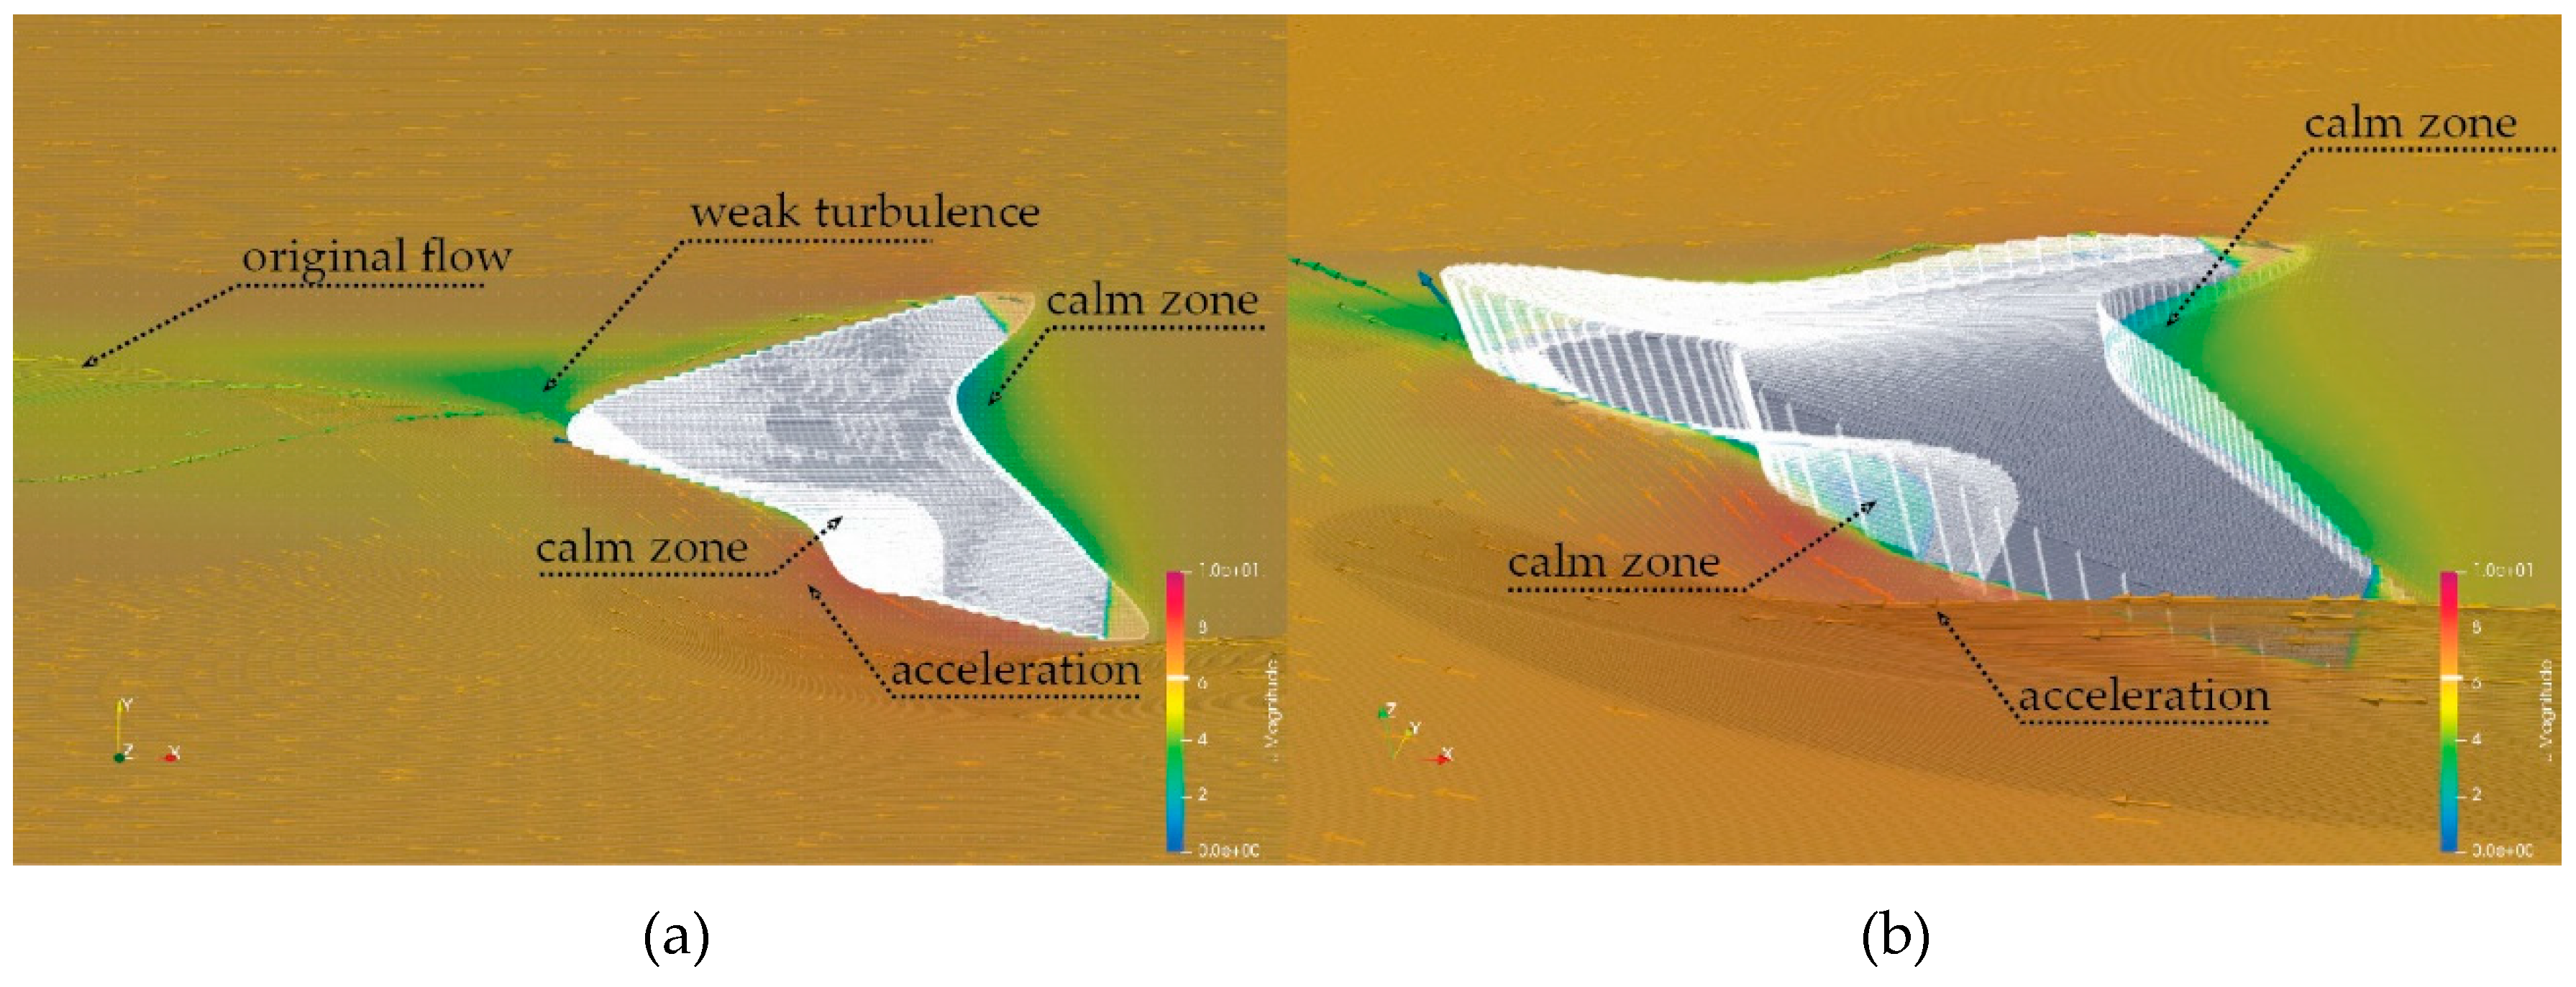
xy plane. The results of the steady-state simulations are shown in
Figure 11,
Figure 12 and
Figure 13. For a better visual comparison of the results in
Paraview, the wind velocity data range is set from 0 to 10 m/s for each case. The blue color indicates a wind speed close to zero, whereas the red color indicates the maximum wind speeds. The horizontal slice for projecting the results is made 2 meters above the ground to capture the wind situation at the pedestrian level. The 3D streamlines with wind vectors are added to get a better idea of the air movement around the shapes.
6. Discussion
Using the parametric approach, the change of selected parameters and the core geometry enables a fast change of the resulting 3D geometry. Subsequently, every new shape is referenced in the (again parametric) virtual wind tunnel, although the CFD settings and boundary conditions are kept the same for each option. The automatic meshing creates a different number of calculation cells for every option, which is around 4.4–5.4 million. Three sets of parameters create shape variants of the airport terminal building which interact with the wind flow differently. By observing and examining the CFD wind analysis results in Paraview, each shape option, being in principle a streamlined body, represents a minimum resistance to the wind flow. The shape variation number 3 is, as concluded from the obtained results, the most aerodynamic. Also, the intended sheltered open-air space facing the south is quite calm in variant 3, as well as in variant 1. The entrance area for all three shapes is relatively calm, with the wind speed ranging from 0 to around 4 m/s. The shape of variant 2 appears to be aerodynamic; however, the wind flow, influenced and transformed by the shape, turns into a turbulent flow.
6.1. Advantages of the Approach
(1) The parametric performative design enables us to verify more design options already in the conceptual design stage.
(2) The changes in the core geometry, as well as the changes in several parameters of the definition, result in the improvement of the design’s environmental performance.
(3) The architecture designed for the specific wind conditions can be digitally tested, and the crucial design decisions can be made based on the computer simulations results very early in the design process.
(4) By utilizing digital tools in the design process, the otherwise time and money-consuming wind analyses are accessible to everyone and practically free of cost in the case of open-source software.
(5) The proposed combination of Rhino, Grasshopper, Swift, and Paraview, which are all, except for Rhino, open-source digital tools that can create, generate, and test the designed geometry in one working environment.
(6) The wind-formed parametric geometry is the first step in the architectural design process. The further elaboration of the project, including the structural design, as well as the building program, can be consequentially performed in a similar, parametric manner, integrated into the original parametric definition.
6.2. Disadvantages of the Approach
(1) Only a limited number of geometries can be tested as the necessity of manually setting the parameters, especially manually changing the core geometry, requires time. As was mentioned earlier, this drawback has a solution. Genetic algorithms automatically test hundreds of options. However, the goal of the approach is not to test every possible shape within the set of parameters, but to direct the designer’s own decisions from the beginning of the design process.
(2) The results of the shape-generating or form-finding process depend on the initial parametric definition, which has to be adequately set.
(3) The approach using Swift for Grasshopper requires using Paraview as external software for the visualization of the results. This way, verifying more alternative solutions is more time-consuming.
(4) The interpretations of the CFD simulation results are made by the designer according to the observation of the wind speed and flow pattern around the designed architectural shape. To mathematically support the designer’s opinion, additional probe points can be placed at the observed locations to measure the exact wind speed at the selected location.
7. Conclusions
Parametric designing, incorporating the wind phenomenon along with the actual wind microclimate of the site, is a step towards nature-responsive architecture. Ways of connecting the artificial and the natural environment are becoming even more sought-after with the progression of global climate change. The analogy of the shaping effects of the wind in nature can be, in a figurative sense, transformed into wind-shaped architecture. Architecture created from the original idea with the wind phenomenon as the driving force in the form-finding process would be a big benefit for extremely windy areas. The paper presents a case study in Reykjavik, Iceland, where strong, cold winds are the climate’s characteristics. The digital open-source attitude to architectural design is a basis for the proposed design strategy. The use of the parametric approach in the design of the airport terminal enables the examination of various design options and their performance in wind flow. Three shape modifications of the closed planar curve, with various positions of the ‘shape-influencing’ points, create three building envelopes to demonstrate the use of the parametric approach in the wind-related design. The three aerodynamic shapes are analyzed in Reykjavik’s easterly winds using a parametrically adjustable CFD virtual wind tunnel definition. The analysis of the three observed options directs the design process towards an architectural solution that is adapted to the specific wind conditions. Including the digital CFD analysis into the architectural design in the early conceptual phase contributes to defining and predicting the effects of architecture on the wind fluxes in its vicinity. For the correct interpretation of the wind simulation results, a close observation of the wind behavior is required. Swift enables the use of points which act as probes for measuring the wind speed at the locations of interest, in case there is a need to verify the interpreted results.
The CFD results of the three tested shapes indicate that the most suitable shape for the next design steps is variation number 3. The shape performs the best according to the following requirements: (1) it has a calm entrance area, (2) a calm outdoor wind shelter and (3) minimum resistance to the wind flow, ergo minimum turbulence around the airport terminal.
The form-finding process of wind-shaped architecture presented in the paper will be further elaborated in the following research. The most suitable building’s structure will be parametrically sought after.
Author Contributions
Conceptualization, L.K., D.K. and S.K.; methodology, L.K., D.K. and S.K.; software, L.K.; validation, L.K., D.K. and S.K.; formal analysis, L.K.; investigation, L.K.; resources, L.K.; data curation, L.K.; writing—original draft preparation, L.K.; writing—review and editing, L.K., D.K. and S.K.; visualization, L.K.; supervision, D.K. and S.K.; project administration, L.K., D.K. and S.K.; funding acquisition, D.K. and S.K.
Funding
This research was funded by VEGA 1/0302/16and VEGA 1/0674/18 (Grant Agency of the Slovak Republic).
Conflicts of Interest
The authors declare no conflict of interest. The funders had no role in the design of the study; in the collection, analyses, or interpretation of data; in the writing of the manuscript, or in the decision to publish the results.
References
- Barlieb, C.; Richter, C.; Greschner, B.; Tamke, M. Whispering Wind: Digital Practice and the Sustainable Agenda. In Computation: The New Realm of Architectural Design, Proceedings of the 27th eCAADe Conference, Istanbul, Turkey, 2009; Çağdaş, G., Colakoglu, B., Eds.; Istanbul Technical University: Sarıyer, Turkey, 2009; pp. 543–550. [Google Scholar]
- IPCC. Climate Change 2014: Synthesis Report. Contribution of Working Groups I, II and III to the Fifth Assessment Report of the Intergovernmental Panel on Climate Change; Core Writing Team, Pachauri, R.K., Meyer, L.A., Eds.; IPCC: Geneva, Switzerland, 2014; 151p, ISBN 978-92-9169-143-2. [Google Scholar]
- Bassolino, E.; Ambrosini, L. Parametric environmental climate-adaptive design: The role of data design to control urban regeneration project of BorgoAntignano, Naples. Proc. Soc. Behv. Sci. 2015, 216, 948–959. [Google Scholar] [CrossRef]
- Kuenstle, M.W. Flow structure environment simulation: A comparative analysis of wind flow phenomena and building structure interaction. In Connecting the Real and the Virtual: Design e-Ducation, Proceedings of the 20th eCAADe Conference, Warsaw, Poland, 2002; Koszewski, K., Wrona, S., Eds.; Warsaw University of Technology: Warsaw, Poland, 2002; pp. 564–568. [Google Scholar]
- Kuismanen, K. Climate—Conscious Architecture: Design and Wind Testing Method for Climates in Change. Ph.D. Thesis, University of Oulu, Oulu, Finland, 28 November 2008. [Google Scholar]
- Snow, M.; Prasad, D. Climate Change Adaptation for Building Designers: An Introduction, Environment Design Guide 66 MSa. 2011. Available online: Environmentdesignguide.com.au (accessed on 23 October 2018).
- Kerestes, J.F. Design out of necessity: Architectural approach to extreme climatic conditions. In Design in Freedom, Proceedings of the 18th SIGRADI Conference, Montevideo, Uruguay, 2014; Blucher: Sao Paulo, Brazil, 2014; pp. 130–133. [Google Scholar]
- Kormaníková, L.; Achten, H.; Kopřiva, M.; Kmeť, S. Parametric wind design. Front. Archit. Res. 2018, 7, 383–394. [Google Scholar] [CrossRef]
- Muhsin, F.; Yusoff, W.F.M.; Mohamed, M.F.; Sapian, A.R. The Effects of Void on Natural Ventilation Performance in Multi-Storey Housing. Buildings 2016, 6, 35. [Google Scholar] [CrossRef]
- Kaushik, V.; Janssen, P. Urban Windflow: Investigating the use of animation software for simulating windflow around buildings. In Real Time: Extending the Reach of Computation, Proceedings of the 33rd eCAADe Conference, Vienna, Austria, 2015; Martens, B., Wurzer, G., Grasl, T., Lorenz, W.E., Schaffranek, R., Eds.; Vienna University of Technology: Vienna, Austria, 2015; pp. 225–234. [Google Scholar]
- Kim, H.-J.; Kim, J.-S. Design Methodology for Street-Oriented Block Housing Considering Daylight and Natural Ventilation. Sustainability 2018, 10, 3154. [Google Scholar] [CrossRef]
- Erhan, H.; Wang, I.; Shireen, N. Interacting with thousands: A parametric-space exploration method in generative design. In Design Agency, Proceedings of 34th ACADIA Conference, Los Angeles, California, 2014; Huang, A., Sanchez, J., Gerber, D., Eds.; ACADIA/Riverside Architectural Press: Toronto, ON, Canada, 2015; pp. 619–625. [Google Scholar]
- Wang, L.; Tan, Z.; Ji, G. Toward the wind-related building performative design: A wind-related building performance optimization design system integrating Fluent and Rhinoceros based on iSIGHT. In Living Systems and Micro-Utopias: Towards Continuous Designing, Proceedings of the 21st CAADRIA Conference, Melbourne, Australia, 2016; The University of Melbourne: Melbourne, Australia, 2016; pp. 209–218. [Google Scholar]
- Mooneghi, M.A.; Kargarmoakhar, R. Aerodynamic Mitigation and Shape Optimization of Buildings: Review. J. Build. Eng. 2016, 6, 225–235. [Google Scholar] [CrossRef]
- Grobman, Y.J.; Yezioro, A.; Capeluto, I.G. Computer-based form generation in architectural design—A critical review. Int. J. Archit. Comput. 2009, 7, 535–553. [Google Scholar] [CrossRef]
- Chronis, A.; Dubor, A.; Cabay, E.; Roudsari, M.S. Integration of CFD in computational design. In ShoCK!, Proceedings of the 35th eCAADe Conference, Roma, Italy, 2017; Fioravanti, A., Cursi, S., Elahmar, S., Loffreda, S.G.G., Novembri, G., Trento, A., Eds.; Sapienza University of Rome: Rome, Italy, 2017; pp. 601–610. [Google Scholar]
- Malkawi, A.M.; Srinivasan, R.S.; Yi, Y.K.; Choudhary, R. Decision support and design evolution: Integrating genetic algorithms, CFD and visualization. Autom. Constr. 2005, 14, 33–44. [Google Scholar] [CrossRef]
- Cóstola, D.; Blocken, B.; Hensen, J.L.M. Overview of pressure coefficient data in building energy simulation and airflow network programs. Build. Environ. 2009, 44, 2027–2036. [Google Scholar] [CrossRef] [Green Version]
- Alexander, D.K.; Jenkins, H.G.; Jones, P.J. A comparison of wind tunnel and CFD methods applied to natural ventilation design. In Proceedings of the Building Simulation IBPSA Conference, Prague, Czech Republic, 8–10 September 1997; pp. 1–7. [Google Scholar]
- Moukalled, F.; Mangani, L.; Darwish, M. The Finite Volume Method in Computational Fluid Dynamics: An Advanced Introduction with OpenFOAM and Matlab; Springer International Publishing: Basel, Switzerland, 2016. [Google Scholar]
- Tsou, J.Y. Applying computational fluid dynamics to architectural design development. In Proceedings of the 3rd Conference on Computer Aided Architectural Design Research in Asia, CAADRIA, Osaka, Japan, 22–24 April 1998; pp. 133–142. [Google Scholar]
- Kuenstle, M.W. Computational Flow Dynamic Applications in Wind Engineering for the Design of Building Structures in Wind Hazard Prone Urban Areas. In Proceedings of the 5th SIGradi Conference, Concepcion, Chile, 21–23 November 2001; pp. 67–70. [Google Scholar]
- Donohue, K. Saga of Two Icelandic Airports. Airways. 2016, pp. 37–42. Available online: http://www.kendonohue.com/articles/AW249_AirportReview.pdf (accessed on 16 December 2018).
- CCI—Reanalyzer. Climate Change Institute, University of Maine, USA: Monthly Reanalysis Maps. Available online: http://ccireanalyzer.org/reanalysis/monthly_maps/index.php (accessed on 24 September 2018).
- EnergyPlus. Weather Data by Region. Available online: https://energyplus.net/weather-region/europe_wmo_region_6 (accessed on 18 December 2018).
- ISAVIA. Monthly Report Traffic Statistics/Summary. Available online: https://www.isavia.is/media/1/11-2018-tolur-fyrir-vefsiduna.pdf (accessed on 6 December 2018).
- Reykjavík Weather Statistics. Available online: www.vedur.is/Medaltalstoflur-txt/Stod_001_Reykjavik.ArsMedal.txt (accessed on 12 October 2018).
- Stathopoulos, T. Wind and comfort. In Proceedings of the 5th European & African Conference on Wind Engineering—EACWE, Florence, Italy, 19–23 July 2009; pp. 1–16. [Google Scholar]
- Neufert, E. Navrhování Staveb, 2nd ed.; ConsultinvestInterna: Praha, Česká republika, 2000; ISBN 8090148662. [Google Scholar]
- OpenFOAM: The Open Source CFD Toolbox. Available online: https://www.openfoam.com/documentation/user-guide/ (accessed on 3 February 2018).
- Paul, R.; Dalui, S.K. Wind effects on ‘Z’ plan-shaped tall building: A case study. Int. J. Adv. Struct. Eng. 2016, 8, 319–335. [Google Scholar] [CrossRef]
© 2019 by the authors. Licensee MDPI, Basel, Switzerland. This article is an open access article distributed under the terms and conditions of the Creative Commons Attribution (CC BY) license (http://creativecommons.org/licenses/by/4.0/).


