1. Introduction
There are numerous uncertainties in the process of obtaining earthquake loss scenarios which are mainly related to either the seismic source or the building inventory [
1]. Several methods have provided credible results while taking into account these uncertainties, such as performance-based methods and reliability-based design approaches [
2,
3,
4]. Concerning the source location, earthquake scenarios can rarely be associated with certainty to the rupture of well-identified faults, since in the past, numerous destructive earthquakes occurred on blind faults or on offshore faults. In case the source location is uncertain, a probabilistic scenario may arguably be preferable to a deterministic one [
5]. Still, if the site location is near a seismic source, first order rupture effects on ground motion are expected, which are difficult to assess in probabilistic hazards analysis. The second obstacle is the difficulty of categorizing the built environment into well-defined typologies and construction periods. Sometimes, renovations and post-earthquake reinforcements get in the way of properly characterizing the structural nature of the buildings, and thus properly estimating their seismic vulnerability on a large scale [
1].
In case of this study, numerous challenges including the aforementioned problems are present in Imzouren. The city is located in the Al Hoceima region, which is the most seismically active zone in Morocco [
6,
7,
8]. In ten years period, the region was struck by two destructive earthquakes; the first one in 26 May 1994 of magnitude 5.9 mw and the second and strongest one in 24 February 2004 of magnitude 6.4 mw [
9]. Both were shallow earthquakes (depth < 15 km), but they didn’t cause a surface rupture of a clear tectonic origin even though the observed cracks in the region back in 2004 were interpreted as such [
10]. The identification of the responsible faults for these earthquakes was very problematic; especially since the assumed location of the epicenter had evolved over time [
7,
11,
12,
13,
14,
15,
16,
17,
18]. Imzouren suffered the greatest damage in the aftermath of the 2004 earthquake that struck the region, while Al Hoceima experienced significantly less damage, even though the two cities are equally distant from the seismic source. Many believe that the damage difference is due to the bad design of the structures and the position of Imzouren in a soil field [
9,
18,
19], which amplified the ground shaking.
Regarding the buildings, they are mostly reinforced concrete moment frame structures with masonry infill walls, mainly because the city was founded in the second half of the 20th century. One of the main problems that the built environment suffers from is a lack of supervision during the construction period of the buildings. In fact, many owners live abroad (Europe) and have their dwellings constructed without inspection and without any respect to the seismic standard in the region. Additionally, since many earthquakes have struck the city in the recent past (1994, 2004), there have been reconstructions and reinforcements of the damaged and affected buildings, which makes the estimation of the seismic vulnerability difficult.
Imzouren (35°09′ N, 3°52′ W) is located in the province of Al Hoceima on the northern coast of Morocco. Almost as important as Al Hoceima, Imzouren has different structural characteristics. It stretches along 3 km of the left margin of the Oued Nekkor and occupies part of the recent alluvial plain and oldest terraces formed by conglomerates and sandstones of the Pliocene age [
19]. The 2004 population census for the province of Al Hoceima reported that Imzouren counts 26,474 inhabitants, 5147 residential buildings and an average of 5 inhabitants per dwelling [
20]. As recently as the 1990s, constructive measures (BAEL 91 and PS92) [
21,
22] were introduced to protect buildings in the Rif region; the national seismic standard R.P.S. 2000 [
23] came afterwards to set the essential seismic codes in the country [
24]. According to the current Moroccan seismic code, the acceleration has a value of 0.18 g for an exceedance probability of 10% in a return period of 50 years [
25].
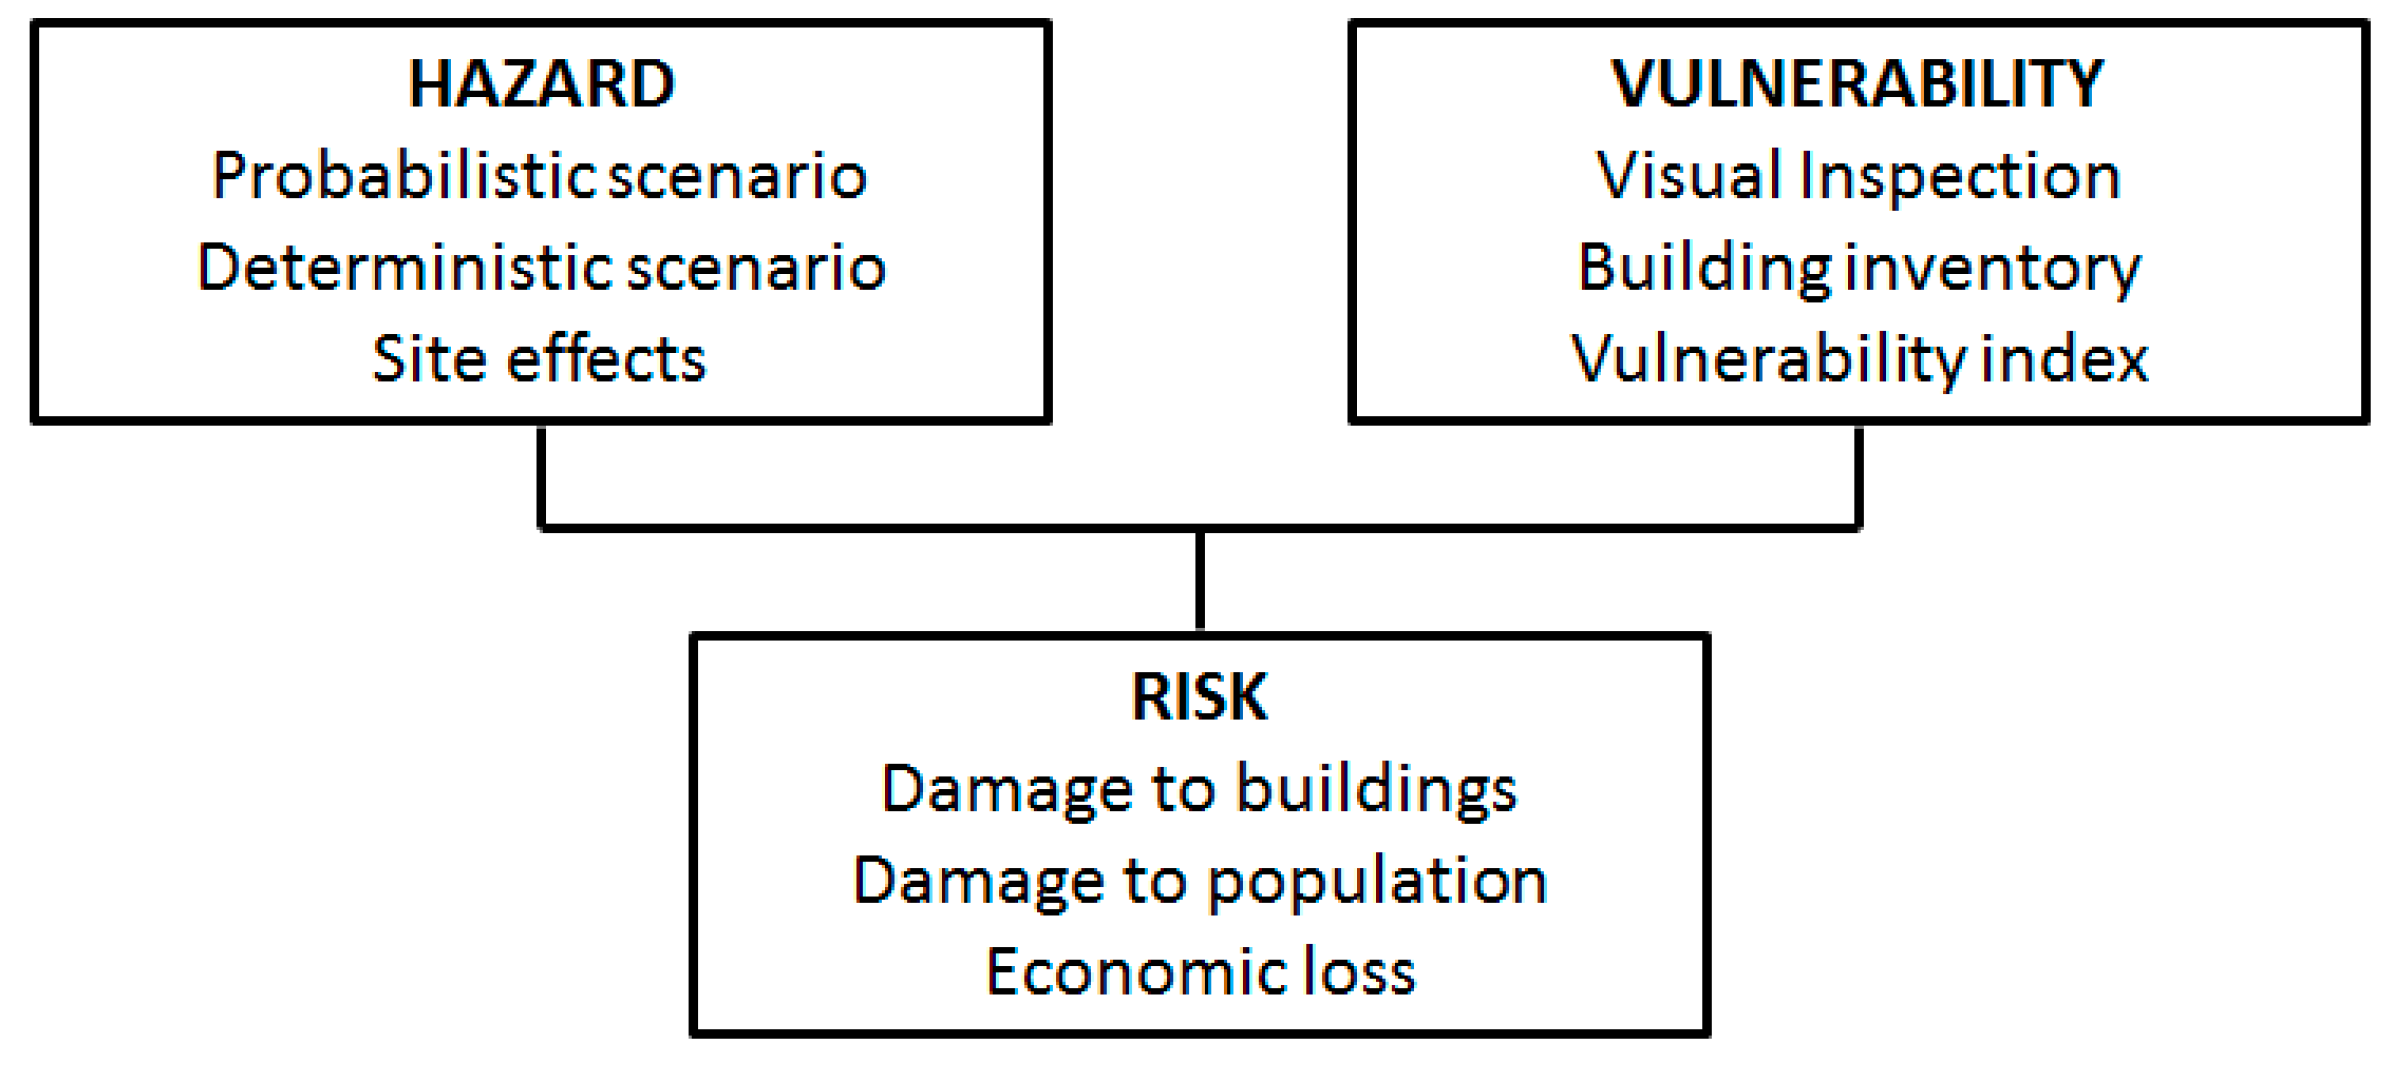
The flow chart in
Figure 1 shows an overview of the methodology applied in this paper. Seismic hazard assessment was evaluated in terms of macroseismic intensity, where probabilistic and deterministic scenarios were carried out. Site effects have also been considered in this study since Imzouren is formed on soft sediment, and were given incremental values added to the macroseismic intensity for both scenarios. The seismic vulnerability of the built environment was evaluated in terms of a Vulnerability Index Method (VIM) adapted and applied to the regional building characteristics. The seismic risk is represented by direct damage to the buildings, damage to population and economic loss. Ideally, earthquake loss models should include all possible induced phenomena from earthquakes: landslides, liquefaction, surface fault rupture, and tsunamis. However, strong ground motion is often the only hazard considered in loss assessment methods. It is commonly an acceptable approach because as the size of the loss model increases, the relative influence of the secondary hazards such as liquefaction and landslides decreases [
26]. Harm to the population is defined in terms of casualties and people needing to be relocated (homeless), while economic loss is calculated based on reconstruction costs. All of these aspects are directly related to the direct damage on buildings.
The vast amount of building inventory data made the use of a Geographical Information System necessary for this study. Furthermore, the GIS-generated damage distribution maps also have the advantage of being easily understood and used by city planners and risk managers.
3. Description and Classification of Imzouren Building Inventory
Imzouren is a new city where residential buildings are mostly low-rise reinforced concrete moment frame structures. According to the 2004 census [
20] the modern Moroccan house is the predominant type, constituting 94% of total dwellings (
Table 1). It is a city where the money from emigration to Europe was recently invested in multiple buildings of 3, 4 or 5 floors [
19], and this is indicated in the results of the same census, where more than 30% of the dwellings are either vacant or seasonal (
Table 2). Most of the buildings have simple geometrical shapes with small construction areas ranging from 100 m
2 to 150 m
2 (
Figure 4).
For the purposes of this study, the city was subdivided into multiple sections representing 11 districts (
Table 3). Each section is represented by a number of studied buildings that characterize the structural nature and the geometry of the residential buildings in the area. The investigation targeted buildings in the whole city, where geometrical features were inspected; from number of floors to irregularities and maintenance. A total of 3077 residential buildings spread throughout the city were the object of this study (
Figure 5), which represents approximately 60% of the total number of residential buildings. It is also of interest to comment on the number of reinforcements and reconstructions that has been seen throughout the investigation, especially in the southern part of the city, where the damage caused by the 2004 earthquake was more important (
Figure 5). However, the reinforcements aren’t applied in the most efficient way; it mostly consists of additional steel bars to the first floor columns.
During the investigation, several obstacles were encountered, which will inevitably induce uncertainties in the results. Among the problems encountered, there were poor construction procedures, usually due to the lack of supervision and control on site, especially the linking of structural elements and the quality of construction materials, which can be very difficult to trace during the visual inspection. Also, the buildings share structural and architectural similarities, which is why it has proved difficult to characterize them individually. The code level was introduced in order to assess the seismic vulnerability of buildings more efficiently.
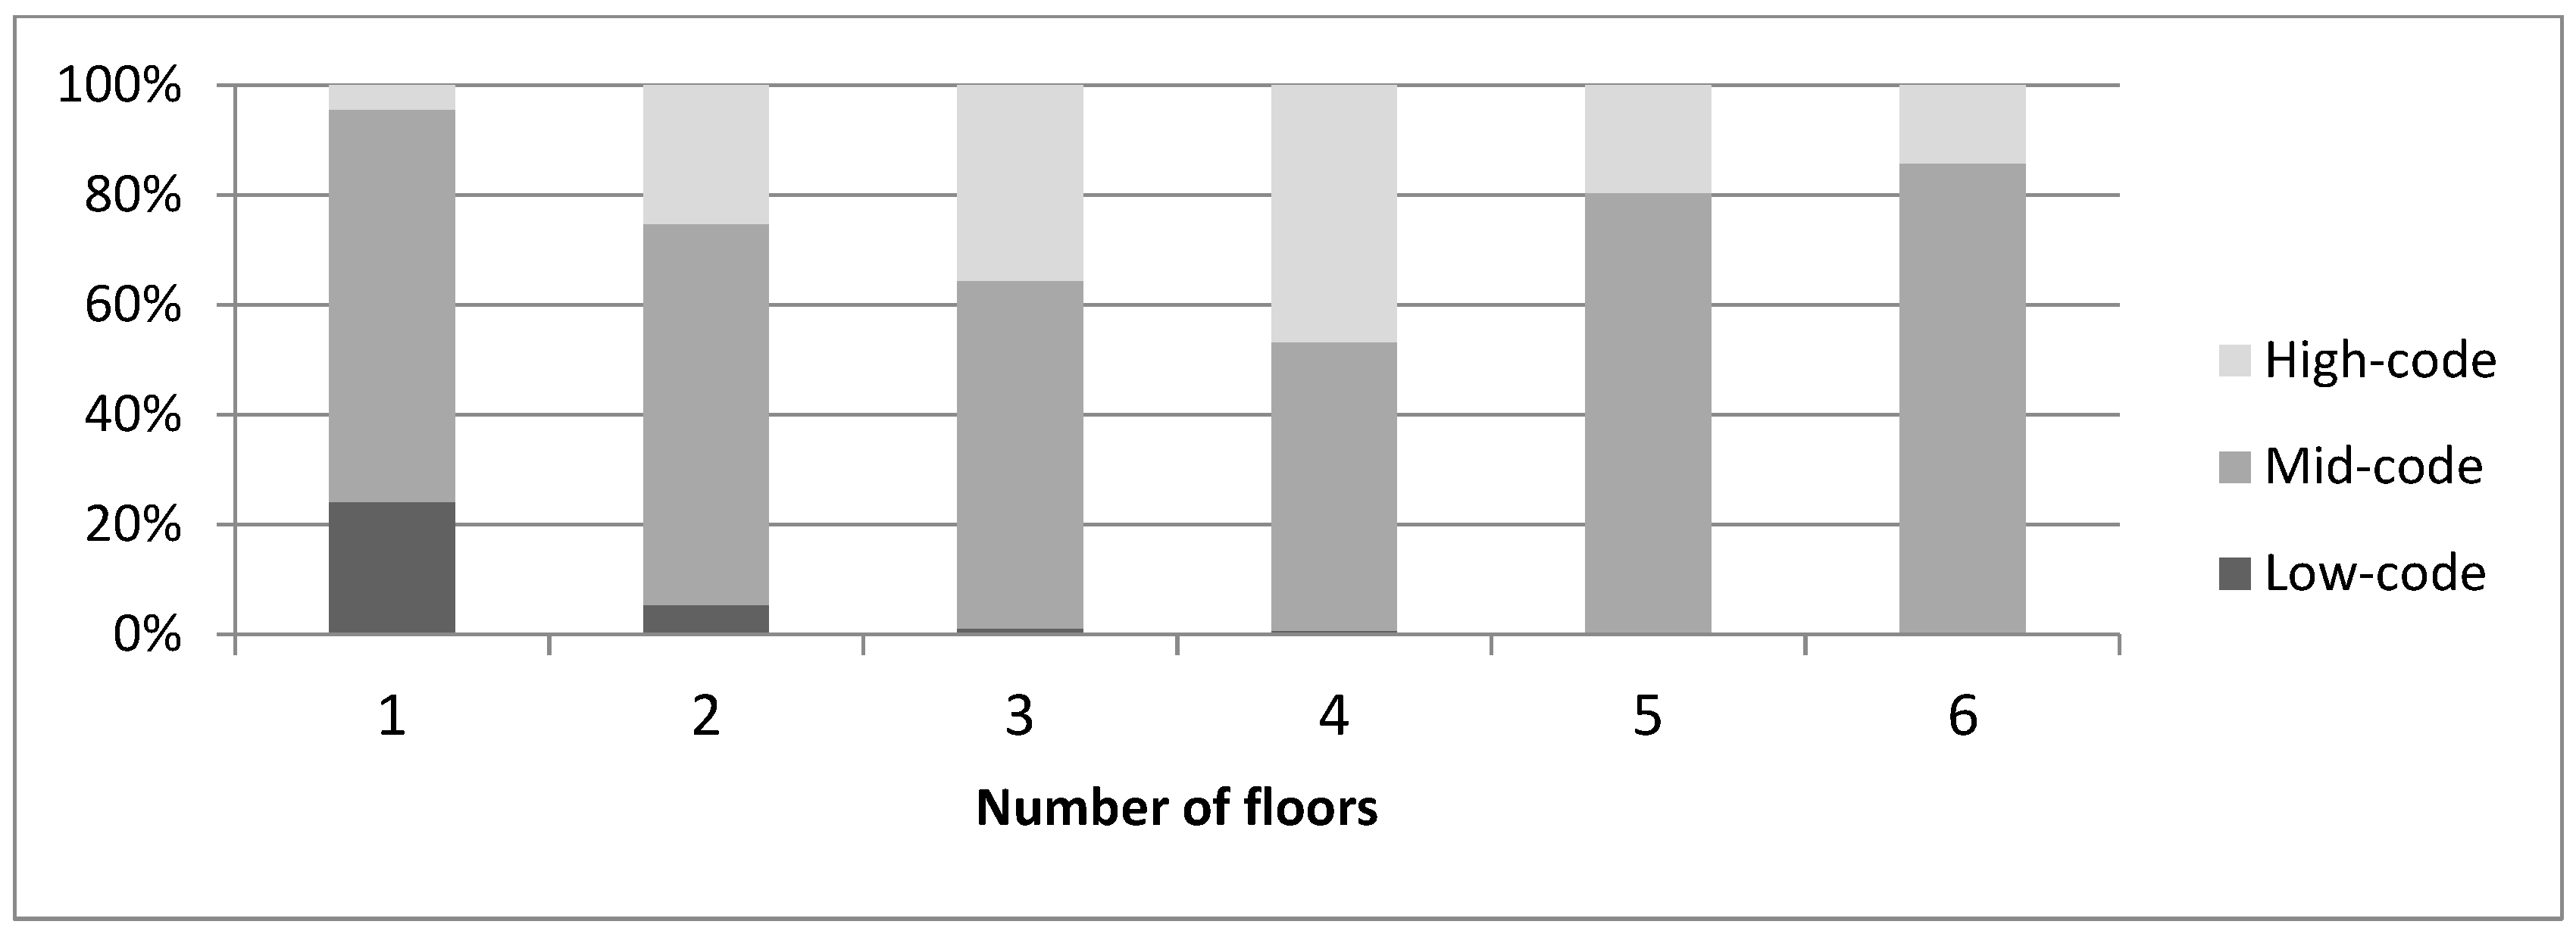
Three code levels were defined for residential buildings in Imzouren (
Table 3), depending on the construction period; before 1960, between 1960 and 1994 and after 1994. The 2 events (1960, 1994) are very important in the seismic history of Morocco, given the fact that they represent a substantial change in construction habits, especially in the region of Al Hoceima [
24]:
The 1960 event: Agadir was struck by one of the most destructive earthquakes in the 20th century [
32] on 29 February 1960, causing more than 12,000 fatalities. A first seismic standard resulted from the studies and investigations in site, named “Agadir Standard”. Without a proper seismic code, the Moroccan construction has been greatly affected by this standard.
The 1994 event: A violent earthquake (
) struck the region of Al Hoceima, causing casualties and extensive damage [
28,
33]. Constructive measures have been taken post-earthquake to protect and reinforce buildings in the Rif region, based on the PS92 [
22] and BAEL 91 [
21]. These decisions were applied after 1994 in Al Hoceima, Imzouren and surrounding towns and, subsequently, contributed to developing the first national seismic code known as R.P.S. 2000 [
23].
The distribution of the existing buildings according to number of stories and code level is shown in
Figure 6, where most low-code constructions are only one or two-story buildings.
4. Seismic Vulnerability using the Vulnerability Index Method
The “Vulnerability Index Method” [
34,
35] has been widely used in Italy during the last decades. This method is considered “indirect” because the relationship between the seismic action and the seismic response is established by a “vulnerability index”. The method uses a field survey form to gather information about the parameters of the buildings that might influence their vulnerability. The data on registered earthquakes is used to calibrate and adjust the vulnerability functions to link the vulnerability index (VI) to the main damage factor (d) for a specific seismic intensity or PGA.
RISK-UE (An Advanced Approach to Earthquake Risk Scenarios with Application to Different European Towns) was an important research project funded by the European Commission. Seven cities (Barcelona, Bitola, Bucharest, Catania, Nice, Sofia and Thessaloniki) were involved in this project, whose main objective was to develop a general methodology for assessing seismic risk in European cities [
36,
37,
38,
39]. The Vulnerability Index Method was chosen as one of the vulnerability assessment procedures that have been successfully developed and applied to all the cities mentioned above.
The main advantage of the “Vulnerability Index” methods is that they can determine the vulnerability characteristics of each building, rather than defining the vulnerability based only on the typology. However, the method requires expert judgment since the coefficients and weights applied in calculating the vulnerability index have a degree of uncertainty that is not taken into account. In addition, the calculation of the vulnerability index for a large building stock would be very time consuming, if such data is not already available [
40].
The Vulnerability Index Method applied in the RISK-UE project was used for the purposes of this study. This method provides a typological classification system [
41], to group structures with the same seismic performance
and then adds the
behavior modifiers specific to each building, to calculate a total vulnerability index
for each building, using the following Equation [
37]:
where
is a regional modifier which takes into account the characteristics of the region or the building period. The total vulnerability index
takes values ranging from 0 (least vulnerable building) to 1 (most vulnerable building).
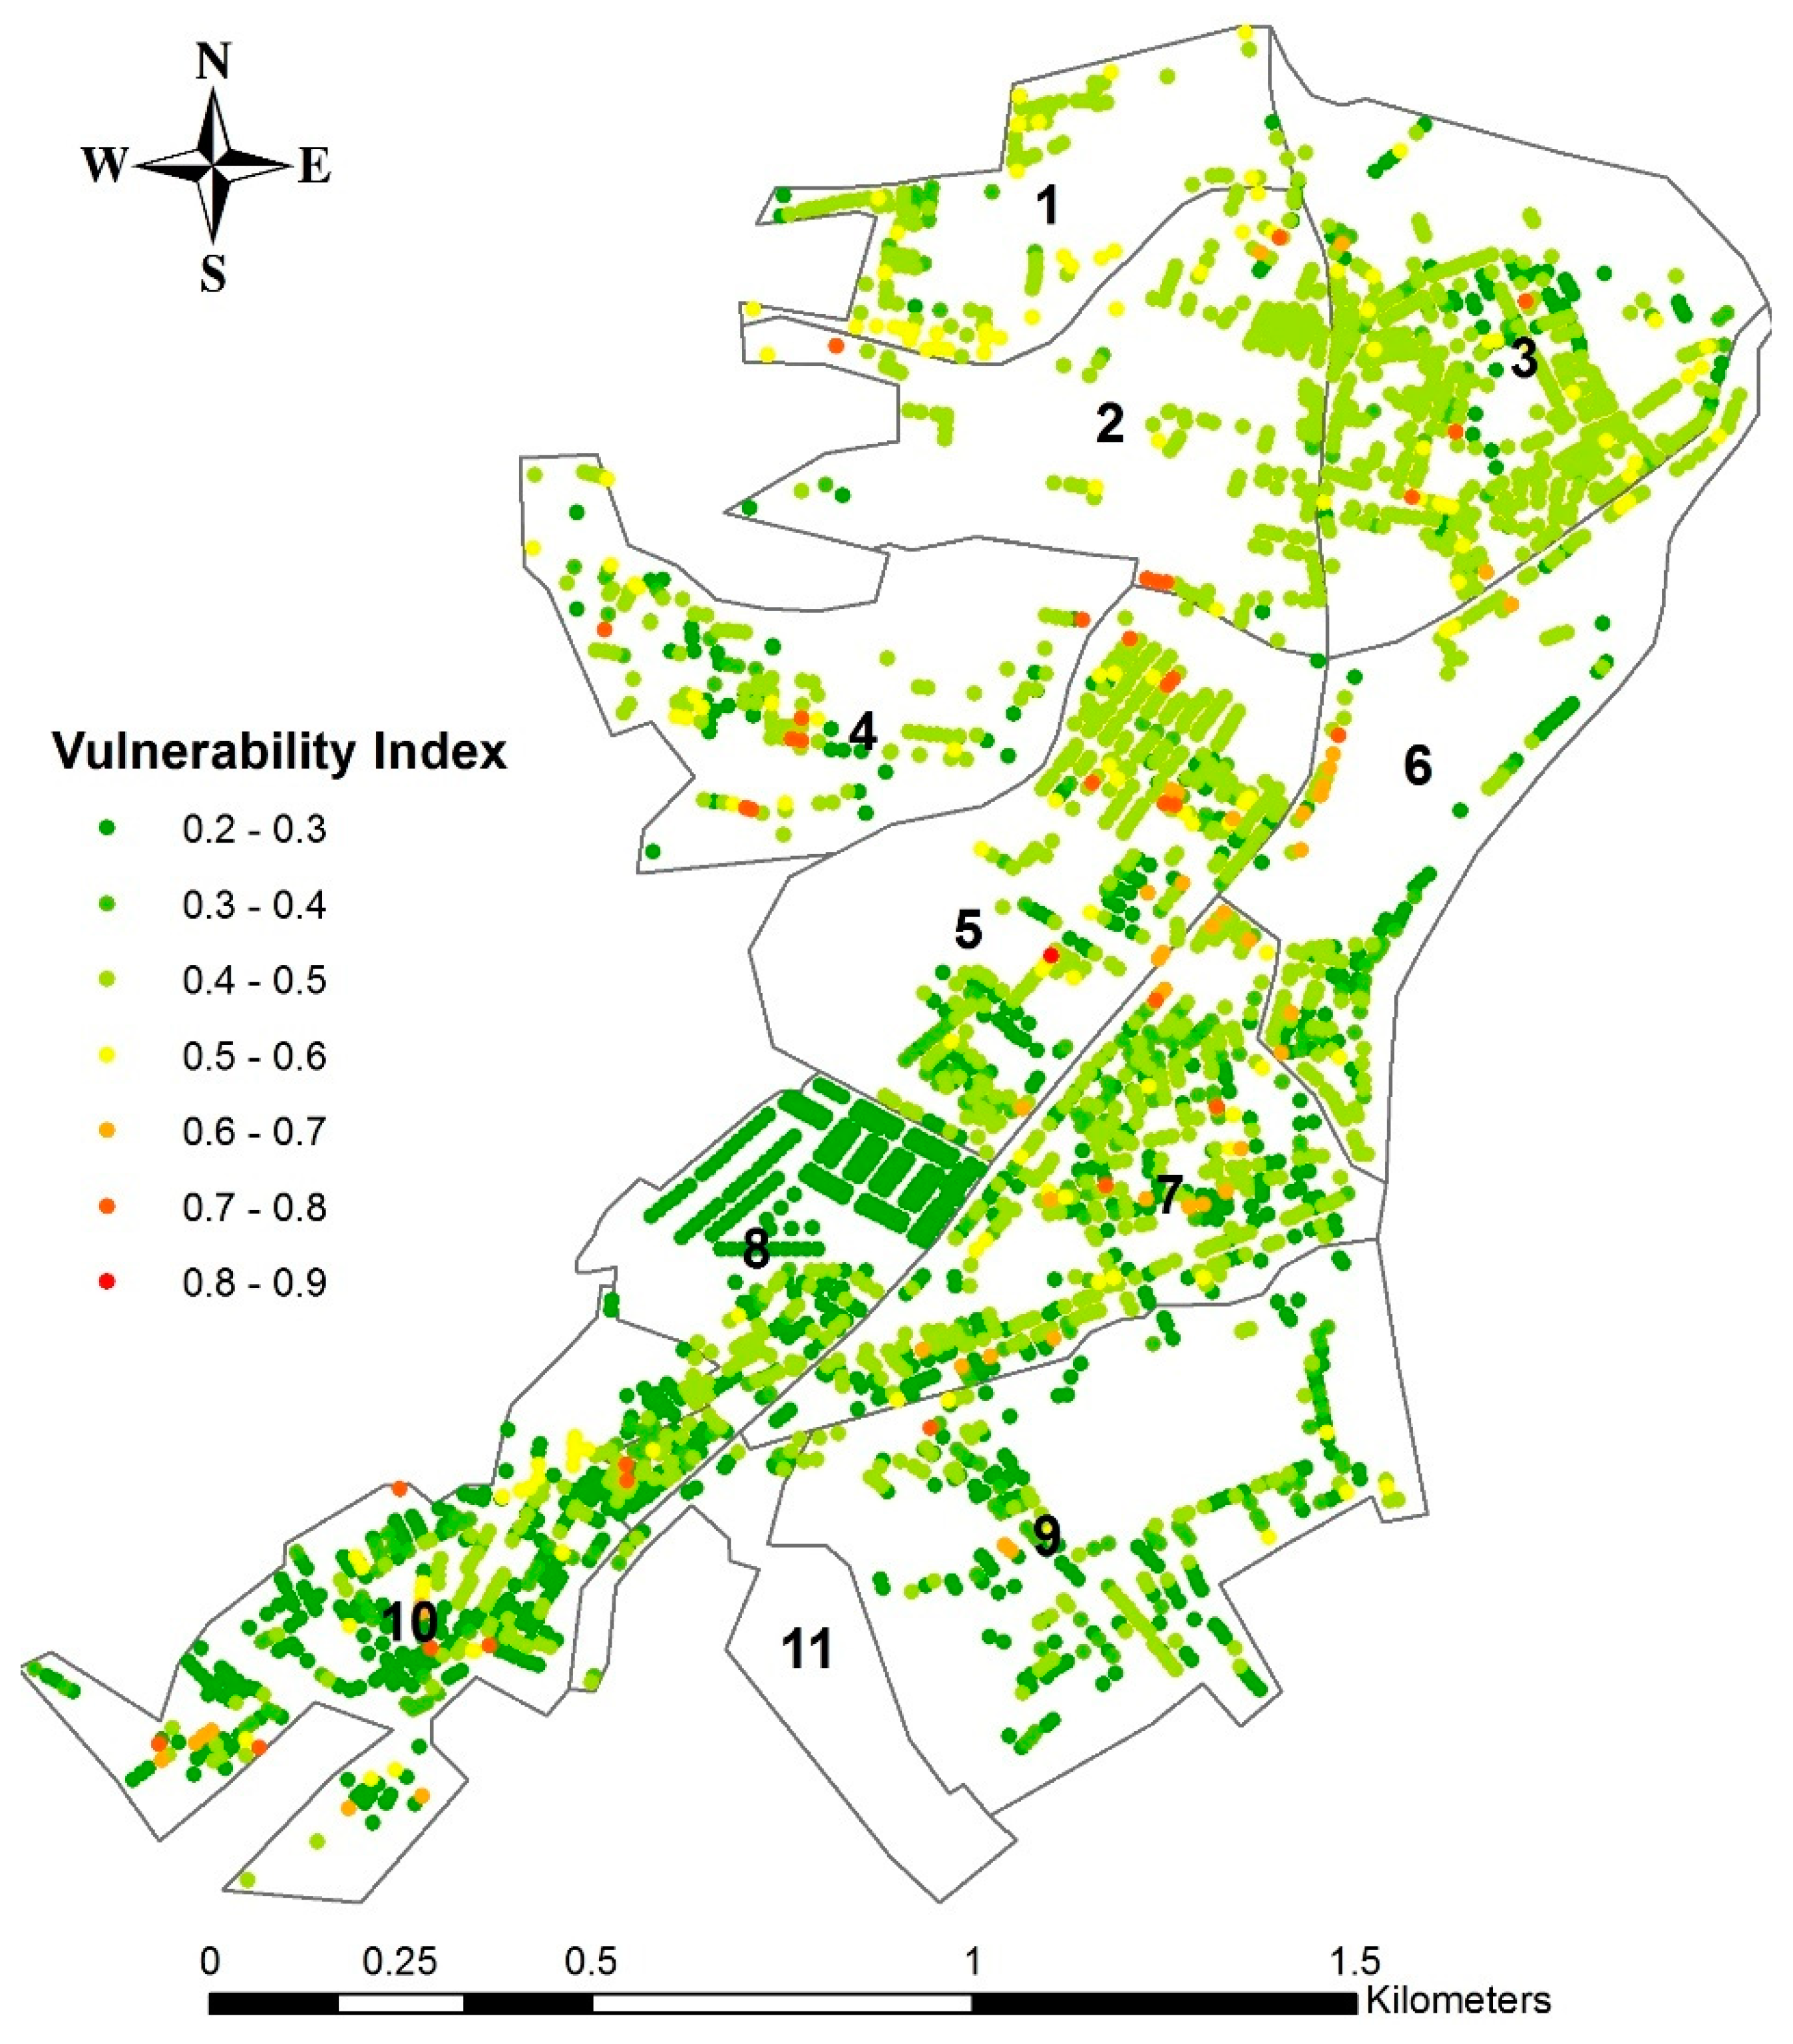
The method was adapted to the Moroccan features of the buildings [
24] and applied to the studied buildings in Imzouren. The results show that the vulnerability index takes values ranging from 0.2 to 0.86, with an average value of 0.38 (
Figure 7). The city has a low vulnerability, as can be seen from
Table 4. The mean vulnerability indices for the different districts have values ranging between 0.31 and 0.44. This could be related to the reconstructions and reinforcements of the buildings that are accounted for since the 2004 earthquake. However, the existence of a minority of buildings can’t be overlooked (7.5% of the total number of the studied structures) having a vulnerability index greater than 0.5 (
Figure 7) and can be exposed to the collapse in case of an earthquake. The results correlate well with the 2004 census, where 4.7% of the households are below the relative poverty line and 7.6% are below the vulnerability threshold [
20].
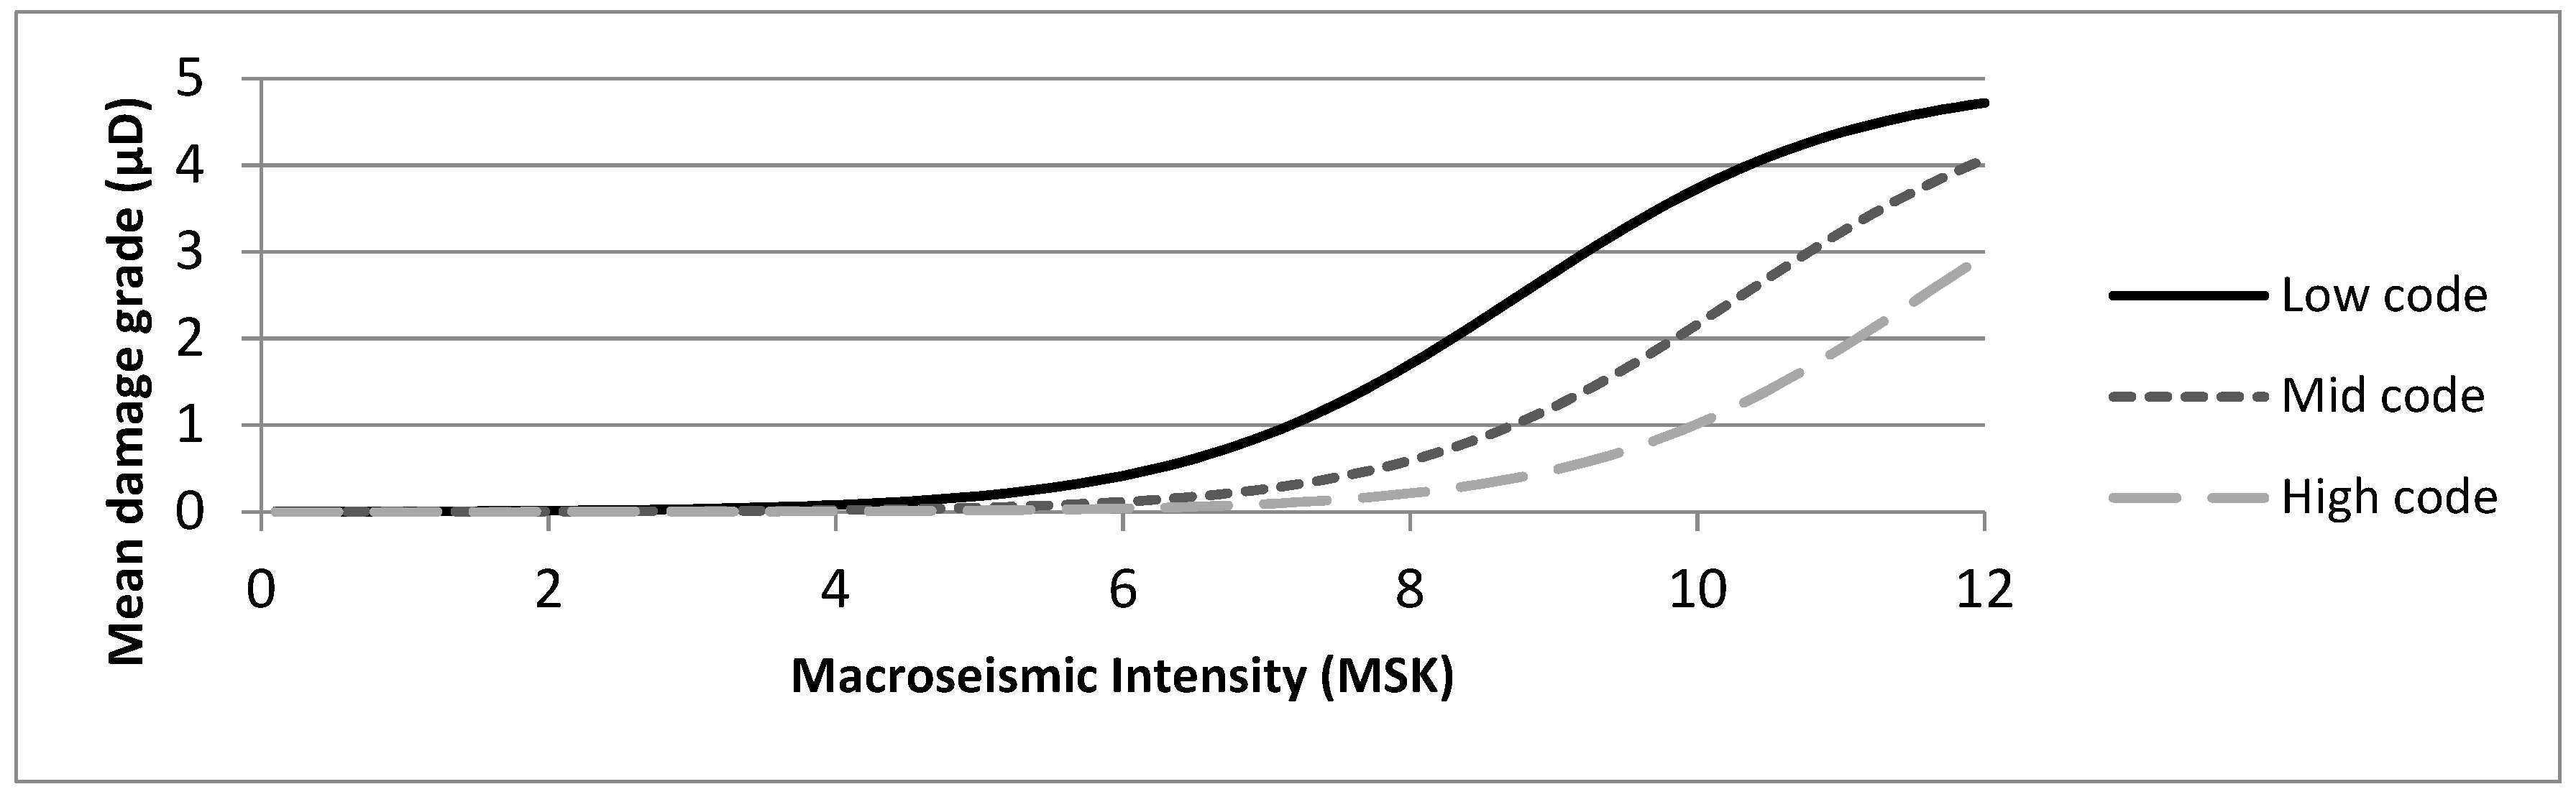
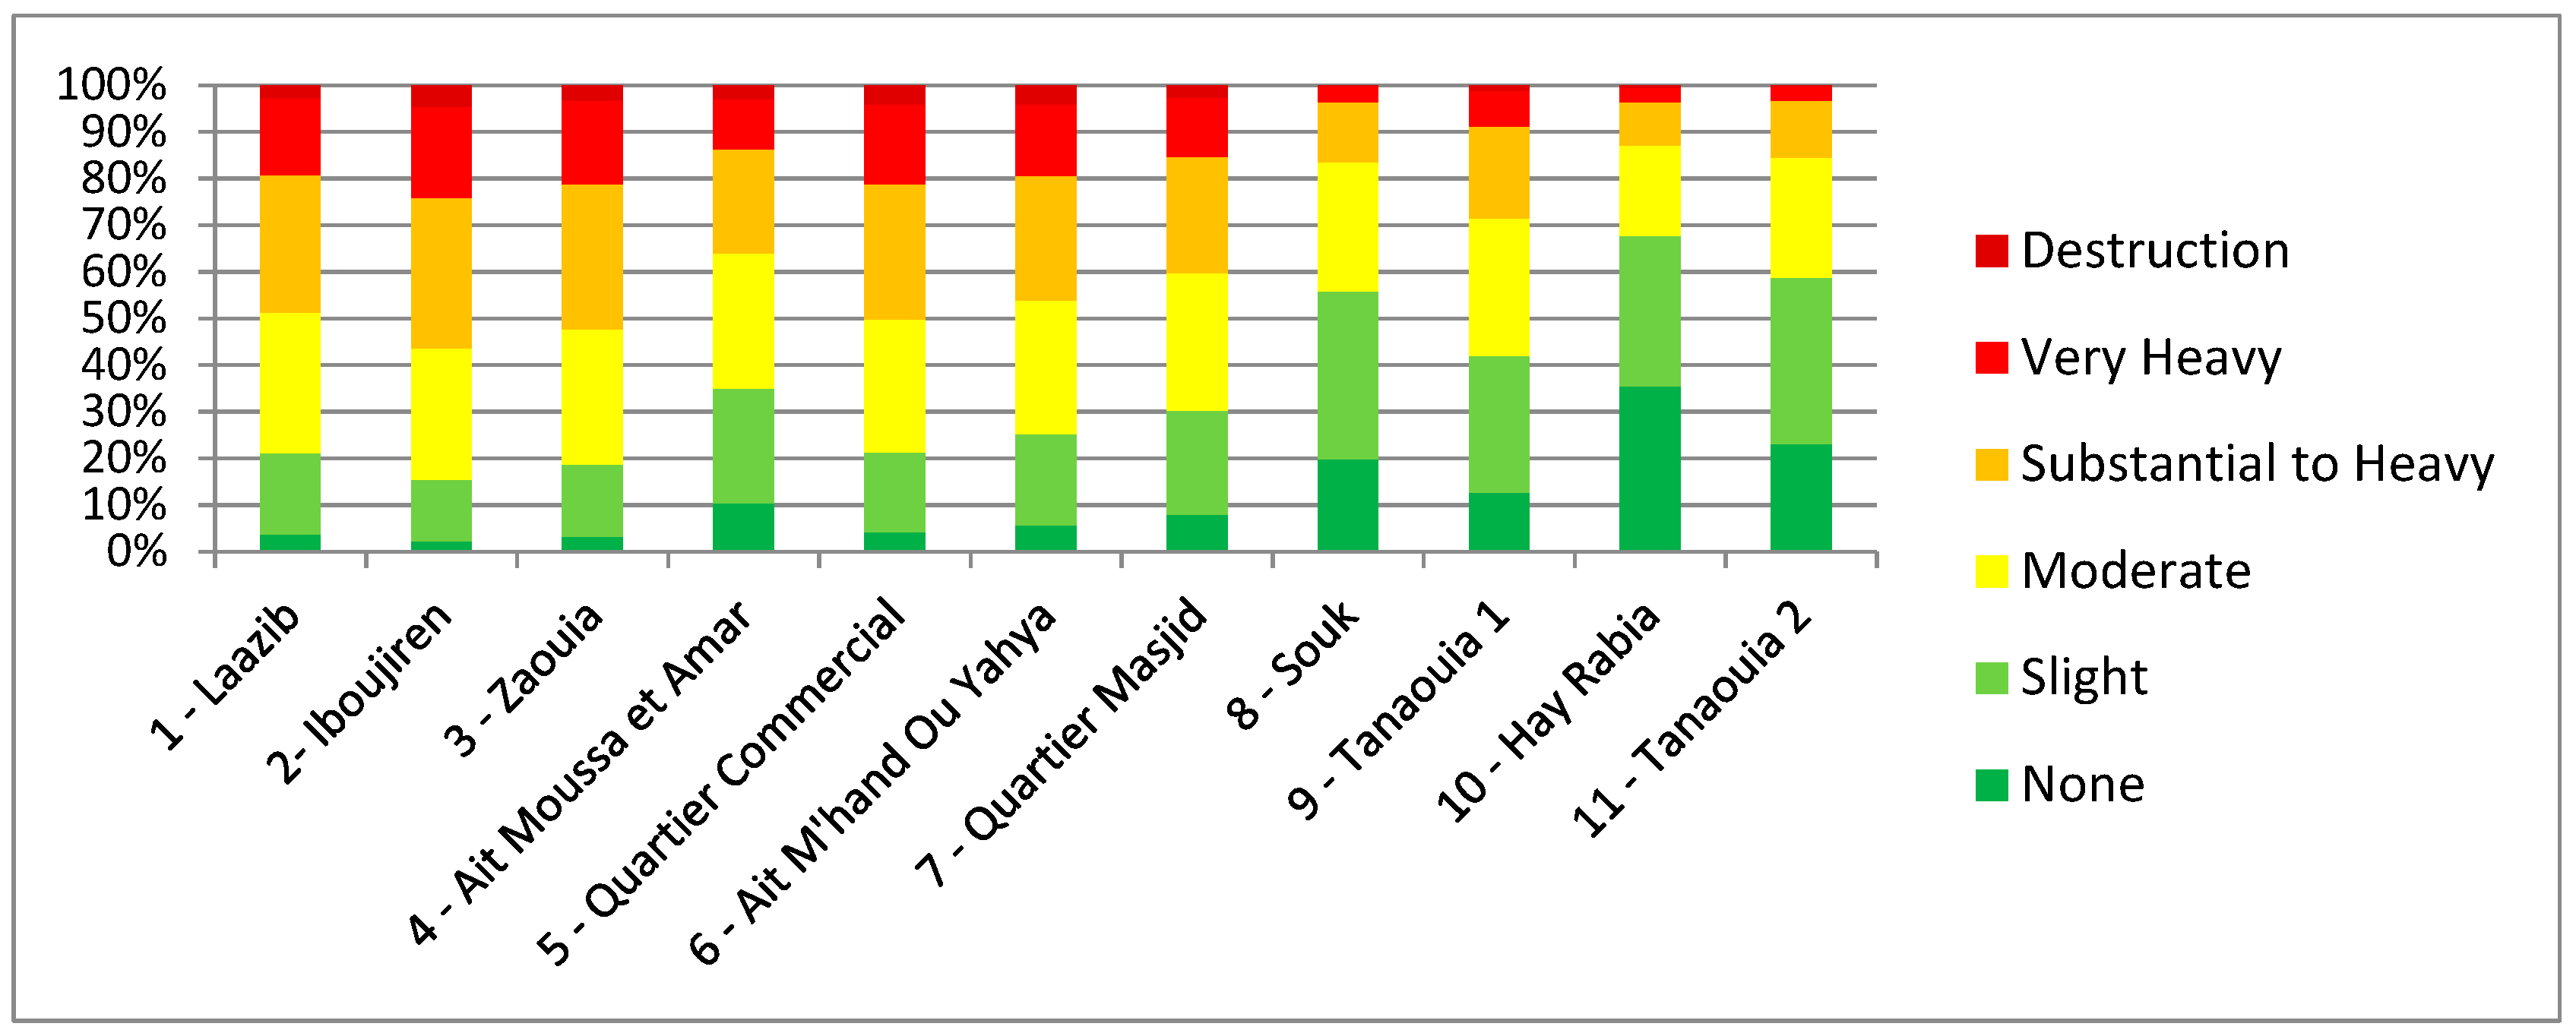
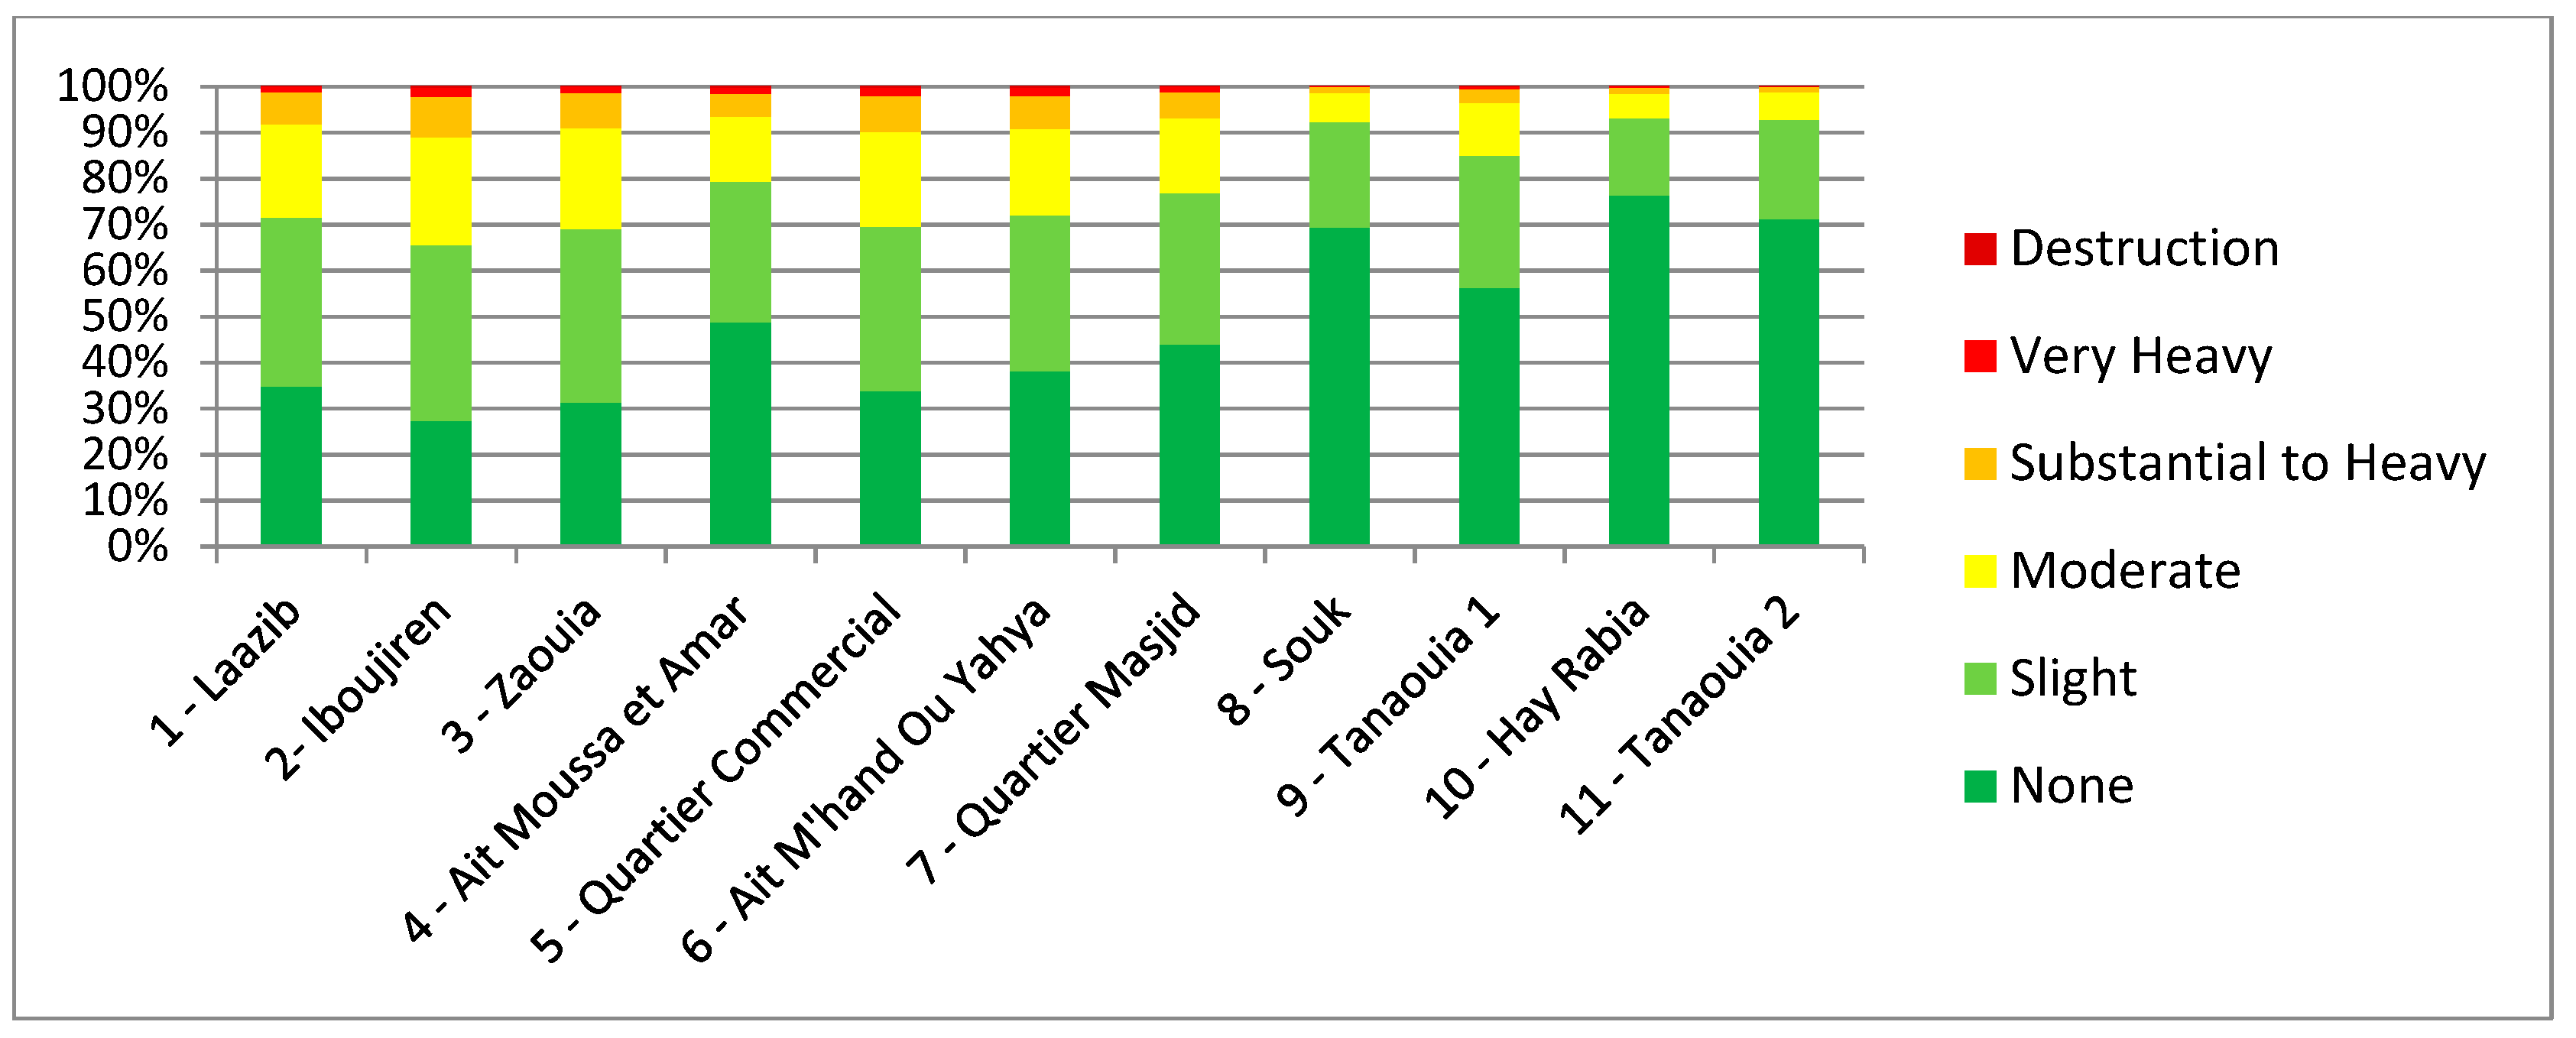
The VIM introduces five non-null damage states; Slight, Moderate, Substantial to Heavy, Very Heavy and Destruction [
42]. The mean damage grade
is introduced to characterize the likely damage to the building, for a given vulnerability (
) and a macroseismic intensity (
) according to the following Equation:
where
is the ductility index, which is assessed taking into account the typology of the building and its geometrical and material characteristics [
43]. For residential buildings, it has a value of 2.3 [
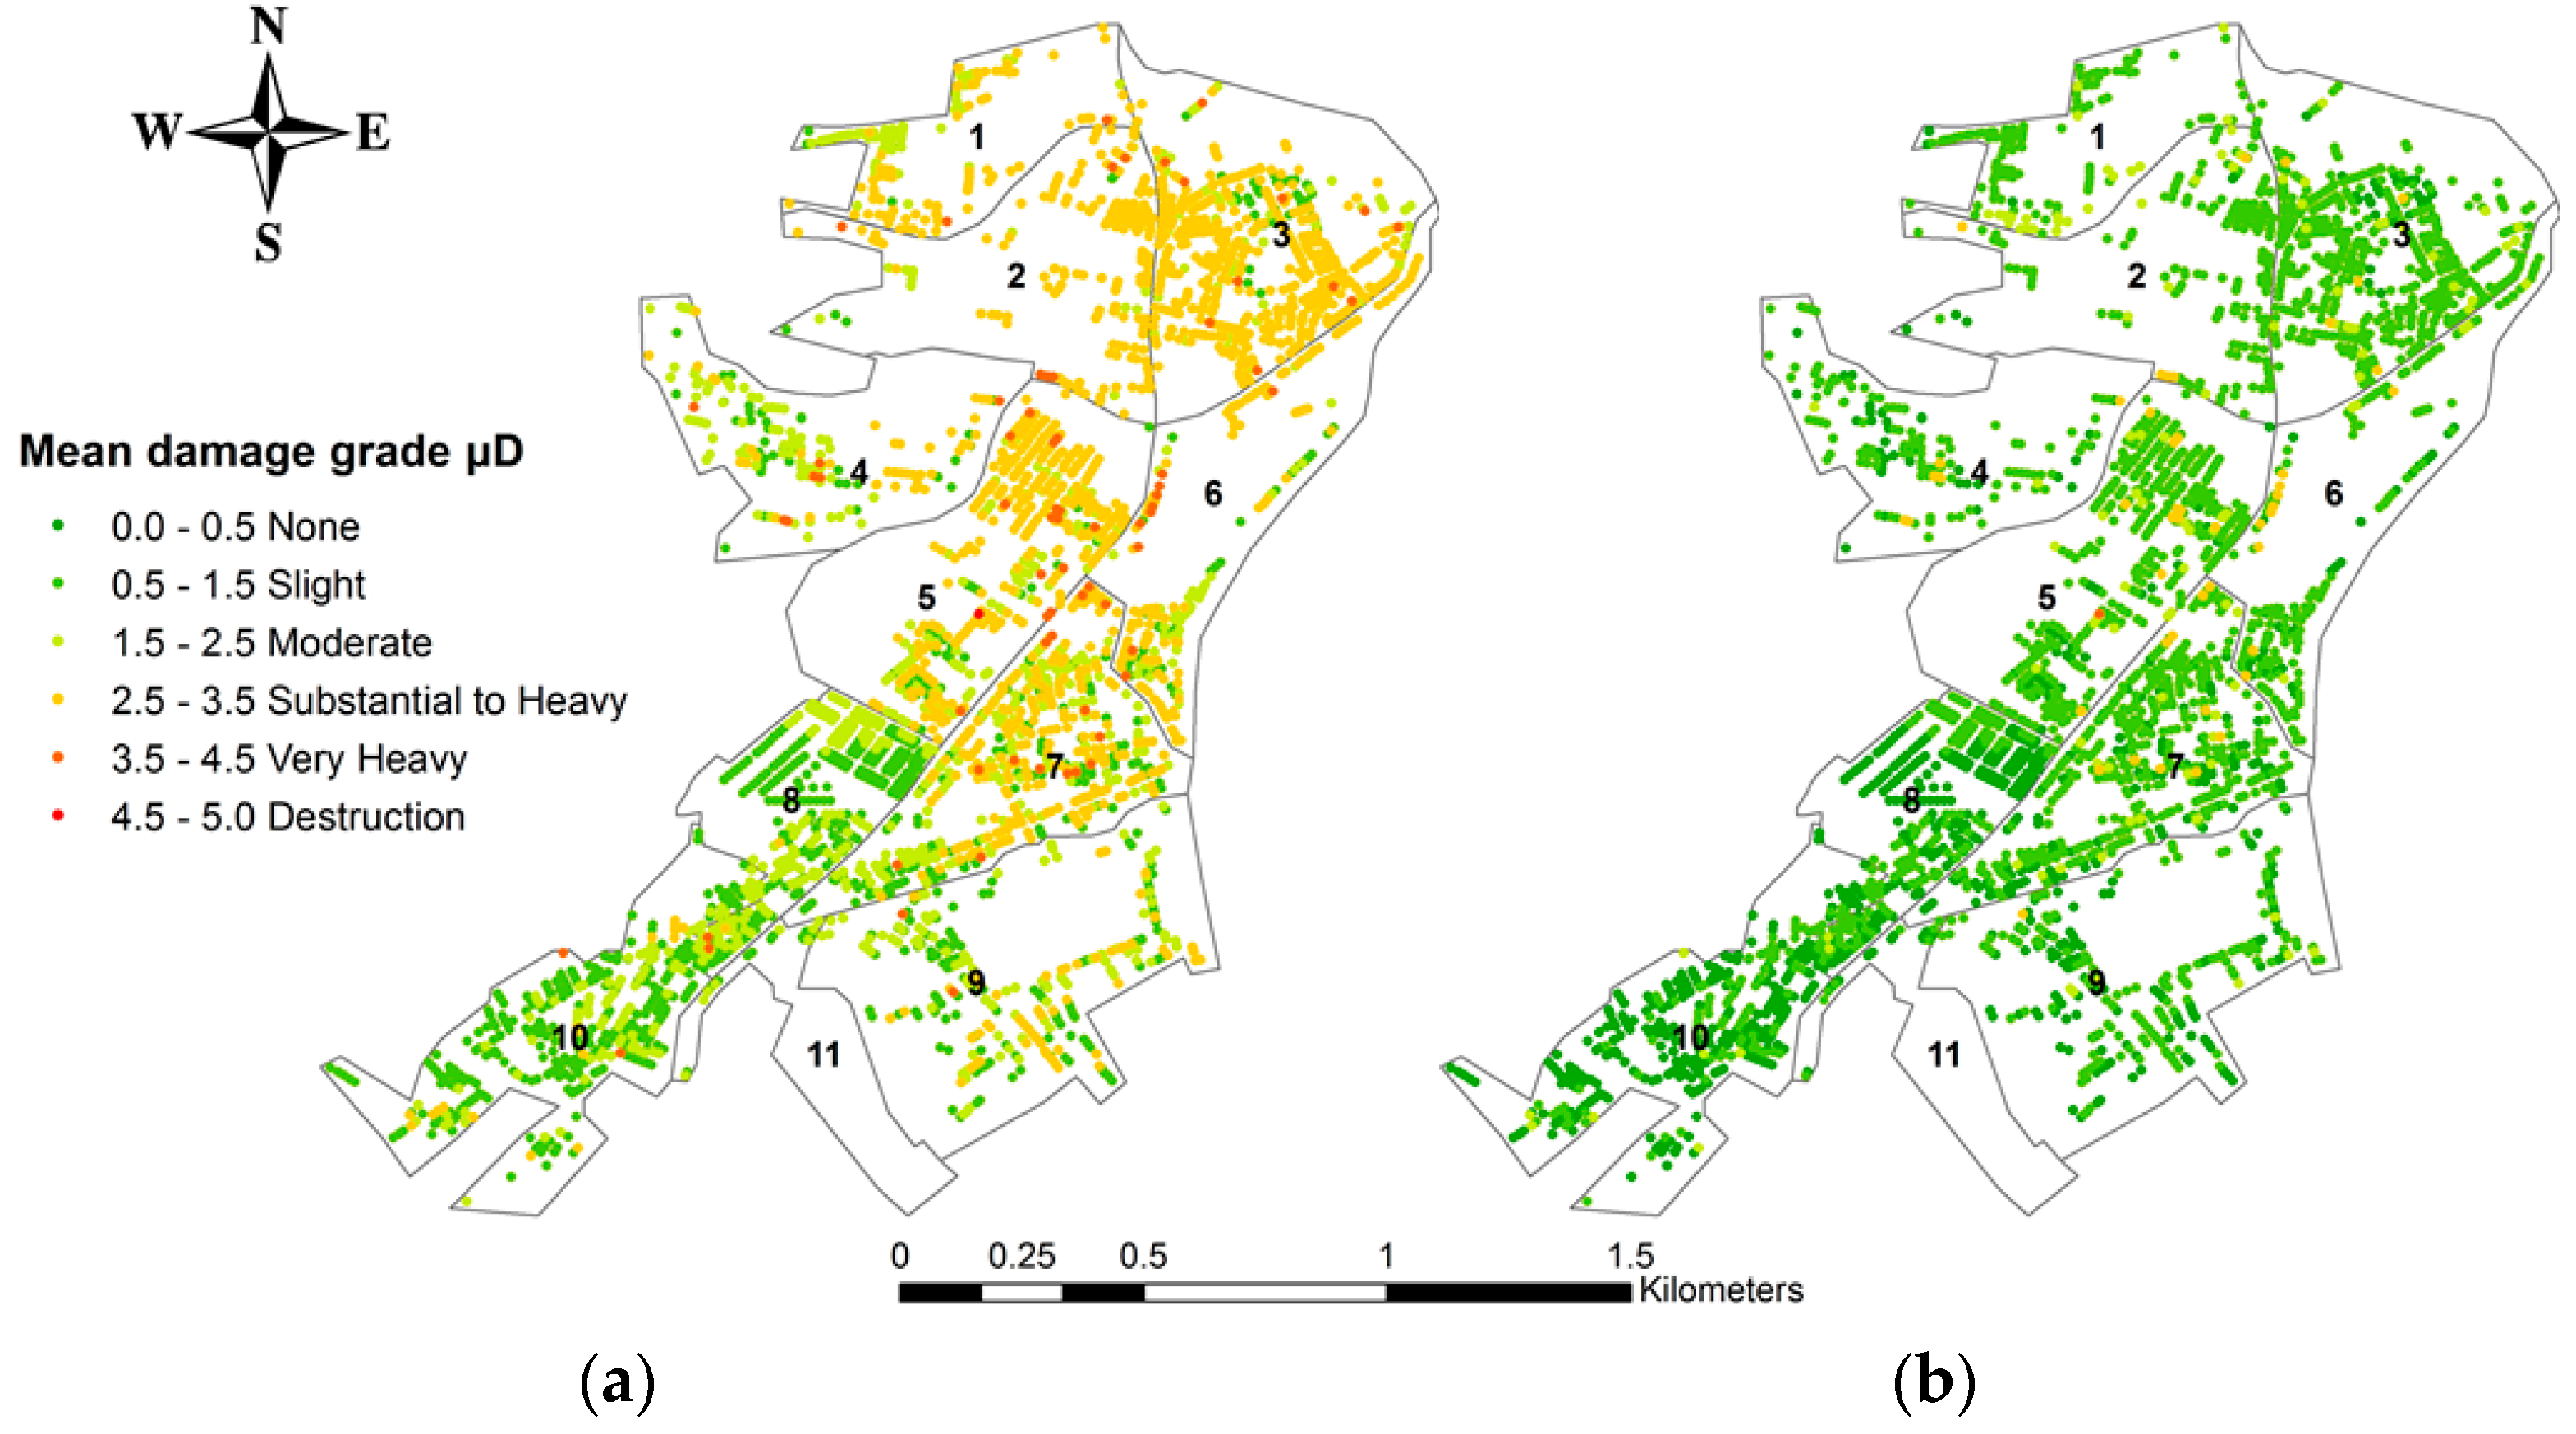
36]. The distribution of the mean damage grade for the different building codes is shown in
Figure 8. It is in fact the most important factor in the seismic vulnerability assessment in the city, since all existing residential buildings have the same structural build (reinforced concrete moment frame structures) and the same height (low to mid rise).
A weighted average index of damage
can be calculated using the following Equation [
37]:
where
represents the state of damage taking values from 0 to 5 and
represents the corresponding probabilities of occurrence of the damage state
. The damage distribution is calculated using the beta distribution [
37].
6. Discussion
The results show that most buildings have a low vulnerability index, which can be linked to the improved quality of construction materials and construction practices since the 2004 earthquake. In addition, an increasing number of reinforcements and reconstructions have been identified throughout the city since the 2004 event. However, this fact doesn’t exclude 7.5% of the buildings having important vulnerability indices, which is mainly related to the failure to comply to seismic construction regulations.
The results also show that direct damage in the city is moderate for the deterministic scenario, and light for the probabilistic scenario. The damage difference between the two considered scenarios is rather important, since the considered intensities affected to both scenarios are quite different. The results show similarities with the conducted surveys of the reference earthquake. According to damage surveys of the 2004 earthquake, buildings belonging to the same vulnerability class (B and C from EMS 98) show different results, some stood in good condition while others (around 30) completely collapsed [
19,
47]. All the reports believe the damage is related to the site effects and construction defects.
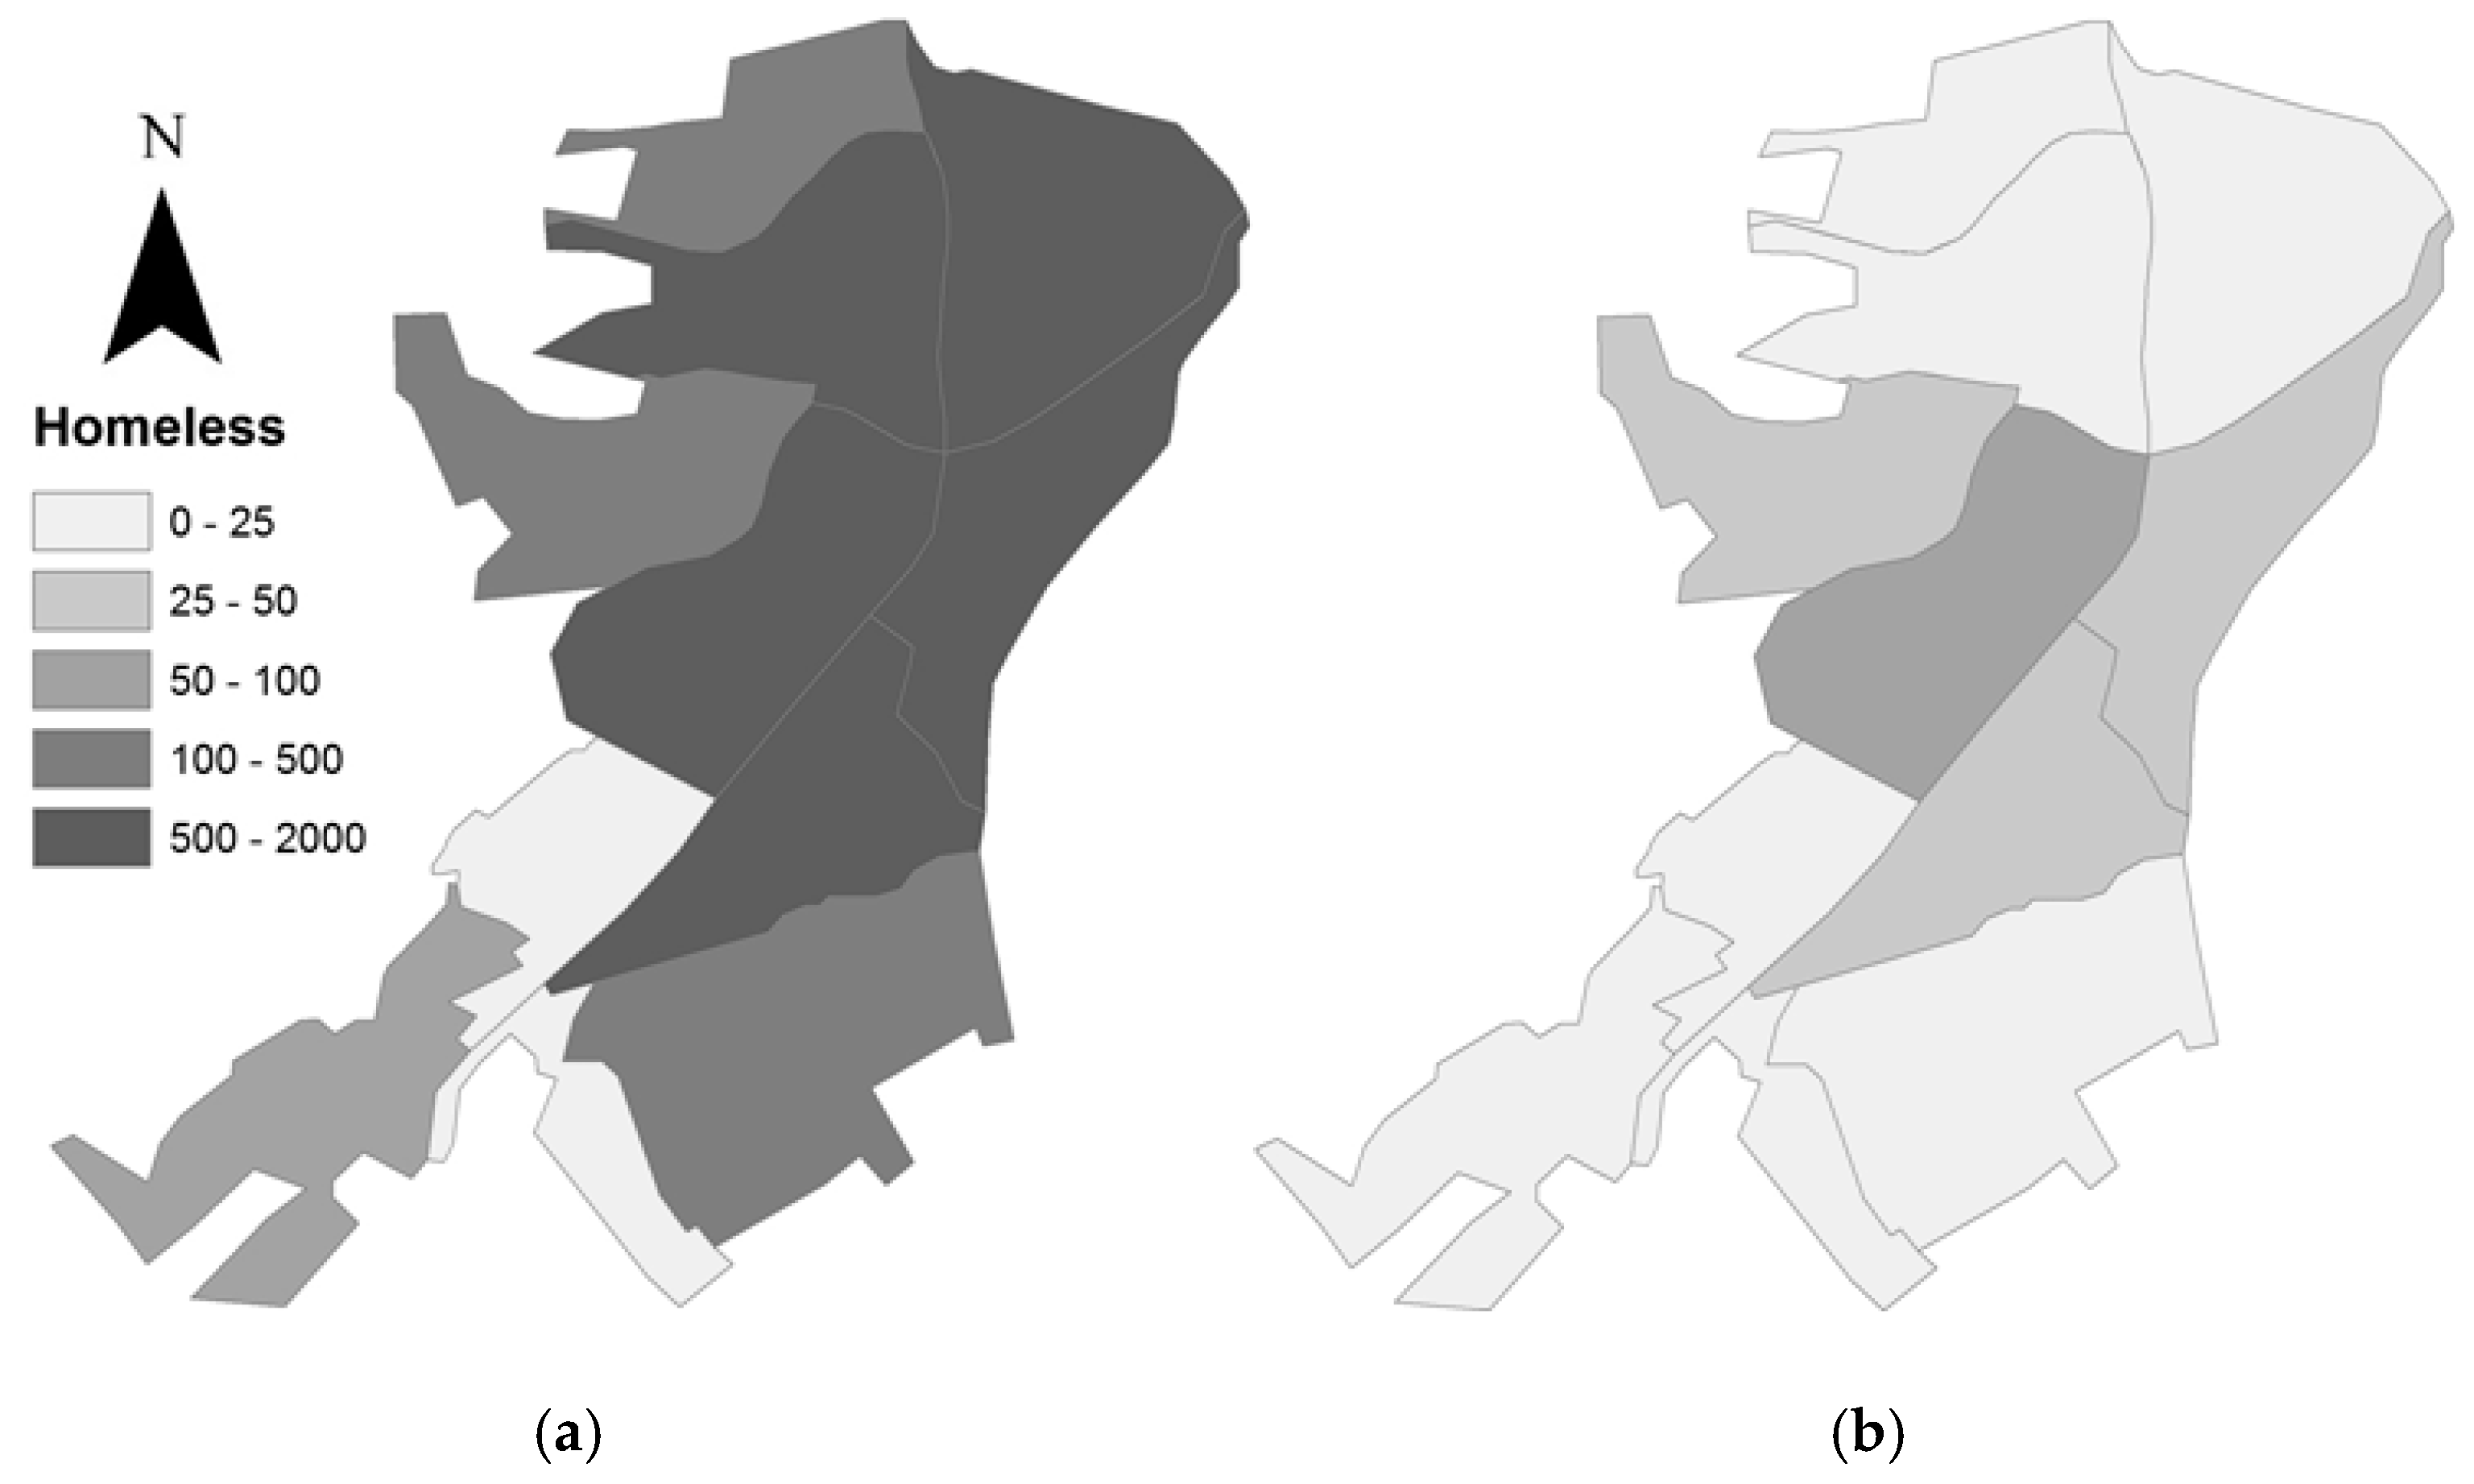
The estimated number of casualties is significant in case of the deterministic scenario, while inexistent for the probabilistic scenario. A total number of 84 Collapses, 580 casualties and 147 fatalities are estimated in the worst-case scenario. According to NatCatSERVICE, the overall losses due to the 2004 earthquake in the region of Al Hoceima is estimated around 400 million dollars [
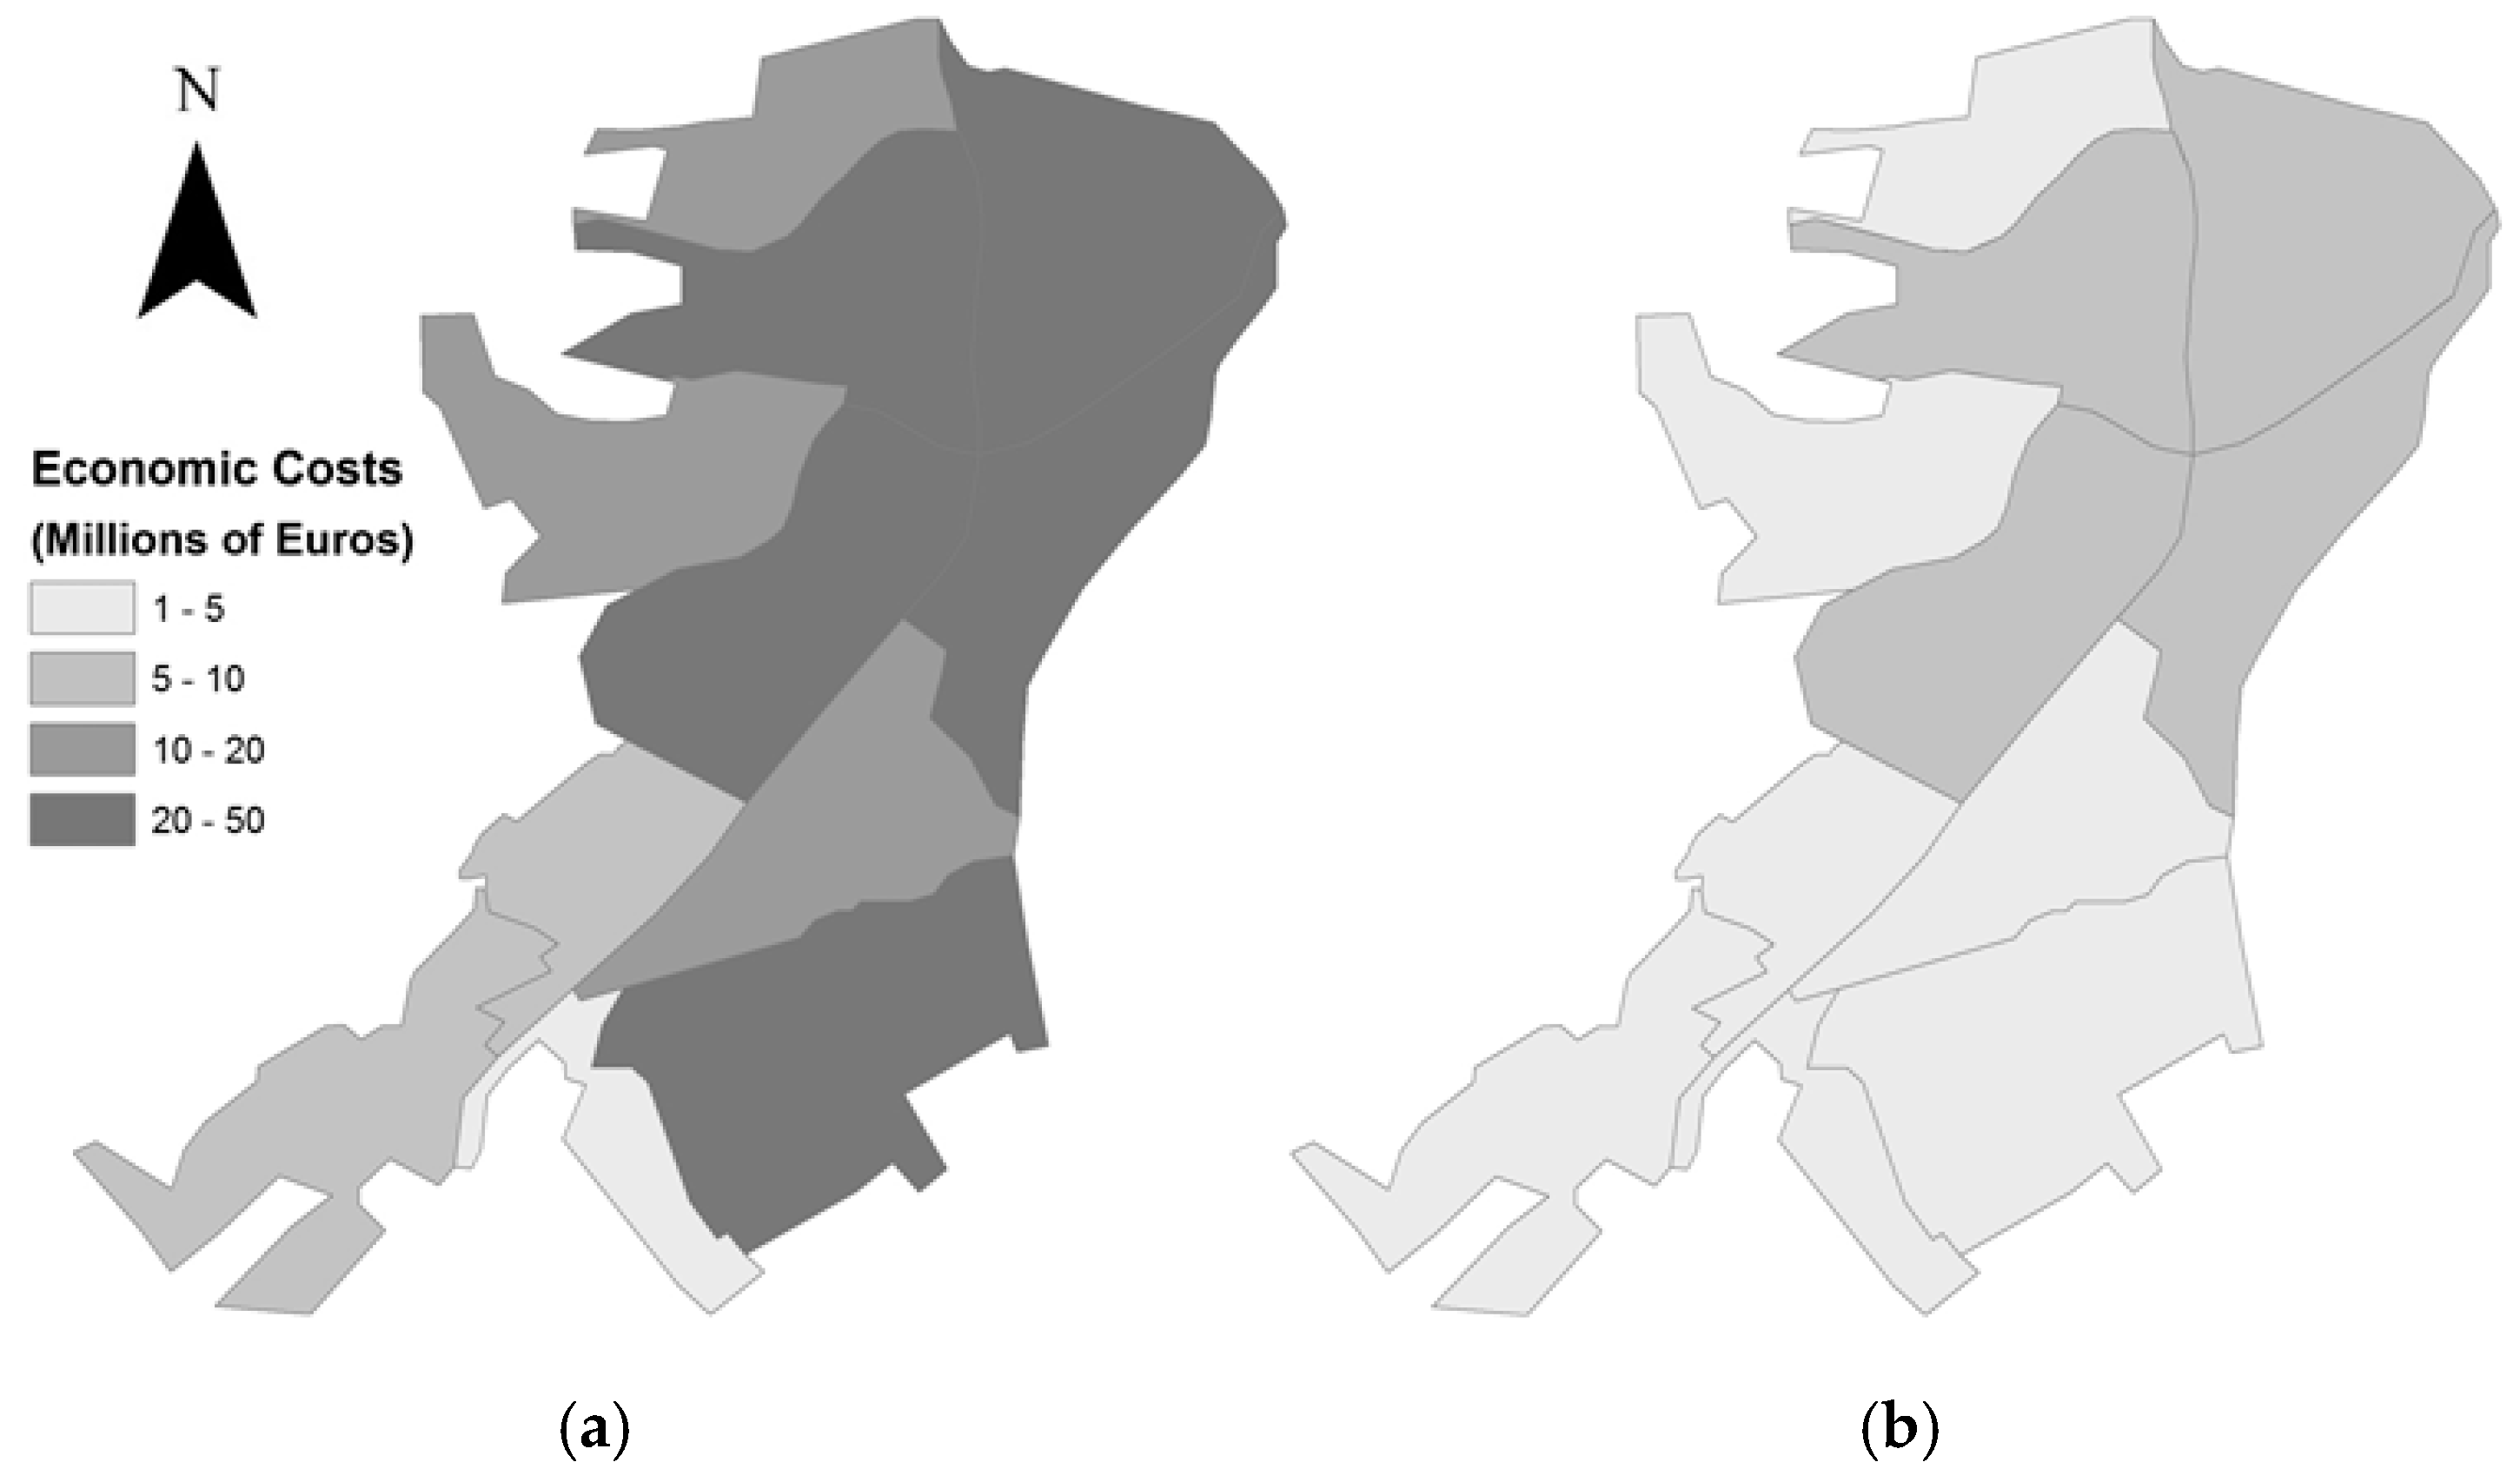
46]. The economic losses in the city of Imzouren according to the deterministic scenario are about 197 million euros and represent 43% of the estimated overall losses of the 2004 earthquake, taking into account the overtime dollar value and the exchange rates, which is a good estimate.
During the investigation, it was rather difficult to distinguish buildings by their characteristics since they have the same structural build and the same appearance. However, the existing dwellings were mainly categorized by their code level, in other words, whether the buildings respect new and old seismic construction standards or not. Additionally, this study doesn’t take into account the poor construction practices that are not apparent on buildings (e.g., quality of construction materials, column-beam connections) which frequently occur when there is lack of supervision.
Based on the estimated states of damage according to both deterministic and probabilistic scenarios in the city of Imzouren, it is important to consider risk mitigation actions, which may include:
Control of the mechanical characteristics of the existing buildings suspects of construction defects;
Planning a seismic microzonation of the city using Vs30;
Updating the seismic standard in the region of Al Hoceima, by adding response spectra for the cities and fragility curves for the typical structures;
Increasing the level of preparedness of disaster and rising societal awareness of seismic risk.
7. Conclusions
Seismic risk in the city of Imzouren was assessed with an empirical approach based on site investigations and vulnerability index scoring. The evaluation of the seismic hazard and seismic vulnerability allowed a proper estimation of damage based on two seismic hazard scenarios; a deterministic scenario and a probabilistic one. The seismic hazard was defined in terms of macroseismic intensity including site effects.
A building inventory of 3077 residential buildings was collected for the purposes of this study. The inspection results indicate that all buildings are reinforced concrete moment frame constructions with masonry infill walls. The seismic vulnerability of the buildings was performed using the Vulnerability Index Method applied in the RISK-UE project. The results show that most buildings have a low vulnerability index. However, this fact doesn’t exclude 7.5% of the buildings having important vulnerability indices. In terms of seismic risk results, direct damage in the city is considered to be moderate for the deterministic scenario, and light for the probabilistic scenario. The same difference in scenarios is observed for the harm to the population and economic costs, since these aspects are tightly linked to direct damage.


