Article

Design and Performance Study of a Six-Leg Lattice Tower for Wind Turbines

School of Civil Engineering, Inner Mongolia University of Science and Technology, Baotou 014010, China
*
Author to whom correspondence should be addressed.
Buildings 2024, 14(4), 965; https://doi.org/10.3390/buildings14040965
Submission received: 11 February 2024 / Revised: 16 March 2024 / Accepted: 25 March 2024 / Published: 1 April 2024
(This article belongs to the Special Issue Novel Steel and Steel-Concrete Composite Structures)

Abstract

:
A new type of spherical node was used to design a laboratory-scale prototype of a six-leg lattice of steel tubes and concrete for application as a wind turbine tower. Repeated load tests were performed on the prototype tower for several weeks to evaluate its load-carrying capacity, deformation, energy consumption, stress distribution based on damage patterns, hysteresis curves, skeleton curves, strength, and stiffness degradation curves. The findings indicated that the prototype tower underwent thread damage to the high-strength bolts of the inclined web and weld damage between the inclined web and sealing plate. Although the stress differences between different measurement points were significant, the stress values were small at most of the measurement points. The maximum equivalent stress value was 294 MPa, which appeared in the middle layer of the BC surface. The P-Δ hysteresis curve had an inverse “S”-shape, and the bearing capacity was high. The maximum energy dissipation appeared in the 1.75 Δy loading stage. The peak load of the specimen can reach 376.2 kN, and the corresponding peak displacement is 37 mm. However, the average ductility coefficient was only 2.33, indicating little plastic deformation. The maximum strain of the tower column foot is 1800 με, and the force of the inclined web member in the middle layer is the largest. The strain of the transverse web bar increased significantly after the tower yielded, which contributed to maintaining the integrity of the structure.

1. Introduction

Wind energy is a reliable and environmentally friendly renewable energy source used to generate electricity. It is gaining attention due to its non-polluting and safe nature [1,2,3,4]. As wind turbines continue to increase in size, the need for structures that are stable under various wind conditions becomes more necessary, which presents challenges for increasing tower heights [5,6,7]. The diameter of the impeller affects the wind speed between the upper and lower ends of the impeller, and the change in pitch of the turbine head produces an additional bending moment on the tower. The wind tower is the most important load-bearing structure in a wind power generation system, and it must resist sideshifts. To advance the power generation industry, research on wind towers must keep up with the demand for new equipment. The lattice design for wind power towers provides flexibility according to the rigidity requirements of the structural form of the arrangement. Compared to the cone bucket type of tower, the material size of the lattice type is much smaller, making it easier to transport and allowing full use of its material performance. These advantages make the lattice tower design a promising prospect for development.
When exploring designs for nodes for lattice wind tower structures, engineers found that coherent nodes and tube plate nodes had the best load-carrying capacity because of their simple construction and clear force transmission path [8,9,10,11,12,13,14,15]. However, these types of nodes have some flaws, such as the effects of poor welding due to the difficulty of working at heights and residual stress that cannot be eliminated [16,17,18,19]. In recent years, artificial intelligence methods have made important progress in the field of structural damage identification [20,21,22]. Artificial intelligence methods such as machine learning algorithms and deep learning algorithms can train and analyze a large amount of data, to realize automatic damage identification of structures. These methods have the advantages of high efficiency, accuracy, and adaptability. If these methods are applied to tower structures, it will bring a breakthrough for structural health monitoring and damage identification [23].
Our research group has examined the force performance of universal wrapped nodes such as bolted ball nodes, flanged nodes, and Y-shaped nodes. The theoretical results for these nodes have become more sophisticated [24,25,26]. This type of tower is capable of bearing a greater load. The stiffness and reliability are also significantly improved, and the construction height of the tower is also higher [27,28,29]. Many significant advancements have been achieved in the research of lattice concrete-filled steel tubular wind power towers. However, the node remains a challenging and crucial component of the structure [30,31,32,33]. Based on our research, we designed a new type of universal wrapped spherical node that uses two bolted balls to connect the tension and compression web rods and extends the intersection point of the combined force to the center of the tower column. To deeply study the force performance of this spherical node in a spatial tower system, we took the parameters of a 3 MW wind turbine as the basis and used the wind conditions at the Baiyun Obo mining area as the background to design a six-leg lattice wind power tunnel made of steel pipes and spherical nodes. We also designed a prototype of a six-leg lattice wind tower made of steel tubes and concrete and obtained a laboratory-scale model according to similarity theory. The laboratory-scale model underwent a repeated weekly load test, and we analyzed the damage pattern, damage mechanism, and stress distribution of the tower based on the test results. The results of this study provide a theoretical basis for future research on lattice towers.

2. Overview of the Experiment

2.1. Specimen Design

Using a 3 MW conical platform wind tower located in the Baiyun Obo area of Inner Mongolia as a basis, a prototype of a six-leg lattice wind tower made of steel tubes, concrete, and spherical nodes was designed. The total height of the tower was 100.7 m, and it was divided into 24 floors. The top dimension was 2.1 m to accommodate the normal working yaw bearing of the generator set. The design width of the tower was also 2.1 m, following the “Steel Structure Design Standard”, with an inclined web bar and horizontal spanning bar forming a 45° angle in each bay of the tower’s plane. The bottom of the tower had a unilateral size of 7.38 m as determined by the design.
An analysis was conducted by SAP2000 to determine the internal force distribution of a wind turbine tower, accounting for factors such as the weight of the turbine itself, wind load on the blades and the tower, and other relevant considerations. The strength, stiffness, and stability of the tower were verified, ensuring that the design met all necessary specifications. Due to limitations at the testing site, the top four floors of the tower were selected for research purposes, and a laboratory-scale model was used to conduct weekly reciprocating horizontal load tests. These tests specifically studied the force performance of wrapped spherical nodes in six-leg wind turbine towers with columns made from steel tubes and concrete. According to the design requirements, the top horizontal displacement cannot exceed 0.5–0.8% H. The horizontal displacement of the top floor of the tower designed in this paper should be in the range of 504~806 mm. The results of SAP2000 simulation show that the maximum horizontal displacement of the top layer is 586 mm. Therefore, the design is in line with the requirements.
When the size of the material is reduced to a certain extent, there will be a size effect, and its properties will change [34]. The tower model was created using similarity theory by scaling the prototype tower with a ratio of 1:2.8 [35,36]. The laboratory-scale model of the tower is displayed in Figure 1, and the parameters of the prototype are listed in Table 1. The columns and webs were made of 20 Mn seamless steel pipe, with cross-sectional dimensions of Φ108 mm × 5 mm for the columns and Φ32 mm × 3 mm for the webs. The tower columns were anchored to the reinforced concrete foundation at the bottom at an angle of 87° from the horizontal surface, and the top columns were welded to the top plate, which was 50 mm above the top surface of the 30 mm thick top plate. The top of the tower column was 50 mm higher than the top surface of the top plate, and six tower columns were welded to the top plate. At the upper end of the top plate, two stiffening ribs were set and welded together with the loading plate and the top plate. The steel mesh frame had inclined webs and cross webs at a 45° angle. High-strength bolts, including the 10.9 M16 bolt specification, connected the inclined webs at both ends of the frame to node bolt ball 1. The cross position of the inclined web was connected to bolt ball 2 near the top of the tower. The bottom of the inclined web was inserted into the node plate slot and connected to the web and column through welding. The other end of the inclined web was connected to bolt ball 2 with M16 high tensile bolts. The two ends of the cross web were connected to the ball plate using 10.9 grade M14 high-strength bolts. The topmost cross-web ends were connected to the tower column through welded node plates. The wrapping body was made of a 5 mm thick rolled steel plate with 5 mm thick stiffening ribs at the wing edge. The base plate and cover plate were made of 8 mm thick steel plates and connected by 10.9 grade M12 high-strength bolts. The processing and assembly work for the specimen was completed in the processing plant and transported to the laboratory before the foundation was poured. The tower column steel pipe was filled with C40-strength commercial concrete. The measured mechanical property indexes of steel and concrete are shown in Table 2.

2.2. Test Setup and Loading Regime

2.2.1. Test Setup

The positive loading test was conducted using the loading device depicted in Figure 2. The most unfavorable position for loading was chosen, which involved loading along the diagonal direction of the hexagon to the single column. To achieve this, the servo actuator was fixed on the counterforce wall at one end and connected to the loading plate of the tower using high-tensile bolts. In the vertical direction, the load was applied using the vertical servo actuator fixed to the upper beam, which transferred the pressure directly to the top cross rib of the tower through steel pads. To prevent the foundation of the specimen from slipping along the loading direction during the loading process, the concrete foundation was anchored to the test bed using four ground screws. In the horizontal direction, an H-beam was employed to jack the foundation to the counterforce wall and steel column.

2.2.2. Loading System

In quasi-static tests, the displacement control method and force-displacement control method are commonly used for loading. The hybrid control method based on force-displacement is a suitable approach to accurately manage horizontal force loading and ensure the compression-shear stress state of the tested specimen. This method is generally applicable for vertical force loading control of such test systems. It has extensive potential in the compression-shear test of large-scale columns, walls, and other specimens. Therefore, this paper has opted for the force-displacement hybrid control method. The test involved a mixed load-displacement loading system. The test started with load-controlled loading during the elastic working stage of the specimen and then switched to displacement-controlled loading after yielding. Before starting the test, the vertical load was preloaded to 400 kN and kept constant, and then the horizontal load was applied. During the load control stage, the load was applied in increments of 10% of the yielded load, with 20 kN as the load increment. Each load stage was cycled for one week. After the specimen yielded, it was transferred to displacement control loading, where the displacement increment was 0.25 times the actual yield displacement. Each load stage was cycled for three weeks. The test was stopped when the tower column, the main component of the tower, was damaged or the load was reduced to 85% of the peak load. The loading system is shown in Figure 3.

2.3. Measurement Points

To measure the force and stress distribution of each column, strain gauges were placed at representative locations. The foot and top of the six columns and each parcel along the force direction were fitted with strain gauges. The transverse web rods, except the top layer, were equipped with strain gauges in the middle part. The diagonal web rods had strain gauges only on the two main bearing surfaces of BC and EF, while the other symmetrical structural surfaces had strain gauges arranged in the upper and lower half of each layer in a staggered manner. The dome cover plate also had strain gauges arranged on its symmetrical surfaces. The four faces of the dome cover plate—FA, BC, CD, and EF—were chosen for the measurement points. Along the steel ball holes, the BC face of the dome cover plate had symmetrically arranged strain gauges. The rest of each symmetrical face was selected from the left and right of the two cover plates with the measurement point in a staggered arrangement to observe the stress changes. Additionally, displacement meters were arranged at the nodes of the columns of the two C, D, and E layers at the upper part of the tower to measure the test horizontal displacement and the torsion of the prototype during the test. A displacement gauge was also set up at the base of the tower to measure the overall slip of the prototype. In Figure 1, red dots show the arrangement of measurement points for the tower as a whole, the web, and the dome cover.

3. Failure Characteristics

Figure 4 depicts the damage pattern of the prototype. There appeared to be two primary types of damage to the tower: first, the fracture of the weld seam of the sealing plate of the inclined web rod, and second, the dislodging of bolts. The damage location was primarily concentrated in the two faces of BC and EF, which were parallel to the loading direction. Additionally, some rods were damaged in the face of AB.
During the test, the vertical load was preloaded to 400 kN and maintained at a constant level. The tower node produced a faint “tah-tah” sound while the load was applied. Once the vertical load reached the set value, the horizontal reciprocating load was applied. The specimen was initially in the elastic stage, and load-controlled loading was used. There were no significant occurrences except for the slight sound from the tower frame node. However, as the load increased to 102 kN, the frequency of the sound produced by the node increased. As the load increased, two bolts were pulled out at different positions on the diagonal web and flange intersections of the second layer of the EF and BC surfaces. When the load reached 288.6 kN in the forwards direction, the tower began to yield, causing the load-displacement curve to change and resulting in a 26 mm horizontal displacement at the top of the tower. The test then entered the displacement-controlled loading stage. During the first reverse loading to 26 mm, a bolt at the intersection of the left lower diagonal web and flange of the third level of the EF surface was pulled out. When the load reached 1.25 Δy in the forwards direction, the seal plate weld at the intersection of the upper right diagonal web and the bolt ball at the intersection of the diagonal web at the fourth level of the BC face disconnected with a loud bang. Nevertheless, the bearing capacity of the tower continued to increase, and the load eventually reached a peak value of 376 kN when the prototype was loaded to 1.5 Δy in the forwards direction, before the bearing capacity of the tower decreased. During the test, the ability of the tower to bear weight began to decrease. After the first reverse load, the bolt at the intersection of the diagonal web and flange on the upper left side of the second layer of the BC face was pulled out. Then, during the third push, the seal plate weld of the cross-crossing part of the diagonal web on the upper right side of the first layer and the second layer of the BC face was fractured. As the horizontal displacement increased, the web bars were destroyed, one after another, and the bearing capacity decreased. When the test was loaded to 3.0 Δy, 20 diagonal web rods were damaged to various degrees, and all layers of the BC and EF towers were damaged by diagonal web rods. When the rods were destroyed, one after another, the force transmission system of the tower was seriously damaged, and the loads were transferred from the top cover plate to the six tower columns. The test was ended after three cycles because there was no point in continuing the test.

4. Test Results and Analysis

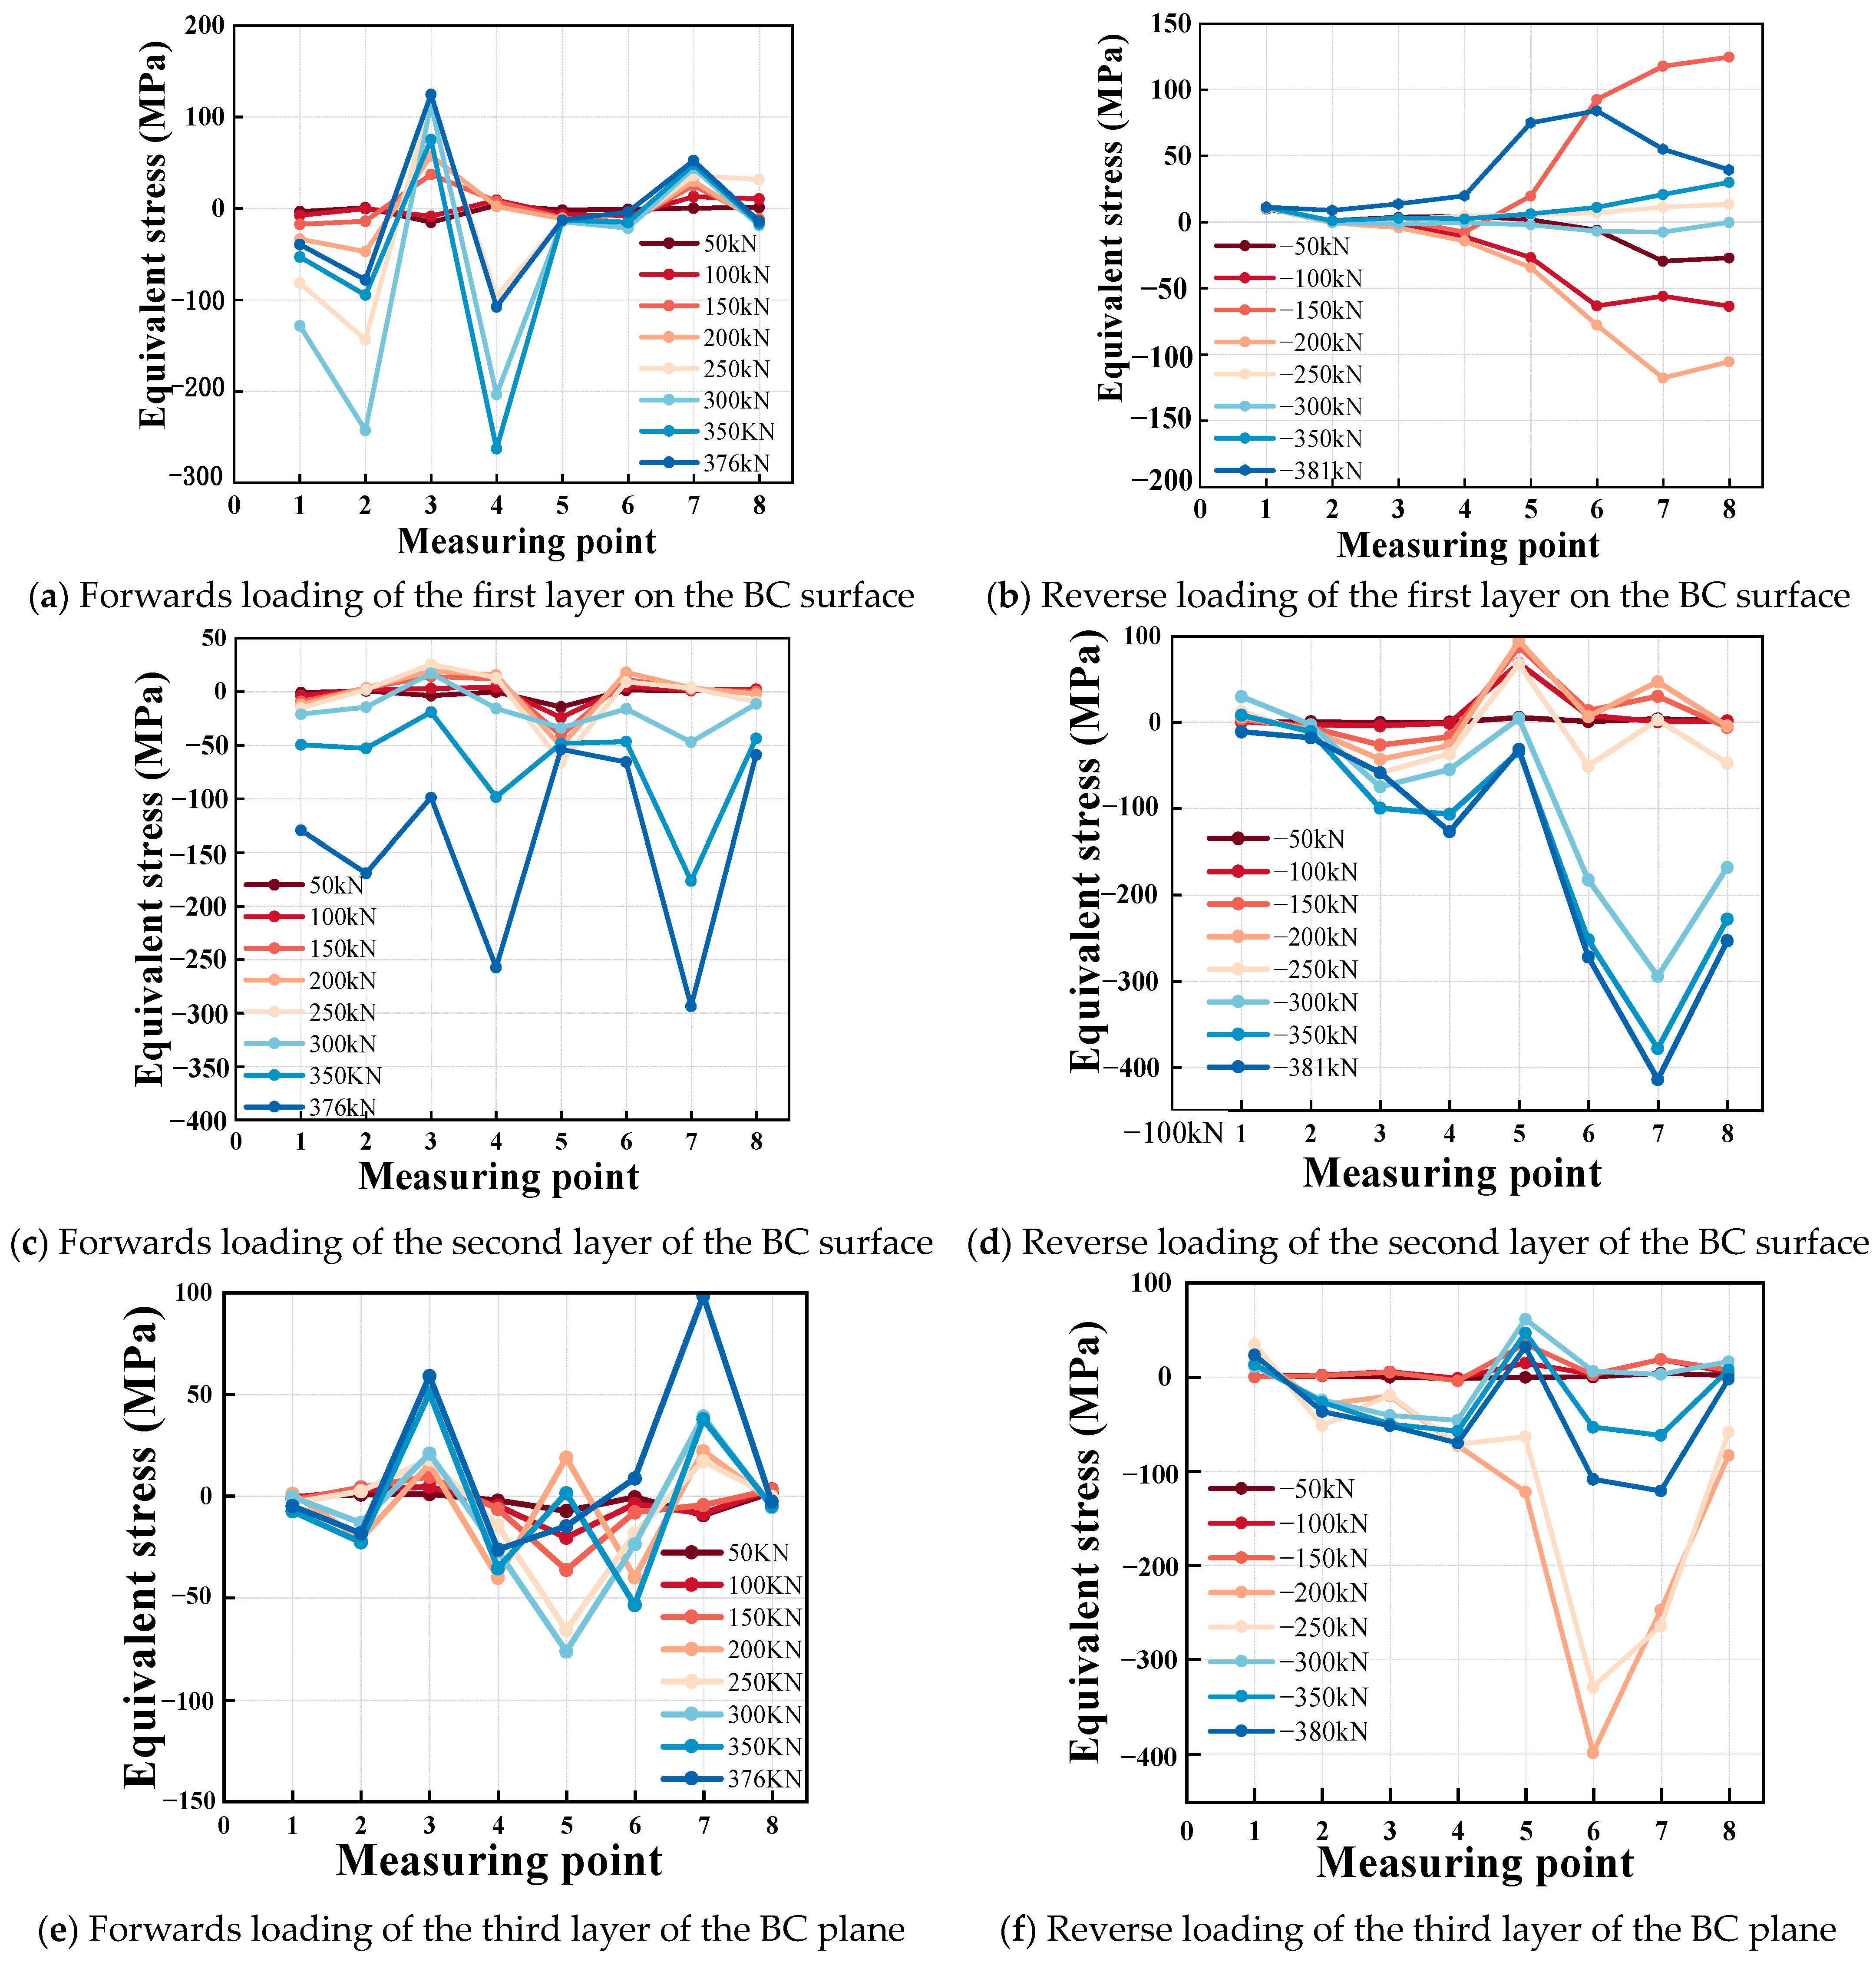
4.1. Equivalent Force Analysis of the Ball Table Plates

The stress distribution of materials can be evaluated using various methods such as numerical simulation, experimental measurement, theoretical analysis, image analysis, and non-destructive testing. In this paper, to examine the tower’s performance in the real environment, experimental measurement is used as the preferred method. Since the tower comprises many components, non-destructive testing can only be carried out through sampling, which may fail to cover all critical areas. Therefore, this paper uses the JHYC static strain measurement and analysis system to measure the stress distribution of the table pressure plate. This system has high accuracy, excellent stability, and strong anti-interference ability, especially in the complex laboratory environment. The operation of this system is easy, and the setup is convenient. The ball table pressure plate is an important part of a wrapped node and is responsible for transmitting force. It has many bolt holes to secure the bolt balls and ensure that the web functions properly. Understanding the stress distribution of the ball table pressure plate is crucial for studying the stress performance of the tower node. To measure this, four strain gauges were placed in the ring direction at each of the two openings of the ball and socket plate. Figure 1 shows the specific arrangement of the measurement points on the left and right of two ball table pressure plates. An equivalent stress analysis was conducted on the main stress surface BC surface, and the resulting equivalent stress diagram is shown in Figure 5.
During forwards loading, the ball table pressure plate at the bottom of the BC surface underwent its maximum equivalent stress at measuring point 4, which was 262 MPa. However, measuring point 6 underwent the minimum equivalent stress at 4 MPa, indicating a significant difference in stress. Except for measuring points 3 and 7, the stress values of the remaining measuring points decreased with increasing peak load. Nonetheless, measuring points 3 and 4 underwent a change in stress from tensile to compressive at a load value of 250 kN, while point 8 underwent tensile stress at 100 kN and 250 kN load values. Upon analyzing the lower part of the four measuring points of the ball table pressure plate, we found that the stress performance varied due to differences in size, assembly angle, and the assembly of more parts. Additionally, clockwise twisting of the components during the stress process exacerbated the differences in stress among the parts. During reverse loading, the maximum stress value did not occur at the peak load. At a load of 150 kN, measurement point 8 underwent a maximum equivalent stress of 125 MPa, while the other measurement points, except for 1 and 2, underwent repeated changes between tensile and compressive stresses as the load was increased. The reason for this was that when the load reached 150 kN, the tower twisted counterclockwise, causing an increase in the angle between the tie rods and the cover plate and resulting in tensile stress at the measuring points. At 200 kN, the threads of the tie rods on the second layer of the BC face sustained damage, causing a loss of tensile force. However, the bolts were not yet completely dislodged, so the bolt balls rotated during the deformation of the tower and extruded on the cover plate, leading to compressive stress. As the horizontal displacement increased, the action of the tie rod on the bolt ball transferred from in-plane to out-of-plane, and the compressive stress became tensile stress.
During the loading of the middle layer of the BC surface, the ball table pressure plate underwent a maximum equivalent stress value of 294 MPa at measurement point number 7 and a minimum equivalent stress value of 54 MPa at measurement point number 5. As the loading period began, the stress at each measurement point changed steadily in the same direction. However, when the load reached 350 kN, the stress at measurement points 3, 4, and 6 changed from tensile to compressive due to the destruction of the tie rods at the top layer of the BC surface. This led to an increase in internal force in the tie rods of the second layer. The top tie rod on the BC surface was damaged, which caused an increase in the internal force of the second layer tie rod, and the ball of the draw bolt squeezed the dome cover. During the peak load, the stresses at measurement points 1, 2, 4, and 7 increased significantly. The increase in stress values at measurement points 1, 2, and 4 was related to the gradual increase in web tension, while the value at measurement point 7 increased steeply. Additionally, the stress value at measurement point 5 decreased, which indicated that the tie rods acted vertically on the compression rods, which were connected to them during the deformation of the tower, causing the bolts connected to the rods to be squeezed on the upper edges of the ball socket cover plate. When loaded in the reverse direction, the maximum equivalent force appeared at measurement point 7 with a stress value of 130 MPa, while the minimum equivalent force appeared at measurement point 4 with a stress value of 10 MPa. There was a significant difference between the two. As the load increased, measurement points 5, 6, 7, and 8 slowly changed from tensile stress to compressive stress. This was because during the deformation period, the angle between the tie rod and the ball table cover plate gradually decreased, and the direction of the extrusion of the ball table cover plate changed. At a load of 300 kN, the specimen underwent significant deformation. The bolt around the edge of the ball hole was compressed, and the stress increased with increasing load. However, the stress value at point 5 no longer increased because the end of the web sleeve was tightly attached to the cover plate. As a result, the web and the cover plate could not further reduce the angle of the bolt ball on the lower edge of the ball hole, and the extrusion remained unchanged.
During forwards loading of the ball table pressure plate at the top layer of the BC face, the maximum equivalent stress occurred at measurement point 7 with a value of 99 MPa, while the minimum equivalent stress occurred at measurement point 8 with a value of 3 MPa. As the load reached its peak, the stress values at all other measurement points except 3 and 7 decreased due to the increased tension force borne by the tie rods of the third layer after the destruction of the tie rods of the fourth layer. The loss of the connecting effect of the tie rods led to a change from compressive to tensile stress at measurement point 6, which caused a larger displacement of the top layer of the C-column. This resulted in not only a pressure loss of the fourth layer compression rod but also out-of-plane instability of the cross-connected web rods. Additionally, the directions of action of the three effective rods were not in the same plane. During reverse loading, measurement point 6 underwent the highest equivalent stress of 399 MPa when the horizontal load reached 200 kN. As the load increased, subsequent stresses were relatively small. Before reaching 200 kN, the threads on the second layer tie bolts on the BC surface slipped, causing an increase in tension on the tie bolts in the top layer. This abrupt change caused changes from tensile to compressive stress at measurement points 5, 6, 7, and 8. When the load increased to 300 kN, the compression rod in the fourth layer broke from the weld, weakening the interaction between the tension and compression rods. This caused the cross rods to bulge outwards, increasing the angle between the tie rods and the cover plate and increasing the force in the out-of-plane direction along the cover plate. As a result, the stress at the measurement point changed to tensile stress. As the load increased, the stress values at measurement points 5, 6, and 7 decreased. The stresses at measurement points 6 and 7 changed back to compressive stresses, which was completely due to the out-of-plane instability of the cross-bar members under repeated loading and the reduction in force provided by plastic deformation of the tie rods.
To summarize, only a few measurement points were required to characterize the yield state, while the stress values were low at the majority of the measurement points. This indicated that the ball table pressure plate was able to meet the force requirements during repeated loads, which made the design reasonable. On the main BC stress surface, high-stress values were concentrated on the upper side of the middle and upper ball table cover plates as well as the lower side of the lower ball table cover plate. The stress distribution was complex and uneven, with significant differences between the maximum and minimum values.

4.2. Analysis of Internal Forces in the Abdominal Rod

In the space system of the tower, the web bar was the main component of the tower, and it played an important role in transferring the load. Thus, it was very important to obtain the distribution of the internal force of the web bar to study the performance of the tower in the space system. The web bars of BC and EF were selected for analysis.
The tower being studied in this paper is made up of multiple nodes, each with various components. By conducting a thorough analysis of the stress distribution of each joint component, we can identify the areas with high-stress levels. By optimizing the structural design of these high-stress components, we can significantly enhance the overall performance of the tower.

4.2.1. Analysis of Internal Forces in Inclined Web Bars

Figure 6 presents the distribution of internal forces in the inclined web rods on the BC surface. In Figure 6a, it is evident that during the initial stages of forwards loading, the internal force of each web rod was proportional to the load when it was small. As the load continued to increase to 350 kN, sudden decreases in the internal force of the tie rod in the fourth layer were observed, and the internal force of the tie rod in the first layer also decreased significantly when the load reached its peak value. This was because the tie rod disconnected from the welding seam of the sealing plate, and the web was no longer subjected to tensile force. The inner force of the first layer tie rod was also due to the plastic deformation of the rod, and the strain gauges measured the strain data. During reverse loading, the values of the internal force of the compression rods on the second, third, and fourth layers remained almost unchanged. This was similar to the reduction in the internal force of the compression rod under the top layer of the BC surface. This was due to the coordination of the deformation of the B column. When the load reached its peak value, the values of the internal force of the second layer of tie rods and compression rods suddenly changed. The previous values of the internal forces on the second layer of tie rods were very small, indicating that they were not involved in the transfer of force. The tower had many web rods, which was a typical superstatic structure. As the horizontal load increased, the various rods involved in the work of the tower constantly changed. Under larger loads and deformations, the rods suddenly participated in the work and bore a larger tensile force. It even shared the internal forces of other tie rods as shown in Figure 6b. In the figure, the value of the tensile force of the tie rods in the third layer decreased, as this force was now shared by newly involved rods. After calculating the values of the internal forces of various faces loaded in reverse, the tower twisted when reaching the peak load. The direction of the force on the tie rods in the BC face was not parallel, and the second layer of compression rods tended to stretch more than the other rods, resulting in a decrease in pressure.
Figure 7 shows a diagram of the internal force distribution of the inclined web bar at the EF surface. In Figure 7a, it is evident that there was a significant and sudden change in the values of the internal force of the tension bar in the second layer and the compression bar in the third layer during the forwards loading process. The pressure of the compression bar in the third layer decreased abruptly when the load was increased to 350 kN. This was because during the reverse loading process in the previous cycle, the bar detached from the ball due to the high-strength bolts. Consequently, tension was converted into compression in the positive loading case, and the bar was no longer supported, resulting in a loss of compression. When the load reached its peak value, the internal force of the tie rod of the second layer abruptly increased. This can be attributed to the bearing capacity of the tower reaching its peak value before the plasticity of the frame fully developed, which resulted in larger overall deformation. The original rod did not participate in the work due to processing errors, but with sufficient tensile space, it began to be stressed. Figure 7b shows that under reverse loading, the third layer of tie rods initially bore tension from the 200 kN horizontal force. As the load increased, the tensile force became zero because of processing errors that prevented the rods from initially participating in the work. With the increases in horizontal load and displacement, the rods eventually started to participate in the transmission of force, but their force was very small due to the destruction of the bolt wire fasteners, leading them to stop the work. When the load was raised to 350 kN, the pressure of the compression bar on the third floor decreased. This was because the tie bar that passed across the compression bar no longer transmitted tension. As a result, the two columns of E and F in the third floor position were not restrained by the tie bar, leading to less compression on the bar and lower pressure.
Due to the initial failure of some members of the EF surface, the connection between column E and column F was lost, resulting in an unequal transmission of force. Column F deformed more than the remaining tower columns, causing the tower to twist clockwise, which led to an increase in the force of the AB surface tie rod until it was destroyed. The failure mode is mainly due to the fracture failure of the weld at the sealing plate of the inclined web member, and the slippage failure of the high-strength bolt thread is relatively less. The thread failure occurs in the elastic stage and the elastic–plastic stage. At this point, the tensile force of the oblique belly rod is far less than the tensile strength of the high-strength bolt. The main reason for the failure is that the high-strength bolt is screwed into the bolt ball with insufficient depth, and the thread bite force does not meet the requirements, resulting in the high-strength bolt being pulled out after the thread is destroyed. On one hand, the failure of the weld is due to a machining error, and the inclined web member does not coincide with the bolt axis, resulting in uneven stress of the weld. On the other hand, the bending and torsion of the member will shear the weld. Under the complex stress state, the weld becomes brittle before reaching the design value of the tensile strength.

4.2.2. Analysis of Internal Forces in Transverse Web Bars

During the test, the top transverse web bar was next to the top cover plate and did not endure much stress. Therefore, it was not analyzed. Figure 8 shows the load-strain curve of the cross-web bar. As shown in Figure 8a, during forwards loading, the strain of the transverse web bar increased and decreased, with the highest strain in the transverse web bar of the third layer. During reverse loading, the strain of the transverse web bars in layers one and two increased uniformly, while the strain of layer three increased and then decreased. Figure 8b shows that before the tower yielded, there was almost no strain in the first and third transverse web rods of the EF face with increasing load. However, the transverse web rod in the second layer had a larger strain. After the tower yielded, the strain rate of each layer increased, and the transverse web bar in the second layer changed rapidly from tensile to compressive strain, indicating that the torsion behavior was more evident after the tower yielded.
When the strain distributions of the cross-web bars in each layer were compared, it was not clear that there was a stress pattern. The strain of the cross-web bars was minimal before the load reached its peak value, but it increased significantly after the tower yielded. The strain rate was at maximum at the peak load. Even though the cross-web rods of each layer did not reach the yield state, they were crucial structural components that made a critical contribution to the integrity of the tower.

4.3. P-Δ Hysteresis Curves

Figure 9 shows the P-Δ hysteresis curves of the tower prototype under low circumferential repeated loading. Prior to the yielding of the tower, all bars were in the elastic working stage, and the curves were linear with similar slopes and appeared to overlap. Once the load reached 288.6 kN, the tower yielded with a yield displacement of 26 mm. Next, it entered the displacement-controlled loading stage, and the slope of the curve gradually decreased. The residual deformation of the tower specimen increased, and the areas of the hysteresis loops gradually increased, leading to enhanced energy dissipation. After undergoing two-stage cyclic loading, the tower underwent its peak load of 376.2 kN during the first forwards loading with a displacement of 1.5 Δy. This peak load corresponded to a displacement of 37 mm. As the loading displacement continued to increase, the load-carrying capacity of the tower gradually decreased. The hysteresis curve of the prototype had a reverse “S” shaped distribution, with obvious pinch shrinkage behavior. Slip greatly affected the test results due to the semi-rigid connection with the bolt ball at the nodes and columns of this tower. Consequently, the prototype underwent relatively large displacements when the load was small.

4.4. Skeleton Curves

The skeleton curve is a clear indicator of the bearing capacity, deformation, and ductility of a structure or member. Figure 10a depicts the skeleton curve of the prototype tower. The curves were symmetrically distributed in quadrants one and three, and they contained elastic working stages, elastic–plastic working stages, and descending stages during both forwards and reverse loading. Before the yielding of the pylon, the curve developed linearly in the forwards loading stage. At a load of 288.6 kN, the tower began to yield, and the slope of the graph gradually decreased. The prototype tower then entered the elastic–plastic stage and loading continued. As a result, the bearing capacity of the tower continued to increase until the loading displacement reached approximately 37 mm. At this point, the load reached its peak, and the curve started to descend. The reverse and forwards loading tests were basically the same before the prototype tower yielded. During the load control loading stage, the slope of the curve remained constant and grew linearly. When the loading displacement increased to 1.75 Δy, the load reached the ultimate load of the tower, which was 381.8 kN. The bearing capacity of the tower suddenly decreased, and the tower entered the destruction stage. The web bars broke, one after another, until the tower was destroyed.
When the skeleton curve of the PTJ-1 specimen in the tower made from steel tubes and concrete with split spherical nodes [37], which was studied previously by this group of researchers, was compared to the skeleton curve of the space system tower discussed in this paper, it was evident that both towers had the same node parameters. However, the bearing capacity and ductility of the space system tower were much larger than those of the planar system, and the slope was steeper in the initial stage. The fluctuations were also larger, and they decreased faster after yielding. This indicated that the initial stiffness at the node of the space system tower was larger, which led to a better bearing capacity. However, it underwent less plastic deformation, and its stiffness decreased faster.

4.5. Ductility

As per the regulations outlined in “Specification for seismic test of buildings” [38,39,40], once the load reaches 85% of its maximum capacity, the displacement is considered the ultimate displacement. Table 3 displays the results of the calculations of the displacement ductility coefficient.
Based on the results in the table, the displacement ductility coefficient of the tower was 2.38 when subjected to thrust and 2.27 when subjected to tension. The average displacement ductility coefficient was 2.33, indicating that the tower was not very ductile and that the structure had limited deformation capacity in the later stages of damage.
The material used to design the tower in this paper is steel structure material. In the future, this study will explore the possibility of replacing the material with high ductile steel, such as Q345 or Q460. Alternatively, the study will adopt a multi-level stiffness design to make the stiffness distribution of the structure more uniform, thereby enhancing its ductility.

4.6. Strength and Stiffness Degradation

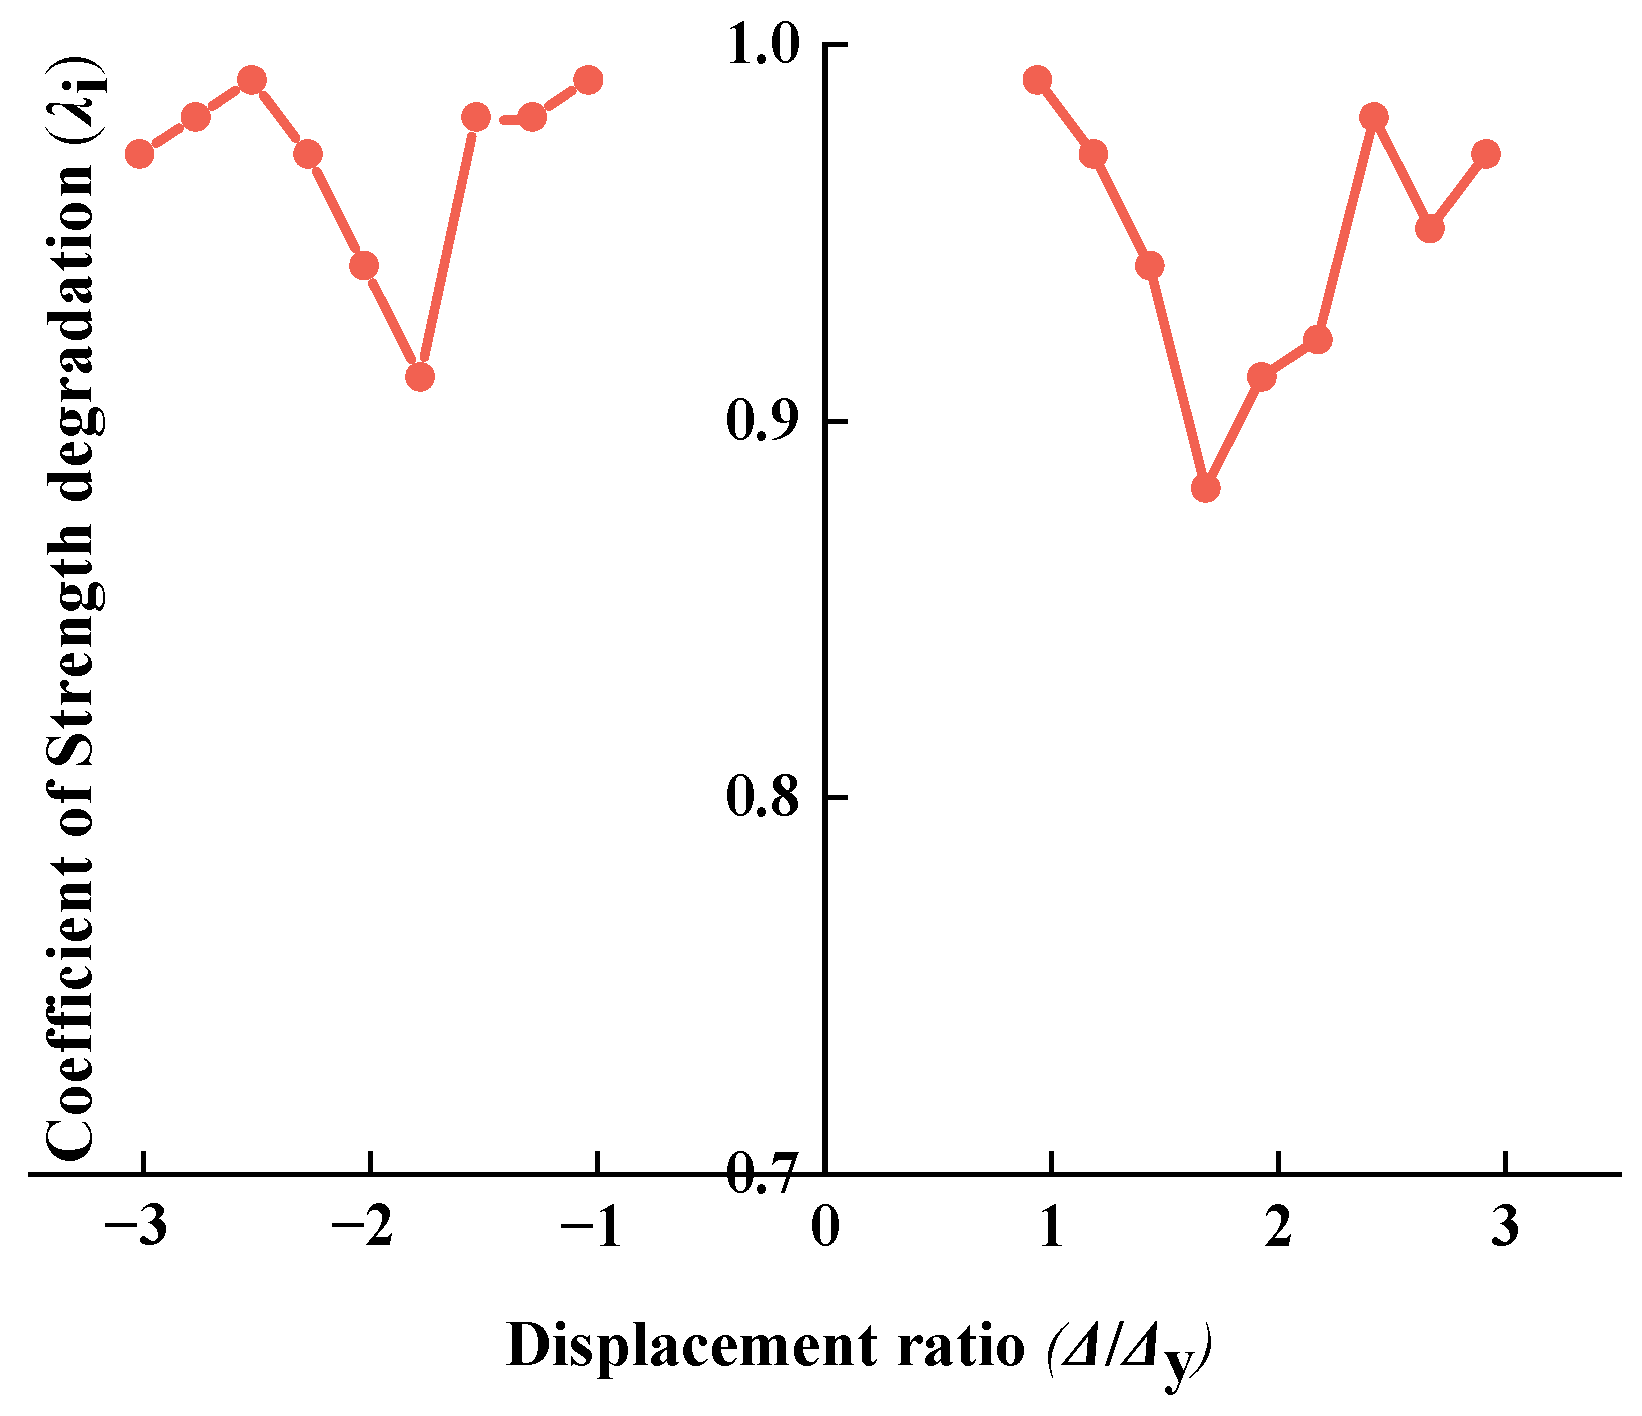
4.6.1. Strength Degradation

The strength degradation coefficient λ expresses the loss of load bearing capacity of the tower under cyclic loading. Figure 10 displays the strength degradation curve calculated from Equation (1).
λ i = F j i F j i 1
where F j i is the load value at the peak point of the i-th cycle at the j-th level of loading and F j i 1 is the load value at the peak point of the i − 1th cycle at the j-th level of loading.
Based on the data in Figure 11, it is evident that the 1.75 Δy loading level correlated with the most significant strength degradation. Moreover, it appears that forwards loading caused more severe strength degradation than reverse loading at the same loading level. Additionally, the strength degradation during forwards loading was more unstable across different loading levels. Further analysis revealed that during the initial forwards loading to the 1.5 Δy loading level, three diagonal web rods of the second layer and the first layer of the BC face successively broke at the weld seam of the sealing plate. This damaged the integrity of the tower rod system, substantially weakening the bearing capacity of the tower. Damage to the inclined web rods occurred during the forwards loading process, which explains why the strength degradation was more significant during forwards loading. The strength degradation during the reverse loading process was also apparent, indicating that the working capacity of the rods under pressure was greatly affected after they were strained.

4.6.2. Stiffness Degradation

The degree of stiffness degradation of the specimen was measured using the average of the cut-line stiffness K i of the specimen. The cut-line stiffness was calculated as shown in Equation (2). Figure 12 shows the stiffness degradation of the specimen.
K i = + F i + F i + Δ i + Δ i
where +Fi and −Fi are the peak loads in the direction of thrust and tension under the cycle of the i-th level and + Δ i and Δ i are the peak displacements in the direction of thrust and tension under the cycle of the i-th level.
Upon analyzing Figure 12, it was evident that the cut-line stiffness of the tower decreased from 11.2 kN/mm at yield to 4.4 kN/mm, displaying an obvious loss of stiffness. The rate of loss of stiffness differed across various loading levels, which could be attributed to the elastic–plastic stage that the bar entered after the tower yielded during cyclic loading. Although the tower had residual deformation during the cyclic process, the irrecoverable deformation was relatively small, resulting in minimal loss of bearing capacity. As a result, the stiffness degradation during the 1.0 Δy and 1.25 Δy loading levels was more gradual. However, after reaching the peak load-carrying capacity of the tower and undergoing three cycles of the 1.5 Δy loading stage, three inclined web rods were pulled off the weld seam of the sealing plate on the BC face, one after another. Under the positive load, two of the web rods underwent tensile damage, ultimately leading to the weakening of the integrality of the tower and a significant reduction in the peak carrying capacity at the next level of loading. Consequently, stiffness degradation was evident.

4.7. Energy Consumption Capacity

According to the building seismic testing regulations, the energy dissipation coefficient Ε was used to evaluate the energy dissipation capacity of the tower structure. Figure 13 shows the E-Δ curve of the tower.
Figure 13 shows that the energy dissipation coefficient generally increased as the loading displacement increased. After the specimen yielded, it began to enter the elastic–plastic stage, and the residual deformation of the structure increased significantly. At the same time, the hysteresis loop area, equivalent viscous damping coefficient, and energy dissipation coefficient increased. As the web member of the specimen continued to be destroyed, the force transmitted by the loading plate increased, and it was transmitted along the column body to the column foot. The energy absorbed by the column through deformation increased. The figure displayed a noticeable cusp during the 1.75 Δy loading stage where the bearing capacity of the tower began to decline. During this stage, while the web bars in the middle layer of the BC and EF surfaces were damaged, the internal force of the frame of the tower was redistributed. Through the deformation of the tower column, force coordination continued to transfer from the middle layer to the bottom layer. As a result, the web bars in the first layer of the AB and EF surfaces became disconnected, one after another, in the sealing plate welding joints, and the deformation of the tower column was visible to the unaided eye. During this process, the tower column underwent significant residual deformation, and there was considerable plastic development that absorbed a very large amount of energy. Subsequently, the curve trend indicated that the energy consumption capacity of the tower increased slowly with continued loading, and the energy consumption capacity of the tower was poor.

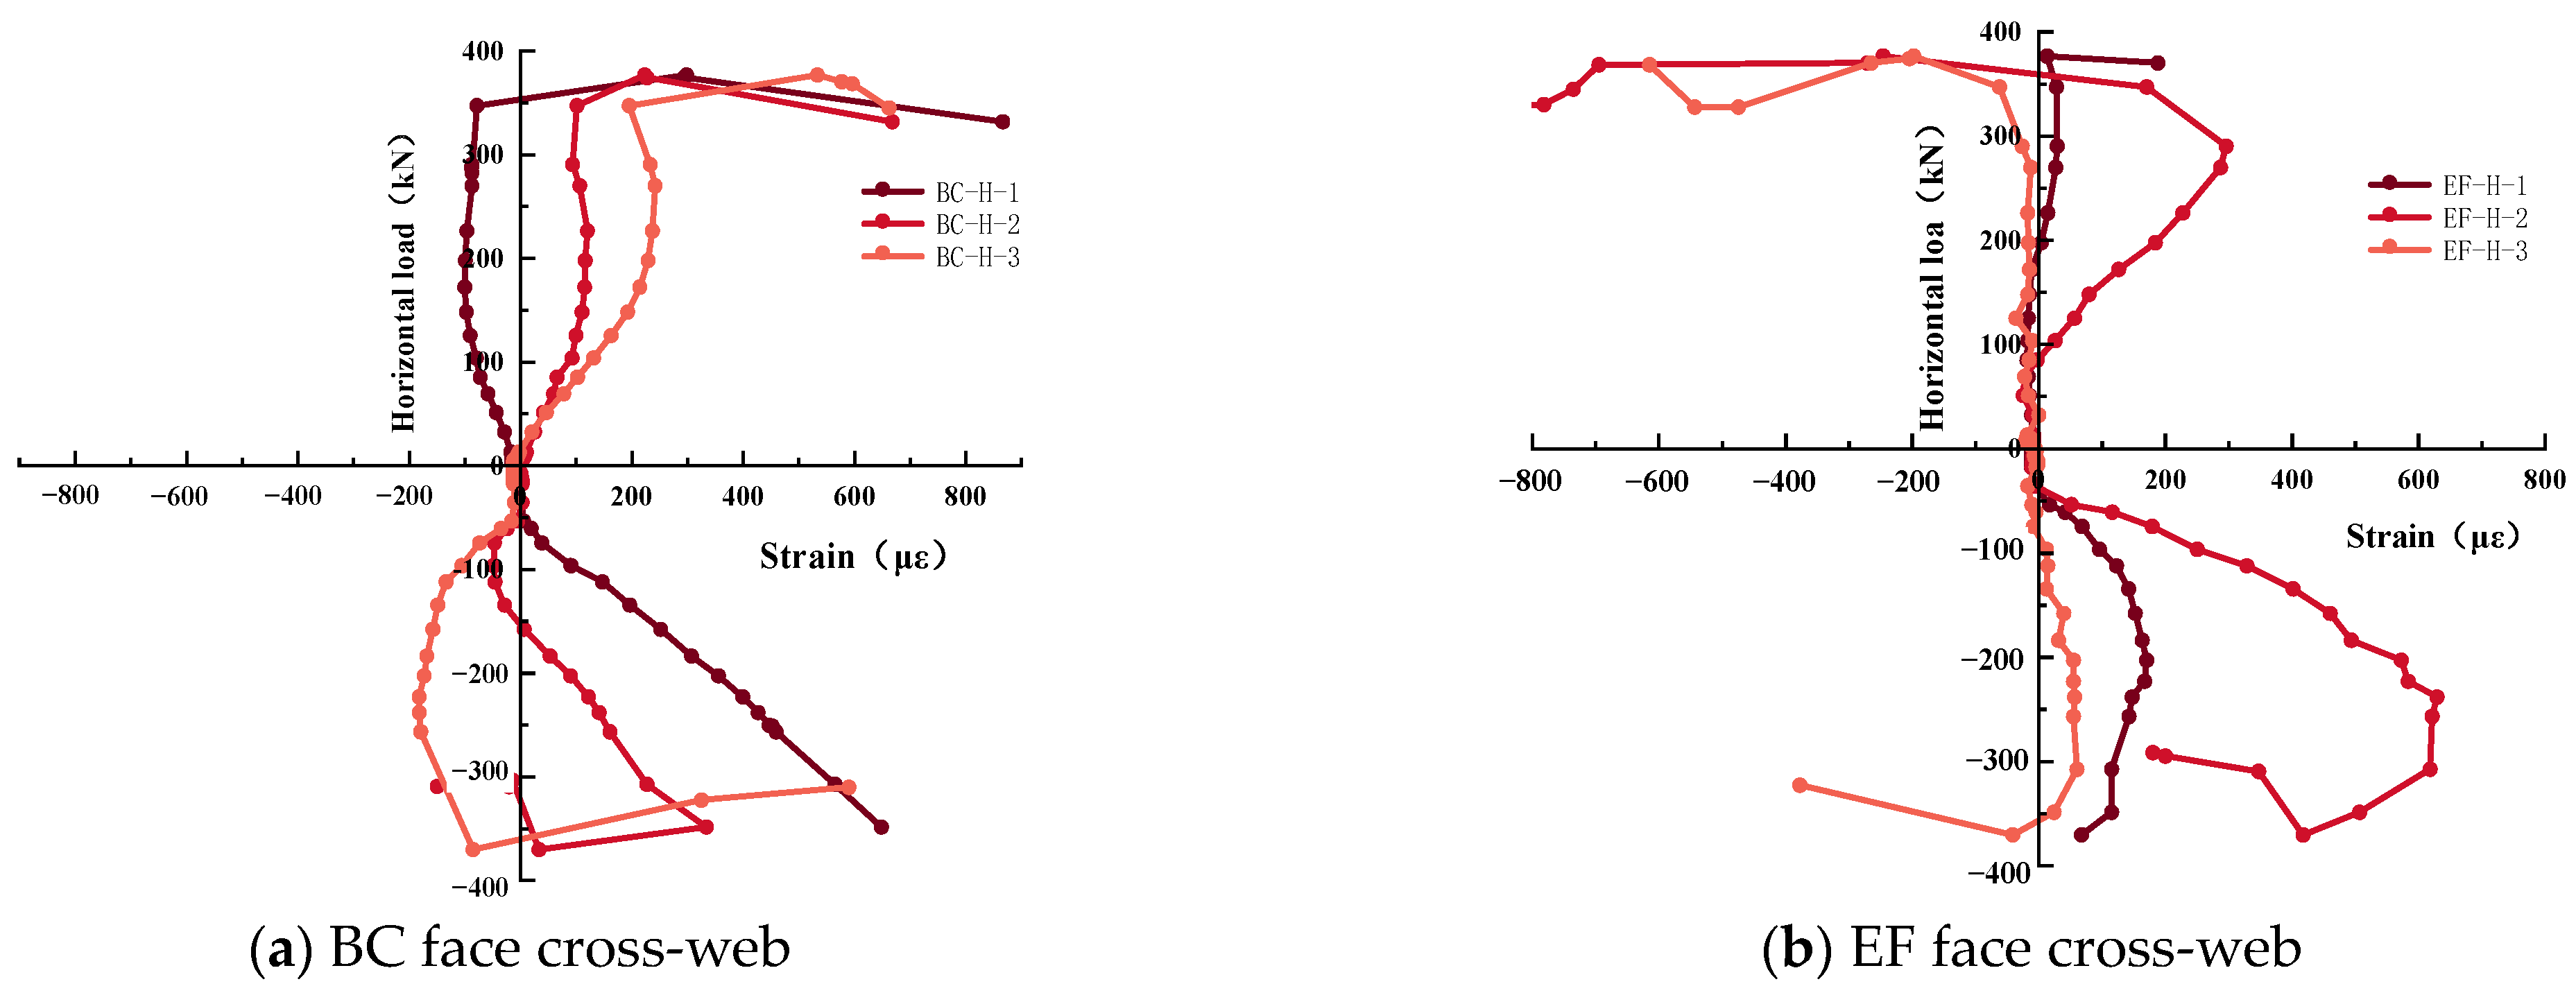
4.8. Tower Column Load–Strain Relationship

To understand how the tower columns of the prototype reacted to low circumferential repeated loading, we analyzed the force state and strain law. We focused on the strains along the loading direction of columns A, B, and C, as they underwent greater force in that direction. Our findings are presented in Figure 14, which shows the load–strain (P-με) relationship curves for these columns.
During loading, the curve for column A increased linearly. Comparing the slope of the curve at measurement point 1 with the other points shows that it was noticeably smaller. Additionally, the deformation rate at the foot of the column was the largest under the same load. As the forwards load increased to 288.6 kN, the strain at measurement point 1 reached 1208 με. At this point, the slope of the curve decreased slightly, and the column foot entered the elastic–plastic stage. Loading was then changed to displacement control, causing the strain growth rate to become larger. When the peak load was reached, the strain reached more than 1800 με, which was much larger than that of the other points. However, the elastic–plastic working stage of the column lasted for a shorter period, and the column plasticity was not fully developed. Measurement points 2, 4, and 5 showed linear growth curves with a much smaller strain growth rate compared to measurement point 1. The column deformation was minimal, and the strains for the other measurement points were less than 1000 με except for measurement point 2, which did not reach its yield point at the peak load. Measurement point 3 showed consistently small strain levels throughout the test, but the strain state changed with increasing load level, resulting in a complex stress condition.
For column B, the curves were almost linear before reaching the peak load capacity except for measurement point 1. The rate of growth of strain was slower compared to column A. At the maximum deformation, the strain at measurement point 1 was only 1200 με, which did not reach the yield point. There was a significant difference in strains at measurement points 2, 3, 4, and 5 before and after peak loading. This was because the fourth layer of tie rods on the BC face broke from the weld, causing the upper end of column B to be less loaded during forwards loading. Measurement point 1 was at the footing of the column, and it was almost unaffected by the upper part of the column. After the broken tie rods were withdrawn from work, the force transfer paths between the rods changed, and the internal forces were redistributed. This changed the working condition of the columns, causing them to bear more force than before, and the strains began to increase again.
Towers C and A both exhibited symmetrical deformations about the Y-axis. However, there was a slight difference in the strain at measurement point 3 in the middle of tower C. When subjected to a reversal of action, there was no sudden change in the stress state of measurement point 3 of tower A. In column C, the strains at all points, except for point 2, increased at the peak load carrying capacity, and the rate of change suddenly accelerated. This indicated that the forces at the far end of the column became larger after the tie bar broke. The strain at measurement point 2 suddenly decreased due to torsion on the tower. The compression rod in the reverse loading cycle caused damage to the tension thread, and as a result, the compression rod was in a compressed state during forwards loading. However, during the test process, the clearance between the bolt sleeve and the bolt ball increased.
According to the analysis of the deformation of the tower, the largest axial force occurred at the foot of the column. Column A, closest to the loading end, was subjected to the largest force, while the middle part of the column was in the tension–pressure junction area, leading to a complex stress condition. In general, the column of the tower made from steel tubes and concrete appeared to be in good stress condition before reaching the peak load of the tower.

5. Conclusions

In this paper, a new type of node is applied, and a prototype of a six-legged latticed concrete-filled steel tube wind power tower is designed. The top four layers were selected to make the scale specimens, and the low cyclic loading test was carried out. By analyzing the hysteresis curve, skeleton curve, strength and stiffness degradation curve of the tower specimen, the mechanical properties of the tower joints and rods in the space system are obtained. The strain measurement data are processed and analyzed, and the internal force distribution law of the tower specimen under low cyclic loading is mastered. The detailed conclusions are as follows:
(1)
The prototypes of the six-leg lattice wind tower made from steel tubes, concrete and spherical nodes had two main damage modes. These modes were loosening of high-strength bolts or thread slippage of the inclined web, and fracture of the weld at the end sealing plate of the inclined web.
(2)
The upper ball table plate underwent concentrated stresses on its upper side at measuring points 5, 6, 7, and 8. The lower ball table plate, in contrast, underwent concentrated stresses on its lower side at measuring points 1, 2, 3, and 4. For the middle ball table plate, the stresses were concentrated on the lower side of the plate near the loading end and the upper side of the plate far from the loading end. While only a few measuring points reached the yield state, most of the stress values were small, which indicated that the ball plate could meet the force requirements during low peripheral repetitive action. The maximum equivalent stress value is 294 MPa, which appears in the middle layer of the BC surface. This design was deemed reasonable.
(3)
The shape of the hysteresis curve for a six-leg lattice wind turbine tower made of steel tubes, concrete and split spherical nodes was affected by slip. It took on a reverse “S” shape, and as the load-carrying capacity of the prototype decreased, the P-Δ curve began to pinch more noticeably. This indicated that the stiffness of the tower decreased more severely during the damage stage, which led to a weaker ability to resist deformation compared to the early stage. The maximum energy dissipation appears in the 1.75 Δy loading stage. The peak load of the specimen can reach 376.2 kN, and the corresponding peak displacement is 37 mm.
(4)
The tower carried a load up to 288.6 kN before yielding, and it was displaced up to 26 mm before it reached its limit. Additionally, the tower withstood a forwards ultimate load of 376.2 kN, which demonstrated its strong stress performance. The skeleton curve showed that the six-leg lattice wind turbine tower made of steel tubes, concrete, and split sphere nodes had high initial stiffness and load capacity. However, the average ductility coefficient of 2.33 indicated weakness in the space system, with limited subsequent structural deformation capacity.
(5)
The towering column underwent the greatest strain at its base, and the top layer was affected by the loading plate constraint, which resulted in significant local deformation. The diagonal web bar on the intermediate layer bore the largest force under the same level of load and was prone to damage at an early stage. The maximum strain of the tower column foot is 1800 με, and the force of the inclined web member in the middle layer is the largest. The strain rate was highest at the peak load, which indicated the crucial role played by the transverse web bar in maintaining the structural integrity of the tower.

Author Contributions

Conceptualization, M.L.; writing—original draft preparation, H.L.; writing—review and editing, H.L. and M.L.; investigation, Y.W.; funding acquisition, Y.W. All authors have read and agreed to the published version of the manuscript.

Funding

This research was funded by Program for Young Talents of Science and Technology in Universities of Inner Mongolia Autonomous Region, grant number NJYT22068 and national natural science foundation by 51768056.

Data Availability Statement

All data generated or analyzed in this study are included in the published article.

Conflicts of Interest

The authors declare no conflict of interest.

References

  1. Meng, D.; Yang, S.; de Jesus, A.M.; Zhu, S.P. A novel Kriging-model-assisted reliability-based multidisciplinary design optimization strategy and its application in the offshore wind turbine tower. Renew. Energy 2023, 203, 407–420. [Google Scholar] [CrossRef]
  2. Beiter, P.; Cooperman, A.; Lantz, E.; Stehly, T.; Shields, M.; Wiser, R.; Telsnig, T.; Kitzing, L.; Berkhout, V.; Kikuchi, Y. Wind power costs driven by innovation and experience with further reductions on the horizon. Wiley Interdiscip. Rev. Energy Environ. 2021, 10, e398. [Google Scholar] [CrossRef]
  3. Tobin, I.; Jerez, S.; Vautard, R.; Thais, F.; Van Meijgaard, E.; Prein, A.; Déqué, M.; Kotlarski, S.; Maule, C.F.; Nikulin, G.; et al. Climate change impacts on the power generation potential of a European mid-century wind farms scenario. Environ. Res. Lett. 2016, 11, 034013. [Google Scholar] [CrossRef]
  4. Hernandez-Estrada, E.; Lastres-Danguillecourt, O.; Robles-Ocampo, J.B.; Lopez-Lopez, A.; Sevilla-Camacho, P.Y.; Perez-Sariñana, B.Y.; Jose, R. Dorrego-Portela. Considerations for the structural analysis and design of wind turbine towers: A review. Renew. Sustain. Energy Rev. 2021, 137, 110447. [Google Scholar] [CrossRef]
  5. Lantz, E.J.; Roberts, J.O.; Nunemaker, J.; DeMeo, E.; Dykes, K.L.; Scott, G.N. Increasing Wind Turbine Tower Heights: Opportunities and Challenges; NREL/TP-5000-73629; National Renewable Energy Lab. (NREL): Golden, CO, USA, 2019. [Google Scholar] [CrossRef]
  6. Lavassas, I.; Nikolaidis, G.; Zervas, P.; Efthimiou, E.; Doudoumis, I.N.; Baniotopoulos, C.C. Analysis and design of the prototype of a steel 1-MW wind turbine tower. Eng. Struct. 2003, 25, 1097–1106. [Google Scholar] [CrossRef]
  7. Negm, H.M.; Maalawi, K.Y. Structural design optimization of wind turbine towers. Comput. Struct. 2000, 74, 649–666. [Google Scholar] [CrossRef]
  8. Bazeos, N.; Hatzigeorgiou, G.D.; Hondros, I.D.; Karamaneas, H.; Karabalis, D.L.; Beskos, D.E. Static, seismic and stability analyses of a prototype wind turbine steel tower. Eng. Struct. 2002, 24, 1015–1025. [Google Scholar] [CrossRef]
  9. Deng, H.; Li, F.; Cai, Q.; Dong, J.; Fu, P. Experimental and numerical analysis on the slope change joint of a quartet-steel-tube-column transmission tower. Thin-Walled Struct. 2017, 119, 572–585. [Google Scholar] [CrossRef]
  10. Fitzgerald, B.; Sarkar, S.; Staino, A. Improved reliability of wind turbine towers with active tuned mass dampers (ATMDs). J. Sound Vib. 2018, 419, 103–122. [Google Scholar] [CrossRef]
  11. Seifi, H.; Javan, A.R.; Xu, S.; Zhao, Y.; Xie, Y.M. Design optimization and additive manufacturing of nodes in gridshell structures. Eng. Struct. 2018, 160, 161–170. [Google Scholar] [CrossRef]
  12. He, L.; Zhao, Y.; Lin, S. Experimental study on axially compressed circular CFST columns with improved confinement effect. J. Constr. Steel Res. 2018, 140, 74–81. [Google Scholar] [CrossRef]
  13. Huang, X.; Li, B.; Zhou, X.; Wang, Y.; Zhu, R. Geometric optimisation analysis of Steel–Concrete hybrid wind turbine towers. Structures 2022, 35, 1125–1137. [Google Scholar] [CrossRef]
  14. Wen, Y.; Liu, Z.; Xiong, W. Research on stress performance of universally wrapped assembled joints of lattice wind power tower with concrete-filled steel tube. Sci. Rep. 2023, 13, 1670. [Google Scholar] [CrossRef]
  15. Wen, Y.; Xu, G.; Wu, X.; Li, Z. Performance control analysis of concrete-filled steel tube sepa-rated spherical joint wind power tower. Struct. Eng. Mech. 2023, 87, 137–149. [Google Scholar] [CrossRef]
  16. Shao, L.F.; Zheng, R.J. Study on Large Wind Power Tower Structure Concept Optimization. Appl. Mech. Mater. 2011, 99, 911–918. [Google Scholar] [CrossRef]
  17. Shittu, A.A.; Mehmanparast, A.; Wang, L.; Salonitis, K.; Kolios, A. Comparative study of structural reliability assessment methods for offshore wind turbine jacket support structures. Appl. Sci. 2020, 10, 860. [Google Scholar] [CrossRef]
  18. Li, B.; Qiao, M.; Gao, C.Y. Static Behavior Study for Latticed Concrete-Filled Steel Tubular Wind Turbine Tower Joints. Appl. Mech. Mater. 2012, 166, 553–558. [Google Scholar] [CrossRef]
  19. Li, J.; Wang, G.; Li, Z.; Yang, S.; Chong, W.T.; Xiang, X. A review on development of offshore wind energy conversion system. Int. J. Energy Res. 2020, 44, 9283–9297. [Google Scholar] [CrossRef]
  20. Patil, A.; Jung, S.; Kwon, O.S. Structural performance of a parked wind turbine tower subjected to strong ground motions. Eng. Struct. 2016, 120, 92–102. [Google Scholar] [CrossRef]
  21. Dai, K.; Huang, Y.; Gong, C.; Huang, Z.; Ren, X. Rapid seismic analysis methodology for in-service wind turbine towers. Earthq. Eng. Eng. Vib. 2015, 14, 539–548. [Google Scholar] [CrossRef]
  22. Du, H.; Du, S.; Li, W. Probabilistic time series forecasting with deep non-linear state space models. CAAI Trans. Intell. Technol. 2023, 8, 3–13. [Google Scholar] [CrossRef]
  23. Yusuf, A.; Kiri, A.A.; Lawal, L.; Kiri, A.I. A hybrid conjugate gradient algorithm for nonlinear system of equations through conjugacy condition. In Proceedings of the Artificial Intelligence and Applications, Wuhan, China, 18–20 November 2023. [Google Scholar] [CrossRef]
  24. Arcos Jiménez, A.; Gómez Muñoz, C.Q.; García Márquez, F.P. Machine learning for wind turbine blades maintenance management. Energies 2017, 11, 13. [Google Scholar] [CrossRef]
  25. Gheisari, M.; Ebrahimzadeh, F.; Rahimi, M.; Moazzamigodarzi, M.; Liu, Y.; Dutta Pramanik, P.K.; Heravi, M.A.; Mehbodniya, A.; Ghaderzadeh, M.; Feylizadeh, M.R.; et al. Deep learning: Applications, architectures, models, tools, and frameworks: A comprehensive survey. CAAI Trans. Intell. Technol. 2023, 8, 581–606. [Google Scholar] [CrossRef]
  26. Luo, C. KELL: A kernel-embedded local learning for data-intensive modeling. Artif. Intell. Appl. 2024, 2, 38–44. [Google Scholar] [CrossRef]
  27. Li, Z.; Li, S. Recursive recurrent neural network: A novel model for manipulator control with different levels of physical constraints. CAAI Trans. Intell. Technol. 2023, 8, 622–634. [Google Scholar] [CrossRef]
  28. Alkhaled, L.; Khamis, T. Supportive Environment for Better Data Management Stage in the Cycle of ML Process. Artif. Intell. Appl. 2023. [Google Scholar] [CrossRef]
  29. Ju, Y.Z.; Li, J.Y.; Wang, D.H.; Bai, J.F. Study of the ultimate load capacity of K-type tube-gusset plate connections. Int. J. Steel Struct. 2018, 18, 596–607. [Google Scholar] [CrossRef]
  30. Yang, X.; Gao, Y.; Fang, C.; Zheng, Y.; Wang, W. Deep learning-based bolt loosening detection for wind turbine towers. Struct. Control Health Monit. 2022, 29, e2943. [Google Scholar] [CrossRef]
  31. Way, A.C.; Van Zijl, G.P.A.G. A study on the design and material costs of tall wind turbine towers in South Africa. J. S. Afr. Inst. Civ. Eng. 2015, 57, 45–54. [Google Scholar] [CrossRef]
  32. Hu, Y.; Baniotopoulos, C.; Yang, J. Effect of internal stiffening rings and wall thickness on the structural response of steel wind turbine towers. Eng. Struct. 2014, 81, 148–161. [Google Scholar] [CrossRef]
  33. Wang, Q.; Wang, C.S.; Wang, X.X. Research progress on steel-concrete composite bridge towers. Adv. Mater. Res. 2011, 250, 2392–2395. [Google Scholar] [CrossRef]
  34. Wang, Q.; Wang, X.X.; Wang, C.S.; Xu, Y. Experimental Research on Steel-Concrete Composite Bridge Towers with Different Cross Sections. Adv. Mater. Res. 2011, 255, 1295–1298. [Google Scholar] [CrossRef]
  35. Jun, C.; Miao, Z.; Zhu, H.; Xu, F.; Shao, Z.; Ding, F.; Xiang, P. Study on mechanical properties of wind turbine tower reinforced by ribbed interlayer. J. Constr. Steel Res. 2024, 212, 108256. [Google Scholar] [CrossRef]
  36. Mercuri, M.; Pathirage, M.; Gregori, A.; Cusatis, G. Influence of self-weight on size effect of quasi-brittle materials: Generalized analytical formulation and application to the failure of irregular masonry arches. Int. J. Fract. 2023. [Google Scholar] [CrossRef]
  37. Dimopoulos, C.A.; Gantes, C.J. Experimental investigation of buckling of wind turbine tower cylindrical shells with opening and stiffening under bending. Thin-Walled Struct. 2012, 54, 140–155. [Google Scholar] [CrossRef]
  38. Qu, S.; Wu, X.; Sun, Q. Experimental study and theoretical analysis on the ultimate strength of high-strength-steel tubular K-Joints. Thin-Walled Struct. 2018, 123, 244–254. [Google Scholar] [CrossRef]
  39. Lu, Y.; Liu, K.; Wang, Z.; Tang, W. Dynamic behavior of scaled tubular K-joints subjected to impact loads. Mar. Struct. 2020, 69, 102685. [Google Scholar] [CrossRef]
  40. JGJ/T2015; Specification for Seismic Test of Buildings. Ministry of Housing and Urban-Rural Development of the People’s Republic of China: Beijing, China, 2015. (In Chinese)
Figure 1. Scale model of the tower.
Buildings 14 00965 g001
Figure 2. Specimen loading device.
Buildings 14 00965 g002aBuildings 14 00965 g002b
Figure 3. The loading system.
Buildings 14 00965 g003
Figure 4. Pylon damage patterns.
Buildings 14 00965 g004aBuildings 14 00965 g004bBuildings 14 00965 g004c
Figure 5. Equivalent force distribution of the ball table cover plate.
Buildings 14 00965 g005
Figure 6. Distribution of the internal force of the web bar inclined at the BC face.
Buildings 14 00965 g006
Figure 7. Distribution of internal forces in the inclined web bar at the EF face.
Buildings 14 00965 g007
Figure 8. Load-strain diagram of the cross-web bar.
Buildings 14 00965 g008
Figure 9. Hysteresis curves.
Buildings 14 00965 g009
Figure 10. Skeleton curves.
Buildings 14 00965 g010
Figure 11. Strength degradation curves.
Buildings 14 00965 g011
Figure 12. Stiffness degradation curve.
Buildings 14 00965 g012
Figure 13. E-Δ curve.
Buildings 14 00965 g013
Figure 14. P-με relationship curves for three columns.
Buildings 14 00965 g014
Table 1. Main parameters of the specimens.
SpecimenSpecimen Parameters (mm)
Pillar SectionDiagonal SectionTower HeightLifting SectionLength of PackageSteel Ball 1 DiameterSteel Ball 2 Diameter
TJΦ108 × 5Φ32 × 33335Φ188 × 53006070
Table 2. Mechanical properties of steel and concrete.
Components and Materialsfy (MPa)fu (MPa)Es (MPa)fcu (MPa)Ec (MPa)
Pylon3254852.02 × 105--
Web member3384842.03 × 105--
Concrete C40---43.13.42 × 104
Table 3. Displacements and ductility coefficients of specimens.
PylonForwardsReverse
Yield displacement Δy (mm)2626
Yield load Fy (kN)288.6288.6
Peak displacement Δmax (mm)36.938.2
Peak load Fmax (kN)376.2381.8
Limit displacement Δu (mm)6259
Ultimate load Fu (kN)319.8324.5
Displacement ductility factor μ 2.382.27
Average ductility factor μ 2.33
Disclaimer/Publisher’s Note: The statements, opinions and data contained in all publications are solely those of the individual author(s) and contributor(s) and not of MDPI and/or the editor(s). MDPI and/or the editor(s) disclaim responsibility for any injury to people or property resulting from any ideas, methods, instructions or products referred to in the content.

