Article

Research on Optimization Design of Prefabricated ECC/RC Composite Coupled Shear Walls Based on Seismic Energy Dissipation

School of Transportation and Environment, Shenzhen Institute of Information Technology, Shenzhen 518172, China
*
Author to whom correspondence should be addressed.
Buildings 2024, 14(4), 951; https://doi.org/10.3390/buildings14040951
Submission received: 25 February 2024 / Revised: 15 March 2024 / Accepted: 27 March 2024 / Published: 30 March 2024

Abstract

:
This study explores an advanced prefabricated composite structure, namely ECC/RC composite shear walls with enhanced seismic performance. This performance enhancement is attributed to the strategic use of engineered cementitious composites (ECC) known for their superior ductility. The study conducts both experimental and numerical simulation analyses to scrutinize the seismic energy absorption capabilities of this innovative structure. Emphasis is placed on critical aspects, such as the optimal deployment areas for ECC within composite coupling beams and shear walls, the grade of ECC strength, the proportion of stirrups in coupling beams, and the caliber of longitudinal reinforcement. Through finite element analysis, this research quantitatively assesses the impact of these variables on seismic energy dissipation, incorporating evaluations of load–displacement hysteretic behaviors and the energy dissipation potential of ECC/RC shear wall samples. The findings suggest the optimal ECC application in the coupling beams, and within a 14% structural height at the base of shear walls. Recommended design parameters include an ECC strength grade of E40 (40 MPa), longitudinal reinforcement of HRB400 (400 MPa), and a stirrup ratio in coupling beams of 0.5%.

1. Introduction

The advancement of intelligent science and technology has become a pivotal strategy globally. As economies and societies evolve, traditional industries, characterized by high resource consumption, environmental pollution, and labor intensity, are under increasing pressure to transform and upgrade. In the construction sector, conventional on-site pouring methods are beset with challenges, including substantial resource consumption, low efficiency, resource wastage, quality assurance difficulties, and environmental degradation. To address these challenges, the industrialization of prefabricated building construction has gained increasing attention and adoption. This method represents a modern approach in the construction industry, characterized by design standardization, factory production, assembly construction, and intelligent, informatized management [1].
Prefabricated structural systems, encompassing concrete, steel, and timber structures, are extensively utilized. Among these, prefabricated concrete structures are predominantly employed in residential, educational, and office buildings. The prefabricated shear wall structure, in particular, is extensively used in high-rise buildings due to its lower resource consumption and environmental impact.
Recent research has focused on the mechanical properties, ductility, and durability of prefabricated concrete shear wall structures [2,3,4,5]. These studies have demonstrated that such structures possess an enhanced lateral stiffness and energy dissipation capacity, making them suitable for seismic regions. However, the connections between prefabricated components, especially horizontal connections, are crucial for seismic performance and warrant further attention.
Various horizontal connection methods in precast shear walls, such as grouting sleeve, constrained slurry anchor steel bar, and metal bellows slurry anchor steel bar connections, have been explored. In China, grouting sleeve connections are recommended as the most mature and effective reinforcement technology. However, these connections in prefabricated shear wall structures have shown limitations in seismic resistance compared to cast in situ structures. Peng et al. [6] conducted low-cycle repeated load tests on grouting sleeve-connected prefabricated shear wall specimens, revealing inferior stiffness and energy dissipation compared to cast in situ specimens. Brunesi et al. [7,8] investigated the seismic performance of a full-scale, two-story, lightly reinforced precast concrete wall panel structure connected by steel connectors and mortar, identifying the joints as the weakest structural elements. Similarly, studies by Qian et al. [9] and Wu et al. [10] indicated that despite mechanical similarities to cast-in-place structures, the lower ductility of joints in prefabricated structures compromises their structural integrity and robustness. Qian et al. [11] observed significant damage to coupling beams in a three-story assembled shear wall concrete structure connected by mortar sleeves, although the story drift conformed to China’s high-rise building structure design code [12]. Typical earthquake damage in grouted sleeve-connected prefabricated shear wall structures includes loss of coupling beam function, concrete destruction at the compression side wall base, and reinforcement yielding or slipping out of the concrete [13,14,15,16].
Currently, prefabricated components in concrete shear wall structures are primarily used for vertical load-bearing and enclosure systems, while lateral force-resisting shear wall members are often constructed in situ. This approach results in a low prefabrication and assembly rate, complicating construction processes. To enhance the widespread adoption and application of prefabricated concrete shear wall structures, it is imperative to strengthen and guarantee their seismic performance effectively.
Designing structures for seismic resistance involves reducing seismic demand based on the ductility level permissible within the structural system. Special attention must be paid to ensuring that critical structural parts can withstand the required nonlinear deformation without significant strength loss [17]. Therefore, employing materials with high ductility or damping, such as engineered cementitious composites (ECC), in key stress and energy dissipation areas can enhance the structure’s seismic energy dissipation capacity.
ECC, a material with high ductility and comparable compressive strength to concrete, exhibits exceptional tensile strain hardening capability [18]. It also has superior damping and energy dissipation capacities [19], effectively absorbing energy input into the structure. ECC’s tensile strain ranges from 3 to 7% [20,21,22] and it forms dense cracks with spacing as narrow as 3 to 6 mm post-cracking [23,24,25]. Additionally, ECC outperforms concrete in shear bearing and deformation resistance [26] and exhibits excellent crack width control, deformability, self-healing ability, and damping characteristics in various structural components [27,28,29,30], making it an ideal seismic material.
Zhang et al. [31] studied ECC coupling beams’ shear strength and seismic resistance, finding superior performance in these aspects. Suryanto et al. [32] compared the earthquake resistance of external ECC beam–column joints to those without ECC, with ECC joints showing better performance. Cai et al. [33] investigated the ductility, stiffness, and energy dissipation of ECC/RC composite frames compared to RC frames, noting significant improvements in the ECC/RC frames. Khan et al. [34,35] demonstrated that ECC beam–column joints without shear reinforcement still surpassed the code-specified shear resistance. Ye et al. [36] and Yang et al. [37] conducted low cyclic loading experiments on RECC-coupled shear walls, finding that using ECC materials in cast in situ connection areas significantly improved the seismic energy dissipation capacity compared to specimens without ECC. Yang et al. [38] studied the principles of stress and energy dissipation under low cyclic loading through finite element analysis, revealing the failure mechanisms and internal force distribution in prefabricated ECC/RC shear walls. However, to date, no study on the optimization design of prefabricated ECC/RC composite coupled shear walls based on seismic energy dissipation mechanism or comprehensive quantitative analysis has been conducted.
In this paper, the seismic energy dissipation performance of the prefabricated ECC/RC composite coupled shear wall structure will be studied by combining experimental and numerical analysis. The optimal design will be studied based on the seismic energy dissipation mechanism. Through comprehensive numerical quantitative analysis, the optimization design suggestions will be put forward. This study will fill the gap in the field of seismic energy dissipation optimization design of the prefabricated ECC/RC composite coupled shear walls. This work is original and novel and has great scientific and engineering significance.

2. Experimental Investigation

2.1. Specimen Design

For the experimental study, a half-scale, two-story spatial structure representing a prefabricated ECC/RC composite shear wall structure was conceived. This complex assembly comprises eight prefabricated flange walls, eight web walls, four composite coupling beams, eight lateral beams, four bases, and six composite floors. The design is inspired by the original wall system of Zhongnan Century City in Jiangsu Province, China, aligning with the ‘Technical specification for precast concrete structures’ [39]. In strategic locations, such as the juncture of the coupling beam and the prefabricated concrete wall pier, and atop the composite coupling beams, ECC material is meticulously placed, as depicted in Figure 1. The visual representation (Figure 1) deliberately omits the reinforcement details of the prefabricated elements to maintain clarity. Table 1 enumerates the identification and reinforcement specifics of these components. Dimensions of coupling beams are noted, with a length of 920 mm, whereas the heights of the precast concrete section and the cast-in-place ECC measure 150 mm and 100 mm, respectively, resulting in a span-to-height ratio of 3.68. The beam–wall connection zone dimensions vary across two layers, with the first and second layers measuring 160 mm in width and 450 mm and 350 mm in height, respectively. Vertical integration of the steel bars within the precast walls is achieved through steel sleeves and expansive cement mortar. Meanwhile, horizontal connections—encompassing flange to web wall, beam to wall, beam to floor, and wall to floor—are executed with either cast-in-place concrete or ECC, ensuring structural cohesion.

2.2. Material Properties

The examination of material properties reveals distinct compressive strengths for the concrete used in the precast elements and the concrete used in situ, recorded at 36.8 MPa and 32.6 MPa, respectively. Engineered cementitious composites (ECC) exhibit a compressive strength of 35.2 MPa and a tensile strength of 4.6 MPa, alongside an ultimate tensile strain of 3.4%. The reinforcing bars, HPB300 and HRB400, demonstrate yield strengths of 309 MPa and 416 MPa, respectively. The mechanical characteristics of both concrete and ECC, along with the reinforcing steel’s properties, are systematically cataloged in Table 2 and Table 3.

2.3. Testing Methodology

The specimen’s foundation is securely fastened to the structural laboratory ground using ground anchor screws passing through pre-designed holes. Annotations 8 and 9 in Figure 2 are the ground anchor screws and laboratory ground, respectively. Vertically, the structure’s axial bearing capacity is subjected to a 24% load via eight hydraulic jacks, which tension steel strands. Annotations 4 and 7 marked in Figure 2 are hydraulic jacks and steel strands, respectively. This force is then evenly distributed across the specimen’s summit through transfer beams (annotation 3 in Figure 2), as depicted in Figure 2’s schematic of the cyclic loading apparatus.
Horizontal cyclic loading is administered using a mechanical testing and simulation (MTS) system (annotation 2 in Figure 2), anchored to the reaction wall (annotation 1 in Figure 2) with a maximum force of 1000 kN. The horizontal load is transmitted to the end of the specimen through the threaded steel connecting rods, so that both thrust and tension can be applied, as illustrated in annotations 5 and 6 in Figure 2. The horizontal cyclic loading adopts the slow continuous loading method, and the loading rate is 0.5 mm/s [40]. Initially, in the specimen’s elastic phase prior to yielding, loading cycles are managed under load control, and are incremented by 50 kN until the anticipated yield load (Py) is reached, defined by the yield displacement (Δy). After yielding, loading cycles transition to displacement control, progressing through incremental stages of Δy, 2Δy, 3Δy, …. Each load level undergoes a single cycle, whereas each displacement level is subjected to three cycles. The cyclic loading sequence is detailed in Figure 3. Testing concludes when the load diminishes to 85% of the maximum load, at which point the specimen is deemed to have failed.

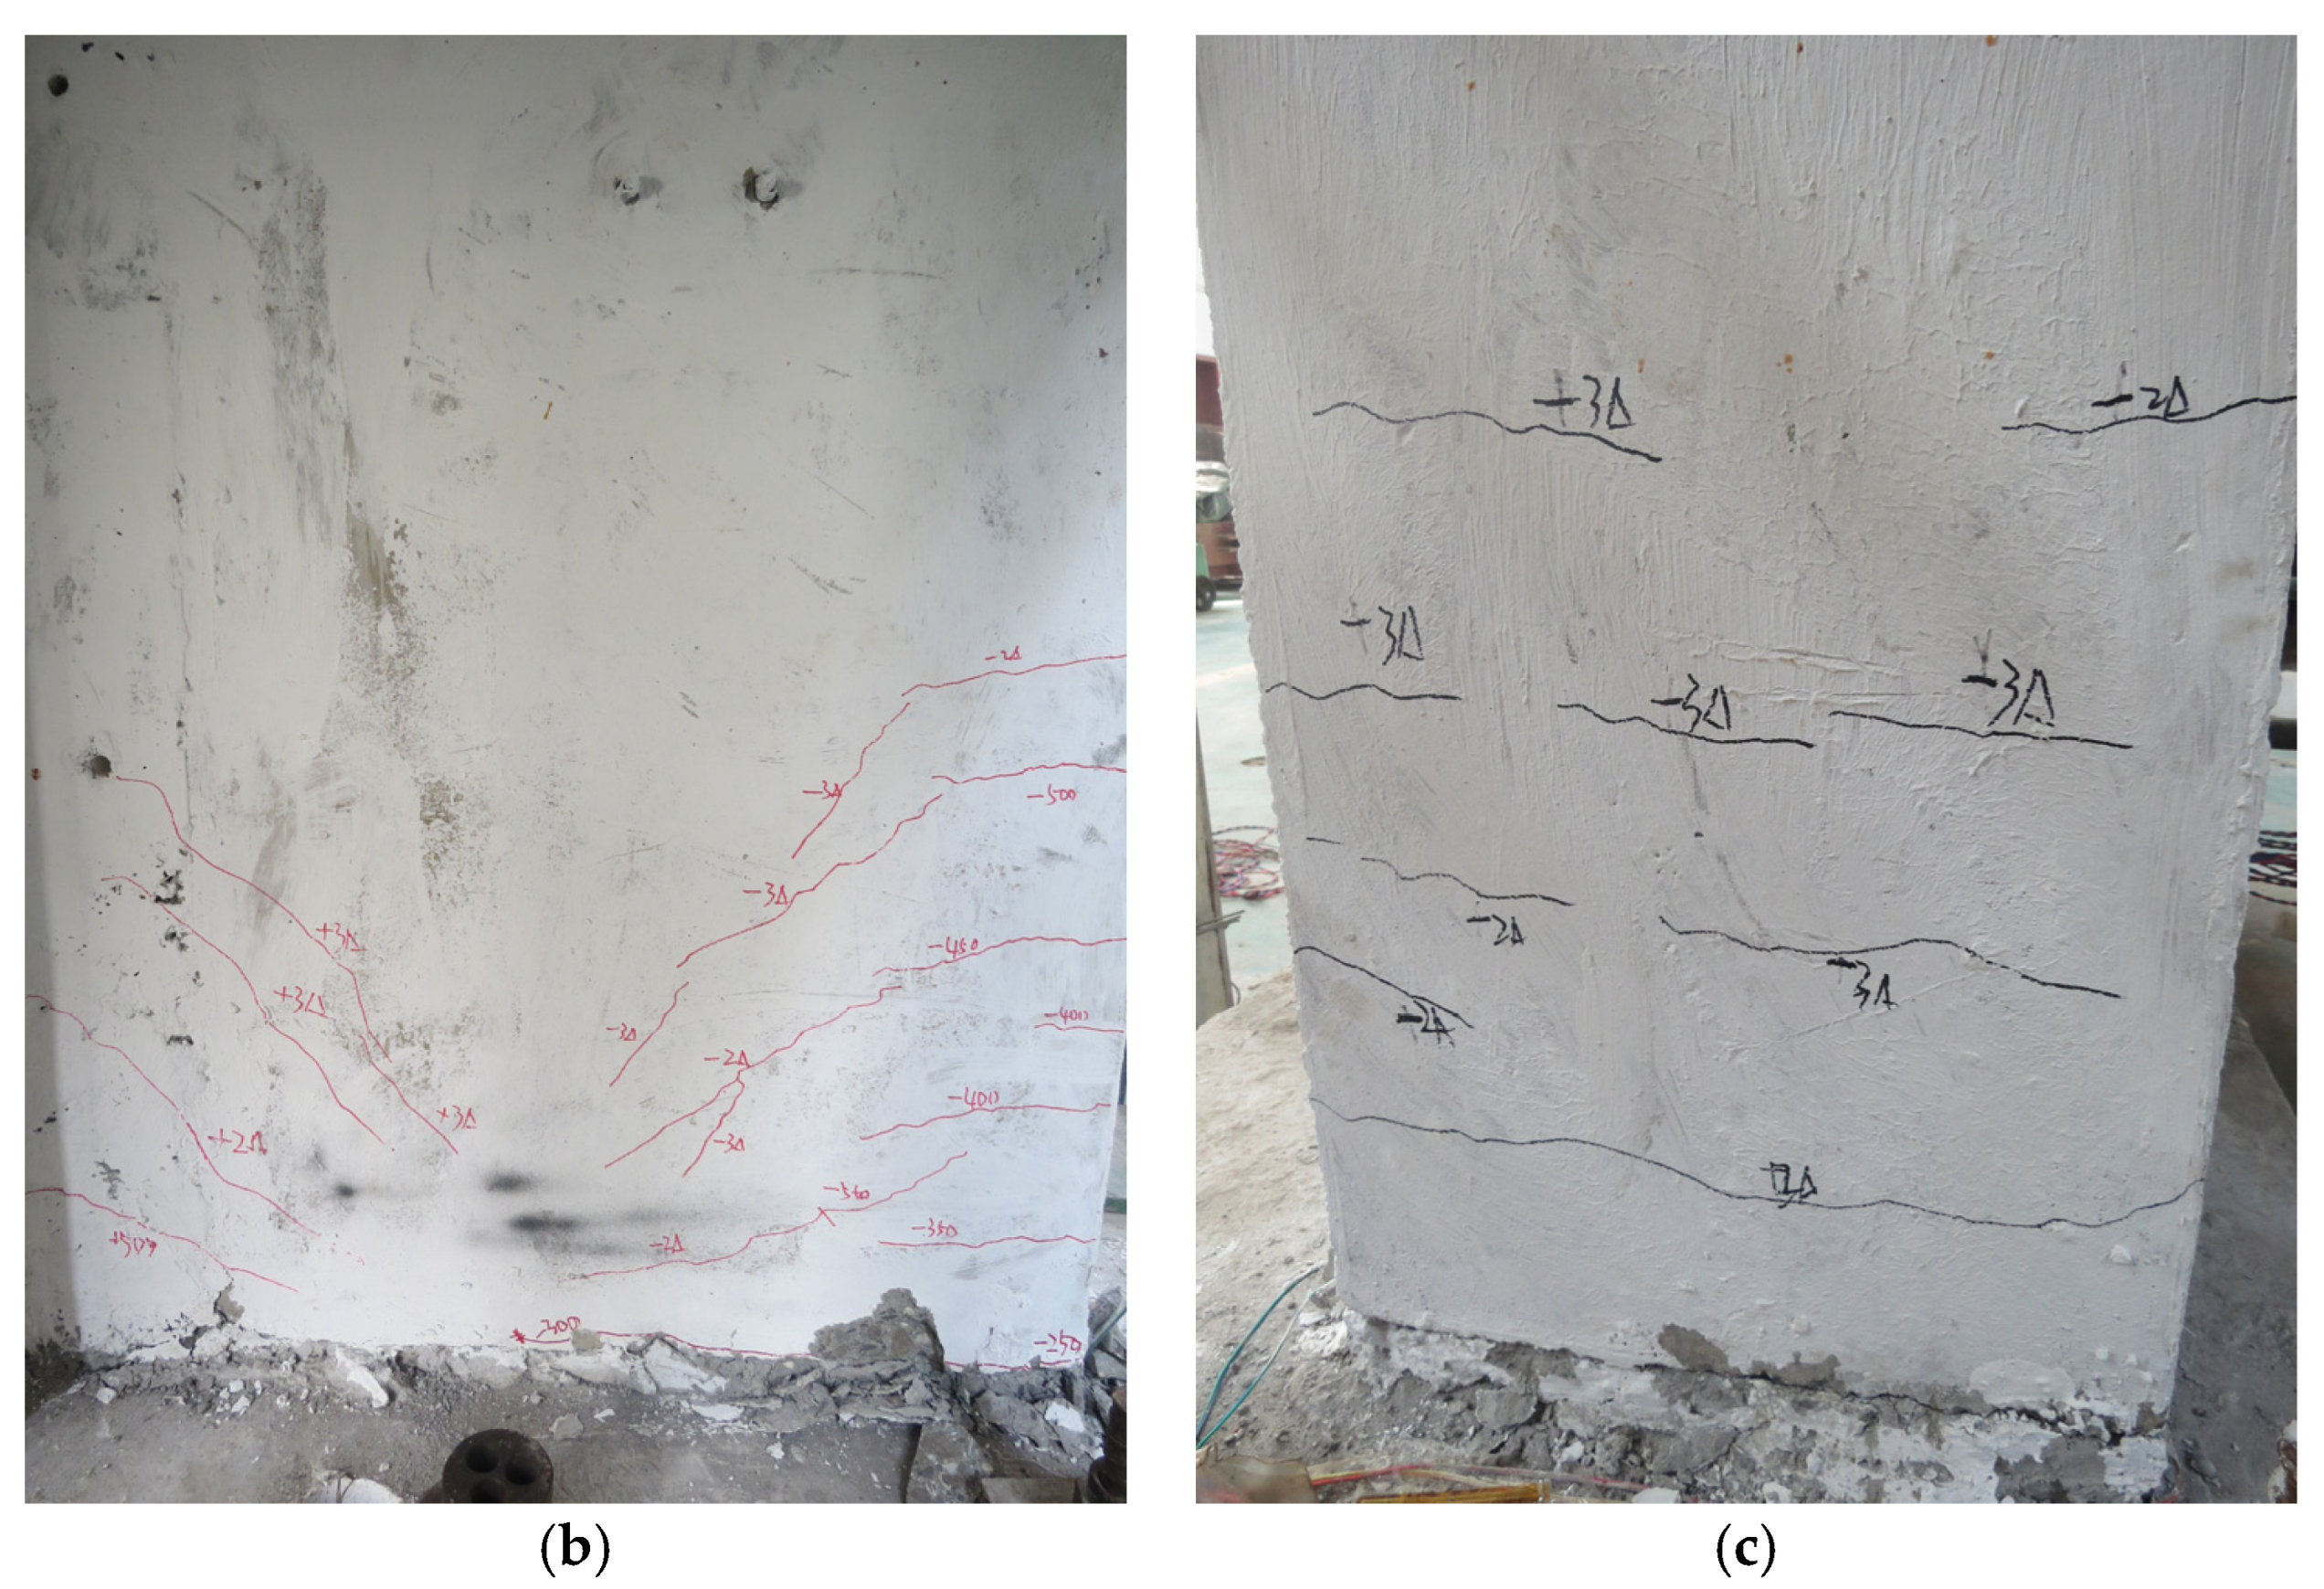
2.4. Damage and Failure Characteristics

The damage and failure of the prefabricated ECC/RC composite shear wall structure are mainly manifested in the cracking of the bottom of the shear walls and the coupling beams, which can be seen in Figure 4. The cracks in the web walls are horizontal cracks at the initial stage of loading, and gradually develop along the inclined direction with the increase in horizontal load, and finally show as bending-shear cracks. The cracks in the flange walls are horizontal cracks, which eventually show bending failure. The cracking of the coupling beams is mainly concentrated at the ends and the cast-in-place ECC area, and there are many fine cracks in the ECC.

2.5. Load–Displacement Hysteresis Behavior

Figure 5 illustrates the load–displacement hysteresis loops, which are characterized by a bow shape, highlighting the specimen’s robust energy dissipation capability and minimal residual deformation. The load–displacement skeleton curve, detailed in Figure 6, delineates critical stages, such as the cracking, yielding, peak, and failure points. Initial crack formation was observed at a displacement of 3.64 mm under a horizontal force of 248.7 kN. Yielding occurred when the displacement reached 7.84 mm with an applied load of 524 kN. The specimen achieved its maximum load capacity at 991.7 kN, corresponding to a displacement of 33.67 mm. The failure threshold was identified when the load diminished to 836 kN and displacement extended to 50.5 mm. Table 4 compiles the mechanical properties extracted from these observations.

3. Numerical Simulation

In this study, the finite element analysis software ABAQUS 2020, renowned for its comprehensive capabilities, serves as the foundation for the numerical simulations. The process of developing and analyzing models encompasses several critical steps outlined below.

3.1. Material Constitutive Relations

The simulation’s framework integrates the behavior of concrete, ECC, and steel reinforcement. The uniaxial stress–strain curve for concrete is adopted from the “Code for Design of Concrete Structures” (2015 Edition) (GB50010-2010) [41], ensuring compliance with established standards. The ECC’s stress–strain profile is derived from the methodology introduced by the research team led by Pan [42], highlighting the innovative application of ECC. Furthermore, the simulation incorporates damage factors for both concrete and ECC, following the guidelines proposed by Zhang Jin and colleagues [43]. For the modeling of steel reinforcement, a bilinear stress–strain curve is utilized, providing a detailed representation, as depicted in Figure 7.

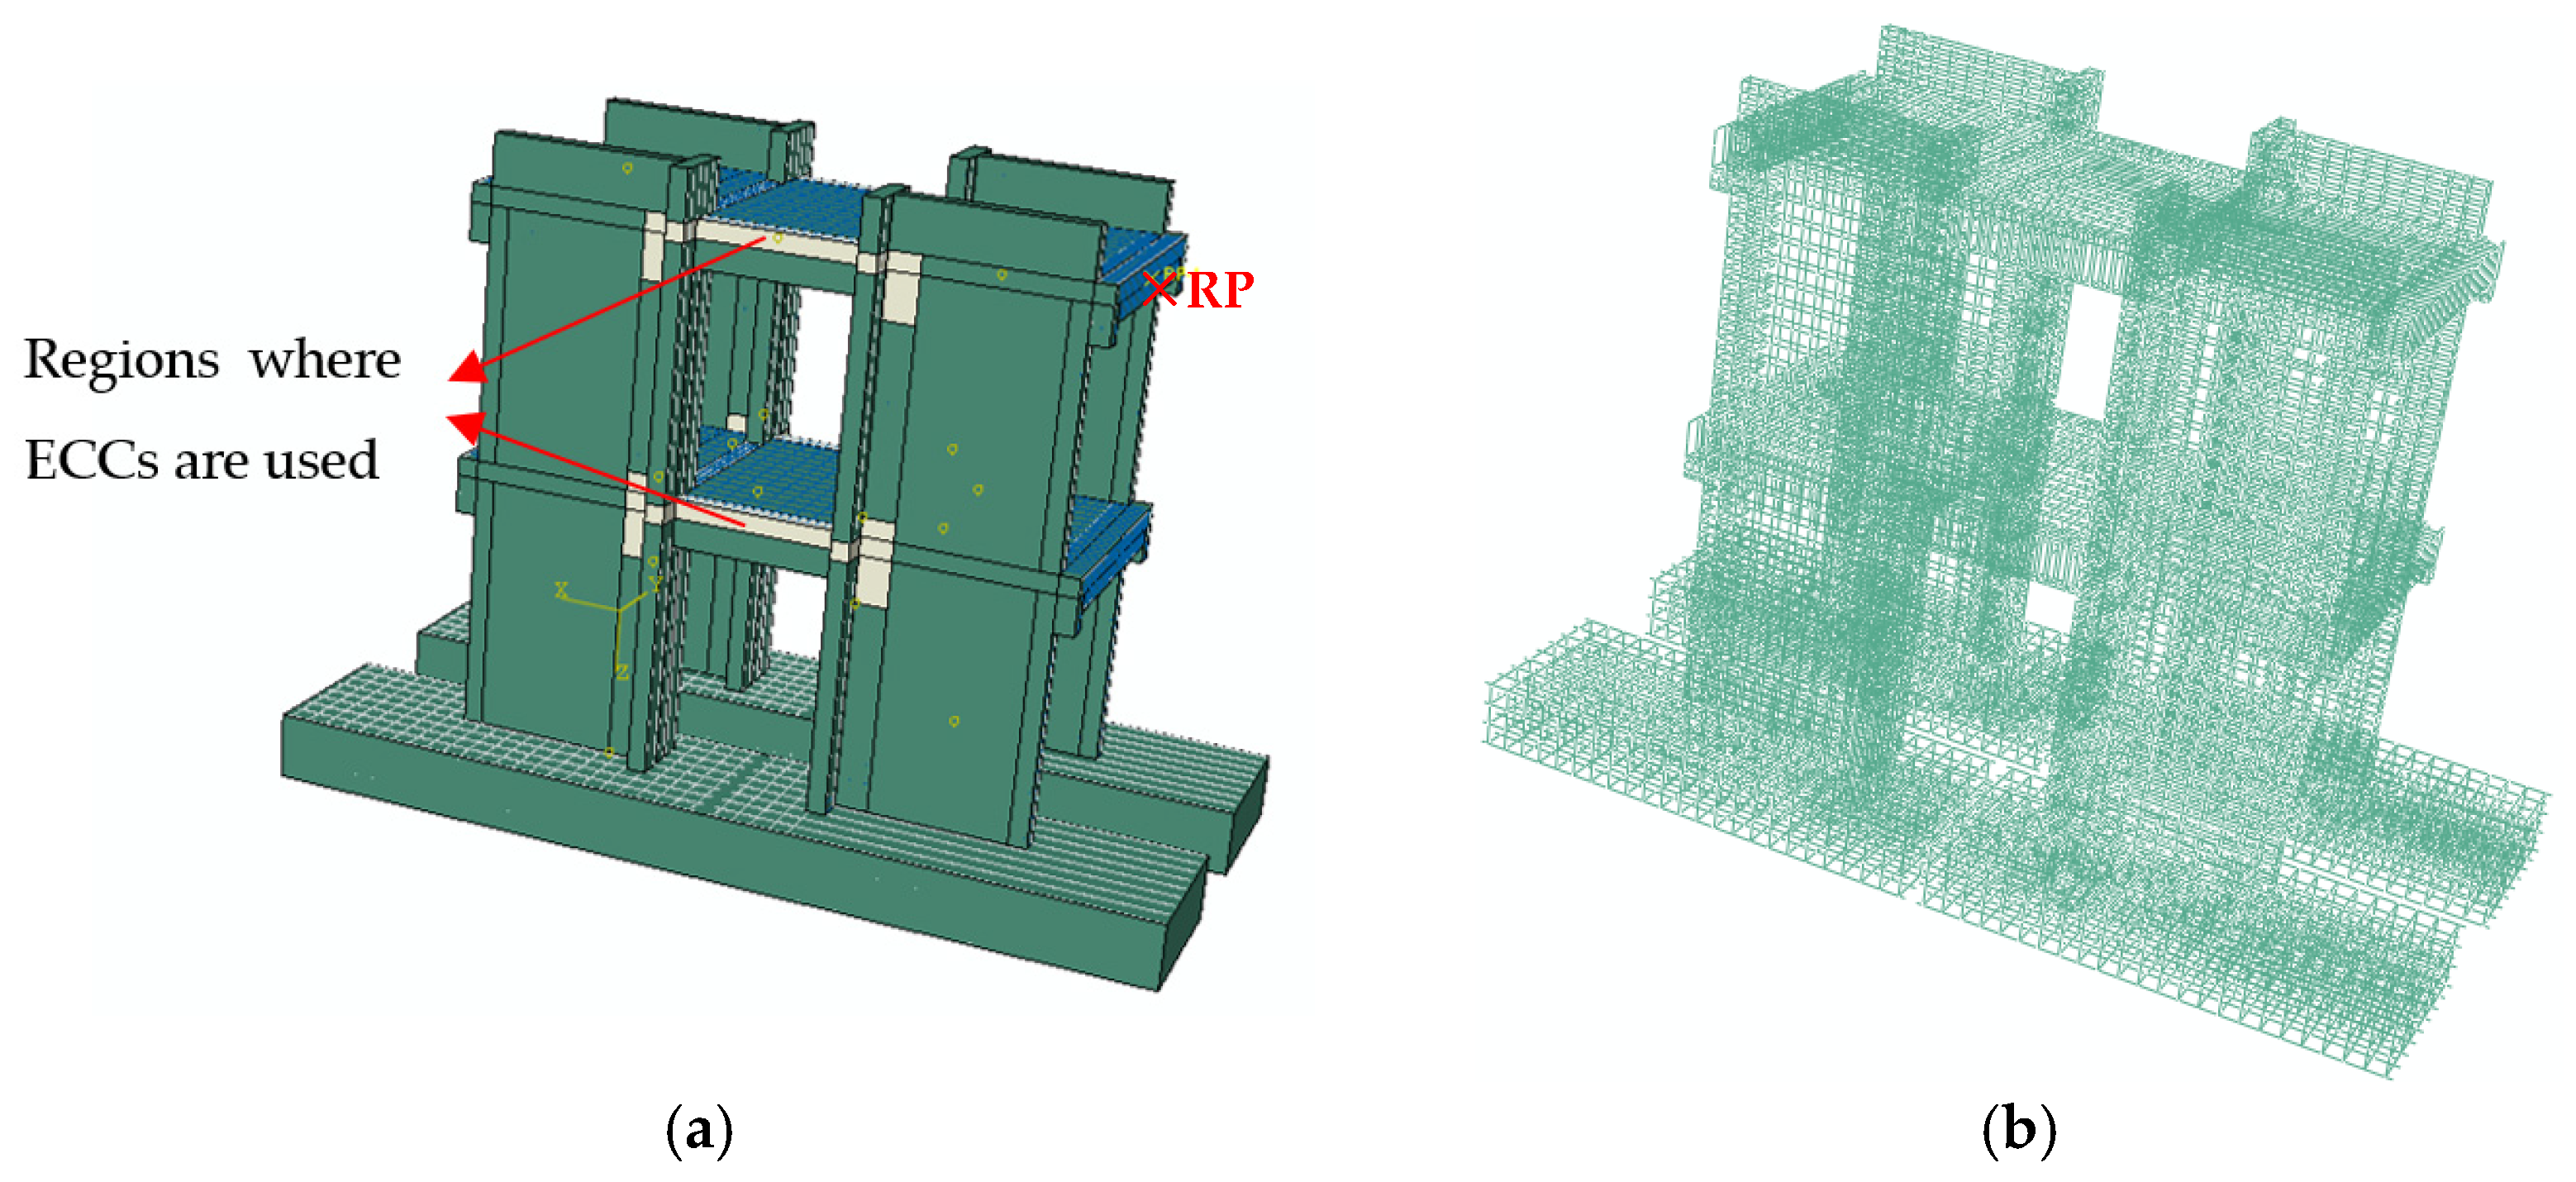
3.2. Element Type and Model Building

In the realm of finite element analysis, both the concrete and ECC elements are depicted using eight-node hexahedral linear reduced-integration elements (C3D8R) [42]. The prefabricated joints’ vertical reinforcements are modeled with two-node spatial linear beam elements (B31), and the additional reinforcement utilizes space truss elements (T3D2).
Interactions between concrete surfaces and between concrete and ECC are modeled via surface-to-surface contact. For normal direction interactions, a hard contact strategy is adopted, permitting potential separation, while tangential movements are governed by a penalty friction model with a friction coefficient of 0.4 [44].
The simulation constructs a half-scale, two-story spatial structure of a prefabricated ECC/RC combined shear wall, reflective of the experimental specimen’s dimensions. The finite element model’s depiction, including the application of ECC at critical junctions, such as beam-to-wall and within the upper extents of composite coupling beams, is presented in Figure 8a. Figure 8b showcases the steel reinforcement layout within the model. Given the negligible slip between the steel reinforcement and concrete, as well as between the steel and ECC under applied forces, the model assumes effective bonding, employing the “embedded region” contact feature for interface adherence in ABAQUS.

3.3. Boundary Conditions and Loading Methods

The foundation of the modeled structure is securely anchored at its base, mirroring the experimental conditions. Vertical forces are consistently applied across the loading beam, as shown in Figure 9a. Horizontally, the model undergoes reversed cyclic loading, initiated through force-displacement techniques. Initially, force-based loading is adopted, proceeding in stages with each increment defined as a 50 kN multiple. Following the attainment of yield displacement, the procedure transitions to displacement-based loading, employing increments equal to integer multiples of the yield displacement. This phase involves conducting three cycles at each level until structural failure is observed. The loading sequence reflects the experimental approach, detailed in Figure 3. A reference point (RP) is designated at the spatial structure model’s apex, linked to nodes at both extremities of the loading beam, enabling the implementation of horizontal displacements at RP, as depicted in Figure 9b.

3.4. Mesh Subdivision

Utilizing the swept meshing approach guarantees consistency in mesh generation, with a specified cutting surface to ensure uniformity across all elements. This includes steel reinforcements, wall segments, coupling beams, floor sections, loading beams, and foundational elements, each with a mesh dimension uniformly established at 0.05 m. The spatial model’s mesh configuration is illustrated in Figure 10.

3.5. Analytical Calculations

The computational framework is segmented into two distinct phases. Initially, the foundation is immobilized to define inter-component contact dynamics, paving the way for vertical force application. The subsequent phase involves constraining lateral movements parallel to the wall’s plane on the loading beam’s sides, ensuring structural equilibrium under load. Horizontal forces are then engaged. For iterative computation, the Newton–Raphson technique is applied, with step size adjustments to address convergence or efficiency challenges.

3.6. Damage and Crack Distribution

The damage and crack distribution of the concrete and ECC in ABAQUS is reflected by the tensile damage factor. The closer the damage factor is to 1.0, the more serious the damage to the concrete or ECC is. Figure 11 shows the distribution and variation of the tensile damage factor of the spatial structure specimen of the prefabricated ECC/RC combined shear wall structure.

3.7. Comparison of Numerical and Experimental Results

In order to make the comparison between the test and the calculation results clear, the web wall and the flange wall are intercepted from the integral structure for comparison. Figure 12 is the comparison of experimentally measured cracks and finite element simulation cracks. Figure 12 shows that the webs are mainly flexural shear diagonal cracks, and the flanges are mainly horizontal bending cracks. The crack pattern simulated by the finite element model is approximately consistent with the actual crack pattern.
Figure 13 and Figure 14 showcase that the load–displacement hysteresis and skeleton curves from both the simulation and experimental protocols are approximately consistent with the experimental test results. However, the finite element method shows a slightly stiffer rigidity and a lower displacement. One reason is that the finite element calculation method uses the finite degree of freedom to approximate the infinite degree of freedom in the real structure. The finite element solution is equivalent to making the structure deform according to the given shape function. Compared with the real situation, the constraints are increased in the finite element simulation, so the stiffness is larger than the real solution. Correspondingly, the displacement is a little smaller. The second possible reason is that the threaded steel connecting rods that transmit the horizontal load may produce a small irreversible tensile deformation in the later stage of loading, resulting in a length slightly larger than the original length, and the measured displacement of the specimen also increases accordingly. There are two ways to reduce this gap. One is to divide the meshes more finely in the finite element calculation, so that the gap is closer to the infinite degree of freedom, and, thus, closer to the real situation. Another method is to use almost non-deformed steel to make the threaded steel connecting rods to reduce irreversible tensile deformation.
Although there are slight differences, the comparison between the experimental and numerical simulation results of the cracking morphology and the load–displacement curves verifies the correctness of the numerical simulation method.

4. Quantitative Analysis of Influence Factors

This section delves into the paramount variables that shape the seismic energy absorption capabilities of such structures. These include the deployment areas of ECC within composite coupling beams and shear walls, ECC’s compressive strength, the coupling beams’ stirrup ratio, and the tensile strength of longitudinal reinforcements. An exhaustive quantitative examination was undertaken to evaluate the impact of these parameters on seismic energy dissipation metrics, such as load–displacement hysteresis behaviors and energy absorption efficiency, utilizing our refined numerical model. Herein, a comprehensive analysis of these parameters’ effects on the structural seismic energy dissipation efficiency is articulated.

4.1. Use Regions of ECC in Composite Coupling Beams

4.1.1. Selection of Parameters

Given its enhanced complexity and cost over traditional concrete, ECC’s economic viability, especially in fully incorporating it within coupling beams, warrants scrutiny. This investigation evaluates the seismic energy absorption efficiency of ECC by comparing three coupling beam configurations: fully concrete (structure 1-1), a hybrid of ECC and concrete (structure 1-2), and exclusively ECC (structure 1-3). Consistent across these variants are other factors, like the stirrup ratio, the nature of longitudinal reinforcement, concrete strength, and ECC type, among others. Table 5 enumerates the specific parameters for this analysis, adhering to Chinese standards [40], where HRB400 denotes a 400 MPa tensile strength of the reinforcing bar, and E40 and C40 represent the compressive strengths of ECC and concrete, respectively, each at 40 MPa.

4.1.2. Load–Displacement Hysteresis Behavior

Figure 15 illustrates the load–displacement hysteresis curves for specimens subjected to low cyclic loading, highlighting the differential impact of ECC application within the coupling beams. Integrating ECC not only postpones the yielding of these beams but also enhances the overall shear wall structure’s delay in yielding, thereby augmenting the energy dissipation potential of the structure. The depicted curves showcase a pronounced bow shape. Notably, the pinching effect—a measure of energy dissipation efficiency—is most evident in the purely concrete structure (structure 1-1), diminishing progressively in the ECC-integrated structures (structure 1-2 and structure 1-3), with structure 1-3 exhibiting the least pinching. This indicates that structure 1-3’s hysteresis loop is the most complete, signifying superior energy dissipation capability.

4.1.3. Energy Dissipation Capacity

The capability of energy absorption, quantified by the hysteresis loop’s enclosed area, is determined through an approximate integral technique. Table 6 presents both the single-cycle energy dissipation metrics and the aggregate energy dissipation figures for the specimens, reflecting different extents of ECC integration within the composite coupling beams. The symbol Δ in Table 6 denotes the yield displacement.
The analysis distinctly showcases that integrating ECC, even solely within the cast-in-place sections of coupling beams, significantly bolsters the structure’s seismic energy absorption capabilities. As delineated in Table 6, a definitive hierarchy emerges in energy dissipation efficiency: Structure 1-3 surpasses structure 1-2, which in turn exceeds structure 1-1, across both single-cycle and aggregated energy dissipation metrics. This progression underscores an enhancement in energy absorption capabilities correlating with the augmented incorporation of ECC within the coupling beams.

4.2. Use Regions of ECC in Shear Walls

4.2.1. Selection of Parameters

Acknowledging the susceptibility of shear wall lower sections to seismic forces, which frequently result in plastic hinge formation, this segment investigates the impact of varying ECC application extents at the shear wall base to ascertain optimal implementation. Structure 2-1, constructed purely of concrete, contrasts with structure 2-2 through structure 2-5, which progressively integrate ECC from 200 mm to 800 mm at the base, corresponding to incremental structural height percentages. Consistency is maintained across other variables, such as the stirrup ratio in coupling beams and the specifications of longitudinal reinforcement and concrete types. Detailed parameters for this analysis are encapsulated in Table 7.

4.2.2. Load–Displacement Hysteresis Behavior

Illustrated in Figure 16 are the load–displacement hysteresis curves for specimens subjected to low cyclic loading. These curves demonstrate a more pronounced completeness as the application height of ECC at the base of the shear walls increases, signifying a notable improvement in the structure’s capacity for energy dissipation.

4.2.3. Energy Dissipation Capacity

Table 8 details the energy dissipation metrics for five structural configurations across both single cycles and cumulative impacts. Initially, Structure 2-1 outperforms structure 2-2 in single-cycle energy dissipation, a phenomenon highlighted in Table 8. This stage, marking the specimens’ initial yielding phase, reveals the minimal yet significant influence of ECC application. At this juncture, the inherent stiffness of the structural elements predominantly governs energy dissipation, with the rigidity of concrete contributing more significantly than that of ECC, thus favoring structure 2-1’s energy dissipation profile over structure 2-2.
With the elevation of ECC incorporation to 400 mm, an increase in yield points is observed, overshadowing the stiffening effect of concrete, and setting a new comparison where structure 2-2 is surpassed by structure 2-3. Incrementing ECC’s presence to between 600 and 800 mm at the shear wall’s base diminishes the yield displacement’s role in energy dissipation, reshaping the hierarchy to structure 2-3 outperforming structure 2-4 and structure 2-5. Moreover, extending displacement loading to double the yield displacement reconfigures the relationship across single-cycle and cumulative energy dissipation figures, establishing a trend where greater ECC implementation in shear walls correlates with heightened energy dissipation capacity, evidenced by the no ECC to 800 mm increments.
Table 8 also illustrates the cumulative energy dissipation values for structures 2-1 to 2-5, which are 339,460.5 J, 377,573.7 J, 412,205.4 J, 424,149.1 J, and 429,266.4 J, respectively, after undergoing the third cycle of 6∆ loading displacement. When compared to structure 2-1, the cumulative energy dissipation of structures 2-2 to 2-5 shows an increase of 11.2%, 21.4%, 24.9%, and 26.5%, respectively. Notably, the application of ECC material at the bottom 400 mm of the shear wall results in a cumulative energy dissipation increase of over 20% compared to the specimen without ECC. As ECC usage at the bottom of the shear wall continues to rise, there is a corresponding increase in cumulative energy dissipation, albeit at a diminishing rate. For instance, the energy dissipation of structure 2-3 is 9.2% higher than that of structure 2-2, while the increase from structure 2-2 to structure 2-1 is more modest at 2.9%.
Optimal energy dissipation performance is achieved with the incorporation of ECC at 400 mm from the base of the shear wall. The distinctive properties of ECC, including its enhanced ductility, damping capabilities, and superior resistance to deformation under tensile, compressive, and shear forces—despite its comparative lower stiffness to traditional concrete—play a pivotal role in dictating the overall energy dissipation efficiency. This efficiency is critically influenced by the material’s deformation capacity, stiffness, and load-bearing potential. Consequently, it is advised that the ideal proportion of ECC to be utilized in precast shear walls is established at 14% (400 mm) of the total structural height.

4.3. Strength of ECC

4.3.1. Selection of Parameters

Parameter analysis from Section 4.1 and Section 4.2 indicate optimal seismic performance when ECC is utilized in specific areas, namely the coupling beams and the lower 400 mm of shear walls. We varied the ECC strength in these regions to assess its impact, using the ECC types E40, E60, and E80, corresponding to compressive strengths of 40 MPa, 60 MPa, and 80 MPa, respectively. Other unspecified parameters are the same. The variation parameters of the ECC strength are shown in Table 9.

4.3.2. Load–Displacement Hysteresis Behavior

Figure 17 illustrates that the hysteresis behavior of the specimens is relatively unaffected by ECC strength variations, indicating that ECC’s energy dissipation capacity is not significantly influenced by its compressive strength.

4.3.3. Energy Dissipation Capacity

Table 10 presents the energy dissipation data under cyclic loading. Initially, higher strength ECC shows greater energy dissipation, likely due to increased stiffness. However, as loading progresses, the trend reverses, with lower strength ECC demonstrating superior energy dissipation. This highlights the importance of balancing strength and ductility in ECC for optimal seismic performance.

4.4. Stirrup Ratio of Coupling Beams

4.4.1. Selection of Parameters

This study examines the impact of varying stirrup ratios in coupling beams. The coupling stirrup ratios of structure 4-1, structure 4-1, and structure 4-1 are 0.50%, 1.13%, and 2.01% (corresponding to diameters of 4 mm, 6 mm, and 8 mm), respectively. The configurations of the structural specimens are detailed in Table 11.

4.4.2. Load–Displacement Hysteresis Behavior

Figure 18 presents the hysteresis curves for the specimens. The similarity across different stirrup ratios suggests a negligible effect on the load–displacement behavior within the parameters of this study.

4.4.3. Energy Dissipation Capacity

Table 12 compares the energy dissipation values across different stirrup ratios. The data reveals only slight differences in both single-cycle and cumulative energy dissipation values, suggesting a minimal impact of stirrup ratio variations on energy dissipation.

4.5. Strength of Longitudinal Reinforcement

4.5.1. Selection of Parameters

This section evaluates the impact of varying longitudinal reinforcement strengths on structural performance. The longitudinal reinforcements used in structure 5-1, structure 5-2, and structure 5-3 are HRB335, HRB400, and HRB500, respectively. The ECC usage range is consistent with Section 4.4. Table 13 details the parameter configurations for the specimens.

4.5.2. Load–Displacement Hysteresis Behavior

Figure 19 presents the hysteresis curves for the specimens. An increase in reinforcement strength leads to fuller hysteresis loops, indicating enhanced yield and peak loads.

4.5.3. Energy Dissipation Capacity

Table 14 displays the energy dissipation values for structural specimens with different strengths of longitudinal reinforcement. The data reveals a clear trend: structure 5-3 > structure 5-2 > structure 5-1, both in terms of single-cycle and cumulative energy dissipation. This indicates an increase in energy dissipation capacity with the enhancement of longitudinal reinforcement strength. However, high-strength steel bars contribute more to the structural performance before yield. Considering the high price and the reduction in ductility, using high-strength steel is not essential, and the HRB400 steel bar is a better choice.

5. Results and Optimization Design Suggestions

The ECC/RC composite shear wall structure has a good seismic energy dissipation capacity, and ECC is as easy to install as concrete; however, it also has some limitations. For example, it is difficult to repair when the shear walls are damaged. In addition, the price of ECC is about 2.5 times that of concrete, and the high cost makes ECC unable to be widely used in the ECC/RC composite shear wall structures. Therefore, it is necessary to optimize the design of the prefabricated ECC/RC composite shear wall structure, considering its technical performance and cost.
Machine learning, artificial intelligence, and neural network methods [45,46,47,48] have significant advantages in optimal design. Purohit et al. [49] used deep learning technology to obtain effective segmentation results. Zhao et al. [50] proposed an intelligent design method for a beam and slab of shear wall structure based on deep learning. Du et al. [51] established a rapid optimization method for flexible support structures based on mathematical models.
This paper draws on machine learning, artificial intelligence, and neural network methods. Emphasis is placed on critical aspects, such as the optimal deployment areas for ECC within composite coupling beams and shear walls, the grade of ECC strength, the proportion of stirrups in coupling beams, and the caliber of longitudinal reinforcement. Through finite element analysis, this research quantitatively assesses the impact of these variables on seismic energy dissipation, incorporating evaluations of load–displacement hysteretic behaviors and the energy dissipation potential of ECC/RC shear wall samples. Insights from this analysis reveal the following:
-
Incorporation of ECC in composite coupling beams significantly bolsters seismic resilience compared to traditional concrete counterparts, with benefits amplifying alongside increased ECC integration.
-
The most effective energy dissipation is achieved with ECC applied 400 mm up from the shear wall’s base, recommending a 14% structural height allocation (400 mm) for optimal ECC integration in prefabricated walls.
-
ECC materials of lesser strength demonstrate enhanced energy dissipation abilities under prolonged loading conditions.
-
Variations within the examined stirrup ratio spectrum (0.5% to 2.01%) have a minimal effect on the seismic performance.
-
The necessity for high-strength steel is de-emphasized, with HRB400 grade steel emerging as the preferable option.
Based on the above research results, considering both cost-efficiency and performance, the study advocates for strategic ECC deployment within coupling beams and recommends a 14% structural elevation (400 mm) at shear walls’ base. Optimal parameters proposed include ECC strength grade E40, a longitudinal reinforcement of HRB400, and a stirrup ratio within coupling beams set at 0.5%, detailed in Table 15.

6. Discussion

In this paper, the seismic energy dissipation performance of the prefabricated ECC/RC composite shear wall structure is studied by means of experiments and numerical simulation. Based on the experimental verification of numerical simulation, this study employs finite element analysis to examine the impact of various factors on seismic energy dissipation under low cyclic loading. The study focuses on key areas, such as the application zones of ECC in composite coupling beams and shear walls, ECC strength, the stirrup ratio in coupling beams, and the strength of longitudinal reinforcement. The influence of these parameters on seismic energy dissipation is quantitatively evaluated by finite element analysis. These analyses include load–displacement hysteretic curves, as well as an assessment of the energy dissipation capacity of ECC/RC shear wall specimens. Based on the above research results, the optimization design recommendations are put forward.
Reflecting on the analysis of a half-scale, two-story spatial structure that closely replicates an actual test specimen, this research offers insightful guidelines for engineering applications. Nonetheless, it emphasizes the need for further exploration into the behavior of such engineering solutions under real earthquake conditions to ensure wide-ranging applicability. In the future, we will analyze the seismic performance of full-scale engineering structures, and use the methods of artificial intelligence, machine learning, and neural networks to conduct more accurate optimization design research on practical engineering applications.

Author Contributions

Conceptualization, J.Y. and H.G.; Methodology, J.Y. and R.Z.; Software, J.Y. and R.Z.; Validation, M.S.; Formal analysis, J.Y., M.S. and G.Y.; Investigation, J.Y. and H.G.; Resources, G.Y.; Data curation, J.Y. and R.Z.; Writing—original draft, J.Y.; Writing—review & editing, M.S.; Visualization, R.Z.; Supervision, M.S. and R.Z.; Project administration, G.Y. and H.G.; Funding acquisition, J.Y., M.S., G.Y. and H.G. All authors have read and agreed to the published version of the manuscript.

Funding

The research was funded by the “National Natural Science Foundation of China” (Grant No. 52308271), “Shenzhen Natural Science Foundation”(Grant No. JCYJ20230807114401002), “Shenzhen High-level Talents Research Start-up Fund (Grants No. RC2022-004)”and the “2022 Doctoral Research Startup Project of Shenzhen Institute of Information Technology” (Grant No. SZIIT2022KJ014), supported by “The Eighth Batch of Education and Teaching Reform Research Projects of Shenzhen Institute of Information Technology” (Grant No. 2021dbpjgyb25), and by “Guangdong Province Ordinary University Features Innovative Projects” (Grants No. 2020 ktscx300 and 2023KTSCX321).

Data Availability Statement

The original contributions presented in the study are included in the article, further inquiries can be directed to the corresponding authors.

Conflicts of Interest

The authors declare no conflict of interest.

References

  1. Elliott, K.S. Precast Concrete Structures; CRC Press: Boca Raton, FL, USA, 2016. [Google Scholar]
  2. Soares, D.; De Brito, J.; Ferreira, J.; Pacheco, J. Use of coarsere cycled aggregates from precast concrete rejects: Mechanical and durability performance. Construct. Build. Mater. 2014, 71, 263–272. [Google Scholar] [CrossRef]
  3. Kurama, Y.C.; Sritharan, S.; Fleischman, R.B.; Restrepo, J.I.; Henry, R.S.; Cleland, N.M.; Ghosh, S.K.; Bonelli, P. Seismic-resistant precast concrete structures: State of the art. J. Struct. Eng. 2018, 144, 03118001. [Google Scholar] [CrossRef]
  4. Shen, S.D.; Cui, Y.; Pan, P.; Ren, J.Y. Development of prefabricated composite energy dissipating slotted shear wall. Eng. Struct. 2019, 199, 109577. [Google Scholar] [CrossRef]
  5. Nazari, M.; Sritharan, S.; Aaleti, S. Single precast concrete rocking walls as earthquake force-resisting elements. Earthq. Eng. Struct. Dynam. 2016, 46, 753–769. [Google Scholar] [CrossRef]
  6. Peng, Y.Y.; Qian, J.R.; Wang, Y.H. Cyclic performance of precast concrete shear walls with a mortar–sleeve connection for longitudinal steel bars. Mater. Struct. 2016, 49, 2455–2469. [Google Scholar] [CrossRef]
  7. Brunesi, E.; Peloso, S.; Pinho, R.; Nascimbene, R. Cyclic testing of a full-scale two-storey reinforced precast concrete wall-slab-wall structure. Bull. Earthq. Eng. 2018, 16, 5309–5339. [Google Scholar] [CrossRef]
  8. Brunesi, E.; Peloso, S.; Pinho, R.; Nascimbene, R. Shake-table testing of a full-scale twostorey precast wall-slab-wall structure. Earthq. Spectra 2019, 35, 1583–1609. [Google Scholar] [CrossRef]
  9. Qian, K.; Li, B.; Liu, Y. Integrity of precast concre test ructues to resist progressive collapse. Geotech. Struct. Eng. Congr. 2016, 1976–1986. [Google Scholar] [CrossRef]
  10. Wu, B.; Peng, C.W.; Zhao, X.Y. Cyclic loading tests of semi-precast circular steel tubular columns in corporating precast segments containing demolished concrete lumps. Eng. Struct. 2020, 211, 110438. [Google Scholar] [CrossRef]
  11. Qian, J.R.; Han, W.L.; Zhao, Z.Z.; Qin, H.; Zhang, Y.; Yu, J.; Ma, T.; Tian, D. Pseudo-dynamic substructure test on a 3-storey full-scale model of prefabricated concrete shear wall structure with rebars splicing by grout sleeves. J. Build. Struct. 2017, 38, 26–38. (In Chinese) [Google Scholar]
  12. SJG98-2021; Technical Specification for Concrete Structures of Tall Building. China Architecture & Building Press: Beijing, China, 2021.
  13. Xiao, S.; Wang, Z.; Li, X.; Harries, K.A.; Xu, Q.; Gao, R. Study of effects of sleeve grouting defects on the seismic performance of precast concrete shear walls. Eng. Struct. 2021, 236, 111833. [Google Scholar] [CrossRef]
  14. Zhi, Q.; Kang, L.; Jia, L.; Xiong, J.; Guo, Z. Seismic performance of precast shear walls prestressed via post-tensioned high strength bars placed inside grouted corrugated pipes. Eng. Struct. 2021, 237, 112153. [Google Scholar] [CrossRef]
  15. Tan, W.; Xianqian, M.; Ruinian, J.; Lijun, D.; Jun, L.; Yinlong, H.; Haibin, M. Seismic performance of repaired prefabricated shear walls. Case. Stud. Constr. Mat. 2023, 18, e01896. [Google Scholar] [CrossRef]
  16. Yang, J.; Guo, T.; Wang, W.; Zhu, R. Experimental investigation on seismic behaviors of precast concrete shear walls with sleeve grouting defects. Adv. Struct. Eng. 2023, 26, 258–271. [Google Scholar] [CrossRef]
  17. Qin, C.; Bai, G.; Liu, B.; Wu, T.; Wang, B. Study on the global bidirectional seismic behavior of monolithic prefabricate concrete shear wall structure. Soil Dyn. Earthq. Eng. 2020, 136, 106194. [Google Scholar] [CrossRef]
  18. Sheng, F. Study on Damping Characteristics and Dynamic Response of ECC/RC Prefabricated Shear Wall Structure; Southeast University: Nanjing, China, 2022. (In Chinese) [Google Scholar]
  19. Li, V.C. Engineered cementitious composites (ECC) material, structural, and durability performance. In Concrete Construction Engineering Handbook; Nawy, E., Ed.; CRC Press: Boca Raton, FL, USA, 2008; Chapter 24; pp. 1–78. [Google Scholar]
  20. Yu, J.; Yao, J.; Lin, X.; Li, H.; Lam, J.Y.; Leung, C.K.; Shih, K. Tensile performance of sustainable Strain-Hardening Cementitious Composites with hybrid PVA and recycled PET fibers. Cem. Concr. Res. 2018, 107, 110–123. [Google Scholar] [CrossRef]
  21. Yu, K.Q.; Yu, J.T.; Dai, J.G.; Lu, Z.D.; Shah, S.P. Development of ultra-high performance engineered cementitious composites using polyethylene (PE) fibers. Constr. Build. Mater. 2018, 158, 217–227. [Google Scholar] [CrossRef]
  22. Abd Elmoaty, A.E.M.; Morsy, A.M.; Harraz, A.B. Effect of Fiber Type and Volume Fraction on Fiber Reinforced Concrete and Engineered Cementitious Composite Mechanical Properties. Buildings 2022, 12, 2108. [Google Scholar] [CrossRef]
  23. Abouhussien, A.A.; Hassan, A.A.; Ismail, M.K.; AbdelAleem, B.H. Evaluating the cracking behavior of ECC beam-column connections under cyclic loading by acoustic emission analysis. Constr. Build. Mater. 2019, 215, 958–968. [Google Scholar] [CrossRef]
  24. Hao, Z.; Lu, C.; Li, Z. Highly accurate and automatic semantic segmentation of multiple cracks in engineered cementitious composites (ECC) under dual pre-modification deep-learning strategy. Cem. Concr. Res. 2023, 165, 107066. [Google Scholar] [CrossRef]
  25. Huang, B.T.; Wu, J.Q.; Yu, J.; Dai, J.G.; Leung, C.K.; Li, V.C. Seawater sea-sand engineered/strain-hardening cementitious composites (ECC/SHCC): Assessment and modeling of crack characteristics. Cem. Concr. Res. 2021, 140, 106292. [Google Scholar] [CrossRef]
  26. Gu, D.; Pan, J.; Mustafa, S.; Huang, Y.; Luković, M. Shear transfer mechanism in reinforced engineered cementitious composite (ECC) beams: Quantification of Vs and Vc. Eng. Struct. 2022, 261, 114282. [Google Scholar] [CrossRef]
  27. Meng, D.; Lee, C.K.; Zhang, Y.X. Structural behavior of reinforced polyvinyl alcohol engineered cementitious composite (PVA-ECC) beams under static and fatigue loadings. In Advances in Engineered Cementitious Composites; Woodhead Publishing: Sawston, UK, 2022; pp. 161–208. [Google Scholar]
  28. Abbas, A.A.; Arna’Ot, F.H.; Abid, S.R.; Özakça, M. Flexural behavior of ECC hollow beams incorporating different synthetic fibers. Front. Struct. Civ. Eng. 2021, 15, 399–411. [Google Scholar] [CrossRef]
  29. Amiri, M.; Esfahani, M.R. Effect of using Engineered Cementitious Composites (ECC) on failure behavior of flat slab-column connections. Structures 2023, 47, 2397–2407. [Google Scholar] [CrossRef]
  30. Zhang, Z.; Qian, S.; Ma, H. Investigating mechanical properties and self-healing behavior of micro-cracked ECC with different volume of fly ash. Constr. Build. Mater. 2014, 52, 17–23. [Google Scholar] [CrossRef]
  31. Zhang, Z.Y.; Ding, R.; Fan, J.S.; Nie, X.; Zhang, J. Seismic performance and shear strength of coupling beams using engineered cementitious composites with different reinforcement layouts. Eng. Struct. 2020, 219, 110895. [Google Scholar] [CrossRef]
  32. Suryanto, B.; Tambusay, A.; Suprobo, P.; Bregoli, G.; Aitken, M.W. Seismic performance of exterior beam-column joints constructed with engineered cementitious composite: Comparison with ordinary and steel fibre reinforced concrete. Eng. Struct. 2022, 250, 113377. [Google Scholar] [CrossRef]
  33. Cai, J.; Pan, J.; Xu, L.; Li, G.; Ma, T. Mechanical behavior of RC and ECC/RC composite frames under reversed cyclic loading. J. Build. Eng. 2021, 35, 102036. [Google Scholar] [CrossRef]
  34. Khan, F.A.; Khan, S.W.; Khan, W. Seismic performance of RC-ECC composite frame by eliminating shear reinforcement in beam-column joint: Shake table tests. Adv. Struct. Eng. 2022, 25, 2966–2980. [Google Scholar] [CrossRef]
  35. Khan, F.A.; Rashid, M.; Khan, S.W.; Rizwan, M.; Badrashi, Y.I.; Fahim, M.; Gul, A. Comparative seismic performance assessment of RC and RC/ECC hybrid frame structures: A shake table study. Innov. Infrastruct. Solut. 2022, 7, 94. [Google Scholar] [CrossRef]
  36. Ye, B.; Wang, H.; Ma, Y.; Pan, P. Seismic performance of flexure-dominated reinforced-engineered cementitious composites coupled shear wall. Eng. Struct. 2022, 272, 114992. [Google Scholar] [CrossRef]
  37. Yang, J.; Liang, S.; Zhu, X.; Sun, C.; Guo, Z. Seismic behavior of precast concrete coupled shear walls with engineered cementitious composite (ECC) in the critical cast-in-place regions. Sci. China Technol. Sci. 2017, 60, 1244–1254. [Google Scholar] [CrossRef]
  38. Yang, J.; Jiang, L.; Guo, H.; Yao, G. Stress Mechanism and Energy Dissipation Performance Optimization of Prefabricated ECC/RC Combined Shear Walls under Low Cyclic Loading. Buildings 2023, 13, 772. [Google Scholar] [CrossRef]
  39. JGJ 1-2014; Technical Specification for Precast Concrete Structures. China Architecture & Building Press: Beijing, China, 2014.
  40. Hou, H.; Qiu, C.; Li, G.; Wang, J. Cyclic test on steel frames with energy-saving sandwich composite panels. Eng. Mech. 2012, 9, 177–184. (In Chinese) [Google Scholar]
  41. GB 50010-2010; Code for Design of Concrete Structures (2015 Edition). China Architecture & Building Press: Beijing, China, 2015.
  42. Yuan, F.; Pan, J.; Wu, Y. Numerical study on flexural behaviors of steel reinforced engineered cementitious composite (ECC) and ECC/concrete composite beams. Sci. China Technol. Sci. 2014, 57, 637–645. [Google Scholar] [CrossRef]
  43. Zhang, J.; Wang, Q.; Hu, S.; Wang, C. Parameters verification of concrete damaged plastic model of ABAQUS. Build. Struct. 2008, 38, 127–130. [Google Scholar]
  44. Kien, D.N.; Chen, X.; Zhuang, X.; Rabczuk, T. Radial Basis Function Based Finite Element Method for Bending, Vibration and Buckling Analysis of Laminated Composite Mindlin-Reissner Plates. In Advances in Engineering Research and Application, Proceedings of the International Conference on Engineering Research and Applications, ICERA 2022, Thai Nguyen, Vietnam, 1–2 December 2022; Springer International Publishing: Cham, Switzerland, 2022; pp. 806–822. [Google Scholar]
  45. Gheisari, M.; Ebrahimzadeh, F.; Rahimi, M.; Moazzamigodarzi, M.; Liu, Y.; Dutta Pramanik, P.K.; Ali Heravi, M.; Mehbodniya, A.; Ghaderzadeh, M.; Feylizadeh, M.R.; et al. Deep learning: Applications, architectures, models, tools, and frameworks: A comprehensive survey. CAAI Trans. Intell. Technol. 2023, 8, 581–606. [Google Scholar] [CrossRef]
  46. Koy, A.; Çolak, A.B. The Intraday High-Frequency Trading with Different Data Ranges: A Comparative Study with Artificial Neural Network and Vector Autoregressive Models. Arch. Adv. Eng. Sci. 2023, 1–20. [Google Scholar] [CrossRef]
  47. Li, Z.; Li, S. Recursive recurrent neural network: A novel model for manipulator control with different levels of physical constraints. CAAI Trans. Intell. Technol. 2023, 8, 622–634. [Google Scholar] [CrossRef]
  48. Zhao, L.; Sun, Z.; Liu, K.; Zhang, J. The dynamic relaxation form finding method aided with advanced recurrent neural network. CAAI Trans. Intell. Technol. 2023, 8, 635–644. [Google Scholar] [CrossRef]
  49. Purohit, J.; Dave, R. Leveraging deep learning techniques to obtain efficacious segmentation results. Arch. Adv. Eng. Sci. 2023, 1, 11–26. [Google Scholar] [CrossRef]
  50. Zhao, P.; Liao, W.; Xue, H.; Lu, X. Intelligent design method for beam and slab of shear wall structure based on deep learning. J. Build. Eng. 2022, 57, 104838. [Google Scholar] [CrossRef]
  51. Du, Q.; Luo, G.; Wang, X.; Wang, T.; Fu, G.; Lu, C. Fast Optimization Method of Flexible Support Structure Based on Mathematical Model. Arch. Adv. Eng. Sci. 2023, 1–11. [Google Scholar] [CrossRef]
Figure 1. Graphs of the two-story spatial structure specimen of the prefabricated ECC/RC combined shear wall. (a) Planar graph; (b) 1-1 section graph.
Buildings 14 00951 g001aBuildings 14 00951 g001b
Figure 2. Schematic representation of the cyclic loading device.
Buildings 14 00951 g002
Figure 3. Time history plot of the cyclic loading.
Buildings 14 00951 g003
Figure 4. Damage and failure of the prefabricated ECC/RC composite shear wall structure. (a) Integral structure; (b) web wall; (c) flange wall.
Buildings 14 00951 g004aBuildings 14 00951 g004b
Figure 5. Load–displacement hysteresis curves.
Buildings 14 00951 g005
Figure 6. Load–displacement skeleton curve.
Buildings 14 00951 g006
Figure 7. Stress–strain curve of the steel bars.
Buildings 14 00951 g007
Figure 8. Finite element analysis model of the prefabricated ECC/RC combined shear wall. (a) Finite element model; (b) steel cage of the spatial structure specimen model.
Buildings 14 00951 g008
Figure 9. Boundary conditions and loading methods. (a) Boundary conditions and vertical loads; (b) low-cycle repeated horizontal displacement loading.
Buildings 14 00951 g009
Figure 10. Finite element model meshing.
Buildings 14 00951 g010
Figure 11. Damage and crack distribution of the prefabricated ECC/RC composite shear wall structure.
Buildings 14 00951 g011
Figure 12. Comparison of experimentally measured cracks and finite element simulation cracks. (a) Web wall; (b) flange wall.
Buildings 14 00951 g012
Figure 13. Load–displacement hysteresis curves.
Buildings 14 00951 g013
Figure 14. Load–displacement skeleton curves.
Buildings 14 00951 g014
Figure 15. Load–displacement hysteresis curves. (a) Structure 1-1; (b) structure 1-2; (c) structure 1-3.
Buildings 14 00951 g015
Figure 16. Load–displacement hysteresis curves. (a) Structure 2-1; (b) structure 2-2; (c) structure 2-3; (d) structure 2-4; (e) structure 2-5.
Buildings 14 00951 g016
Figure 17. Load–displacement hysteresis curves. (a) Structure 3-1; (b) structure 3-2; (c) structure 3-3.
Buildings 14 00951 g017
Figure 18. Load–displacement hysteresis curves with varied stirrup ratios. (a) Structure 4-1; (b) structure 4-2; (c) structure 4-3.
Buildings 14 00951 g018
Figure 19. Load–displacement hysteresis curves with varied reinforcement strengths. (a) Structure 5-1; (b) structure 5-2; (c) structure 5-3.
Buildings 14 00951 g019
Table 1. The ID and reinforcement details of prefabricated components.
Component FW-1
Flange Wall
FW-2
Web Wall
CB-1
Composite Coupling Beam
LB-1
Lateral Composite Beam
LB-2
Lateral Composite Beam
LS-1
Laminated Slab
LS-2
Laminated Slab
B-1
Base
Number88444424
Geometric dimension (mm)400 × 100 × 1190850 × 100 × 1340100 × 150 × 920100 × 100 × 970200 × 100 × 1270945 × 50 × 1270920 × 50 × 12702390 × 900 × 350
Longitudinal reinforcement12C68C6+10A63C83C123C12A6@100A6@10036C4
Horizontal reinforcementA6@100A6@100A6@100A6@100C8@50
StirrupsA4@50A4@50C6@50C6@50C6@50
Note: C-HRB400 steel bar, A-HPB300 steel bar.
Table 2. Mechanical properties of concrete and ECC.
MaterialsCompressive Strength fcu,k (MPa)Tensile Strength ft,k (MPa)Modulus of Elasticity Es (GPa)Ultimate Tensile Strain εsu
Precast concrete36.82.23.15
Cast-in-place concrete32.62.13.12
ECC35.24.61.543.4%
Table 3. Mechanical properties of the steel rebars.
Steel TypeYield Strength fy (MPa)Ultimate Strength fu (MPa)Modulus of Elasticity Es (GPa)
HPB300309358209
HRB400416489200
Table 4. Mechanical characteristic values of the specimen.
Mechanical PropertiesCracking PointYield PointPeak PointFailure Point
Displacement (mm) 3.647.8433.6750.5
Load (kN)248.7524.0991.7836.0
Table 5. Variation parameters of ECC in coupling beams.
Classification of
Specimens
Application Regions of ECC in
Coupling Beams
Stirrup Ratio of Coupling BeamsType of Longitudinal ReinforcementType of ECCType of Concrete
Structure 1-1None (Concrete coupling beam)1.13%HRB400E40C40
Structure 1-2Cast-in-place areas (ECC/RC coupling beams)
Structure 1-3Full ECC (ECC coupling beams)
Table 6. Single-cycle/cumulative energy dissipation values (J).
Displacement Loading LevelNumber of CyclesStructure 1-1Structure 1-2Structure 1-3
Single-CycleCumulativeSingle-CycleCumulativeSingle-CycleCumulative
1918.5 918.51186.2 1186.21287.7 1287.7
2555.6 1474.1608.7 1794.9658.61946.3
3263.71737.8220.6 2015.5237.5 2183.8
16521.68259.47417.9 9433.48062.910,246.7
24307.9 12,567.35292.6 14,726.05752.815,999.5
34067.516,634.85050.2 19,776.25489.421,488.9
112,299.2 28,93417,250.3 37,026.518,750.3 40,239.2
212,178.741,021.914,711.9 51,738.415,991.256,230.4
312,087.953,200.612,974.0 64,712.414,102.270,332.6
121,063.8 74,264.421,897.7 86,610.123,801.8 94,134.4
218,255.7 92,520.119,782.7 106,392.821,502.9115,155.6
316,788.5109,308.619,339.5 125,732.321,021.2136,658.5
125,502.7 134,811.328,540.1 154,272.431,021.9167,680.4
222,941.6157,752.927,119.2 181,391.629,477.4197,157.8
321,861.5 179,614.426,669.4 208,061.028,988.5 226,146.3
130,998.5 210,612.937,044.6 244,032.740,265.9266,412.2
229,796.7 240,409.635,971.7 281,077.339,099.7305,511.9
328,689.7269,099.335,280.9 316,358.238,348.8 343,860.7
Table 7. Variation parameters of ECC in shear walls.
Classification of SpecimensECC Application at the Base of Shear WallsStirrup Ratio of Coupling BeamsType of Longitudinal ReinforcementType of ECCType of Concrete
Structure 2-101.13%HRB400E40C40
Structure 2-27% structural height (200 mm)
Structure 2-314% structural height (400 mm)
Structure 2-421% structural height (600 mm)
Structure 2-528% structural height (800 mm)
Table 8. Single cycle/cumulative energy dissipation of the five structural specimens (J).
Displacement Loading LevelNumber of CyclesStructure 2-1Structure 2-2Structure 2-3Structure 2-4Structure 2-5
Single-CycleCumulativeSingle-CycleCumulativeSingle-CycleCumulativeSingle-CycleCumulativeSingle-CycleCumulative
11193.51193.51169.71169.71715.61715.61491.81491.81453.91453.9
2647.71841.2502.31672768.32483.9545.52037.35151968.9
3216.22057.4297.61969.6412.32896.2308.62345.93322300.9
17975.310,032.77652.69622.28556.311,452.58651.810,997.78666.910,967.8
25674.615,707.35863.115,485.37367.418,819.97160.818,158.57238.618,206.4
35397.321,104.65771.221,256.57005.425,825.36922.425,080.97012.225,218.6
118,649.239,753.818,344.239,600.722,023.747,84921,322.346,403.222,41947,637.6
215,112.354,866.117,998.357,59920,969.868,818.820,72067,123.221,431.969,069.5
314,073.568,939.615,419.673,018.617,581.286,40019,80586,928.219,138.988,208.4
123,429.792,369.326,425.399,443.927,936.5114,336.529,570.9116,499.129,906.4118,114.8
221,113.2113,482.524,323.6123,767.525,400.1139,736.627,143.4143,642.527,295.6145,410.4
320,786.3134,268.823,710.5147,47824,652.7164,389.325,575.5169,21827,270.4172,680.8
130,786.5165,055.333,976.2181,454.236,745201,134.337,849.2207,067.238,685.8211,366.6
229,011.6194,066.933,178.8214,63336,516.6237,650.937,338.2244,405.437,798.4249,165
328,653.2222,720.133,074.3247,707.335,751273,401.936,303280,708.436,649.8285,814.8
139,862.9262,58344,226.3291,933.647,475.5320,877.448,948.2329,656.648,656.9334,471.7
238,865.2301,448.242,983.9334,917.545,928.6366,80647,494.3377,150.947,598.2382,069.9
338,012.3339,460.542,656.2377,573.745,399.4412,205.446,998.2424,149.147,196.5429,266.4
Table 9. The variation parameters of the ECC strength.
Classification of SpecimensApplication Areas of ECCStirrup Ratio of Coupling BeamsType of Longitudinal ReinforcementType of ECCType of Concrete
Structure 3-1Coupling beams and the lower 400 mm of shear walls1.13%HRB400E40C40
Structure 3-2E60
Structure 3-3E80
Table 10. Single-cycle/cumulative energy dissipation with different ECC strengths (J).
Displacement Loading LevelNumber of CyclesStructure 2-1Structure 2-2Structure 2-3
Single-CycleCumulativeSingle-CycleCumulativeSingle-CycleCumulative
11797.91797.91827.71827.71844.81844.8
2851.82649.7897.22724.9921.52766.3
3496.23145.9539.83264.7566.33332.6
18679.711,825.67850.511,115.28251.111,583.7
27490.819,316.44902.716,017.95061.716,645.4
37128.826,445.24347.220,365.14465.521,110.9
122,147.148,592.320,359.940,72520,648.241,759.1
221,093.269,685.519,88860,61319,996.161,755.2
317,704.687,390.116,238.376,851.316,63578,390.2
128,071115,461.126,369103,220.326,744.5105,134.7
225,534.6140,995.723,050.5126,270.823,979.7129,114.4
324,787.2165,782.922,108.2148,37922,482.1151,596.5
136,879.5202,662.435,549.4183,928.435,664.1187,260.6
236,651.1239,313.532,085.4216,013.832,158.9219,419.5
335,885.5275,19930,333.9246,347.730,159.7249,579.2
147,613.3322,812.345,413.8291,761.546,495.3296,074.5
246,066.4368,878.743,862.2335,623.744,070.5340,145
345,537.2414,415.942,948.7378,572.442,525.1382,670.1
Table 11. Configuration parameters of structural specimens.
Classification of SpecimensApplication Areas of ECCStirrup Ratio of Coupling BeamsType of Longitudinal ReinforcementType of ECCType of Concrete
Structure 4-1Coupling beams and the lower 400 mm of shear walls0.50%HRB400E40C40
Structure 4-21.13%
Structure 4-32.01%
Table 12. Single-cycle/cumulative energy dissipation with different stirrup ratios of coupling beams (J).
Displacement Loading LevelNumber of CyclesStructure 4-1Structure 4-2Structure 4-3
Single-CycleCumulativeSingle-CycleCumulativeSingle-CycleCumulative
11791.2 1791.21797.91797.91822.1 1822.1
2846.3 2637.5851.82649.7861.6 2683.7
3494.2 3131.7496.23145.9502.4 3186.1
18592.9 11,724.68679.711,825.68809.9 11,996
27415.9 19,140.57490.819,316.47603.2 19,599.2
37057.5 26,1987128.826,445.27235.7 26,834.9
121,925.6 48,123.622,147.148,592.322,479.3 49,314.2
220,882.3 69,005.921,093.269,685.521,409.6 70,723.8
317,527.6 86,533.517,704.687,390.117,970.2 88,694
127,790.3 114,323.828,071115,461.128,492.1 117,186.1
225,279.3 139,603.125,534.6140,995.725,917.6 143,103.7
324,539.3 164,142.424,787.2165,782.925,159.0 168,262.7
136,510.7 200,653.136,879.5202,662.437,432.7 205,695.4
236,284.6 236,937.736651.1239,313.537,200.9 242,896.3
335,526.6 272,464.335,885.5275,19936,423.8 279,320.1
147,137.2 319,601.547,613.3322,812.348,327.5 327,647.6
245,605.7 365,207.246,066.4368,878.746,757.4 374,405
345,081.8 410,28945,537.2414,415.946,220.3 420,625.3
Table 13. Configuration parameters of structural specimens.
Classification of SpecimensApplication Areas of ECCStirrup Ratio of Coupling BeamsType of Longitudinal ReinforcementType of ConcreteType of ECC
Structure 5-1Coupling beams and the lower 400 mm of shear walls1.13%HRB335C40E40
Structure 5-2HRB400
Structure 5-3HRB500
Table 14. Energy dissipation with varied reinforcement strengths (J).
Displacement Loading LevelNumber of CyclesStructure 5-1Structure 5-2Structure 5-3
Single-CycleCumulativeSingle-CycleCumulativeSingle-CycleCumulative
11551.2 1551.21797.91797.92079.2 2079.2
2738.9 2290.1851.82649.7980.2 3059.4
3435.2 2725.3496.23145.9569.3 3628.7
17502.7 10,2288679.711,825.610,056.5 13,685.2
26475.0 16,7037490.819,316.48682.3 22,367.5
36162.1 22,865.17128.826,445.28269.4 30,636.9
119,152.0 42,017.122,147.148,592.325,690.6 56,327.5
218,233.0 60,250.121,093.269,685.524,468.1 80,795.6
315,311.9 75,56217,704.687,390.120,531.3 101,326.9
124,264.6 99,826.628,071115,461.132,562.4 133,889.3
222,072.1 121,898.725,534.6140,995.729,612.1 163,501.4
321,431.1 143,329.824,787.2165,782.928,753.2 192,254.6
131,878.6 175,208.436,879.5202,662.442,780.2 235,034.8
231,681.2 206,889.636,651.1239,313.542,510.3 277,545.1
331,019.4 237,90935,885.5275,19941,627.2 319,172.3
141,156.9 279,065.947,613.3322,812.355,227.4 374,399.7
239,819.8 318,885.746,066.4368,878.753,429.0 427,828.7
339,376.4 358,262.145,537.2414,415.952,819.2 480,647.9
Table 15. Recommended parameter values.
Use Regions of ECC in Composite Coupling BeamsUse regions of ECC in Shear WallsStirrup Ratio of Coupling BeamsStrength of Longitudinal ReinforcementStrength of ECC
Coupling beams14% structural height (400 mm)0.5%HRB400E40
Disclaimer/Publisher’s Note: The statements, opinions and data contained in all publications are solely those of the individual author(s) and contributor(s) and not of MDPI and/or the editor(s). MDPI and/or the editor(s) disclaim responsibility for any injury to people or property resulting from any ideas, methods, instructions or products referred to in the content.

