
Environmental Sustainability of Building Materials in Turkey: Reference Information Recommendations for European Green Deal Declarations

Abstract
:1. Introduction
- Global warming (or climate change) is due to GHG emissions from human activities [2]. Global warming potential (GWP) is measured as GHG emissions expressed in carbon dioxide (CO2) equivalents according to the Intergovernmental Panel on Climate Change (IPCC) Guidelines [7]. The construction industry is responsible for one-third of the world’s GHG emissions [8]. One of the components of concrete, the most fundamental building material today, is cement, and its production is an essential source of CO2 emissions [9]. Additionally, concrete is usually produced off-site and transported to the site; this leads to GHG emissions from transportation [9].
- Acidification potential (AP) expresses the building material’s contribution to the environment’s acidification [10]. Acidification is caused by substances such as sulfur dioxide (SO2), nitrogen oxides (NOx), ammonia (NH3), and the substances released as a result of their reactions [11]. Multiplying the emissions of these substances by equivalence factors and converting them into hydrogen ion (H+) equivalents is a measure of AP [12]. Acidifiers, mainly released from combustion fossil fuels, are released during the life cycle of building materials, especially during the manufacturing and transportation stages. Estokova vd. (2017) [10] examined the embodied energy, GWP, and AP environmental impacts of built-in materials used in twenty masonry buildings. While it was revealed that foundation materials caused the most negative environmental impact, the GWP share in the study was determined to be 57.8%, and the AP share was 30.4%.
- Air pollution is caused by the emissions of the main air pollutants SO2, NOx, O3 (ozone), CO (carbon monoxide), VOCs (volatile organic compounds), PM (particulate matter), and Pb (lead) [13]. The leading causes of air pollution include acidification and eutrophication [14]. As stated in the CACC (2019) [15] news, 1500 billion bricks, commonly used building materials worldwide, are produced in polluting kilns. Ninety percent of the bricks in the world are produced in Central Asia, and significant air pollutants are released while transporting these materials to the global market. Due to brick burning and transportation processes, large amounts of PM, black carbon, SO2, and CO2 emissions are released and cause air pollution [15].
- The impact of ecological toxicity is measured by converting emissions from the life cycle processes of building materials into 2,4-D (2,4-Dichlorophenoxyacetic acid) equivalents according to TRACI (2009) [12,16]. Pacheco-Torgal and Jalali (2011) [17] stated that even though most of the existing buildings are built following legal regulations, practitioners may need to learn the toxic properties of the materials or include toxic building materials due to economic factors. For instance, although the toxicity of Pb has been known for many years, replacing plumbing systems containing Pb requires high costs [17]. On the other hand, some blast furnace slags and fly ashes used in concrete may have radioactive properties [18].
- Eutrophication is the enrichment of natural water resources in nitrogen (N) and phosphorus (P) by both natural and artificial means [19]. Eutrophication potential (EP) is measured by converting the eutrophication-causing emissions of building materials within their life cycle into N equivalent [16]. Marzouk et al. (2017) [20] estimate that building materials contribute to eutrophication in their life cycle as follows: 44% production and transportation phase, 16% on-site transportation and application phase, 2% using phase, 23% maintenance and repair phase, 12% demolition phase, and 3% recycle phase. On the other hand, Islam et al. (2016) [21] expressed that 77% of shipping containers used for shelter in Australia cause eutrophication during their life cycle. In their study, Kim and Chae (2016) [14] determined that coarse aggregate and fine aggregates used in the concrete production phase cause both acidification and eutrophication.
- Fossil fuel depletion results from fossil fuels used in the life cycle stages of building materials. Depending on the combustion of fossil fuels in vehicle engines, pollutants such as NO (nitrogen monoxide), CO, CO2, VOC, NO2 (nitrogen dioxide), and O3 are released [22], and at the same time, these pollutants cause photochemical smog formation. Hahnel et al. (2021) [23], in their study examining the life cycle environmental impacts of timber, steel, and concrete structural flooring systems, determined that the most dominant environmental impacts are global warming and fossil fuel depletion.
- Indoor air quality depends on VOCs emitted into the indoor air from different sources. Various chemicals used in some building materials, such as fire retardants, anti-stain chemicals, and plasticizers, are released into the indoor air over time [24]. Alyüz and Veli (2006) [25] state that building materials cause significant VOC emissions due to the use of chemical substances in their production and their application in the building. The essential sources of VOCs are building materials and decoration materials [25].
- Land use refers to land transformations. Excavations carried out to obtain raw materials for building materials, use of agricultural lands during the production process, land occupation during the use phase, and land occupation during the waste storage and disposal phases are land use. For instance, due to the methods used to obtain limestone, which is one of the raw materials of cement, and to obtain aggregate and sand for concrete production, effects such as destruction of the habitats of plants and animals, changes in topography, and pollution of waterways occur [26]. When aggregate and sand are obtained from stream beds, land use occurs, the bottom boundaries of the stream beds change, and habitats are altered [27].
- Ozon depletion originates from chlorofluorocarbons (CFCs), widely used in buildings’ air conditioning and ventilation systems, which cause ozone depletion when released into the atmosphere [28]. The CCAC (2015) report [29] states that the emissions of substances from ozone depletion increase by 8–15% every year due to population growth and urbanization.
- Water depletion occurs directly and indirectly during the production of building materials [30]. Following a series of case studies carried out in non-residentials in Australia, McCormack et al. (2007) [31] determined that 5 to 20 m3 of embodied water per m2 of gross floor area is consumed, and the building materials that cause embodied water are steel, concrete, and carpet, respectively. In the production process of these materials, water is used as a lubricant, cleaning agent, sealant, heat transfer medium, solvent, and air pollution control tool and for other purposes depending on the materials produced [30]. As another example of water depletion in terms of building materials, specifically in commercial buildings, replacing carpets in approximately ten years increases embodied water [32].
- Human health is affected permanently or temporarily by the environmental impacts mentioned above. For instance, photochemical smog formation causes respiratory tract irritation and lung irritation [33]. Ozon depletion causes various skin diseases, cataracts, immune system weakening, respiratory diseases, asthma attacks, and vascular occlusion in humans [34]. There are studies in the literature on the details of the human health impacts caused by building materials [35,36,37,38].
2. Materials and Methods
2.1. Materials
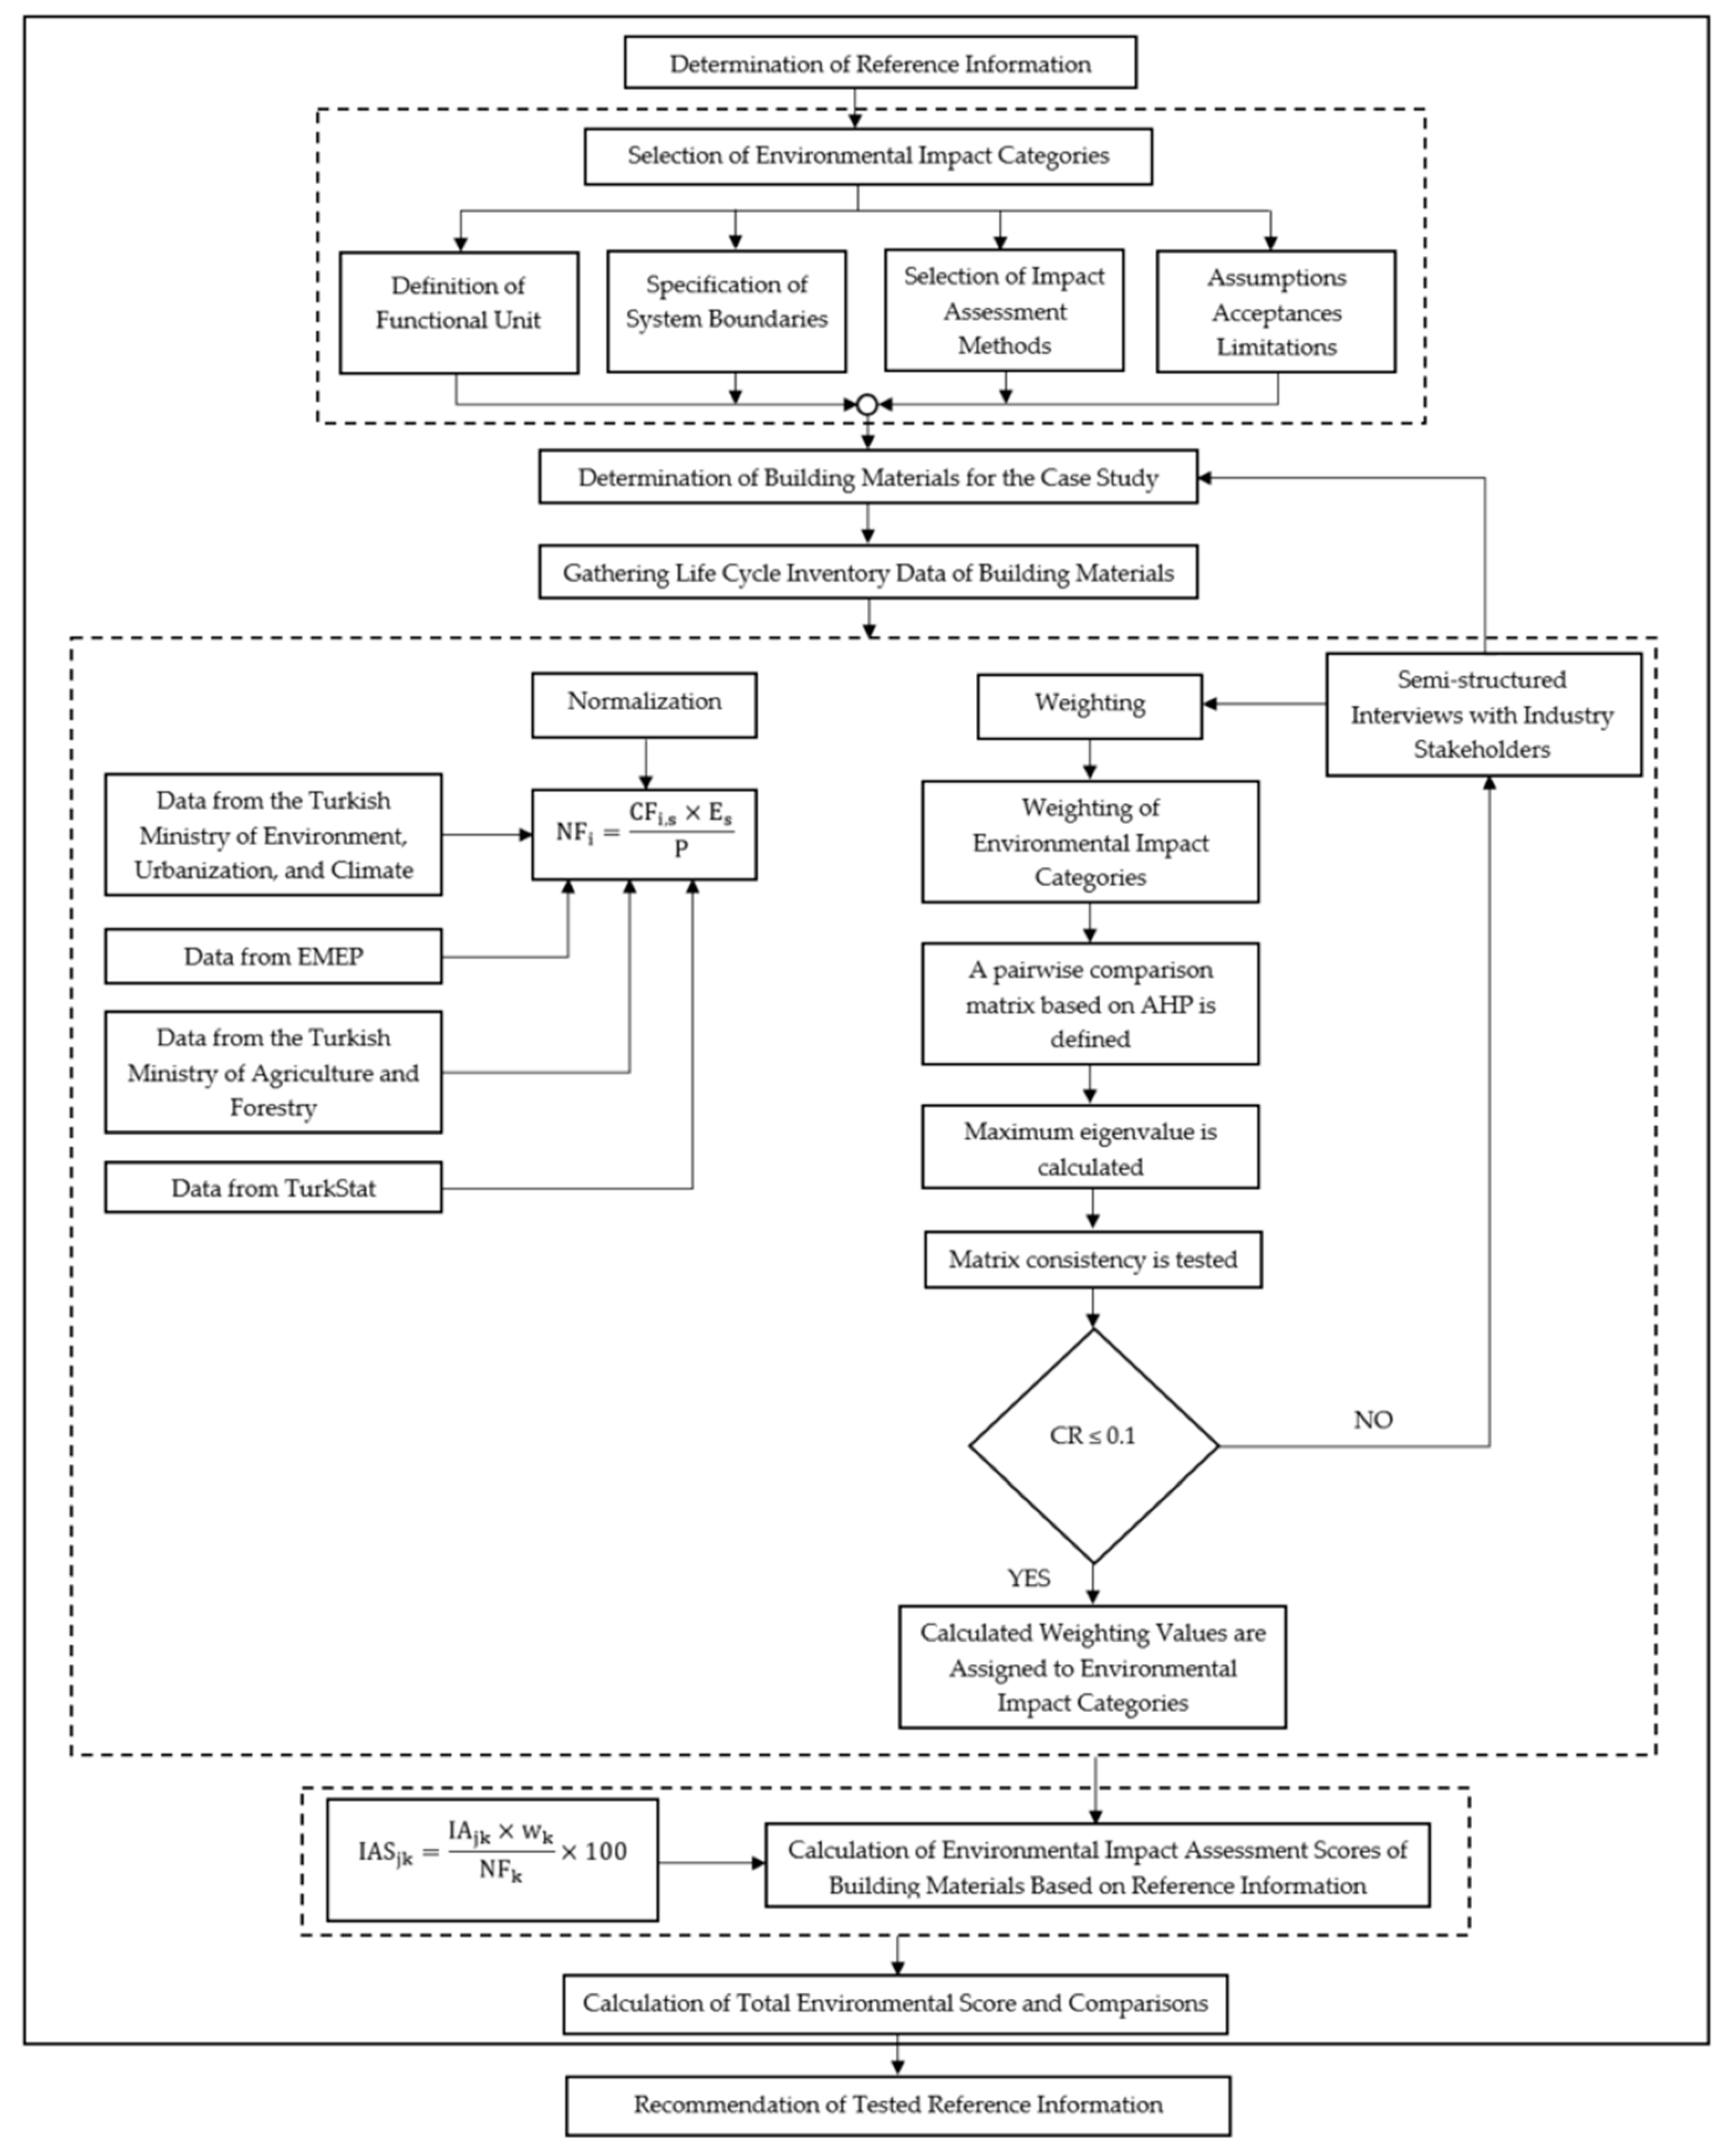
2.2. Methods
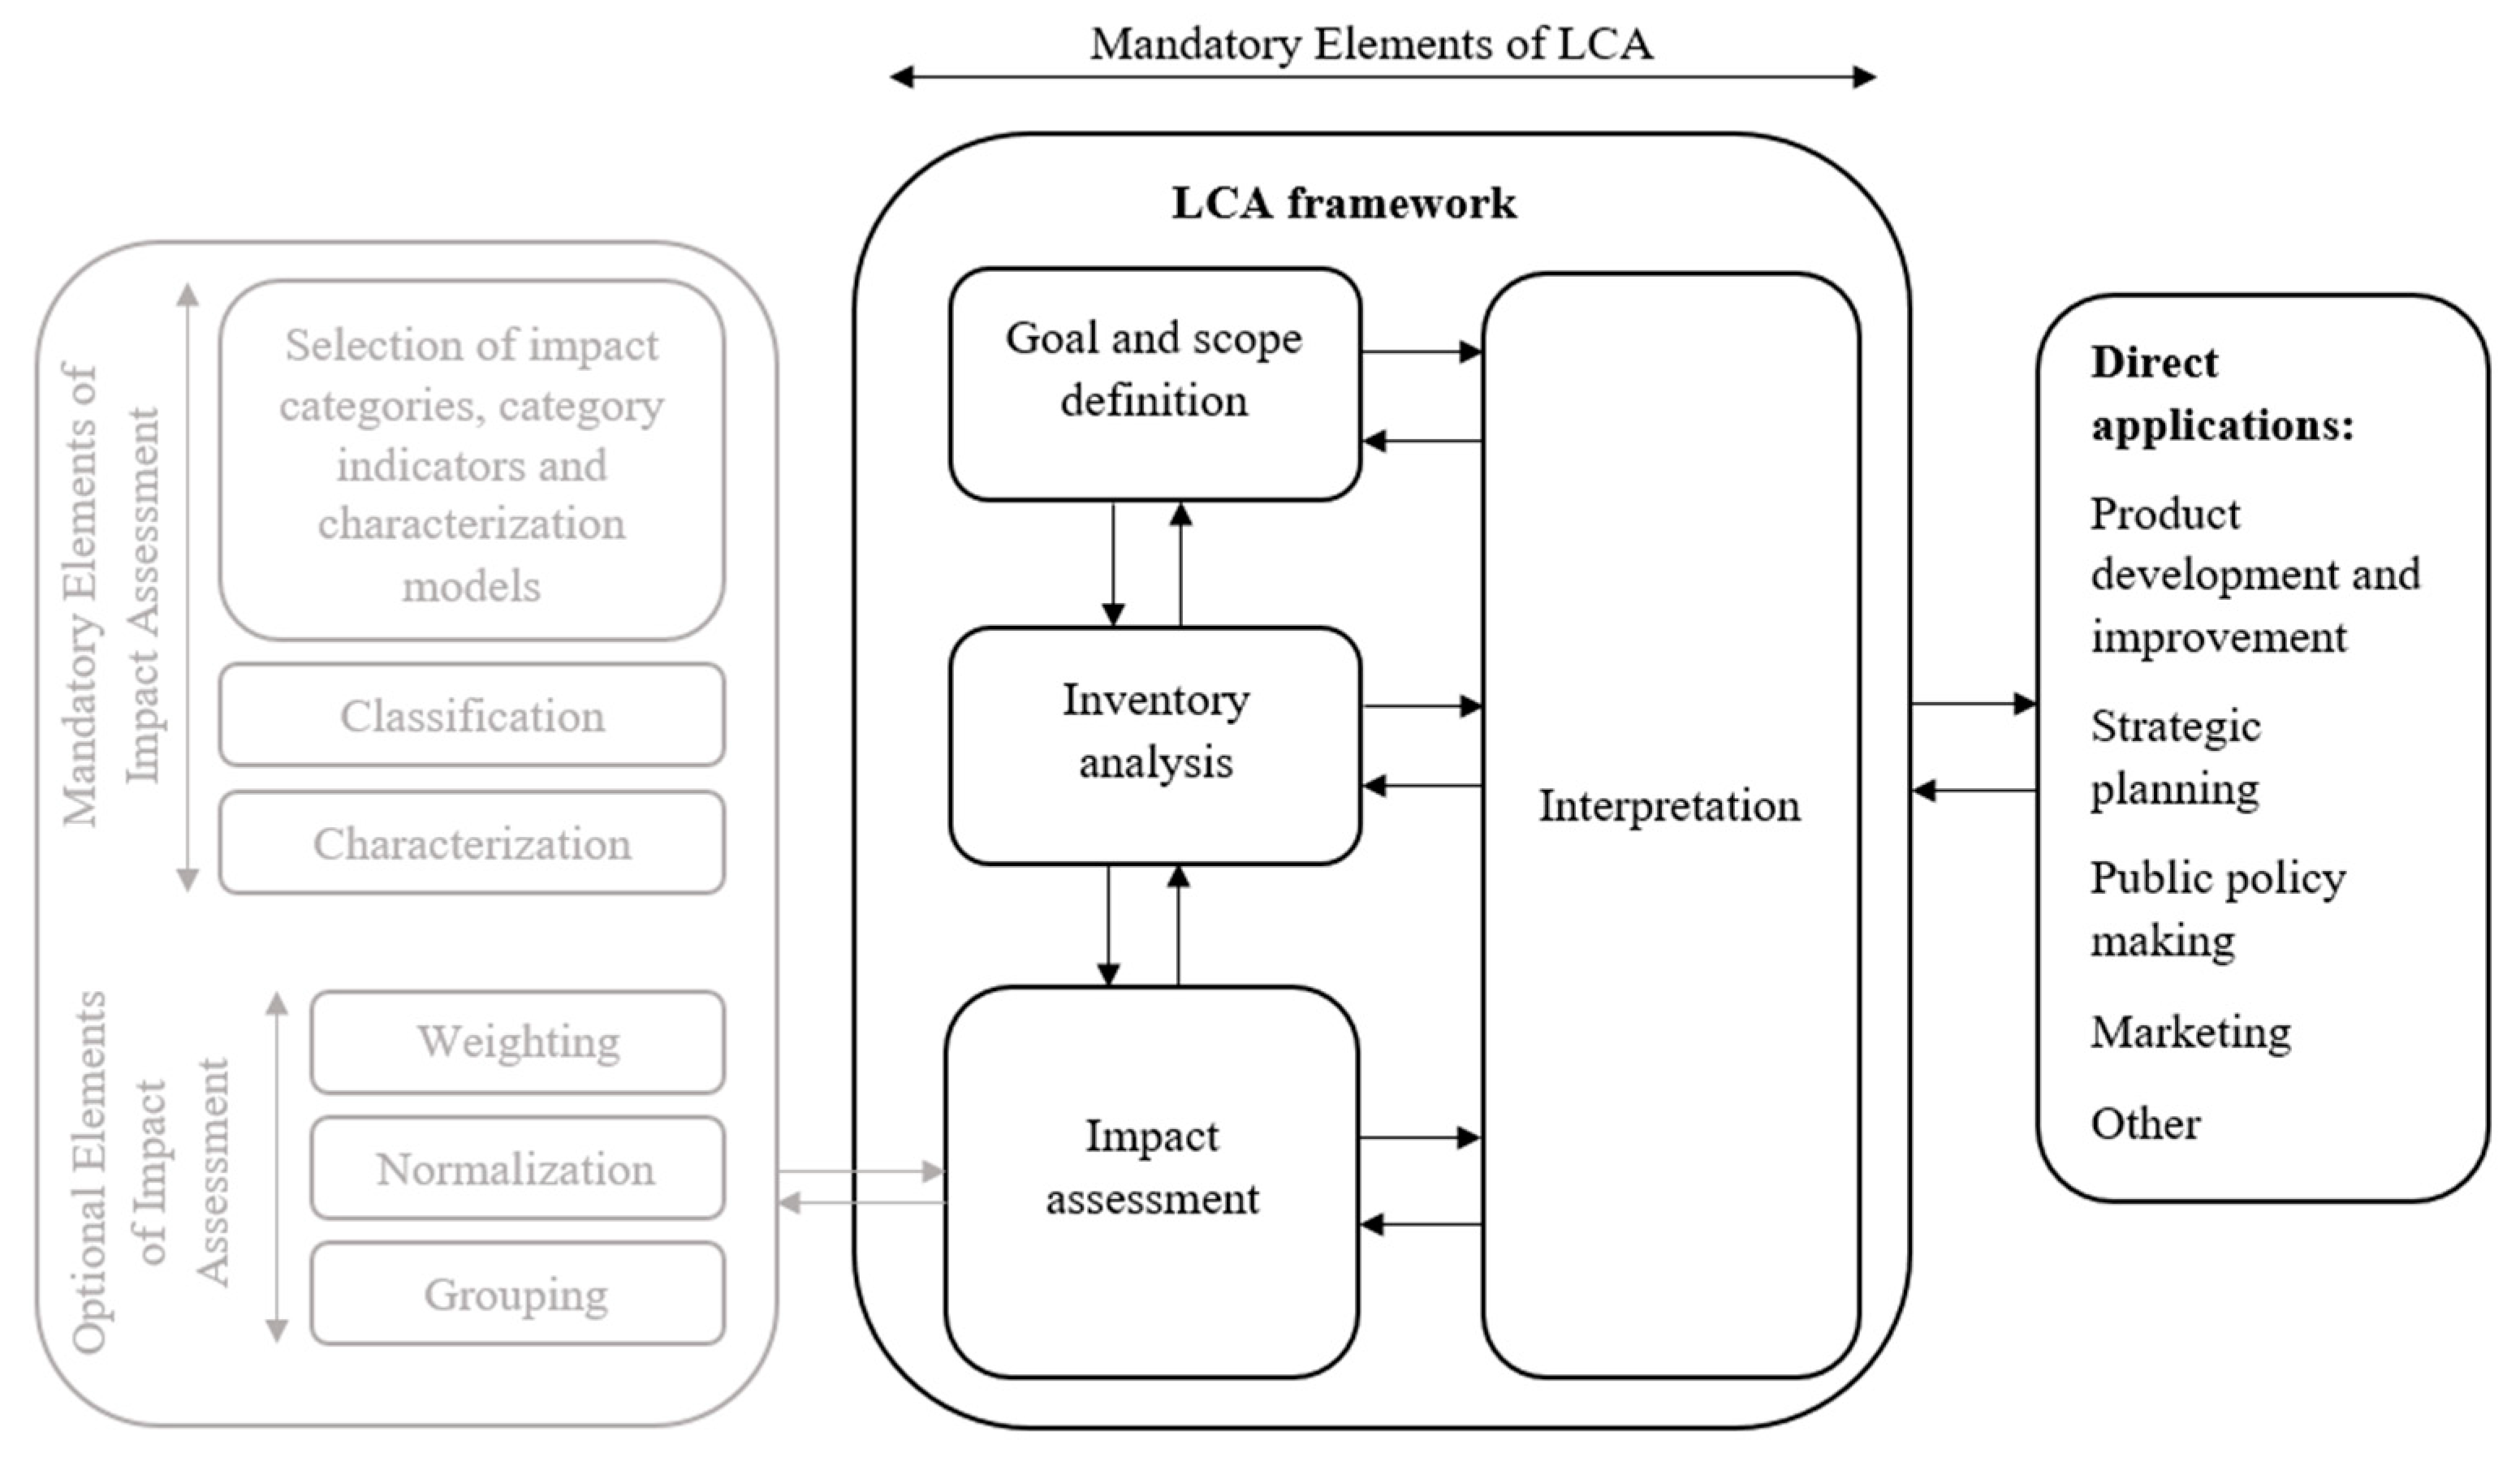
2.2.1. Life Cycle Assessment
2.2.2. Environmental Impact Calculation Method
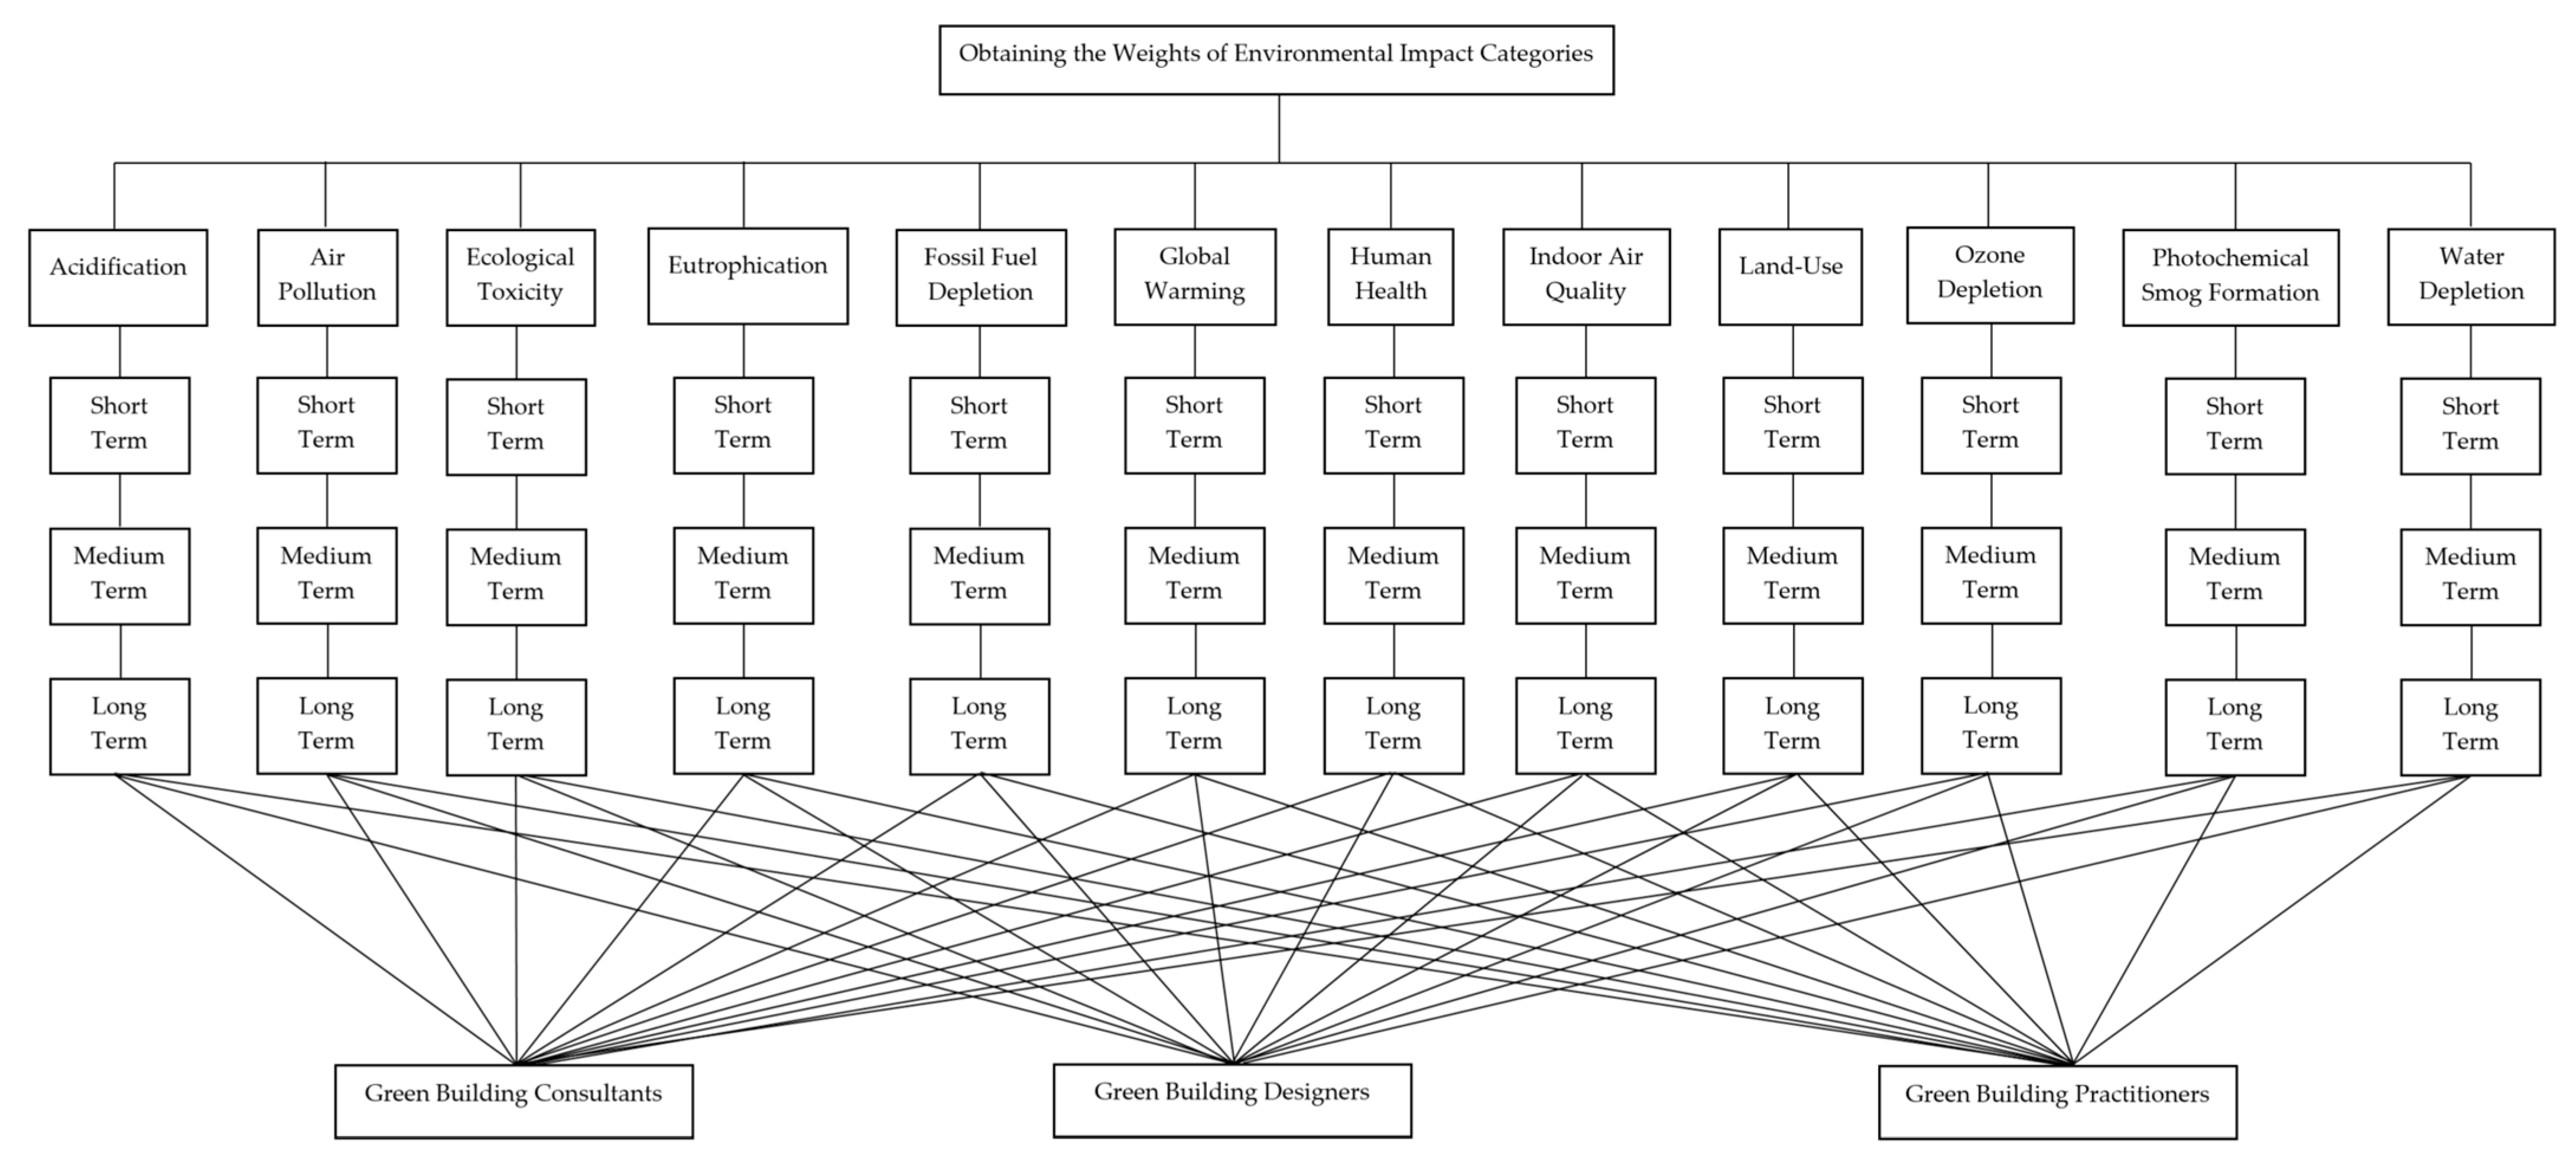
2.2.3. Weighting Calculation Method: Analytic Hierarchy Process
- The requirement for the pairwise comparison matrix to be consistent is that its maximum eigenvalue (λmax) is equal to the matrix size (n) [49]. The consistency ratio of the pairwise comparison matrix is calculated with the following equation [50]. If CR < 0.1, the matrix is consistent; otherwise, decision-makers need to revise their judgments in the pairwise comparison matrix until they obtain acceptable consistency [51].
2.2.4. Normalization Factor Calculation Method
2.3. Limitations
- (i)
- Turkey has no national database where the emission amounts of building materials throughout their life cycles are declared. Some emission data feeding the environmental impact categories could not be obtained.
- (ii)
- Some industry stakeholders contacted did not respond to semi-structured interview requests.
- (iii)
- When the study was initially planned, it was intended to test five different material groups (insulation, plaster, walls, floor coverings, and exterior wall finishes). However, while the BEES Online software used in the study was upgraded to BEES Online 2.0, the inventory data of the building materials in the previous version were removed from the database. Since the tested materials must have equivalents in the BEES Online database for comparisons to be made, the material groups used in the case study are limited to floor coverings and exterior wall finishes.
- (iv)
- In the normalization value calculations, 2018 was chosen as the reference year. When the inventory data declared by the Turkish Ministry of Environment, Urbanization, and Climate Change, Turkish Ministry of Agriculture and Forestry, TurkStat (Turkish Statistical Institute), and EMEP (European Monitoring and Evaluation Program) were examined, it was determined that the most comprehensive data regarding the selected environmental impact categories were for 2018. Another reason is that the Turkish Ministry of Environment, Urbanization, and Climate Change declares inventory data from two previous years every year.
3. Results and Discussion
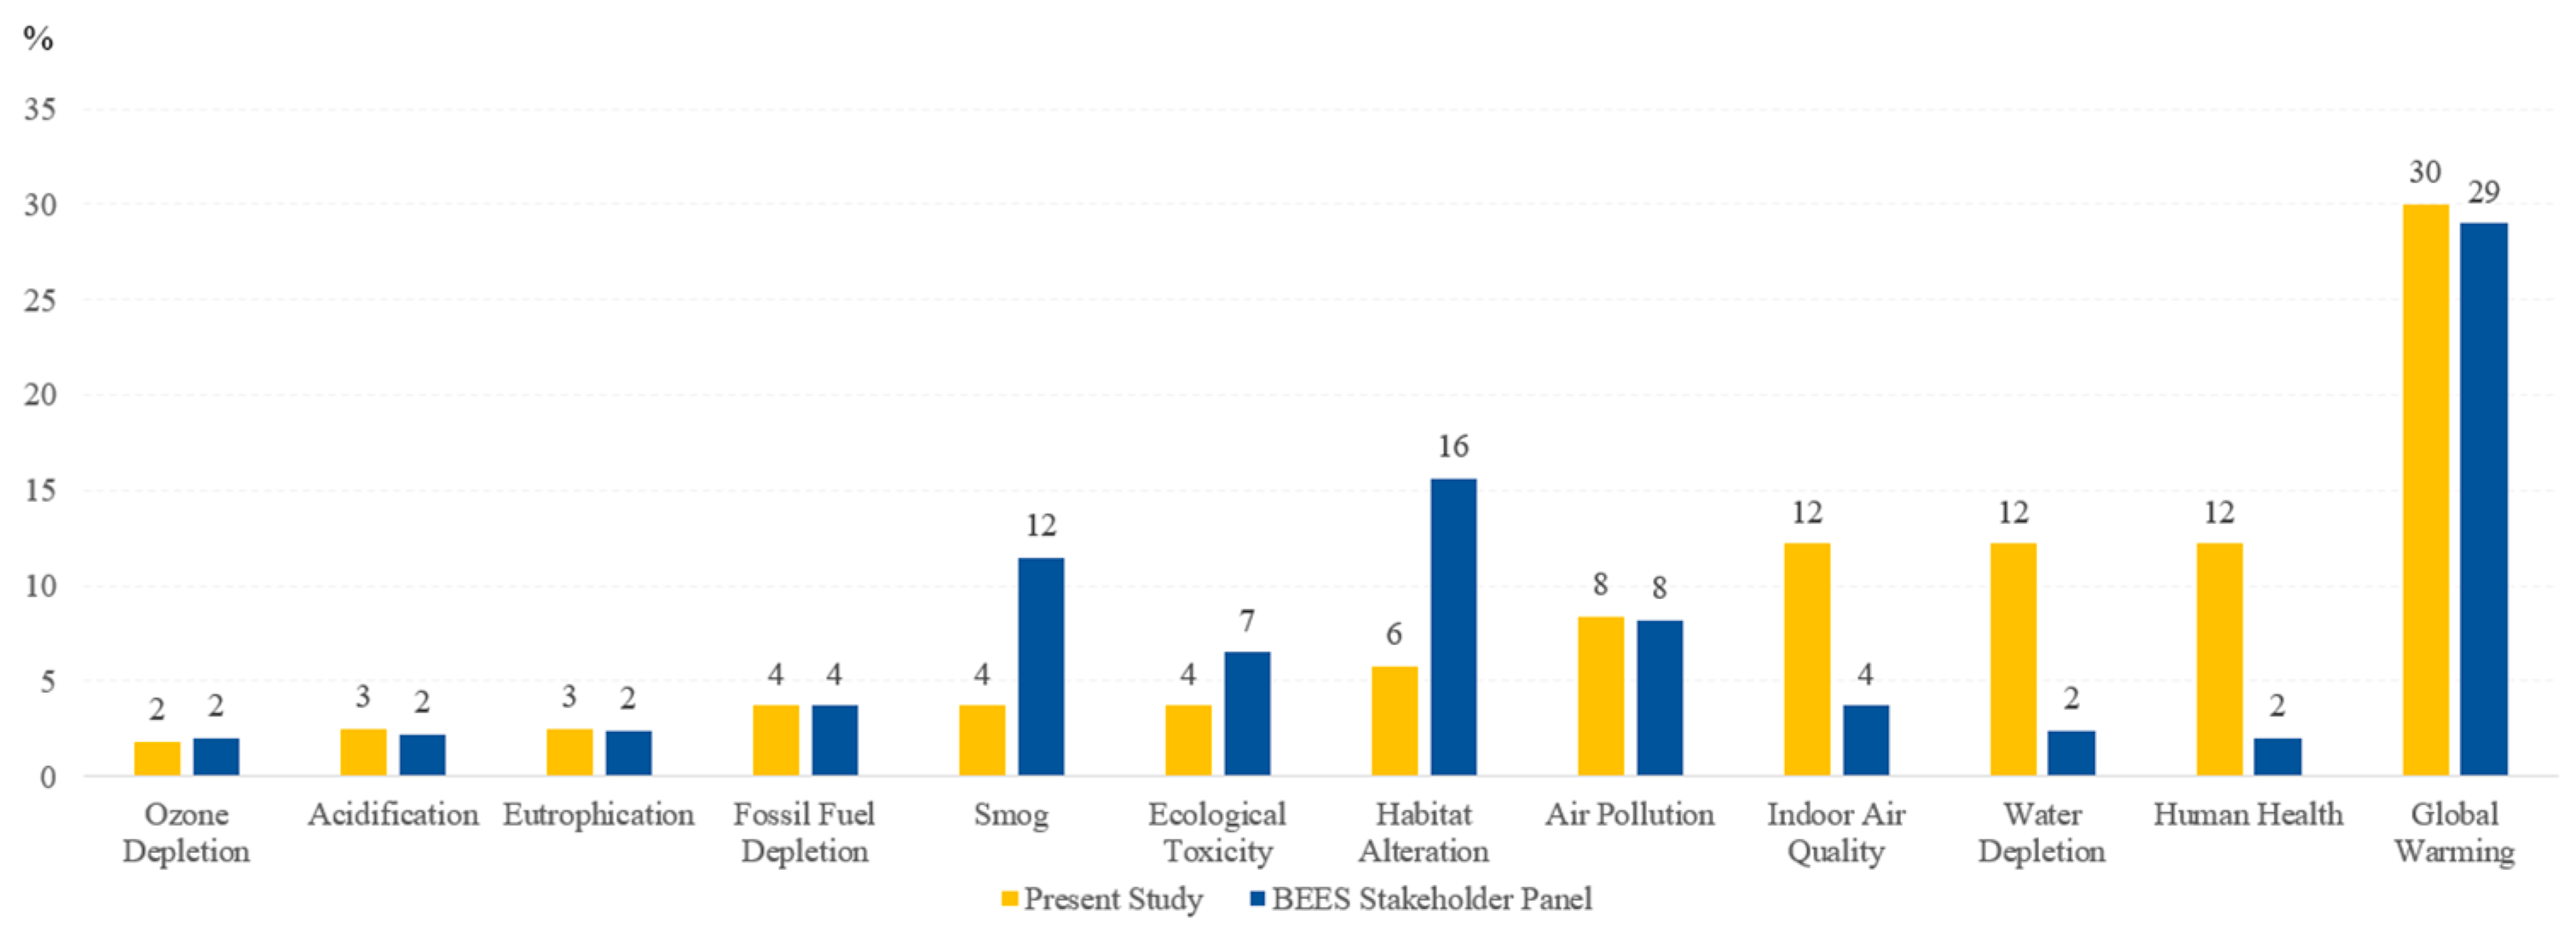
3.1. Weighting Reference Values
3.2. Normalization Reference Values
3.2.1. Calculation of Global Warming Normalization Reference Information Value
3.2.2. Calculation of Air Pollution Normalization Reference Information Value
3.2.3. Calculation of Acidification Normalization Reference Information Value
3.2.4. Calculation of Water Depletion Normalization Reference Information Value
3.3. A Case Study
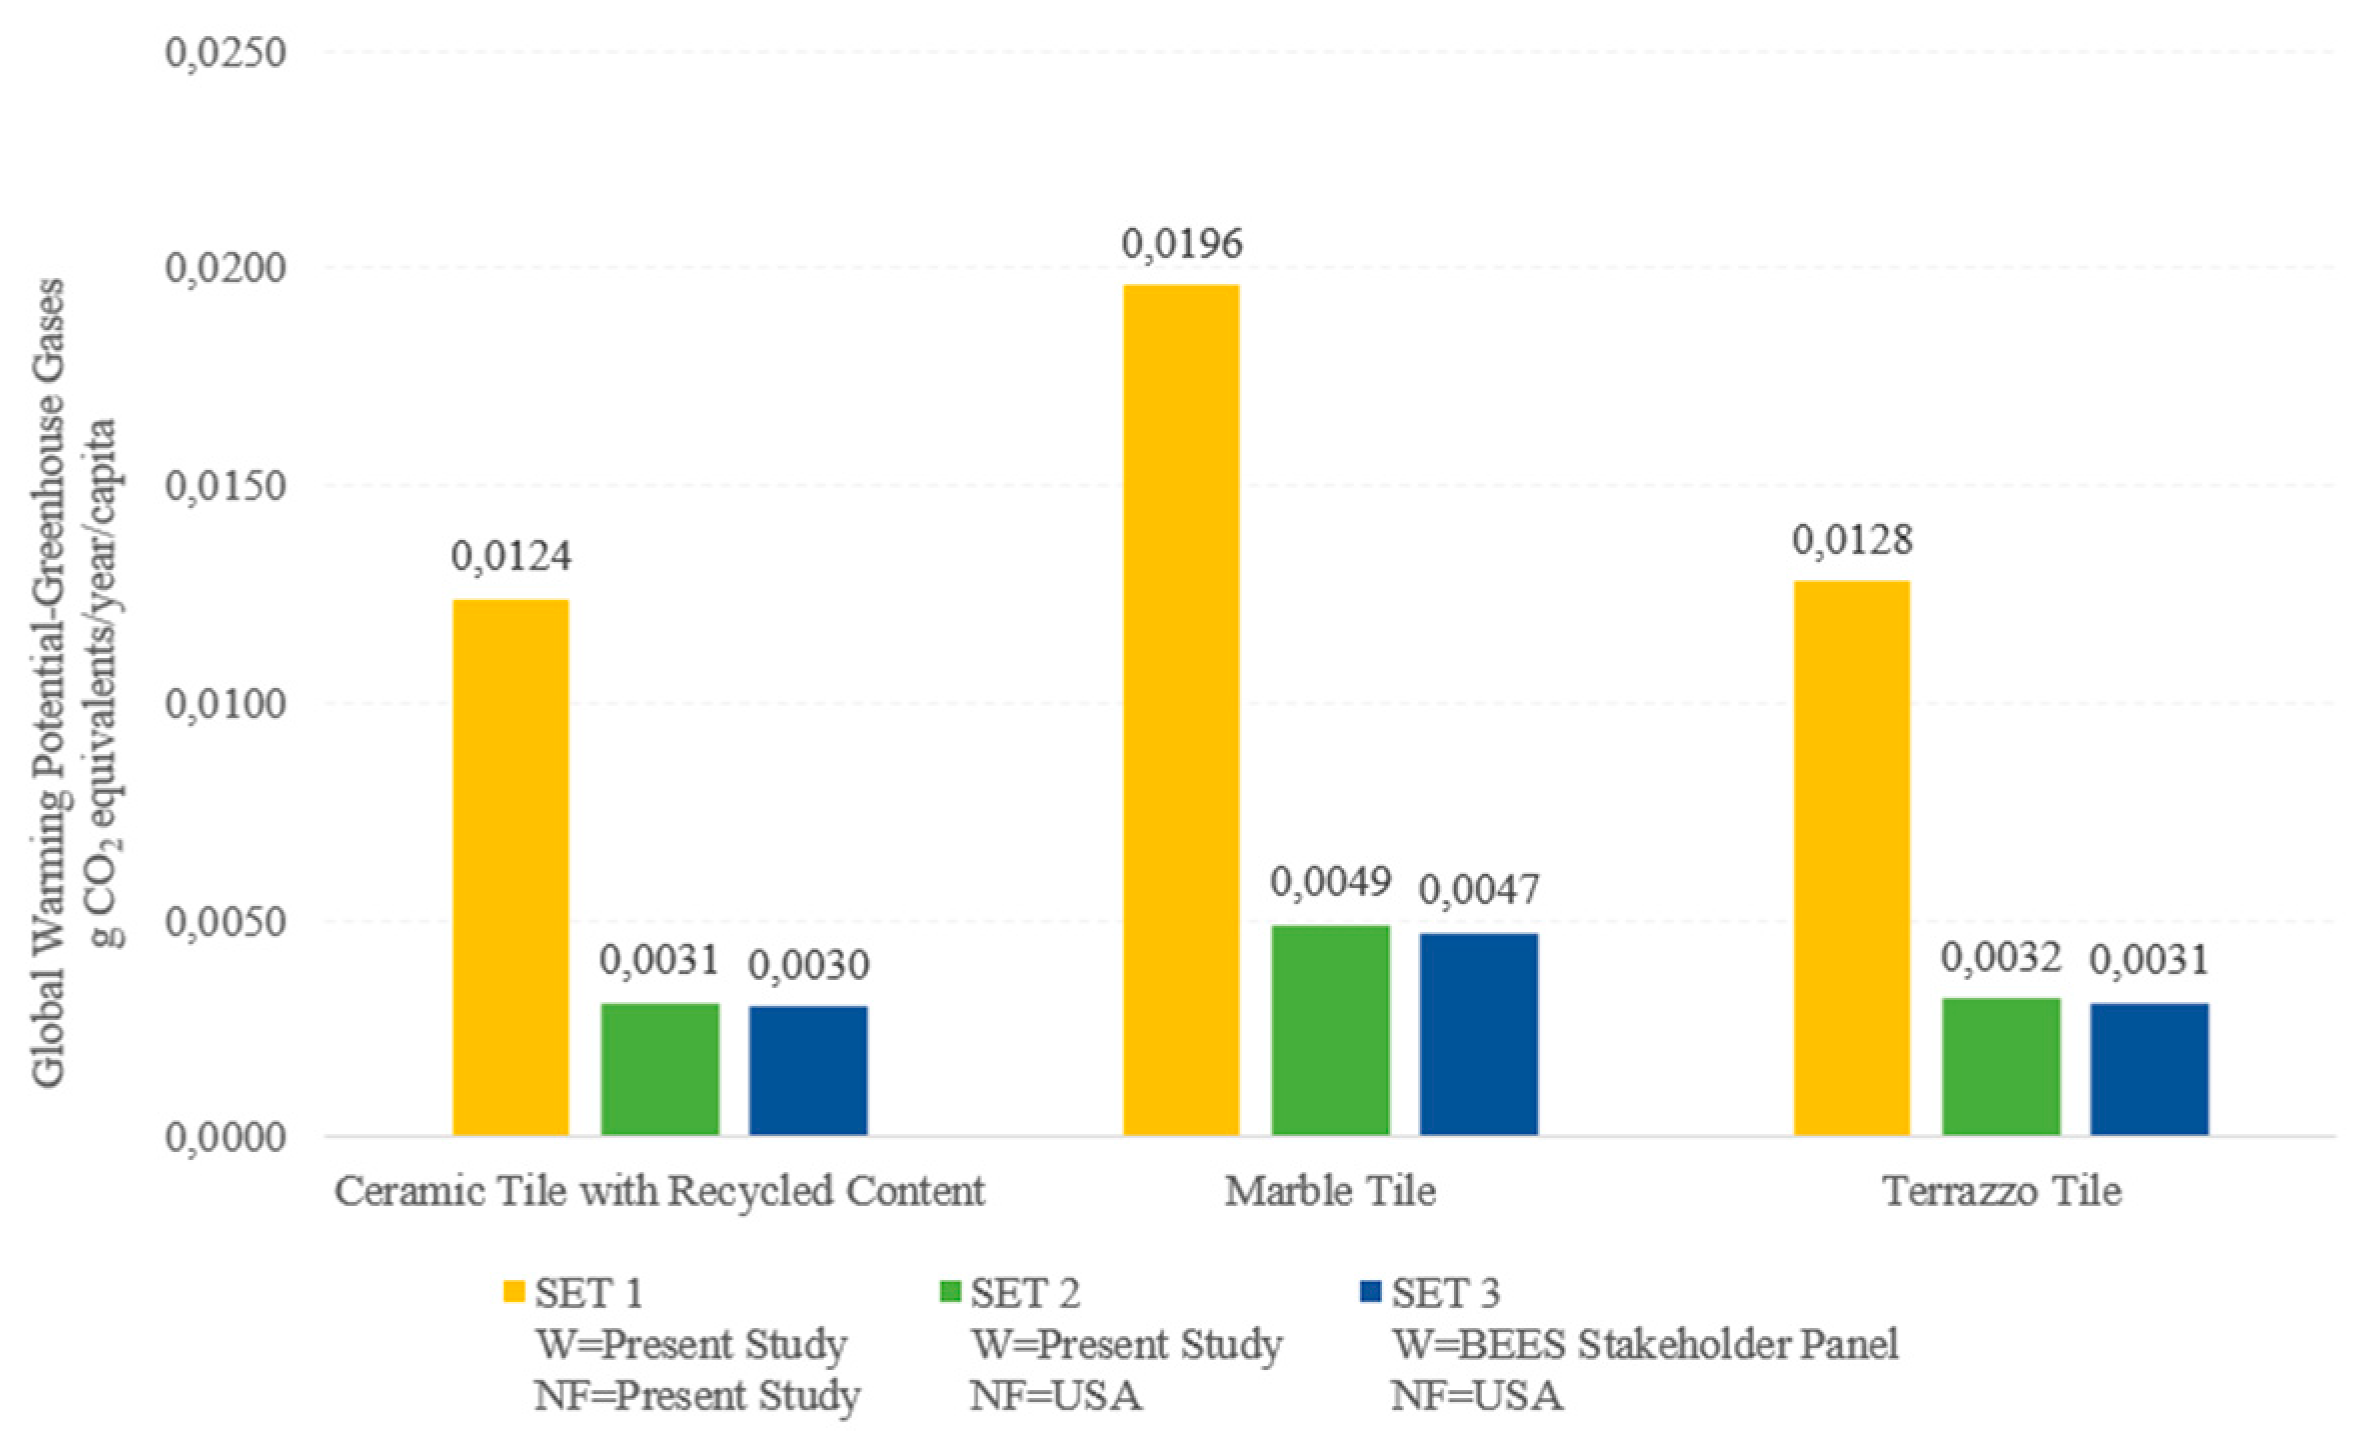
- The case study LCA’s goal and scope definition: The goals of the case study are to (i) calculate the environmental performance scores of building materials using the recommended reference information and (ii) show how the result would be affected if BEES Online’s default weighting and normalization values were used for Turkey without recommending reference information.In the calculations, the functional unit of each building material was considered in grams, per BEES Online. Twelve environmental impact categories were evaluated, as previously mentioned. The selected impact assessment approaches are the 100-year time horizon of the IPCC, the direct use of inventories approach, and the environmental problems approach. The system boundary of the study is the cradle-to-grave approach. The service life of building materials is assumed to be 50 years. In BEES calculations, the building materials are assumed to be transported in one direction from 500 miles.
- The case study LCA’s inventory analysis: As mentioned before, there is no platform, database, legal obligation, or encouraging application where the inventory data within the life cycle of building materials are declared in Turkey. For this reason, the life cycle inventory data of the building materials given in Table 1 were obtained from the BEES Online database while performing the case study within the scope of the study.
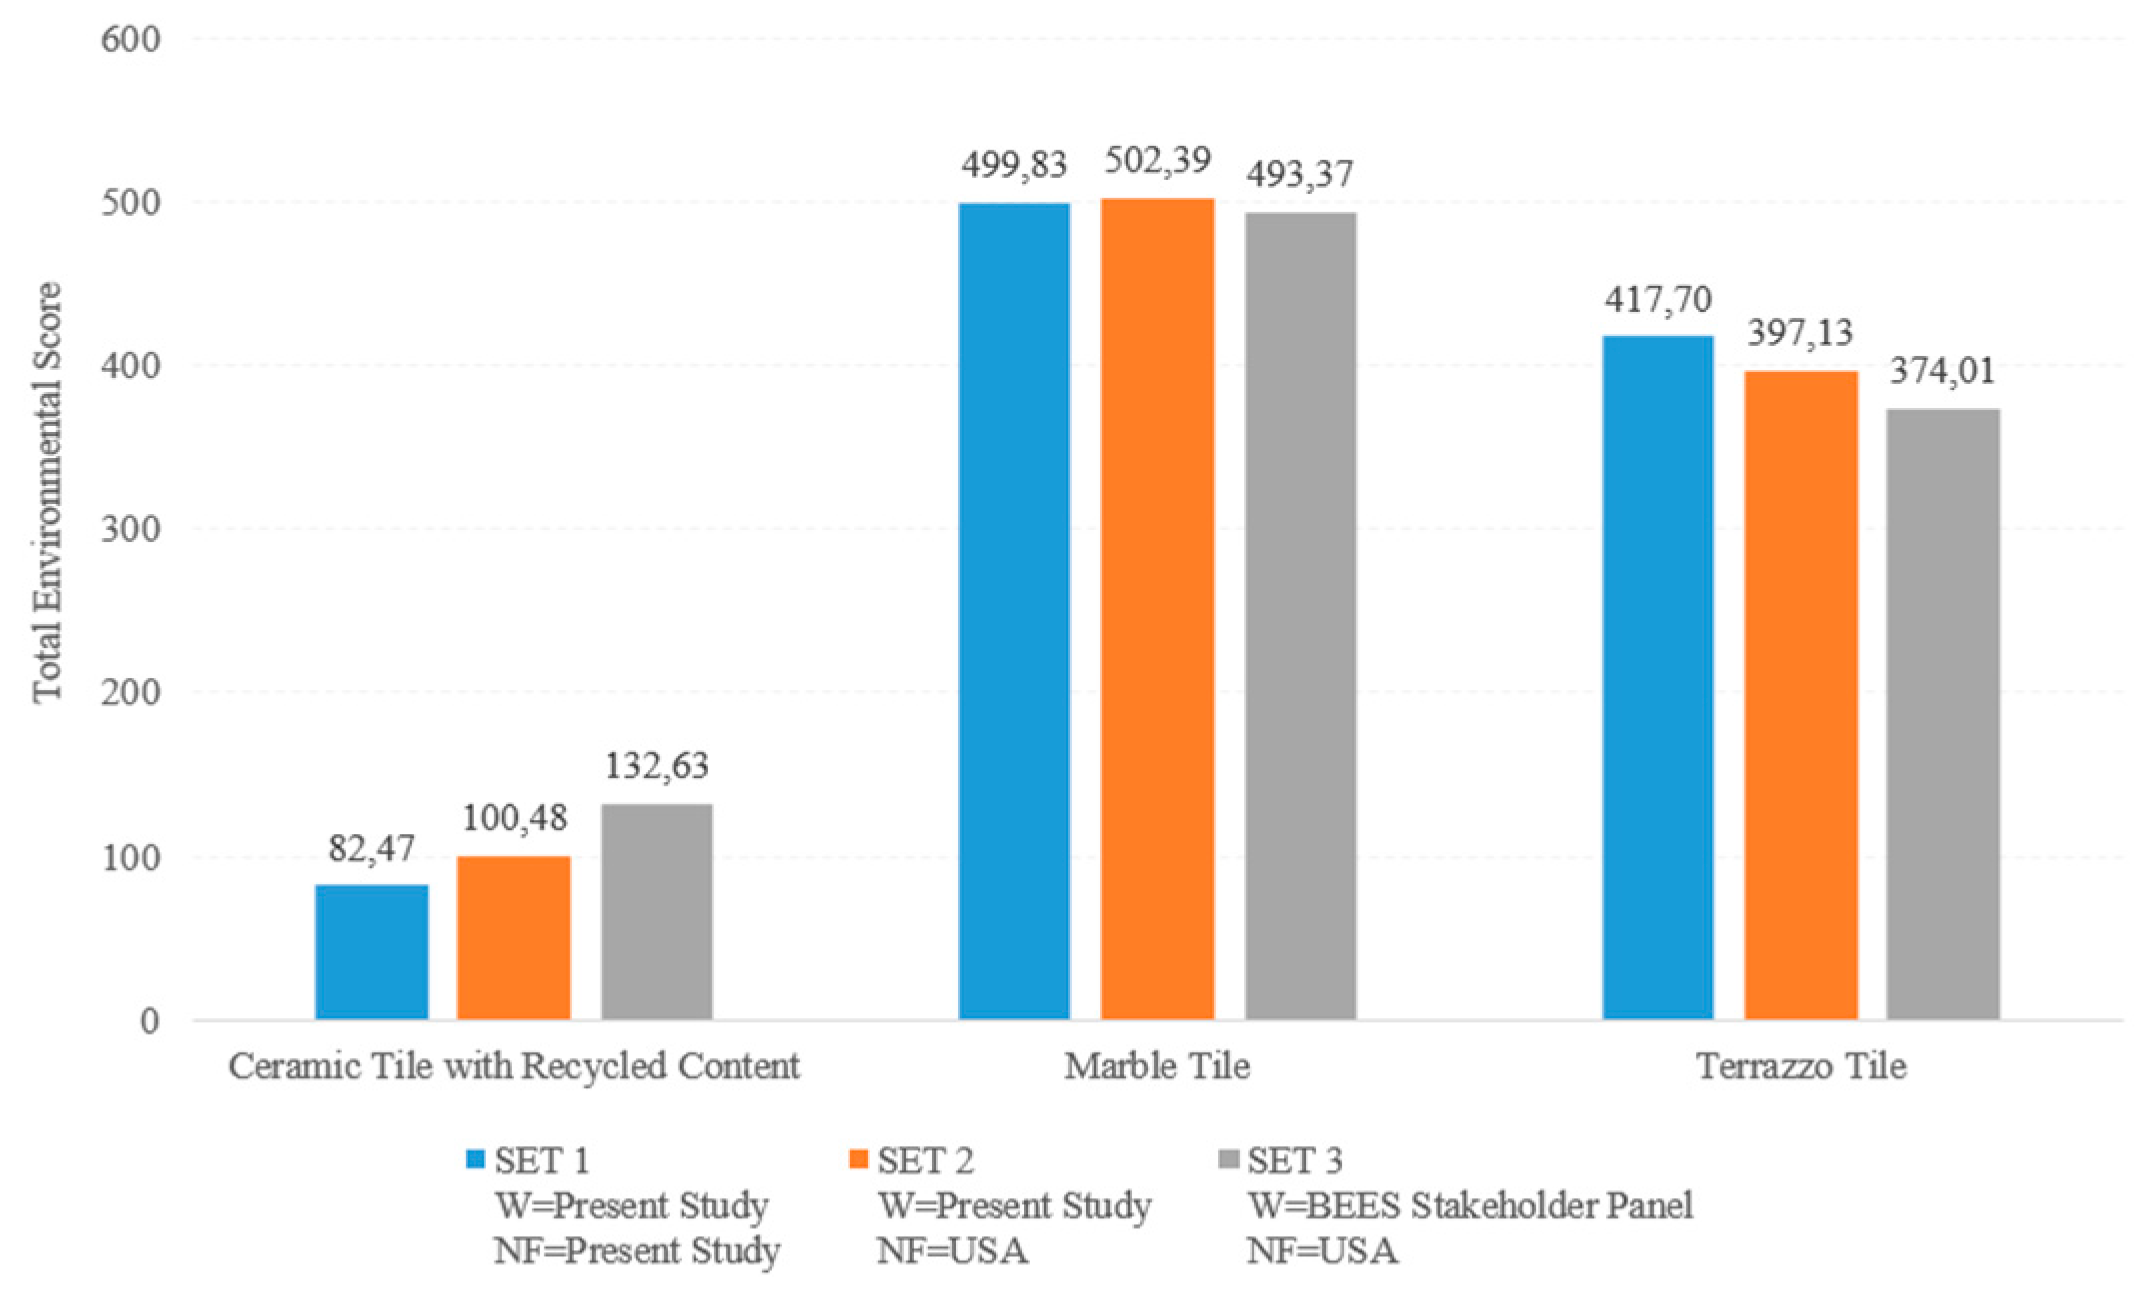
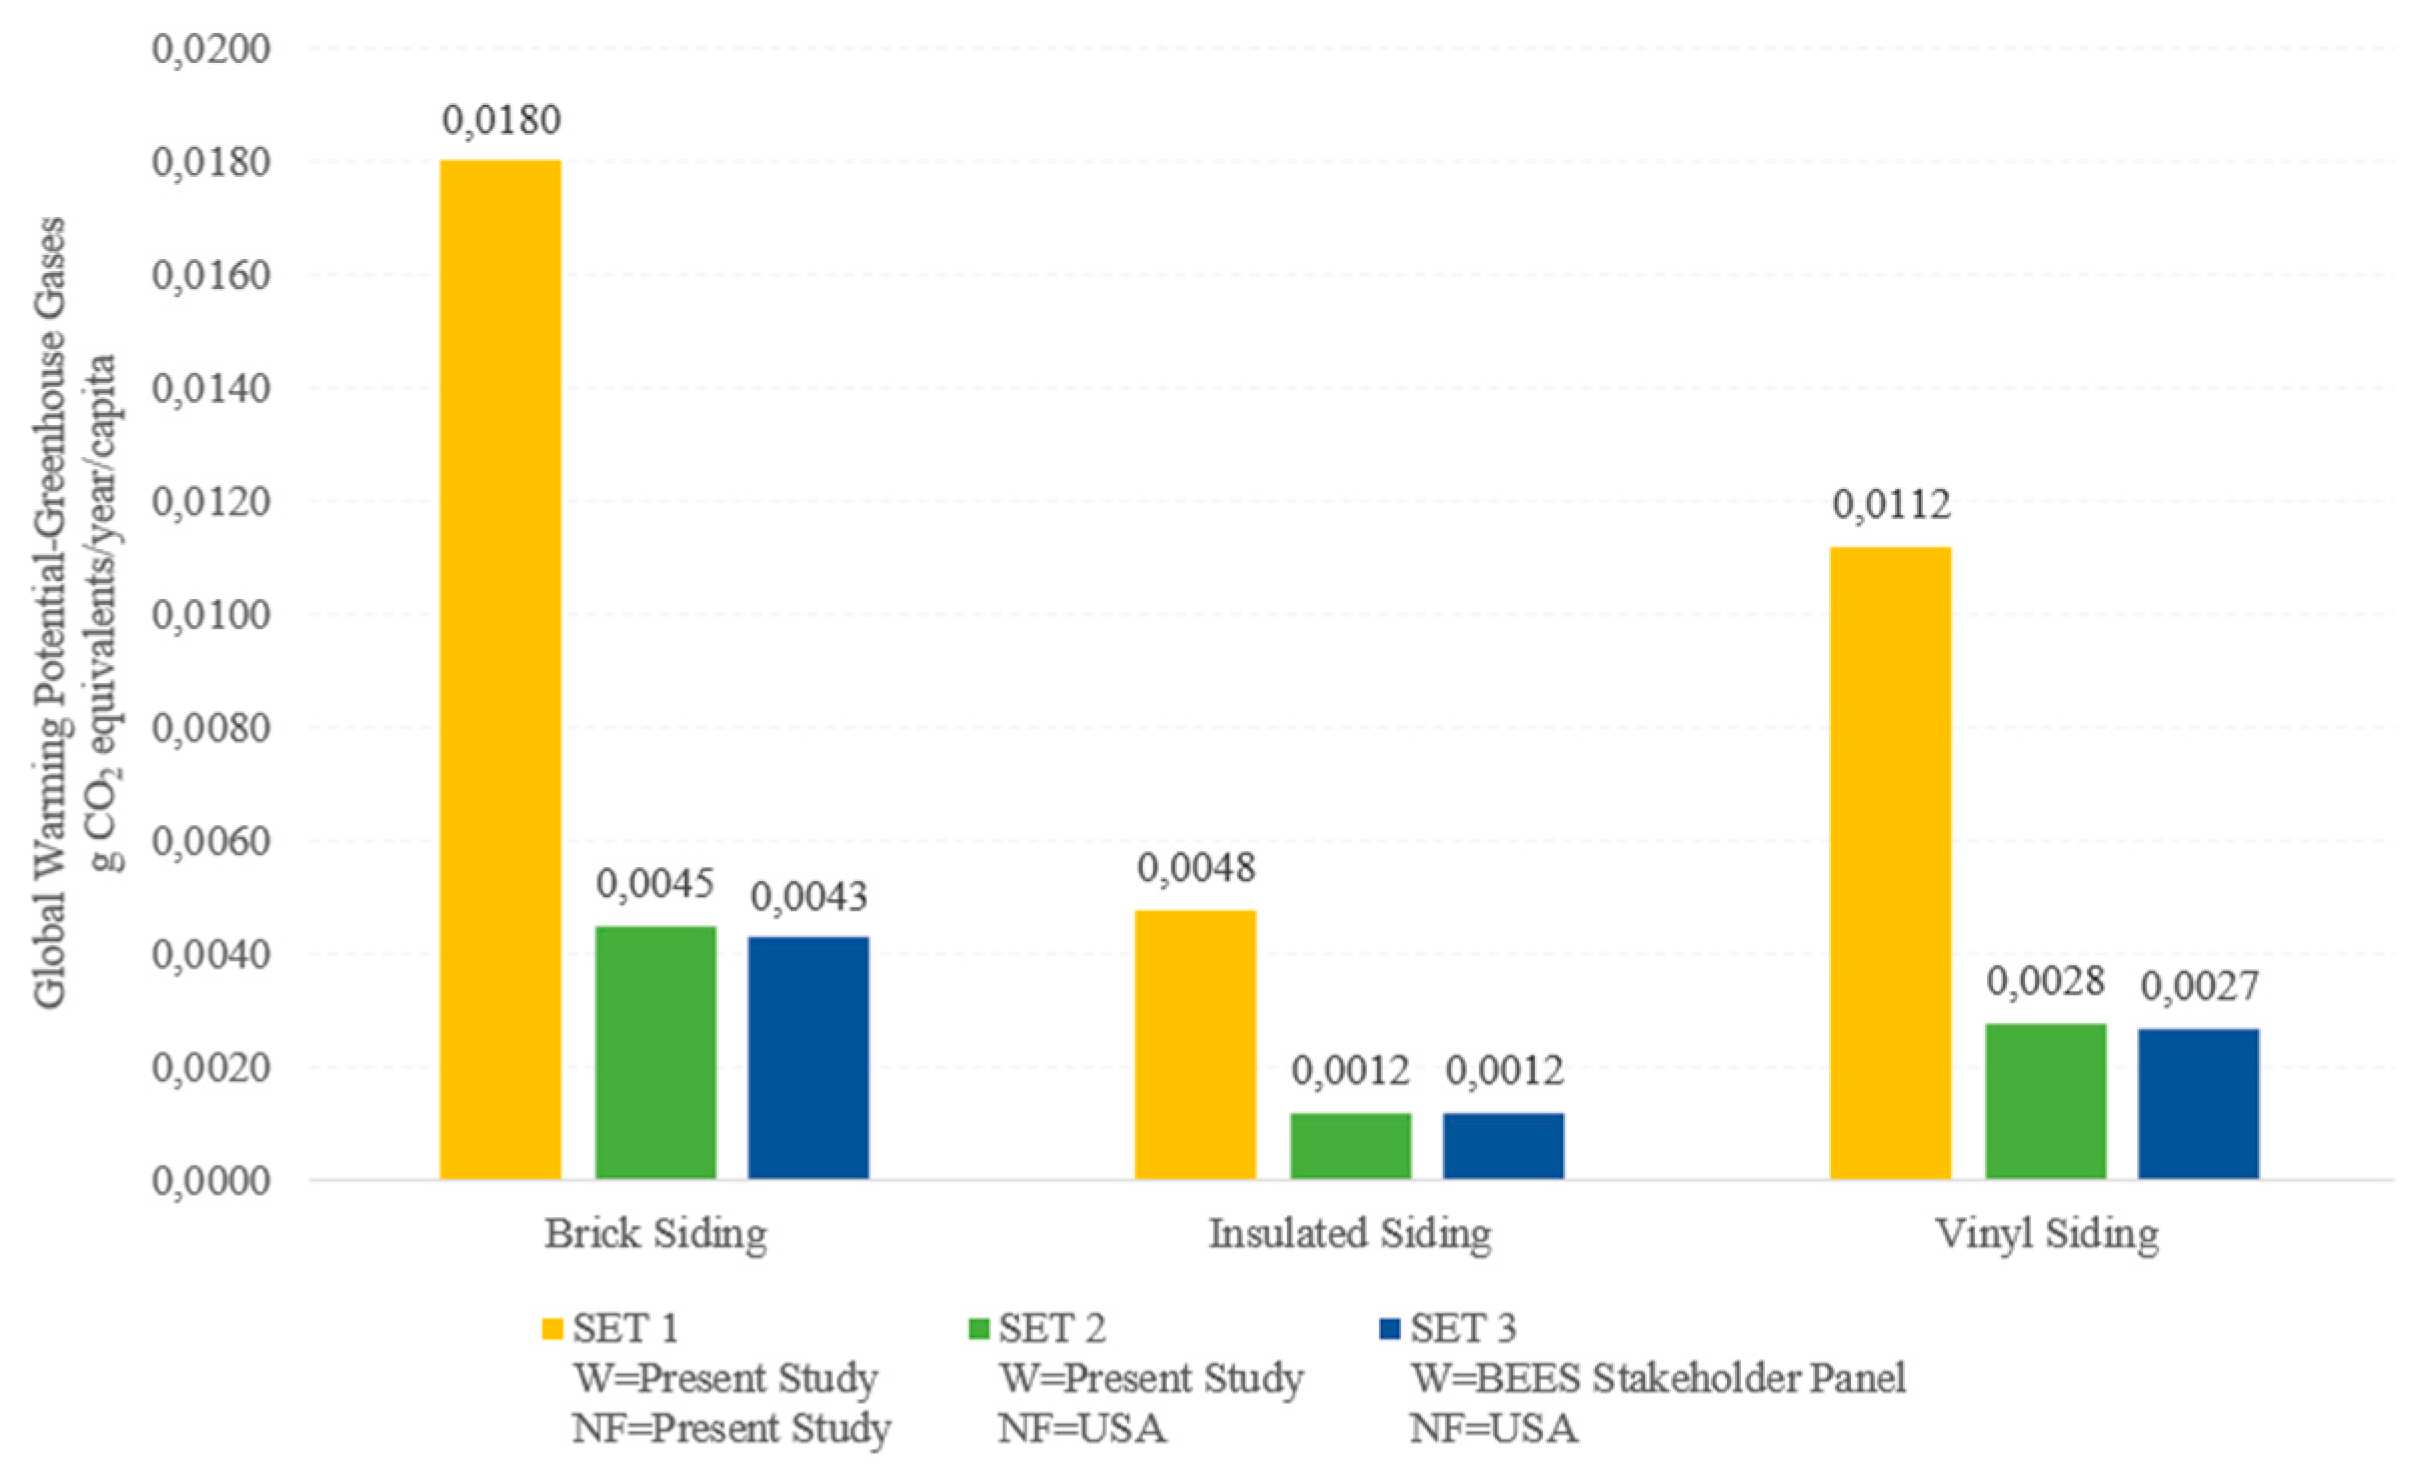
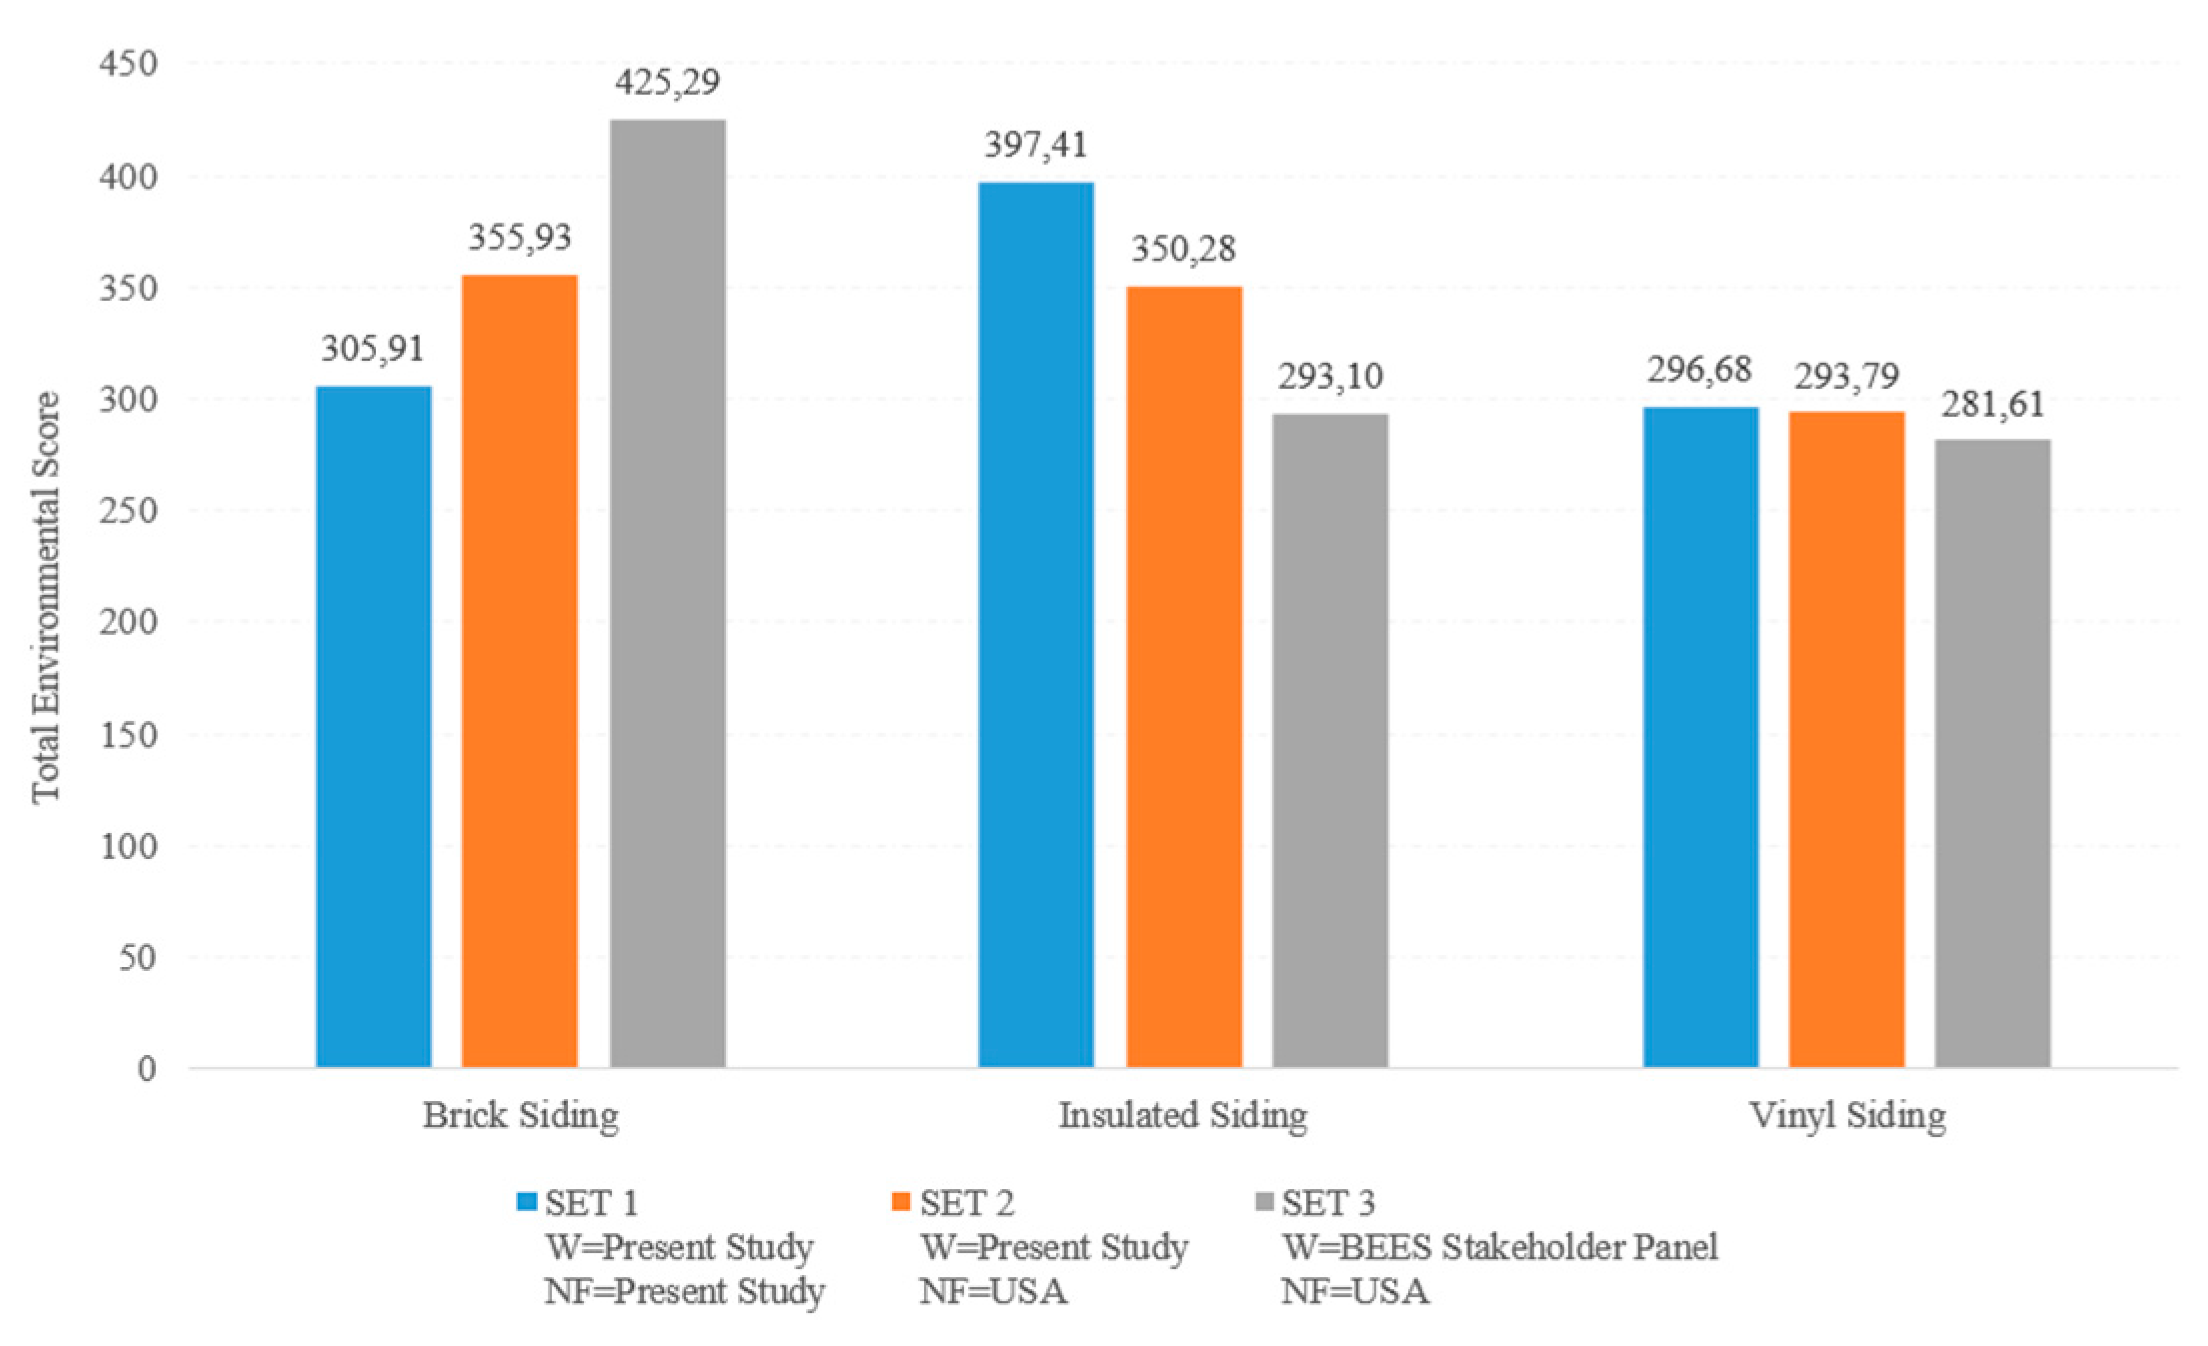
- The case study LCA’s impact assessment: The total environmental score is calculated by summing the effects into twelve environmental impact categories of the building materials evaluated in the case study. Equations (1)–(4) were used to calculate total environmental scores. To show the importance of regional adaptation of the reference information values calculated in the study, the total environmental scores of the building materials in Table 1 were calculated using different weights and normalization values.
- 4.
- The case study LCA’s impact interpretation: Set 1 calculations for Group 1 and Group 2 building materials show calculations using weights and normalization reference information obtained in the present study. Set 2 calculations were performed to show how there would be differences in the evaluations if only the weights were calculated and normalization values were not calculated for Turkey. Set 3 calculations showed how the results would be affected if the values defined in BEES Online were used directly, without obtaining weights and normalization values for Turkey.
4. Conclusions
Author Contributions
Funding
Data Availability Statement
Acknowledgments
Conflicts of Interest
Appendix A
Appendix A.1
| Environmental Impact Categories | Relative Importance Weights | Description | ||
| Short Term (0–10 Years) (%) | Medium Term (10–100 Years) (%) | Long Term (>100 Years) (%) | ||
| Acidification | 0–10 | 0–10 | 0–10 | Acidification occurs with the increase in hydrogen (H+) ions due to the increase in acids such as nitric acid and sulfuric acid in the environment in a region. Acidifying compounds can be found in gaseous form, dissolved in water, or fixed on solid particles. They dissolve in rain or water and enter the ecosystem. Acidification affects trees, soil, buildings, construction materials, animals, and people. Humans release them by burning fossil fuels and biomass. Other compounds released by human sources, such as hydrogen chloride and ammonia, also contribute to acidification. |
| 10–20 | 10–20 | 10–20 | ||
| 20–30 | 20–30 | 20–30 | ||
| 30–40 | 30–40 | 30–40 | ||
| 40–50 | 40–50 | 40–50 | ||
| 50–60 | 50–60 | 50–60 | ||
| 60–70 | 60–70 | 60–70 | ||
| 70–80 | 70–80 | 70–80 | ||
| 80–90 | 80–90 | 80–90 | ||
| 90–100 | 90–100 | 90–100 | ||
| Air Pollution | 0–10 | 0–10 | 0–10 | Air pollutants consist of solid and liquid particles commonly found in the air. They arise from many activities, including combustion, vehicle use, electricity generation, material handling, crushing, and grinding operations. Solid and liquid particles that create air pollution include coarse particles that negatively affect respiratory diseases such as asthma and fine particles that cause more serious respiratory symptoms and diseases. |
| 10–20 | 10–20 | 10–20 | ||
| 20–30 | 20–30 | 20–30 | ||
| 30–40 | 30–40 | 30–40 | ||
| 40–50 | 40–50 | 40–50 | ||
| 50–60 | 50–60 | 50–60 | ||
| 60–70 | 60–70 | 60–70 | ||
| 70–80 | 70–80 | 70–80 | ||
| 80–90 | 80–90 | 80–90 | ||
| 90–100 | 90–100 | 90–100 | ||
| Ecological Toxicity | 0–10 | 0–10 | 0–10 | Ecological toxicity measures the potential of chemicals released into the environment to harm land and aquatic ecosystems. |
| 10–20 | 10–20 | 10–20 | ||
| 20–30 | 20–30 | 20–30 | ||
| 30–40 | 30–40 | 30–40 | ||
| 40–50 | 40–50 | 40–50 | ||
| 50–60 | 50–60 | 50–60 | ||
| 60–70 | 60–70 | 60–70 | ||
| 70–80 | 70–80 | 70–80 | ||
| 80–90 | 80–90 | 80–90 | ||
| 90–100 | 90–100 | 90–100 | ||
| Eutrophication | 0–10 | 0–10 | 0–10 | Eutrophication is the addition of mineral nutrients to soil or water. Adding large amounts of mineral nutrients such as nitrogen and phosphorus to soil and water causes a decrease in ecological diversity. Excessive release of nitrogen and phosphorus causes adverse effects on waterways during their transport. Due to the tendency of these nutrients to increase the formation of algae in the water, oxygen deficiency is caused, and, therefore, the death of species such as fish is also caused. |
| 10–20 | 10–20 | 10–20 | ||
| 20–30 | 20–30 | 20–30 | ||
| 30–40 | 30–40 | 30–40 | ||
| 40–50 | 40–50 | 40–50 | ||
| 50–60 | 50–60 | 50–60 | ||
| 60–70 | 60–70 | 60–70 | ||
| 70–80 | 70–80 | 70–80 | ||
| 80–90 | 80–90 | 80–90 | ||
| 90–100 | 90–100 | 90–100 | ||
| Fossil Fuel Depletion | 0–10 | 0–10 | 0–10 | Fossil fuel types pose environmental risks when used uncontrolled and excessively. Waste resulting from the use of fossil fuels causes environmental pollution. Fossil fuel consumption, which causes air, soil, and water pollution, also causes a decrease in natural resources. |
| 10–20 | 10–20 | 10–20 | ||
| 20–30 | 20–30 | 20–30 | ||
| 30–40 | 30–40 | 30–40 | ||
| 40–50 | 40–50 | 40–50 | ||
| 50–60 | 50–60 | 50–60 | ||
| 60–70 | 60–70 | 60–70 | ||
| 70–80 | 70–80 | 70–80 | ||
| 80–90 | 80–90 | 80–90 | ||
| 90–100 | 90–100 | 90–100 | ||
| Global Warming | 0–10 | 0–10 | 0–10 | The earth absorbs radiation from the sun. This energy is then redistributed by the atmosphere and oceans. In the presence of greenhouse gases accumulating in the atmosphere, the greenhouse gases retain the energy reflected from the atmosphere. The rays that cannot reach space are kept in the atmosphere and surround the world like a blanket. This phenomenon is known as the greenhouse effect. The greenhouse effect is a natural phenomenon. The environmental problem is caused by humans’ greenhouse gases released into the atmosphere. The increase in temperature on the earth’s surface due to the greenhouse effect is called global warming or climate change. |
| 10–20 | 10–20 | 10–20 | ||
| 20–30 | 20–30 | 20–30 | ||
| 30–40 | 30–40 | 30–40 | ||
| 40–50 | 40–50 | 40–50 | ||
| 50–60 | 50–60 | 50–60 | ||
| 60–70 | 60–70 | 60–70 | ||
| 70–80 | 70–80 | 70–80 | ||
| 80–90 | 80–90 | 80–90 | ||
| 90–100 | 90–100 | 90–100 | ||
| Human Health | 0–10 | 0–10 | 0–10 | Many factors threaten human health. Different people have variable resistance to other substances. |
| 10–20 | 10–20 | 10–20 | ||
| 20–30 | 20–30 | 20–30 | ||
| 30–40 | 30–40 | 30–40 | ||
| 40–50 | 40–50 | 40–50 | ||
| 50–60 | 50–60 | 50–60 | ||
| 60–70 | 60–70 | 60–70 | ||
| 70–80 | 70–80 | 70–80 | ||
| 80–90 | 80–90 | 80–90 | ||
| 90–100 | 90–100 | 90–100 | ||
| Indoor Air Quality | 0–10 | 0–10 | 0–10 | Building materials have significant effects on indoor air quality throughout buildings. A product’s total volatile organic compound emissions are often used as a measure of indoor air quality. |
| 10–20 | 10–20 | 10–20 | ||
| 20–30 | 20–30 | 20–30 | ||
| 30–40 | 30–40 | 30–40 | ||
| 40–50 | 40–50 | 40–50 | ||
| 50–60 | 50–60 | 50–60 | ||
| 60–70 | 60–70 | 60–70 | ||
| 70–80 | 70–80 | 70–80 | ||
| 80–90 | 80–90 | 80–90 | ||
| 90–100 | 90–100 | 90–100 | ||
| Land Use | 0–10 | 0–10 | 0–10 | Land use measures the potential for harm and habitat alteration of threatened and endangered species from human land use. |
| 10–20 | 10–20 | 10–20 | ||
| 20–30 | 20–30 | 20–30 | ||
| 30–40 | 30–40 | 30–40 | ||
| 40–50 | 40–50 | 40–50 | ||
| 50–60 | 50–60 | 50–60 | ||
| 60–70 | 60–70 | 60–70 | ||
| 70–80 | 70–80 | 70–80 | ||
| 80–90 | 80–90 | 80–90 | ||
| 90–100 | 90–100 | 90–100 | ||
| Ozone Depletion | 0–10 | 0–10 | 0–10 | The ozone layer in the stratosphere acts as a filter that absorbs harmful shortwave ultraviolet light while allowing longer wavelengths to pass. The ozone depletion causes more harmful shortwave radiation to reach the earth’s surface. This situation negatively affects ecosystems, agricultural production, and human health. For example, it is known to have adverse effects on human health, such as skin cancer, cataracts, and suppression of the immune system. |
| 10–20 | 10–20 | 10–20 | ||
| 20–30 | 20–30 | 20–30 | ||
| 30–40 | 30–40 | 30–40 | ||
| 40–50 | 40–50 | 40–50 | ||
| 50–60 | 50–60 | 50–60 | ||
| 60–70 | 60–70 | 60–70 | ||
| 70–80 | 70–80 | 70–80 | ||
| 80–90 | 80–90 | 80–90 | ||
| 90–100 | 90–100 | 90–100 | ||
| Photochemical Smog Formation | 0–10 | 0–10 | 0–10 | Air emissions from industry and transportation accumulate at ground level in some conditions and react with sunlight to create air pollution. Photochemical smog formation causes harmful effects on human health and vegetation. |
| 10–20 | 10–20 | 10–20 | ||
| 20–30 | 20–30 | 20–30 | ||
| 30–40 | 30–40 | 30–40 | ||
| 40–50 | 40–50 | 40–50 | ||
| 50–60 | 50–60 | 50–60 | ||
| 60–70 | 60–70 | 60–70 | ||
| 70–80 | 70–80 | 70–80 | ||
| 80–90 | 80–90 | 80–90 | ||
| 90–100 | 90–100 | 90–100 | ||
| Water Depletion | 0–10 | 0–10 | 0–10 | This impact is considered only in terms of water depletion. Activities such as agricultural production that cause water pollution are excluded. |
| 10–20 | 10–20 | 10–20 | ||
| 20–30 | 20–30 | 20–30 | ||
| 30–40 | 30–40 | 30–40 | ||
| 40–50 | 40–50 | 40–50 | ||
| 50–60 | 50–60 | 50–60 | ||
| 60–70 | 60–70 | 60–70 | ||
| 70–80 | 70–80 | 70–80 | ||
| 80–90 | 80–90 | 80–90 | ||
| 90–100 | 90–100 | 90–100 | ||
| Environmental Impact Category | Relative Importance Weights | Description (If Available) | ||
| Short Term (0–10 Years) (%) | Medium Term (10–100 Years) (%) | Long Term (>100 Years) (%) | ||
Appendix A.2
| Please specify the five most common insulation materials you encounter in practice | |
| Name of building material | Where can it be supplied? |
| Please specify the five most common floor covering materials you encounter in practice. | |
| Name of building material | Where can it be supplied? |
| Please specify the five most common plaster materials you encounter in practice. | |
| Name of building material | Where can it be supplied? |
| Please specify the five most common exterior wall finish materials you encounter in practice. | |
| Name of building material | Where can it be supplied? |
| Please specify the five most common wall materials you encounter in practice. | |
| Name of building material | Where can it be supplied? |
References
- Montanarella, L.; Panagos, P. The Relevance of Sustainable Soil Management within the European Green Deal. Land Use Policy 2021, 100, 104950. [Google Scholar] [CrossRef]
- Kotseva-Tikova, M.; Dvorak, J. Climate Policy and Plans for Recovery in Bulgaria and Lithuania. Rom. J. Eur. Aff. 2022, 79–99. [Google Scholar] [CrossRef]
- Leonard, M.; Pisani-Ferry, J.; Shapiro, J.; Tagliapietra, S.; Wolff, G.B. The Geopolitics of the European Green Deal; Bruegel Policy Contribution: Bruegel, Brussels, 2021. [Google Scholar]
- Pacheco-Torgal, F.; Labrincha, J.A. The Future of Construction Materials Research and the Seventh UN Millennium Development Goal: A Few Insights. Constr. Build. Mater. 2013, 40, 729–737. [Google Scholar] [CrossRef]
- Uygunoğlu, T.; Sertyeşilişik, P.; Topçu, İ.B. 20—Methodology for the Evaluation of the Life Cycle in Research on Cement-Based Materials. In Waste and Byproducts in Cement-Based Materials; de Brito, J., Thomas, C., Medina, C., Agrela, F., Eds.; Woodhead Publishing Series in Civil and Structural Engineering; Woodhead Publishing: Cambridge, UK, 2021; pp. 601–615. [Google Scholar] [CrossRef]
- EN 15804:2012+A2:2019; Sustainability of Construction Works. Environmental Product Declarations. Core Rules for the Product Category of Construction Products, CEN-CENELEC Management Centre: Brussels, Bruxelles, 2019.
- Shukla, J.; Skea, R.; Slade, A.; Al Khourdajie, R.; van Diemen, D.; McCollum, M.; Pathak, S.; Some, P.; Vyas, R.; Fradera, M.; et al. Climate Change 2022: Mitigation of Climate Change. Contribution of Working Group III to the Sixth Assessment Report of the Intergovernmental Panel on Climate Change; Cambridge University Press: Cambridge, UK; New York, NY, USA, 2022; p. 2042. [Google Scholar]
- Häfliger, I.F.; John, V.; Passer, A.; Lasvaux, S.; Hoxha, E.; Saade, M.R.M.; Habert, G. Buildings Environmental Impacts’ Sensitivity Related to LCA Modelling Choices of Construction Materials. J. Clean. Prod. 2017, 156, 805–816. [Google Scholar] [CrossRef]
- Nilimaa, J.; Zhaka, V. Material and Environmental Aspects of Concrete Flooring in Cold Climate. Constr. Mater. 2023, 3, 180–201. [Google Scholar] [CrossRef]
- Estokova, A.; Vilcekova, S.; Porhincak, M. Analyzing Embodied Energy, Global Warming and Acidification Potentials of Materials in Residential Buildings. Procedia Eng. 2017, 180, 1675–1683. [Google Scholar] [CrossRef]
- European Environment Agency. Acidification. Available online: https://www.eea.europa.eu/publications/92-826-5409-5/chap31.zip/view (accessed on 10 March 2024).
- Bolin, C.A.; Smith, S. Life Cycle Assessment of ACQ-Treated Lumber with Comparison to Wood Plastic Composite Decking. J. Clean. Prod. 2011, 19, 620–629. [Google Scholar] [CrossRef]
- Mustafić, H.; Jabre, P.; Caussin, C.; Murad, M.H.; Escolano, S.; Tafflet, M.; Périer, M.-C.; Marijon, E.; Vernerey, D.; Empana, J.-P.; et al. Main Air Pollutants and Myocardial Infarction: A Systematic Review and Meta-Analysis. JAMA 2012, 307, 713–721. [Google Scholar] [CrossRef] [PubMed]
- Kim, T.H.; Chae, C.U. Environmental Impact Analysis of Acidification and Eutrophication Due to Emissions from the Production of Concrete. Sustainability 2016, 8, 578. [Google Scholar] [CrossRef]
- CACC (Climate and Clean Air Coalition). Mitigating Black Carbon and Other Pollutants from Brick Production; Climate and Clean Air Coalition: 15 Rue De Mila: Paris, France, 2019; pp. 1–15. [Google Scholar]
- TRACI. Tool for the Reduction and Assessment of Chemical and Other Environmental Impacts; United States Environmental Protection Agency: Washington, DC, USA, 2009. [Google Scholar]
- Pacheco-Torgal, F.; Jalali, S. Toxicity of Building Materials: A Key Issue in Sustainable Construction. Int. J. Sustain. Eng. 2011, 4, 281–287. [Google Scholar] [CrossRef]
- Sas, Z.; Sha, W.; Soutsos, M.; Doherty, R.; Bondar, D.; Gijbels, K.; Schroeyers, W. Radiological Characterisation of Alkali-Activated Construction Materials Containing Red Mud, Fly Ash and Ground Granulated Blast-Furnace Slag. Sci. Total Environ. 2019, 659, 1496–1504. [Google Scholar] [CrossRef]
- Khan, M.N.; Mohammad, F. Eutrophication: Challenges and Solutions. In Eutrophication: Causes, Consequences and Control: Volume 2; Ansari, A.A., Gill, S.S., Eds.; Springer: Dordrecht, The Netherlands, 2014; pp. 1–15. [Google Scholar] [CrossRef]
- Marzouk, M.; Abdelkader, E.M.; Al-Gahtani, K. Building Information Modeling-Based Model for Calculating Direct and Indirect Emissions in Construction Projects. J. Clean. Prod. 2017, 152, 351–363. [Google Scholar] [CrossRef]
- Islam, H.; Zhang, G.; Setunge, S.; Bhuiyan, M.A. Life Cycle Assessment of Shipping Container Home: A Sustainable Construction. Energy Build. 2016, 128, 673–685. [Google Scholar] [CrossRef]
- Ashraf, A.; Butt, A.; Khalid, I.; Alam, R.U.; Ahmad, S.R. Smog Analysis and Its Effect on Reported Ocular Surface Diseases: A Case Study of 2016 Smog Event of Lahore. Atmos. Environ. 2019, 198, 257–264. [Google Scholar] [CrossRef]
- Hahnel, G.; Whyte, A.; Biswas, W.K. A Comparative Life Cycle Assessment of Structural Flooring Systems in Western Australia. J. Build. Eng. 2021, 35, 102109. [Google Scholar] [CrossRef]
- Allen, J.G.; Bernstein, A.; Cao, X.; Eitland, E.S.; Flanigan, S.; Gokhale, M.; Goodman, J.M.; Klager, S.; Klingensmith, L.; Laurent, J.G.C.; et al. The 9 Foundations of a Healthy Building. Harv. Sch. Public Health 2017, 1–36. Available online: https://9foundations.forhealth.org/ (accessed on 8 January 2024).
- Alyüz, B.; Veli, S. İç Ortam Havasında Bulunan Uçucu Organik Bileşikler ve Sağlık Üzerine Etkileri. Trak. Üniversitesi Fen Bilim. Derg. 2006, 7, 109–116. [Google Scholar]
- Willis, A.M. Concrete and Not so Concrete Impacts. Inf. Ecol. 1998, 1–13. Available online: http://www.changedesign.org/Resources/EDFPublications/Articles/Papers/Concrete.pdf (accessed on 8 January 2024).
- Coşgun, N.; Esin, T. Betonarme Prefabrike Yapım Yöntemlerinin Çevresel Açıdan Analizi, 12. Concrete Prefabrication Symposium “Innovations and Training in Prefabrication”; Mimar Sinan Üniversitesi: İstanbul, Turkey, 2007. [Google Scholar]
- Newman, P.A.; Oman, L.D.; Douglass, A.R.; Fleming, E.L.; Frith, S.M.; Hurwitz, M.M.; Kawa, S.R.; Jackman, C.H.; Krotkov, N.A.; Nash, E.R.; et al. What Would Have Happened to the Ozone Layer If Chlorofluorocarbons (CFCs) Had Not Been Regulated? Atmos. Chem. Phys. 2009, 9, 2113–2128. [Google Scholar] [CrossRef]
- CCAC (Climate and Clean Air Coalition). HFC Initiative. 2015, pp. 1–2. Available online: https://www.ccacoalition.org/sites/default/files/resources/2015_Factsheet_HFC-Initiative_CCAC.pdf (accessed on 18 January 2024).
- Rahman, M.M.; Rahman, M.A.; Haque, M.M.; Rahman, A. Sustainable Water Use in Construction. In Sustainable Construction Technologies; Tam, V.W.Y., Le, K.N., Eds.; Butterworth-Heinemann: Oxford, UK, 2019; pp. 211–235. [Google Scholar] [CrossRef]
- McCormack, M.; Treloar, G.J.; Palmowski, L.; Crawford, R. Modelling Direct and Indirect Water Requirements of Construction. Build. Res. Inf. 2007, 35, 156–162. [Google Scholar] [CrossRef]
- Hoekstra, A.Y. The Water Footprint of Industry. In Assessing and Measuring Environmental Impact and Sustainability; Klemeš, J.J., Ed.; Butterworth-Heinemann: Oxford, UK, 2015; pp. 221–254. [Google Scholar] [CrossRef]
- USEPA. United States Environmental Protection Agency Life Cycle Assessment: Principles and Practice; EPA/600/R-06/060; National Risk Management Research Laboratory: Cincinnati, OH, USA, 2006.
- Right to Clean Air Platform. Dark Report Reveals the Health Impacts of Air Pollution in Turkey; Clean Air Platform: İstanbul, Turkey, 2021; p. 92. [Google Scholar]
- Menzies, D.; Kreiss, K. Building-Related Illnesses; CRC Press: Boca Raton, FL, USA, 2006; pp. 763–810. [Google Scholar] [CrossRef]
- Crook, B.; Burton, N.C. Indoor Moulds, Sick Building Syndrome and Building Related Illness. Fungal Biol. Rev. 2010, 24, 106–113. [Google Scholar] [CrossRef]
- Darçın, P.; Balanlı, A. Yapı Ürünlerinden Kaynaklanan Uçucu Organik Bileşiklerin Yapı Biyolojisi Açısından İrdelenmesi. Megaron 2018, 13, 597–607. [Google Scholar] [CrossRef]
- Tıkansak Karadayı, T.; Coşgun, N. Betonun Yaşam Döngüsü Sürecinde Çevresel Etkilerini Azaltan Yaklaşımlar. Sürdürülebilir Çevre Derg. 2021, 1, 1–6. Available online: https://dergipark.org.tr/en/pub/cevder/issue/62887/388056#article_cite (accessed on 8 January 2024).
- ISO 14040:2006; Environmental Management-Life Cycle Assestment-Principles and Framework. Management Centre: Brussels, Belgium, 2006.
- ISO 14044:2006; Environmental Management-Life Cycle Assessment-Requirements and Guideline. Management Centre: Brussels, Belgium, 2006.
- Klöpffer, W.; Grahl, B. Life Cycle Assessment (LCA): A Guide to Best Practice; John Wiley & Sons: Hoboken, NJ, USA, 2014. [Google Scholar] [CrossRef]
- Al-Huthaıfı, A.A.M.M.; Altan, M.F. Yapı Sektöründe Uygulanan Yaşam Döngüsü Değerlendirmesinde Karşılaşılan Sorunlara Çözüm Önerileri. MAS J. Appl. Sci. 2021, 6, 194–210. [Google Scholar] [CrossRef]
- Lippiatt, B.C. Building for Environmental and Economic Sustainability Technical Manual and User Guide; National Institute of Standards and Technology: Gaithersburg, MD USA, 2007. [Google Scholar]
- Saaty, T.L. Fundamentals of the Analytic Hierarchy Process. In The Analytic Hierarchy Process in Natural Resource and Environmental Decision Making; Schmoldt, D.L., Kangas, J., Mendoza, G.A., Pesonen, M., Eds.; Managing Forest Ecosystems; Springer: Dordrecht, The Netherlands, 2001; pp. 15–35. [Google Scholar] [CrossRef]
- Wang, Y.M.; Liu, J.; Elhag, T.M.S. An Integrated AHP–DEA Methodology for Bridge Risk Assessment. Comput. Ind. Eng. 2008, 54, 513–525. [Google Scholar] [CrossRef]
- Yulong, L.; Xiande, W.; Zhongfu, L. Safety Risk Assessment on Communication System Based on Satellite Constellations with the Analytic Hierarchy Process. Aircr. Eng. Aerosp. Technol. 2008, 80, 595–604. [Google Scholar] [CrossRef]
- Deng, X.; Hu, Y.; Deng, Y.; Mahadevan, S. Supplier Selection Using AHP Methodology Extended by D Numbers. Expert Syst. Appl. 2014, 41, 156–167. [Google Scholar] [CrossRef]
- Saaty, R.W. The Analytic Hierarchy Process—What It Is and How It Is Used. Math. Model. 1987, 9, 161–176. [Google Scholar] [CrossRef]
- Saaty, T.L. Relative Measurement and Its Generalization in Decision Making Why Pairwise Comparisons Are Central in Mathematics for the Measurement of Intangible Factors the Analytic Hierarchy/Network Process. Rev. R. Acad. Cien. Ser. A. Mat. 2008, 102, 251–318. [Google Scholar] [CrossRef]
- Ansah, R.H.; Sorooshian, S.; Bin Mustafa, S. Analytic Hierarchy Process Decision Making Algorithm. Glob. J. Pure Appl. Math. 2015, 11. [Google Scholar] [CrossRef]
- Hafeez, K.; Malak, N.; Zhang, Y.B. Outsourcing Non-Core Assets and Competences of a Firm Using Analytic Hierarchy Process. Comput. Oper. Res. 2007, 34, 3592–3608. [Google Scholar] [CrossRef]
- Ryberg, M.; Vieira, M.D.M.; Zgola, M.; Bare, J.; Rosenbaum, R.K. Updated US and Canadian Normalization Factors for TRACI 2.1. Clean Techn Env. Policy 2014, 16, 329–339. [Google Scholar] [CrossRef]
- NIST. National Institute of Standards and Technology. Available online: www.nist.gov (accessed on 8 September 2022).
- Turkish Statistical Institute. Address Based Population Registration System 2018; Report No. 30709. 2019. Available online: https://data.tuik.gov.tr/Bulten/Index?p=Adrese-Dayali-Nufus-Kayit-Sistemi-Sonuclari-2018-30709#:~:text=T%C3%BCrkiye’de%20ikamet%20eden%20n%C3%BCfus,8’ini%20ise%20kad%C4%B1nlar%20olu%C5%9Fturdu (accessed on 8 January 2024).
- TurkStat (Turkish Statistical Institute). Greenhouse Gas Emission Statistics 1990–2019; Report No. 37196. 2020. Available online: https://data.tuik.gov.tr/Bulten/Index?p=Sera-Gazi-Emisyon-Istatistikleri-1990-2019-37196#:~:text=Sera%20gaz%C4%B1%20envanteri%20sonu%C3%A7lar%C4%B1na%20g%C3%B6re,CO2%20e%C5%9Fd.%20olarak%20hesapland%C4%B1 (accessed on 8 January 2024).
- Turkish Ministry of Environment and Urbanization and Climate Change. Turkey’s 5th Statement on Climate Change, Annual Informative Inventory Report for Turkey for the United Nations Economic Commission for Europe; Turkish Ministry of Environment andUrbanization and Climate Change: Ankara, Turkey, 2021; p. 324.
- EMEP. EMEP Centre on Emission Inventories and Projections. Available online: www.ceip.at/data-viewer (accessed on 14 January 2023).
- Turkish Statistical Institute. Municipal Water Statistics 2018; Report No. 30668. 2019. Available online: https://data.tuik.gov.tr/Bulten/Index?p=Belediye-Atiksu-Istatistikleri-2018-30667 (accessed on 8 January 2024).


| Groups of Building Materials | Building Material |
|---|---|
| GROUP 1: Floor coverings | Ceramic Tile with Recycled Content |
| Marble Tile | |
| Terrazzo Tile | |
| GROUP 2: Exterior wall finishes | Brick Siding |
| Insulated Siding | |
| Vinyl Siding |
| Air Pollutants | NOx | >PM10 | ≤PM10 | Unspecified PM | SOx |
|---|---|---|---|---|---|
| Emission factors [53] | 0.002 | 0.046 | 0.083 | 0.046 | 0.014 |
| Emissions | 7.85 × 10¹¹ g | NA | 239.08 × 10⁹ g (PM10) 193.64 × 10⁹ g (PM2.5) | NA | 2.52 × 10¹² g |
| Air pollution index | 1,570,000,000 | - | 35,915,760,000 | 35,266,000,000 | |
| Total | 72,751,760,000 microDALYs/year | ||||
| Population (capita) | 82,003,882 | ||||
| Normalization reference information value | 887.17 microDALYs/year/capita | ||||
| Acidifiers | NH3 | HCl | HCN | HF | H2S | NOx | SOx | H2SO4 |
|---|---|---|---|---|---|---|---|---|
| Emission factors [53] | 95.49 | 44.70 | 60.4 | 81.26 | 95.9 | 40.04 | 50.79 | 33.30 |
| Emissions | 7.28 × 10¹¹ g | NA | NA | NA | NA | 7.85 × 10¹¹ g | 2.519 × 10¹² g | NA |
| Acidification index | 6.952 × 10¹³ | - | - | - | - | 3.143 × 10¹³ | 1.279 × 10¹⁴ | - |
| Total | 2.289 × 10¹⁴ H+ eq./year | |||||||
| Population (capita) | 82,003,882 | |||||||
| Normalization reference information value | 2,791,186.52 H+ eq./year/capita | |||||||
| Environmental Impact Categories | Reference Unit | Present Study | USA [53] |
|---|---|---|---|
| Acidification | H+ eq./year/capita | 2,791,186.52 | 7,800,200,000 |
| Air Pollution | microDALYs/year/capita | 887.17 | 19,200 |
| Ecological Toxicity | g 2,4-D eq./year/capita | 43,238.69 | 81,646.72 |
| Eutrophication | g N eq./year/capita | 27,104.47 | 19,214.20 |
| Fossil Fuel Depletion | MJ energy/year/capita | 300,489.72 | 35,309 |
| Global Warming | g CO2 eq./year/capita | 6,400,000 | 25,582,640.09 |
| Human Health | g C7H8 eq./year/capita | 13,357,199.68 | 274,557,555.37 |
| Indoor Air Quality | g TotalVOCs/year/capita | 35,108.09 | 35,108.09 |
| Land Use | count/acre/capita | 0.002344 | 0.00335 |
| Ozone Depletion | g CFC-11 eq./year/capita | 2.439 | 340.19 |
| Photochemical Smog Formation | g NOx eq./year/capita | 11,870.17 | 151,500.03 |
| Water Depletion | liters/year/capita | 81,760 | 529,957.75 |
Disclaimer/Publisher’s Note: The statements, opinions and data contained in all publications are solely those of the individual author(s) and contributor(s) and not of MDPI and/or the editor(s). MDPI and/or the editor(s) disclaim responsibility for any injury to people or property resulting from any ideas, methods, instructions or products referred to in the content. |
© 2024 by the authors. Licensee MDPI, Basel, Switzerland. This article is an open access article distributed under the terms and conditions of the Creative Commons Attribution (CC BY) license (https://creativecommons.org/licenses/by/4.0/).
Share and Cite
Ak, Ş.; Aytekin, O.; Kuşan, H.; Zorluer, İ. Environmental Sustainability of Building Materials in Turkey: Reference Information Recommendations for European Green Deal Declarations. Buildings 2024, 14, 889. https://doi.org/10.3390/buildings14040889
Ak Ş, Aytekin O, Kuşan H, Zorluer İ. Environmental Sustainability of Building Materials in Turkey: Reference Information Recommendations for European Green Deal Declarations. Buildings. 2024; 14(4):889. https://doi.org/10.3390/buildings14040889
Chicago/Turabian StyleAk, Şerife, Osman Aytekin, Hakan Kuşan, and İsmail Zorluer. 2024. "Environmental Sustainability of Building Materials in Turkey: Reference Information Recommendations for European Green Deal Declarations" Buildings 14, no. 4: 889. https://doi.org/10.3390/buildings14040889