Article

Strategic Design Approaches for Eliciting the Perception of ‘Prestige’ in Housing Consumers

Instituto Universitario de Investigación en Tecnología Centrada en el Ser Humano (Human-Tech), Universitat Politècnica de València, 46022 Valencia, Spain
*
Author to whom correspondence should be addressed.
Buildings 2024, 14(3), 853; https://doi.org/10.3390/buildings14030853
Submission received: 9 February 2024 / Revised: 11 March 2024 / Accepted: 18 March 2024 / Published: 21 March 2024

Abstract

:
In the current real estate landscape, there is a growing trend to focus on adding value to products to address the customer’s affective/emotional perspective, his/her perceptions of the ‘Prestige’ of properties being crucial for his/her final assessments of the products. This study delves into the design elements that shape perceptions of ‘Prestige’ using Kansei engineering in 235 participants who evaluated various real estate promotions through: (1) a set of 60 adjectives and (2) reason for purchase (residence or investment). A first factor analysis of the set of adjectives yielded 15 independent axes. A subsequent linear regression indicated that the ‘Prestige’ axis was among the four most important factors in/drivers of property purchase decisions. In the second phase, 62 design elements (and their respective categories) of real estate promotions were identified to establish 16 groups. A linear regression determined that Information presentation and Building were the groups of elements with the greatest impact on subjects’ perceptions of ‘Prestige’. A subsequent Univariate General Linear Model analysis identified the design elements significant for each group, such as Development type and Building shape, respectively. Finally, a Bonferroni post hoc test identified the important categories in each identified design element as Facing blocks and Stepped.

1. Introduction

An increasing number of companies across various sectors are adding value to their products by improving their functionality and/or enhancing their affective/emotional value. Improving functionality involves determining if a product achieves specific goals effectively, efficiently, and satisfyingly. Enhancing affective/emotional value involves all the human senses, using design and aesthetics [1,2,3]. Some studies have demonstrated that this emotional/affective component significantly influences customers’ final perceptions of products [4,5,6].
From a strategic perspective, several authors have argued that, to address the affective factor in business terms, it is essential to understand its main dimensions [7,8,9] and develop innovative business models driven by customer experience [10]. Salient among the set of affective factors associated with products is the sensation of ‘Prestige’ [4]. Luxury brands are categorised based on the perceptions, induced by distinctive marketing, of buyers [11]. Luxury products satisfy consumers’ psychological and functional needs, and it appears that psychological benefits is the primary factor that distinguishes luxury from non-luxury products [12].
The construction sector is not exempt from the influence of affective factors. Products in this sector carry significant symbolic meaning. The tangible aspect of a property is the land, its location, and surroundings, but other aspects (from the company’s image to plans, perspectives, models, etc.) have a high degree of intangibility, and are sometimes perceived subjectively/psychologically. Specifically, the current Spanish real estate landscape is characterised by a slowdown that has created intense competition among companies [13]. In such a competitive market, to attract customers, companies must offer a wide variety of products and services, at acceptable prices, well suited to their expectations, needs and requirements [14,15]. With new players willing to invest, competition to acquire high-quality assets increases, thus raising prices. Therefore, the focus is shifting towards promotions that evoke perceptions of higher quality and luxury. Companies are actively engaged in the development of strategic initiatives focused on value creation, seeking to augment the discrepancy between the monetary value buyers are prepared to invest in a product or service and the underlying costs associated with its production [16].
In the real estate context, it has been demonstrated that applying an algorithm to properties classified as ‘luxury’ affects their market value [17]. Particularly noteworthy is the work of Llinares and Page [18], who, using Kansei engineering, identified ‘Prestige’ perceptions as having the greatest differentiation capacity in real estate promotions. This dimension includes design-related variables, luxury, elegance, ‘Prestige’, and innovation.
Nagamachi [19] defined Kansei Engineering as ‘a technology for translating consumer feelings and images of a product into design elements’. Its goal is to identify and quantify users’ perceptions of a product in their native language, and establish quantitative relationships between subjective responses and design features. Kansei Engineering posits that individuals’ assessments are not only influenced by the stimuli presented (a combination of objective and subjective parameters), but also by their conceptual frameworks (semantic space). In other words, to appropriately evaluate a situation, assessment variables must align with the individual’s mental schema.
The first phase of Kansei Engineering involves identifying a series of independent concepts (semantic axes) that individuals use to describe their product-related sensations. Kansei Engineering uses semantic differentials to measure perceptual spaces [20]. Once these semantic axes or affective dimensions are obtained, in the next phase they are matched to the design elements that evoke them. This relation can be determined using statistical treatments, such as Quantification Theory Type I [21,22] and Type II [23], linear regressions [18], neural networks [24], fuzzy logic [25] and even event-related potential analysis (using an electroencephalogram) [26].
In recent years, Kansei Engineering has made several contributions to the development of construction and furniture-related products [27,28], highlighting its versatility and effectiveness in capturing and integrating users’ emotions and preferences. This includes architecture, where analyses have been made of the design of residential doors [29], sports building facades [30], kitchens [31], floor plans [32,33], real estate promotions [18,34], urban spaces, and internal spaces [35,36,37], such as airport VIP lounges [38].
Using Kansei Engineering, the aim of this study is to identify the specific design characteristics of a real estate promotion that evoke, in clients, perceptions of ‘Prestige’. The study is divided into two phases: the first phase identifies the set of affective impressions evoked in clients by a real estate promotion and their impact on the clients’ overall evaluations, including intention to purchase a property to live in it or for investment (the purchase intention is a relevant aspect according to Nasar’s model [39]). The second phase identifies the design elements that create the perceptions.

2. Materials and Methods

A two-phase field study was conducted, collecting opinions from a sample of re-spondents about a set of stimuli that were new properties for sale. The data were ana-lysed using SPSS v. 17.0, with p-values < 0.05 considered statistically significant. The nature of the stimuli used and the characteristics of the population were the same in the two phases, and therefore are detailed below. For its part, opinion collection and data processing were different in each phase, which is why they are developed in subsequent specific subsections.
Stimuli. The properties assessed were newly built medium-high priced flats in the city of Valencia, Spain. Each stimulus included all the information contained in the websites of companies marketing real estate in Valencia at the time of the study (exterior view of the development, floor plan of the dwelling, surface areas, floor level, aspects, and a summary of the building specifications). No references to the specific locations of the buildings were made, as the interviewees were asked to evaluate the properties independent of location. The stimuli sample was heterogeneous (Figure 1), featuring a wide variety of homogenous offerings located in multi-story buildings in an urban environment. The aim was to avoid nesting by creating a balanced sample that included all possible combinations of design elements. This issue becomes more problematic when stimuli are real, that is, the combination of design elements in the sample/stimuli is based on their availability in the actual product. A set of 179 images were created as stimuli, 67 of these stimuli were used in the first phase of this study, while the rest (112 stimuli) were presented in phase number two.
Sample. The sample consisted of 235 staff from the Universidad Politécnica of Valencia (50.64% female, mean age 35.83 years; σ = 2.31) selected through simple random sampling. Staff from the Architecture and Town Planning departments were excluded to ensure that any biased perceptions that construction and architecture experts might hold would influence the results. In phase I, 160 subjects participated (mean age 32.14 years; σ = 2.15), each of whom viewed and rated only one stimulus (thus, no stimulus was rated less than twice). Phase II involved 75 subjects (mean age 39.5 years; σ = 2.47). In this case, each subject viewed and rated 3 stimuli, providing a total of 225 responses. In each questionnaire, only one stimulus was assessed. These stimuli were presented and rated independently and consecutively (Figure 2).

2.1. PHASE I: Identification of Affective Factors and Their Importance in Overall Evaluations (Purchase for Residence and Purchase for Investment)

The objectives of this phase were, first, to identify the set of impressions/Kansei words related to ‘Prestige’ and, second, to determine their importance in subjects’ evaluations. Kansei methodology techniques were employed. The initial step involves obtaining semantic axes, or a set of cognitive factors, that characterise individuals’ perceptions of products. These axes are uncorrelated variables that define perceptions of products and are formed by the set of independent concepts employed by individuals to describe product-related sensations. Within the set of axes comprising this semantic space, our interest lies in identifying the axis related to ‘Prestige’, and identifying the impressions with which it is associated. Once the axes are identified, their influence on overall evaluations can be established. The data collection process was as follows.
Questionnaire. The questionnaire gathered subjective information about the participants’ perceptions. Real estate promotions were assessed by the experimental participants based on a series of adjectives, or expressions, that described their emotional responses. The expressions, all in Spanish, were obtained through a search of words (140 adjectives/expressions) used in current property advertising in architecture and urban-ism journals, interior decorating magazines, and the websites of property marketing companies. The goal was to obtain a set of words that describe perceptions evoked by real estate promotions. The expression ‘Prestige’ was included in the set. In Kansei Engineering, this set of attributes is known as the semantic space. The initial list was reduced to 60 adjectives after applying the Affinity Diagram criteria: this involves ordering a large set of ideas and information by affinity/relationship, obtained from various sources, to facilitate subsequent analysis [40]. A 5-point Likert-type scale (Totally disagree, Disagree, Neutral, Agree and Totally agree) was used to assign a value to each property, based on the 60 adjectives. Specifically, participants were instructed: “Indicate, on a scale from 1 to 5, the degree of agreement with each of the following statements about the real estate promotion you are observing”. Each of the 60 statements in the questionnaire started with: “It is a [each of the 60 adjectives studied] dwelling”, for example: “It is an elegant dwelling”. In addition, two questions were included to capture the participants’ overall opinions: (1) “Overall, I think it is a good house to live in. Assuming it suited my financial position, I would consider it to be a good purchase opportunity”. (2) “Overall, I think it is a good house to invest in. Assuming it suited my financial position, I would consider it to be a good purchase opportunity”.
Data Processing. The following statistical treatment was performed on the database of responses (see Figure 3):
  • (a) Identification of the affective factors in real estate promotions. A principal component factor analysis was undertaken. Semantic axes are uncorrelated variables that characterise perceptions of products. The principal component factor analysis identified and extracted the semantic axes. The axes, grouped by the analysis, consisted of combinations of adjectives (from the original set) that the participants rated similarly. We selected only principal components with eigenvalues greater than one; a Varimax rotation was performed to obtain the semantic axis factors. Finally, the internal consistencies of the dimensions were evaluated using the Cronbach’s alpha coefficient [41].
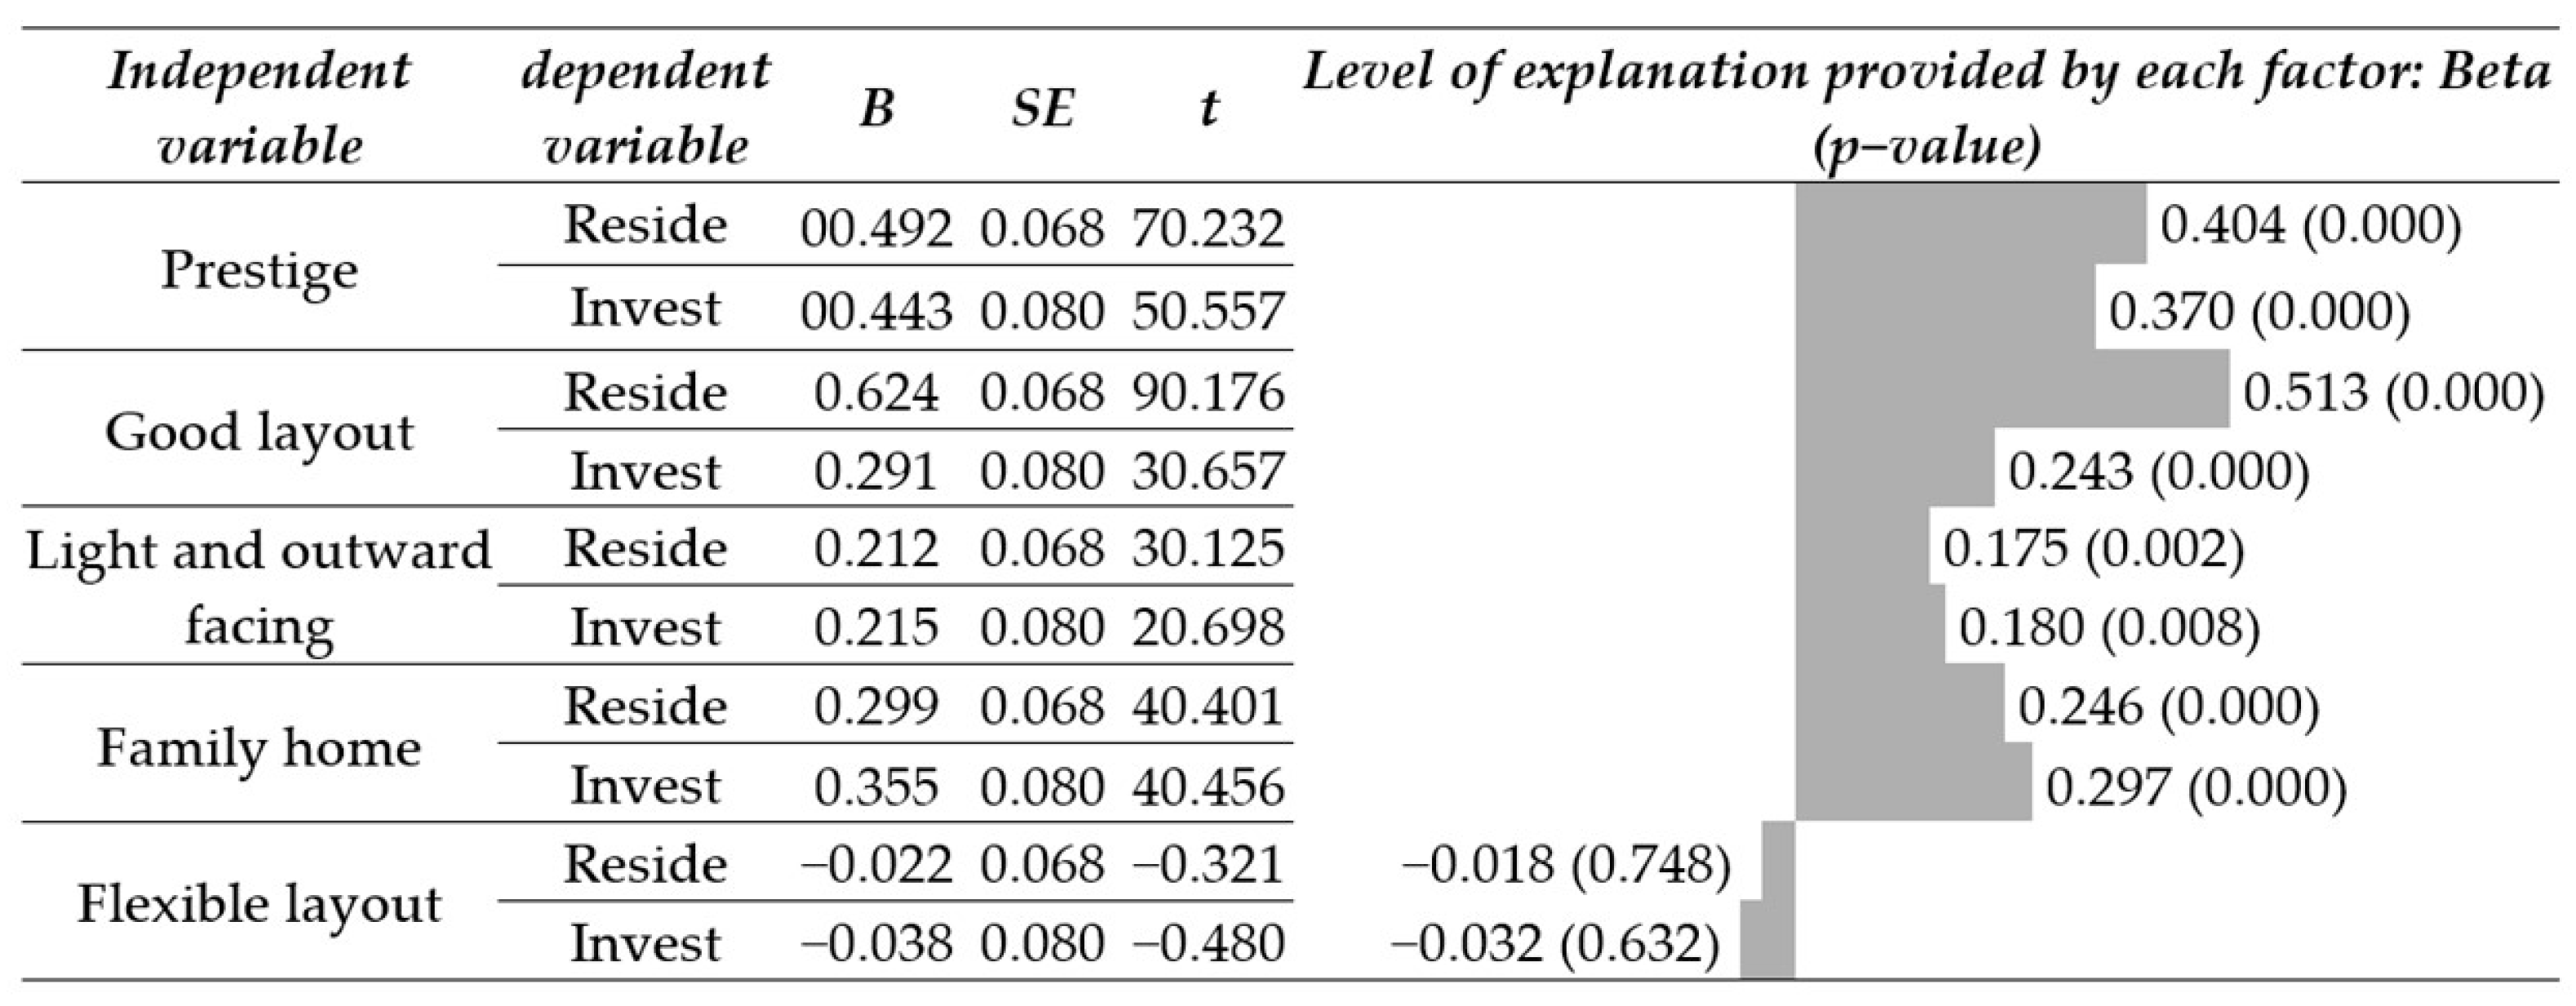
  • (b) Impact of the ‘Prestige’ axis on overall evaluations. The adjectives associated with the semantic axes, detected in the previous analysis, represent important concepts common to all customers. Their evaluations explain the perceived differences between residential properties. The influence of the different axes on overall assessments may vary. The impacts of the semantic axes on the participants’ overall evaluations (purchase for residence or investment) were quantified by linear regression analysis, with the final purchase decision being the dependent variable, and the semantic axes being the independent variables.

2.2. PHASE II: Identification of the Design Elements of the Real Estate Promotion That Influenced Perceptions of ‘Prestige’

Based on Schütte et al. [42], once the semantic space is defined, the second phase of Kansei Engineering involves parameterising the product into design elements. The goal in this phase is to translate the complexity of the product into a set of parameters that form the consumer’s perceptions of the product. The parameters should reflect elements that may influence their evaluations (plans, qualities, colours, surfaces, etc.). The complexity arises from the high number of parameters present in a real estate promotion. To address this complexity issue in the analysis of the relationship between evaluations of ‘Prestige’ and other design parameters, a stepwise analysis was conducted. The variables were not analysed simultaneously to avoid the development of spurious relationships. Initially, to gain insight into their overall organisational structure, the design elements were grouped together based on their degree of similarity; later, they were disaggregated to construct independent mathematical models. The grouping was carried out using the Affinity Diagram [40]. This technique led to the grouping of 62 design elements and their corresponding categories into 16 sets (see Appendix A).
The first step, therefore, was to determine the design elements. These parameters had to include all the aspects contained in promotions on real estate companies’ websites: general characteristics of the dwellings, buildings and surroundings, quality of the dwellings and floor plans. This information was gathered from numerous real estate company websites advertising in Valencia, industry magazines, and through interviews with experts in the field (architects, technical architects, developers, etc.). After parameterising the products, the following field study was conducted.
Questionnaire. The questionnaire collected data about the participants’ perceptions of the ‘Prestige’ of the groups of design elements identified. Specifically, participants were instructed: “Rate, on a scale from 1 to 5 (where 1 is excellent, 2 is good, 3 is neutral, 4 is poor, and 5 is very poor), the following 16 aspects about the real estate promotion you are observing”. Each of the 16 aspects in the questionnaire corresponds to the grouping of elements into 16 sets (see Appendix A). At the end of the questionnaire, participants were asked to assess the level of agreement with the following statement: “In general, I find the development ‘Prestige’”. The concept used for defining this question was established after the set of Kansei words forming the axis was obtained (Phase I). The assessment was made using a 5-point Likert scale (Totally disagree, Disagree, Neutral, Agree and Totally agree). The order of presentation of the questionnaire variables was randomised to prevent any learning the participants obtained throughout the experiment influencing their responses, and to control for possible association effects resulting from the order of questions.
Data processing. The following statistical treatment was performed on the database of responses (see Figure 4):
  • (a) Identification of the important groups in the creation of perceptions of ‘Prestige’. The high number of design elements made it impossible to introduce the entire set of variables in a single phase. Thus, the approach adopted was, in a first phase, to identify the name of the groups and then to specify the design elements within each group. The linear regression technique was used, with ‘Prestige’ perceptions as the dependent variable, and the 16 groups of design elements as independent variables. This technique is useful when producing a quantitative model to explain ‘Prestige’ perceptions (based on the identified groupings).
  • (b) Identification of the design categories that influence perceptions of ‘Prestige’ in a real estate promotion. The Univariate General Linear Model procedure was used, taking each group as a dependent variable and each design element as independent variables. For design elements with more than two categories, the Bonferroni post hoc test was applied. This technique explains the different categories of each design element that create a significant difference in perceptions and the direction of the differences identified.

3. Results

For a better understanding, the results are presented in two subsections corresponding to the two phases of development.

3.1. PHASE I: Identification of the Affective Factors and Their Importance in Overall Assessments (Purchase to Live in and Purchase to Invest)

3.1.1. (a) Identification of the Set of Affective Factors in Real Estate Promotions

Factor analysis reduced the original set of 60 adjectives to 15 uncorrelated factors, explaining 68.8% of the variance in the original variables. Table 1 displays the selected factors, their correlations with the original adjectives, the percentage of explained var-iance and the Cronbach’s alphas.
Axis 1 corresponds to ‘Prestige’. It is the axis with the highest explained variance, explaining 15.58% of the set of original variables. Therefore, it was the primary concept that the participants took into account when differentiating between the developments. It encompasses concepts related to the appearance of the development. Thus, for the surveyed users, a prestigious development is strongly associated with concepts such as “full of character”, innovative, refined, well-designed, and elegant. To a lesser extent, the concept is related to the equipment in the house, the quality of the materials and finishes, and the kitchen. The consistency of this axis is very high, with a Cronbach’s alpha of 0.926 [41]. In addition, independent axes other than ‘Prestige’ were identified: Axis 2, good layout, Axis 3, light and outward-facing, Axis 4, family home/spaciousness, Axis 5, ecology, Axis 6, peaceful and safe, Axis 7, classic design, Axis 8, community atmosphere, Axis 9, flexible layout, Axis 10, orientation, Axis 11, restrained, Axis 12, youthful and informal, Axis 13 impersonal, Axis 14, spacious, and Axis 15, liveable in.
After obtaining the Cronbach’s alpha coefficients to analyse the consistency of the extracted dimensions, we selected those semantic axes with a coefficient equal to, or greater than, 0.700 (axes 1–4 and 9). According to Strainer [41], a coefficient exceeding 0.900 likely indicates unnecessary redundancy rather than a desirable level of internal consistency in research tools. In this type of studies, a level above 0.700 indicates acceptable internal consistency. However, the other perceptions, due to their low alphas, were not used in the remainder of the analysis.

3.1.2. (b) Impact of the ‘Prestige’ Axis on Overall Evaluations

Two linear regressions were applied, taking the purchase of the home as the dependent variable (intention to reside/invest), and the set of semantic axes obtained in Phase I as the independent variables (Figure 5).
The R coefficient of the linear regression model for the dependent variable, the purchase of a home for investment, is 0.563. The model is shown in the graph on the left of Figure 5. It can be observed that the statistically significant factors (p < 0.05) are the same four as for the residence choice model. The difference lies in the order of importance attributed to the factors, with the ‘Prestige’ of the promotion being the most influential factor in the choice of a home for investment. Next is “Family home”, “Good layout”, and “Light and outward facing”.
As can be seen, the ‘Prestige’ variable holds an important position in both models; it is the most influential for the decision to invest, and the second most influential when the goal is to reside.

3.2. PHASE II: Identification of the Design Elements of the Real Estate Development That Influence ‘Prestige’ Perceptions

3.2.1. (a) Identification of the Important Groups in the Evocation of Perceptions of ‘Prestige’

After applying the linear regression technique, a quantitative model was developed to estimate the ‘Prestige’ perceptions of a dwelling based on the assessment of the 16 groups of design elements (Figure 6).
The predictive capability of the model is R = 0.782. The design element groups with the most impact on ‘Prestige’ perceptions are information presentation and the characteristics of the building (p > 0.000). Following closely behind are the spaciousness of the home, flooring, finishes, and communal facilities (with correlations between 0.15 and 0.20). Subsequently, with correlations between 0.09 and 0.15, factors such as facilities, kitchen, bedroom layout, and terraces are influential. On the other hand, the regression model established that interior carpentry, the living room (salon), parking, bathrooms, orientation and the surrounding environment are not significant in creating ‘Prestige’ perceptions.

3.2.2. (b) Identification of the Design Categories That Influence the Perception of ‘Prestige’ in a Real Estate Development

Following identification of the groups that influence users’ ‘Prestige’ perceptions of homes, the categories of design elements that affect these perceptions were obtained. The Univariate General Linear Model determined the significant design elements (p < 0.05) for each group. Subsequently, using a Bonferroni post hoc test, the relevant categories for each identified design element were obtained. Figure 7 shows the results obtained for each of the 10 design element groups significant in evoking ‘Prestige’ perceptions.
Group 1. Information aesthetics. The significant “Information aesthetics” (β: 0.213; p = 0.000) elements are photographs of the private gardens (F: 6.280; p = 0.013), the chil-dren’s play areas (F: 3.842; p = 0.051), the typology of the real estate development (F: 3.474; p = 0.009), and the shape of the building (F: 3.024; p = 0.051). Including “private gardens” and “children’s play areas” in the promotion image improves the information aesthetics of the real estate offer and, therefore, perceptions of ‘Prestige’, because they are, on average, more highly evaluated (Figure 7, horizontally displaced bars to the right). For the design element typology of the real estate development, no differences were perceived between free-standing U-shaped and terraced blocks (as can be seen in Figure 7, the horizontal bars intersect). There were also no significant differences between free-standing, terraced, L-shaped, and U-shaped blocks (horizontal bars intersecting). However, there were perceived differences between the two categories facing blocks and L-shaped blocks, and terraced blocks (horizontal bar displacement to the right). Similarly, free-standing, terraced, L-shaped, and U-shaped blocks had a greater impact on the group (horizontal bar displacement to the right). Of these four categories, the facing block category, because it had the highest average value, had the greatest impact on its group and, therefore, on ‘Prestige’ perceptions. The same interpretation can be applied to “building shape.” The rectangular shape was not significantly different to the stepped and irregular shape (intersecting horizontal bars). However, the stepped shape is significantly different from the irregular shape (horizontal bar displacement to the right). In addition, it is the most important attribute in this group, having the highest average evaluation.
Group 2. Building. The second group of design elements in terms of impact on ‘Prestige’ perceptions (β: 0.206; p = 0.000). Significant design elements included the shape of the building (F: 8.452; p = 0.000), the presence of green areas nearby (F: 7.815; p = 0.006), elements of the façade, for example, windows, terraces and balconies (F: 4.400; p = 0.013), finishes (of floor/roofs, etc.) (F: 3.540; p = 0.031), and the number of terraces (F: 3.404; p = 0.019). It can be concluded that, for a building to be highly rated for ‘Prestige’, it must have a stepped-shaped design because, although there are no significant rating differences associated with having an irregular shape, the stepped design attracted a higher average score. A building will also be more highly rated if there are green areas in its environs. Third, the facade of the building should strongly feature balconies and terraces which, although not significantly more highly rated than windows, have a higher average rating. Next, facades constructed mainly using modern materials were more highly rated. Finally, the building must have terraces and, although there were no significant differences based on the number it has, the more terraces, the better it is evaluated.
Group 3. Spaciousness. Significant design elements in the impact of spaciousness on ‘Prestige’ perceptions (β: 0.182; p = 0.000) were: surface area (F: 17.991; p = 0.000) and the size of the terraces (F: 3.609; p = 0.014). Figure 7 shows that spaciousness is more highly evaluated based on the number of square metres of floor area. Although no significant differences were found between floor areas of 101 m2 to 120 m2, and more than 120 m2, this latter range was better evaluated, on average. Second, spaciousness was also more highly evaluated based on the size of the terraces, with those of a medium size being preferred. These are usually depicted in housing plans as containing a table (or as having sufficient space for a table).
Group 4. Flooring-coating. In this analysis (β: 0.180; p = 0.007) the significant design element was the flooring of the house (F: 13.234; p = 0.000). In Figure 7 it can be observed that high ratings for flooring and coatings (cladding, etc.) of real estate developments and, therefore, for ‘Prestige’ perceptions, are mainly associated with the materials used in the flooring of the dwellings. Parquet attracts highest ratings, as it is considered significantly different from other typologies (marble, ceramic, stone); graphically, it is positioned further to the right, indicating enhanced perceptions.
Group 5. Communal facilities. The statistically significant design elements in the analysis of communal facilities (β: 0.154; p = 0.002) that increased ‘Prestige’ perceptions were; (in the quality specifications) private gardens (F: 109.787; p = 0.000), swimming pools (F: 96.560; p = 0.000) other sports facilities (F: 31.946; p = 0.000), social clubs (F: 25.228; p = 0.000) and images of the private gardens (F: 63.066 p = 0.000), swimming pools (F: 56.210; p = 0.000), children’s play areas (F: 14.154; p = 0.000), and other sports facilities (F: 13.431; p = 0.000) (Figure 7).
Group 6. Installations. In the assessment of installations (β: 0.126; p = 0.025), statis-tically significant design elements included heating (F: 12.089; p = 0.000), television and cable telephone (F: 11.589; p = 0.001), satellite dishes (F: 10.716; p = 0.001), air conditioning (F: 10.490; p = 0.000), and video intercoms (F: 10.006; p = 0.002). It was observed that, to ob-tain a good installations rating, air conditioning was required, although there was no significant difference between integral systems and simple air conditioning machines. In addition, the house must have television and cable telephone, a satellite dish, and a video intercom system.
Group 7. Kitchen. For a kitchen to be well assessed (β: 0.125; p = 0.015), a significant design element is a drawing of a table (F: 10.179; p = 0.000), which allows the viewer to appreciate the size of the room and its auxiliary areas/ annexes (F: 4.157; p = 0.017). Although there were no significant differences when the table was situated in a passageway, the table is better evaluated when it is in the main kitchen area. As for auxiliary areas/annexes, it is essential to have at least a gallery (an area which allows light to enter the room), with terraces being preferred.
Group 8. Distribution. As to the assessment of the distribution (β: 0.115; p = 0.021), the design elements identified were the living room annexes (F: 3.657; p = 0.027), the lo-cation (F: 2.941; p = 0.055) and number (F: 2.907; p = 0.036) of the terraces, finishes (F: 2.740; p = 0.044), and colours (F: 2.591; p = 0.038). Although there were no significant differences between the categories of the design elements of the living room annexes, distribution was more highly evaluated when the living room had a balcony, the house had two terraces facing the development’s common area, and the plans used both warm and cool colours. Regarding the assessment of the distribution based on the finish of the plans, a higher score was given to those made with AutoCAD, including details such as furniture and plants.
Group 9. Master Bedroom. The next most impactful group on perceptions of ‘Prestige’ was related to the master bedroom (β: 0.112; p = 0.043), significant design elements in its assessment being its size (F: 5.182; p = 0.002) and the location (F: 3.071; p = 0.048) of the attached terrace. The explanation for the importance of these design elements lies in that in many developments the bedrooms featured terraces as annexes. The results showed that, for the master bedroom to achieve a good assessment, it needed to have a good-sized terrace, sufficient to hold a table and other auxiliary furniture. On the other hand, the optimal location of the terrace was not made clear, although orientations towards the development’s common area were slightly better evaluated.
Group 10. Terraces. The statistically significant design elements that influenced the assessment of terraces (β: 0.087; p = 0.047) were their size (F: 68.851; p = 0.000), their location (F: 62.459; p = 0.000), their number (F: 45.311; p = 0.000), and the colours (F: 5.494; p = 0.000). The results at Figure 7 show that for terraces to obtain good assessments and, therefore, enhanced perceptions of ‘Prestige’, there should be more than one, they should be large, they should be oriented mainly towards the development’s common areas and the plans should use a combination of warm and cool colours.

4. Discussion

This study identifies the design characteristics of real estate developments that elicit users’ perceptions of ‘Prestige’. To achieve this, the affective impressions related to real estate developments and their impact on purchase intentions were identified, distinguishing between intentions to reside or to invest. Subsequently, the design elements that influenced these perceptions were pinpointed. The findings have significant implications, both methodological and in terms of practical application.
From a methodological perspective, given that the application of Kansei Engineering in the real estate domain is not widespread, it is still a novel (while ideal) methodology. First, it takes the client’s perspective, thus eliminating the biased perceptions that construction and architecture experts might bring to an analysis. Most reviewed works use parameters and product characteristics defined by experts, which may not necessarily carry the same meaning for users [32,37,43,44,45,46]. Second, Kansei Engineering enables clients to identify and use a conceptual framework defined by clients themselves for product development [42], extended to real-estate-sector-related products [18,33,34]. This approach centres the product development process on how property buyers perceive the product, rather than how experts define it, with a strong focus on characteristics important to the client. Thus, it facilitates the quantitative analysis of perceptions of symbolic attributes rather than exclusively concentrating on material aspects and technical features.
An Important methodological contribution is that this analysis has a dual function, given that it differentiates between intention to purchase for residence or for investment. This differentiation is important because housing demand is based on both occupancy and investment. On the one hand, real estate products serve a utilitarian purpose by satisfying private housing needs, for example, for families; and on the other, they are as assets, generating wealth. This duality of demand corresponds to the dual utility of use-asset of investment, and is a differentiating element in the real estate sector [32].
From a results perspective, affective factors/semantic axes were identified through linear regression analysis, based on their influence on the purchase decision. Decisions to purchase for residence were mostly based on the axes of distribution and ‘Prestige’. Investment decisions were mostly based on ‘Prestige’, followed by “Family home” and “Good layout”. These results align with previous studies, such as those of Llinares and Page [18] and Montañana et al. [32]. The significance of distribution in client satisfaction has been emphasised in various studies. For instance, some authors measured distribution by examining the size and shape of different spaces [47,48,49]. Others determined that an individual’s orientation (awareness of his/her position) in a specific space conditions his/her satisfaction in that space [50] and capacity to move within it [51]. However, references to the affective factor related to ‘Prestige’ in the context of real estate developments are scarce, even though it has been identified in other sectors as a primary factor in purchase decisions [4,12].
Using the models, statistically significant design elements that explain ‘Prestige’ perceptions were identified. These include the presentation of information about the real estate development (e.g., the children’s play areas and private gardens), the building (stepped, with at least two large terraces oriented towards a common area), house size (greater than 120 m2), façade and floorings (modern materials in the façade, and parquet flooring inside), communal facilities (sports and social clubs), the kitchen (with a kitchen table), distribution (plans created in Autocad), the master bedroom (size of terrace), and terraces (plans combining cool and warm colours).
An analysis of the results revealed they shared similarities with those of previous research that also explored the design elements that influence ‘Prestige’ perceptions in the property context. Imamura et al. [30] examined some of these variables in kitchens, with results that seem to confirm those obtained in the present study, that is, the presence of a window in the kitchen was associated with elegance. Elegance was captured in perceptions of ‘Prestige’. However, most other studies have focused on investigating design elements of dwellings that cause people to develop a preference for the properties.
First, although no previous studies were identified that analysed the presence of private gardens in a real estate development, others explored buildings with integrated vegetation [52] and rooftop o nearby gardens [53,54]. The results of the present study align with those obtained by traditional authors such as Kaplan and colleagues [55], but also with more recent studies [56,57], where subjects, when exposed to photographic stimuli, in general preferred urban scenes with trees/nature over images lacking these characteristics. The results of the present study also corroborate those of Staats, Swain and Cars [58] where subjects rated urban buildings more favourably when they were set in a natural context. This preference might be attributed to the restorative effects and benefits of vegetation on physical and psychological health [59,60] and the self-perceived restorative effect of vegetation [61].
The results obtained in the present study regarding design elements related to the building’s form, typology, facades, terraces, etc., are similar to those of Stamps and Miller [62], Hashemi-Kashani and Pazhouhanfar [63], Stamps [64,65,66], Heath et al. [67], and Lee and Ostwald [68], who all examined the effects of the “complexity” of facade surfaces. These all concluded that an increase in the complexity of the silhouette and facade of buildings heightened perceptions of their overall complexity and, therefore, participants’ preferences. This preference may be because complexity demands greater cognitive analysis, with associated increased attention [69]. In contrast, another study has found that walkers in cities prefer views of buildings that are architecturally similar to each other and have traditional cladding such as brick [70]. However, it is important to note that both types of studies focus on general preference and not on the perception of ‘Prestige’ that is the subject of this paper.
Dwelling characteristics related to groupings, such as size [71], floorings and coverings [72], communal facilities, installations [73], and playgrounds [74], have been studied previously, but only from the perspective of their influence on final price rather than the assessment of consumers’ perceptions of ‘Prestige’.

5. Conclusions

This study addresses the need to design real estate developments that take account of buyers’ perceptions of ‘Prestige’. In this regard, Kansei Engineering is a novel and effective method. This approach provides design guidelines to address emotional expectations of ‘Prestige’. The enhancement of the perceptions of the ‘Prestige’ of a real estate development is primarily achieved by the photographic representation of children’s play areas and private gardens. It is also crucial that the building’s shape is stepped and that the dwellings feature at least two large terraces oriented towards the common areas. Regarding spaciousness, the dwelling should exceed 120 m2. In terms of finishes, it is vital to have modern materials on the facade and parquet flooring inside. In addition, the development should include sports facilities and a social club. In floor plans, it is advisable to use a combination of warm and cool colours. The results of the present study can be valuable for two main groups, researchers studying stimuli perception and processing, and professionals involved in the design and development of real estate developments.
As to future research directions, two essential aspects should be considered. First, this study used images provided by developers as stimuli to be evaluated. In future studies, it would be interesting to include other stimuli in virtual and augmented reality formats, as these are becoming more prevalent in the industry. While informativeness remains a crucial explanatory variable for subsequent residential purchase intentions [75], certain studies have demonstrated that the utilization of virtual reality in real estate marketing significantly influences the emotional state of clients, thereby impacting their purchase intentions [75,76,77]. Second, it would be interesting to analyse differences in sociodemographic characteristics in the sample, such as family unit size, as this appears to influence perceptions and satisfaction with housing [78], and the presence of children in the family, as children influence their parents’ purchasing decisions [79]. Aspects such as gender influencing the perception of façades would also be important to address [80]. In all these avenues, Kansei Engineering can assist researchers to obtain insightful results.

Author Contributions

Conceptualization, C.L., M.L.N. and A.M.; methodology, C.L., M.L.N. and A.M.; software, C.L., M.L.N. and A.M.; validation, C.L. and A.M.; formal analysis, C.L.; investigation, C.L., M.L.N. and A.M.; resources, C.L., M.L.N. and A.M.; data curation, C.L. and A.M.; writing—original draft preparation, C.L. and A.M.; writing—review and editing, M.L.N.; visualization, M.L.N.; supervision, M.L.N. and C.L.; project administration, C.L.; funding acquisition, M.L.N. and C.L. All authors have read and agreed to the published version of the manuscript.

Funding

This publication is part of the project PID2022-136582OB-I00, financed by MCIN/AEI/10.13039/501100011033/FEDER, UE. The second author is supported by Ministry of Science, Innovation and Universities of Spain (FPU19/03531).

Institutional Review Board Statement

The study was conducted according to the guidelines of the Declaration of Helsinki and approved by the Institutional Review Board of the Universitat Politècnica de València (P1_25_07_18; 25 July 2018).

Informed Consent Statement

Informed consent was obtained from all subjects involved in the study.

Data Availability Statement

The data presented in this study are available on request from the corresponding author. The data are not publicly available due to the risk that disclosure could jeopardize the privacy of the individuals involved in the study.

Conflicts of Interest

The authors declare no conflicts of interest.

Appendix A

Figure A1. Sets of 16 groups (dark grey) of design elements (light grey) and their corresponding categories (white) defining property developments.
Buildings 14 00853 g0a1

References

  1. Catry, B. The great pretenders. Bus. Strategy Rev. 2003, 14, 10–17. [Google Scholar] [CrossRef]
  2. Brun, A.; Castelli, C. The nature of luxury: A consumer perspective. Int. J. Retail Distrib. Manag. 2013, 41, 823–847. [Google Scholar] [CrossRef]
  3. Tama, I.P.; Azlia, W.; Hardiningtyas, D. Development of Customer Oriented Product Design using Kansei Engineering and Kano Model: Case Study of Ceramic Souvenir. Procedia Manuf. 2015, 4, 328–335. [Google Scholar] [CrossRef]
  4. Bahn, S.; Lee, C.; Nam, C.; Yun, M.H. Incorporating Affective Customer Needs for Luxuriousness into Product Design Attributes. Hum. Factors Ergon. Manuf. 2009, 19, 105–127. [Google Scholar] [CrossRef]
  5. Han, S.H.; Yun, M.H.; Kim, K.-J.; Kwahk, J. Evaluation of product usability: Development and validation of usability dimensions and design elements based on empirical models. Int. J. Ind. Ergon. 2000, 26, 477–488. [Google Scholar] [CrossRef]
  6. Ladhari, R.; Souiden, N.; Dufour, B. The role of emotions in utilitarian service settings: The effects of emotional satisfaction on product perception and behavioral intentions. J. Retail. Consum. Serv. 2017, 34, 10–18. [Google Scholar] [CrossRef]
  7. Berthon, P.R.; Pitt, L.F.; Parent, M.; Berthon, J.-P. Aesthetics and ephemerality: Observing and preserving the luxury brand. Calif. Manag. Rev. 2009, 52, 45–66. [Google Scholar] [CrossRef]
  8. Christodoulides, G.; Michaelidou, N.; Li, C.H. Measuring perceived brand luxury: An evaluation of the BLI scale. J. Brand Manag. 2009, 16, 395–405. [Google Scholar] [CrossRef]
  9. Walley, K.; Custance, P.; Copley, P.; Perry, S. The key dimensions of luxury from a UK consumers’ perspective. Mark. Intell. Plan. 2013, 31, 823–837. [Google Scholar] [CrossRef]
  10. Keiningham, T.; Aksoy, L.; Bruce, H.L.; Cadet, F.; Clennell, N.; Hodgkinson, I.R.; Kearney, T. Customer experience driven business model innovation. J. Bus. Res. 2020, 116, 431–440. [Google Scholar] [CrossRef]
  11. Ko, E.; Costello, J.P.; Taylor, C.R. What is a luxury brand? A new definition and review of the literature. J. Bus. Res. 2019, 99, 405–413. [Google Scholar] [CrossRef]
  12. Vigneron, F.; Johnson, L.W. Measuring perceptions of brand luxury. Brand Manag. 2004, 11, 484–506. [Google Scholar] [CrossRef]
  13. CaixaBank Research “A Change in Trend for the Real Estate Sector”. Available online: https://www.caixabankresearch.com/en/sector-analysis/real-estate/change-trend-real-estate-sector (accessed on 25 January 2023).
  14. Hofman, E.; Halman, J.I.M.; Ion, R.A. Variation in housing design: Identifying customer preferences. Hous. Stud. 2006, 21, 929–943. [Google Scholar] [CrossRef]
  15. Larsen, M.S.S.; Lindhard, S.M.; Brunoe, T.D.; Nielsen, K.; Larsen, J.K. Mass customization in the house building industry: Literature review and research directions. Front. Built Environ. 2019, 5, 115. [Google Scholar] [CrossRef]
  16. KPMG, Real Estate “2015, Año Cero Para El Inicio de la Recuperación Del Sector Inmobiliario en España”. Available online: https://assets.kpmg.com/content/dam/kpmg/pdf/2015/06/Informe-2015-RealEstate.pdf (accessed on 6 February 2024).
  17. Poursaeed, O.; Matera, T.; Belongie, S. Vision-based real estate price estimation. Mach. Vis. Appl. 2018, 29, 667–676. [Google Scholar] [CrossRef]
  18. Llinares, C.; Page, A.F. Application of product differential semantics to quantify purchaser perceptions in housing assessment. Build. Environ. 2007, 42, 2488–2497. [Google Scholar] [CrossRef]
  19. Nagamachi, M. Kansei Engineering: A New Ergonomic Consumer-Oriented Technology for Product Development. Int. J. Ind. Ergon. 1995, 15, 3–11. [Google Scholar] [CrossRef]
  20. Lin, S.; Shen, T.; Guo, W. Evolution and emerging trends of kansei engineering: A visual analysis based on citespace. IEEE Access 2021, 9, 111181–111202. [Google Scholar] [CrossRef]
  21. Hsiao, S.W.; Chen, C.H. A semantic and shape grammar based approach for product design. Des. Stud. 1997, 18, 275–296. [Google Scholar] [CrossRef]
  22. Smith, S.; Fu, S.H. The relationships between automobile head-up display presentation images and drivers’ Kansei. Displays 2011, 32, 58–68. [Google Scholar] [CrossRef]
  23. Xiong, Z.Y.; Weng, Y.X.; Jiang, L.J.; Ruan, L.Q. Kansei Quality Prediction Method of Product Form Design based on Quantification Theory. Appl. Mech. Mater. 2014, 548, 1922–1927. [Google Scholar] [CrossRef]
  24. Ishihara, S.; Ishihara, K.; Nagamachi, M.; Matsubara, Y. An analisis of Kansei structure on shoes using self-organizing neural networks. Int. J. Ind. Ergon. 1997, 19, 93–104. [Google Scholar] [CrossRef]
  25. Shimizu, Y.; Jindo, T. A fuzzy logic analysis method for evaluation human sensitivities. Int. J. Ind. Ergon. 1995, 15, 39–47. [Google Scholar] [CrossRef]
  26. Guo, F.; Qu, Q.X.; Nagamachi, M.; Duffy, V.G. A proposal of the event-related potential method to effectively identify kansei words for assessing product design features in kansei engineering research. Int. J. Ind. Ergon. 2020, 76, 102940. [Google Scholar] [CrossRef]
  27. López, Ó.; Murillo, C.; González, A. Systematic literature reviews in kansei engineering for product design—A comparative study from 1995 to 2020. Sensors 2021, 21, 6532. [Google Scholar] [CrossRef] [PubMed]
  28. Nagamachi, M. Kansei engineering as a powerful consumer-oriented technology for product development. Appl. Ergon. 2002, 33, 289–294. [Google Scholar] [CrossRef]
  29. Matsubara, Y.; Nagamachi, M. Hybrid Kansei Engineering System and Design Support. Int. J. Ind. Ergon. 1997, 19, 81–92. [Google Scholar] [CrossRef]
  30. Arslan, H.D.; Yıldırım, K. Perceptual evaluation of stadium façades. Alex. Eng. J. 2023, 66, 391–404. [Google Scholar] [CrossRef]
  31. Nagamachi, M. History of Kansei Engineering and Application of Artificial Intelligence. In Advances in Affective and Pleasurable Design. AHFE 2017. Advances in Intelligent Systems and Computing, 1st ed.; Chung, W., Shin, C., Eds.; Springer: Cham, Switzerland, 2018; Volume 585, pp. 357–368. [Google Scholar] [CrossRef]
  32. Montañana, A.; Llinares, C.; Navarro, E. Architects and non-architects: Differents in perception on property design. J. Hous. Built Environ. 2013, 28, 273–291. [Google Scholar] [CrossRef]
  33. Montañana, A.; Llinares, C.; Page, Á.F. Modelling design requirements of a floor plan. Open House Int. 2015, 40, 88–93. [Google Scholar] [CrossRef]
  34. Llinares, C.; Page, A. Kano’s model in Kansei Engineering to evaluate subjective real estate consumer preferences. Int. J. Ind. Ergon. 2011, 41, 233–246. [Google Scholar] [CrossRef]
  35. Llinares, C.; Page, A. Differential semantics as a Kansei Engineering tool for analysing the emotional impressions which determine the choice of neighbourhood: The case of Valencia, Spain. Landsc. Urban Plan. 2008, 8, 247–257. [Google Scholar] [CrossRef]
  36. Llinares, C.; Page, A.; Llinares, J. An approach to defining strategies for improving city perception. Case Study Valencia Spain. Cities 2013, 35, 78–88. [Google Scholar] [CrossRef]
  37. Llinares, C.; Iñarra, S. Human factors in computer simulations of urban environment. Differences between architects and non-architects’ assessments. Displays 2014, 35, 126–140. [Google Scholar] [CrossRef]
  38. Hartono, M. The modified Kansei Engineering-based application for sustainable service design. Int. J. Ind. Ergon. 2020, 79, 102985. [Google Scholar] [CrossRef]
  39. Nasar, J.L. Urban Design Aesthetics: The Evaluative Qualities of Building Exterion. In Proceedings of the International Symposium on Design Review, Cincinnati, OH, USA, 8–11 October 1992, 1st ed.; Preiser, W.F.E., Scheer, B.C., Eds.; Routledge: London, UK, 1992; pp. 67–78. [Google Scholar] [CrossRef]
  40. Terninko, J. Step-By-Step QFD: Customer-Driven Product Design, 2nd ed.; Routledge: London, UK, 2018. [Google Scholar] [CrossRef]
  41. Streiner, D.L. Starting at the Beginning: An Introduction to Coefficient Alpha and Internal Consistency. J. Personal. Assess. 2003, 80, 99–103. [Google Scholar] [CrossRef] [PubMed]
  42. Schütte, S.; Eklund, J.; Axelsson, J.; Nagamachi, M. Concepts, Methods and Tools in Kansei Engineering. Theor. Issues Ergon. Sci. 2004, 5, 214–231. [Google Scholar] [CrossRef]
  43. Akalin, A.; Yildirim, K.; Wilson, C.; Kilicoglu, O. Architecture and engineering students’ evaluations of house façades: Preference, complexity and impressiveness. J. Environ. Psychol. 2009, 29, 124–132. [Google Scholar] [CrossRef]
  44. Stamps, A.E. Mystery of environmental mystery. Environ. Behav. 2007, 39, 165–197. [Google Scholar] [CrossRef]
  45. Ikemi, M. The effect of mystery on preference for residential façades. J. Environ. Psychol. 2005, 25, 167–173. [Google Scholar] [CrossRef]
  46. Ghomeshi, M.; Jusan, M.M. Investigating different aesthetic preferences between architects and non-architects in residential façade designs. Indoor Built Environ. 2013, 22, 952–964. [Google Scholar] [CrossRef]
  47. Torres, I.; Greene, M.; Ortúzar, J.D.D. Valuation of housing and neighbourhood attributes for city centre location: A case study in Santiago. Habitat Int. 2013, 39, 62–74. [Google Scholar] [CrossRef]
  48. Wong, J.F. Factors affecting open building implementation in high density mass housing design in Hong Kong. Habitat Int. 2010, 34, 174–182. [Google Scholar] [CrossRef]
  49. Saarimaa, S.; Pelsmakers, S. Better living environment today, more adaptable tomorrow? Comparative analysis of Finnish apartment buildings and their adaptable scenarios. Finn. J. Urban Stud. 2020, 58, 33–58. [Google Scholar] [CrossRef]
  50. Okabe, A.; Oaki, K.; Hamamoto, W. Distance and direction judgement in a large-scale natural environment: The effects of a winding trail. Environ. Behav. 1986, 18, 755–772. [Google Scholar] [CrossRef]
  51. Park, S.; Brady, T.F.; Greene, M.R.; Oliva, A. Disentangling scene content from spatial boundary: Complementary roles for the parahippocampal place area and lateral occipital complex in representing real-world scenes. J. Neurosci. 2011, 31, 1333–1340. [Google Scholar] [CrossRef]
  52. White, E.V.; Gatersleben, B. Greenery on residential buildings: Does it affect preferences and perceptions of beauty? J. Environ. Psychol. 2011, 31, 89–98. [Google Scholar] [CrossRef]
  53. Yuen, B.; Hien, W.N. Resident perceptions and expectations of rooftop gardens in Singapore. Landsc. Urban Plan. 2005, 73, 263–276. [Google Scholar] [CrossRef]
  54. Taib, N.; Abdullah, A. Study of landscape gardens: Expectations and users’ perceptions of a high-rise office building. Procedia-Soc. Behav. Sci. 2012, 50, 633–642. [Google Scholar] [CrossRef]
  55. Kaplan, S.; Kaplan, R.; Wendt, J.S. Rated preference and complexity for natural and urban visual material. Percept. Psychophys. 1972, 12, 354–356. [Google Scholar] [CrossRef]
  56. Lohr, V.I.; Pearson-Mims, C.H. Response to scenes with spreading, rounded, and conical trees forms. Environ. Behav. 2006, 38, 667–688. [Google Scholar] [CrossRef]
  57. Harris, V.; Kendal, D.; Hahs, A.K.; Threlfall, C.G. Green space context and vegetation complexity shape people’s preferences for urban public parks and residential gardens. Landsc. Res. 2018, 43, 150–162. [Google Scholar] [CrossRef]
  58. Staats, H.; Swain, R. Cars, trees, and house prices: Evaluation of the residential environment as a function of numbers of cars and trees in the street. Urban For. Urban Green. 2020, 47, 126554. [Google Scholar] [CrossRef]
  59. Chiang, Y.C.; Li, D.; Jane, H.A. Wild or tended nature? The effects of landscape location and vegetation density on physiological and psychological responses. Landsc. Urban Plan. 2017, 167, 72–83. [Google Scholar] [CrossRef]
  60. Marini, S.; Mauro, M.; Grigoletto, A.; Toselli, S.; Latessa, P.M. The Effect of Physical Activity Interventions Carried out in Outdoor Natural Blue and Green Spaces on Health Outcomes: A Systematic Review. Int. J. Environ. Res. Public Health 2022, 19, 12482. [Google Scholar] [CrossRef] [PubMed]
  61. Hajibeigi, P.; Pazhouhanfar, M.; Grahn, P.; Nazif, H. Enhancing Citizens’ Perceived Restoration Potential of Green Facades through Specific Architectural Attributes. Buildings 2023, 13, 2356. [Google Scholar] [CrossRef]
  62. Stamps, A.; Miller, S. Advocacy Membership, Design Guidelines, and Predicting Preferences for Residential Infill Designs. Environ. Behav. 1993, 25, 367–409. [Google Scholar] [CrossRef]
  63. Hashemi-Kashani, S.M.; Pazhouhanfar, M. Role of physical attributes of preferred building facades on perceived visual complexity: A discrete choice experiment. Environ. Dev. Sustain. 2023, 1–20. [Google Scholar] [CrossRef]
  64. Stamps, A.E. Some Streets of San Francisco: Preference Effects of Trees, Cars, Wires, and Buildings. Environ. Plan. B Plan. Des. 1997, 24, 81–93. [Google Scholar] [CrossRef]
  65. Stamps, A.E. Complexity of Architectural Silhouettes: From Vague Impressions to Definite Design Features. Percept. Mot. Ski. 1998, 87 (Suppl. S3), 1407–1417. [Google Scholar] [CrossRef]
  66. Stamps, A.E. Physical Determinants of Preferences for Residential Facades. Environ. Behav. 1999, 31, 723–751. [Google Scholar] [CrossRef]
  67. Heath, T.; Smith, S.G.; Lim, B. Tall buildings and the urban skyline: The effect of visual complexity on preferences. Environ. Behav. 2000, 32, 541–556. [Google Scholar] [CrossRef]
  68. Lee, J.H.; Ostwald, M.J. The ‘visual attractiveness’ of architectural facades: Measuring visual complexity and attractive strength in architecture. Archit. Sci. Rev. 2023, 66, 42–52. [Google Scholar] [CrossRef]
  69. Lee, J.H.; Ostwald, M.J. Fractal Dimension Calculation and Visual Attention Simulation: Assessing the Visual Character of an Architectural Façade. Buildings 2021, 11, 163. [Google Scholar] [CrossRef]
  70. Gjerde, M.; Vale, B. An examination of people’s preferences for buildings and streetscapes in New Zealand. Aust. Plan. 2022, 58, 36–48. [Google Scholar] [CrossRef]
  71. Zietz, J.; Zietz, E.N.; Sirmans, G.S. Determinants of house prices: A quantile regression approach. J. Real Estate Financ. Econ. 2008, 37, 317–333. [Google Scholar] [CrossRef]
  72. Selim, H. Determinants of house prices in Turkey: Hedonic regression versus artificial neural network. Expert Syst. Appl. 2009, 36, 2843–2852. [Google Scholar] [CrossRef]
  73. Sirmans, G.S.; MacDonald, L.; Macpherson, D.A.; Zietz, E.N. The value of housing characteristics: A meta analysis. J. Real Estate Financ. Econ. 2006, 33, 215–240. [Google Scholar] [CrossRef]
  74. Asabere, P.K.; Huffman, F.E. The relative impacts of trails and greenbelts on home price. J. Real Estate Financ. Econ. 2009, 38, 408–419. [Google Scholar] [CrossRef]
  75. Kang, H.J.; Shin, J.H.; Ponto, K. How 3D virtual reality stores can shape consumer purchase decisions: The roles of informativeness and playfulness. J. Interact. Mark. 2020, 49, 70–85. [Google Scholar] [CrossRef]
  76. Azmi, A.; Ibrahim, R.; Abdul Ghafar, M.; Rashidi, A. Smarter real estate marketing using virtual reality to influence potential homebuyers’ emotions and purchase intention. Smart Sustain. Built Environ. 2022, 11, 870–890. [Google Scholar] [CrossRef]
  77. Raza, A.; Wasim, M.; Ishaq, M.I. Virtual reality-based product displays to inspire consumers’ purchase intentions: An experimental study. J. Bus. Res. 2024, 175, 114540. [Google Scholar] [CrossRef]
  78. Rogers, E.C.; Nikkel, S.R. The housing satisfaction of large urban families. Hous. Soc. 1979, 6, 73–87. [Google Scholar] [CrossRef]
  79. Flurry, L.A.; Burns, A.C. Children’s influence in purchase decisions: A social power theory approach. J. Bus. Res. 2005, 58, 593–601. [Google Scholar] [CrossRef]
  80. He, F.; He, Y.; Sun, L. Gender differences in color perceptions and preferences of urban façades based on a virtual comparison. Build. Environ. 2023, 245, 110907. [Google Scholar] [CrossRef]
Figure 1. Two examples of stimuli presented. Note that the stimulus was presented in Spanish. Therefore, the figure displays images of the original stimuli with translated texts. The initials N, S, E, O are part of a non-modifiable graphic element and correspond to the cardinal points north, south, east, and west, respectively.
Buildings 14 00853 g001
Figure 2. Schematic representation of the participants in each phase and the responses made.
Buildings 14 00853 g002
Figure 3. Steps of the identification of the different semantic axes influencing perceptions.
Buildings 14 00853 g003
Figure 4. Steps of the identification of the different categories of design elements influencing perceptions.
Buildings 14 00853 g004
Figure 5. Results obtained from the regression analysis of the variable reside and invest. Note that B represents the non-standardized coefficients that constitute part of the equation in raw scores. These coefficients are not independent, as they are calculated taking into account the presence of the remaining independent variables. SE refers to the standard error of each non-standardized coefficient. Beta illustrates the standardized coefficients that are comparable to each other. It identifies the significance of each independent variable in the equation. Thus, variables with a higher coefficient carry more weight. The significance levels help identify the significant variables contributing to explaining the dependent variable, and therefore are explanatory variables. To achieve this, t displays the t-test statistic used to calculate significance.
Buildings 14 00853 g005
Figure 6. Results obtained from the regression analysis of the perception of prestige variable. The graph represents the values of: (1) beta, which denotes the significance of each independent variable in the equation of the study on the dependent variable (perception of real estate promotion as prestigious), and (2) p-value levels, which are used to identify significant variables contributing to the explanation of the dependent variable. 1 Amenities present in a dwelling (such as heating or air conditioning), contributing to the comfort and functionality of the home.
Buildings 14 00853 g006
Figure 7. Results of the Bonferroni post hoc test. For the same design element, where the horizontal category bars intersect, the perceptions associated with the categories are the same. Displacement in relation to the horizontal bars indicates the direction of difference. Thus, displacement to the right indicates an increase in associated perceptions. Note: The average value of the different categories of design elements corresponds to the average assessments made by the subjects in the sample.
Buildings 14 00853 g007
Table 1. Summary of results obtained in the factorial analysis.
AxisFactorSemantic Space Which IncludesContribution % (Cronbach’s Alpha)
1PrestigeOriginal (0.806), Luxury (0.805), Full of character (0.710), Innovative (0.683), Refined (0.654), Designer (0.633), Fashionable (0.618), Cosy (0.605), Elegant (0.592), Expensive (0.546), Good-looking (0.543), Intelligent (0.515), Tailor-made (0.498), Magnificent kitchen (0.496), Quality materials and finishes (0.487), Modern (0.482), Quality (475), Plenty of cupboards and auxiliary areas (0.412), Good architectural design (0.453), Well-equipped (0.468), Young (0.417)15.58 (0.926)
2Good layoutSimple layout (0.827), Rational layout (0.741), Convenient (0.674), Practical (0.608), Simple lines (0.570), Timeless, does not get dated (0.529), Pleasant (0.496), Interconnecting rooms (0.495), Welcoming (0.489), Tailor-made (0.461), Natural (0.411)10.69 (0.881)
3Light and Outward facingInward-facing (−0.785), Light (0.766), Outward-facing, open views (0.681), Good architectural design (0.495), Well-equipped (0.491), Quality (0.458)7.74 (0.823)
4Family homeFor growing families (0.834), Spacious (0.798), Family home (0.752)6.76 (0.840)
5Ecological characterCountry style (0.811), Ecological (0.617), Natural atmosphere (0.405)4.86 (0.565)
6Peaceful and safePeaceful (0.682), Safe (0.604), Guaranteed maintenance (0.488)4.60 (0.599)
7ClassicalClassical (0.757), Formal (0.685)3.56 (0.583)
8Community AtmosphereCommunity atmosphere (0.842), Good communal services (0.505), Modern (0.410)3.40 (0.679)
9Flexible layoutFlexible layout (0.712), Layout with many possibilities (0.605)3.00 (0.822)
10OrientationGood orientation (0.611), Quality materials and finishes (0.475)1.71 (0.447)
11RestrainedRestrained (0.651), Good bathrooms (0.521), Urban (0.447)1.69 (0.352)
12Carefree and YoungCarefree (0.828), Young (0.419)1.50 (0.467)
13ImpersonalImpersonal (0.767), Private atmosphere, independent (0.423)1.34 (0.268)
14SpaciousSpacious (0.729), Magnificent kitchen (0.448)1.29 (0.215)
15Liveable in 1Liveable in (0.511)1.04 (-)
1 Capability to be inhabited and lived.
Disclaimer/Publisher’s Note: The statements, opinions and data contained in all publications are solely those of the individual author(s) and contributor(s) and not of MDPI and/or the editor(s). MDPI and/or the editor(s) disclaim responsibility for any injury to people or property resulting from any ideas, methods, instructions or products referred to in the content.

