Article

Evaluating the Role of Green Infrastructure in Microclimate and Building Energy Efficiency

Department of Architecture, School of Art and Architecture, Shiraz University, Shiraz P.O. Box 7188637911, Iran
*
Author to whom correspondence should be addressed.
Buildings 2024, 14(3), 825; https://doi.org/10.3390/buildings14030825
Submission received: 2 February 2024 / Revised: 7 March 2024 / Accepted: 14 March 2024 / Published: 19 March 2024

Abstract

:
This study investigates how permeable and cool pavements, green roofs, and living walls affect microclimatic conditions and buildings’ energy consumption in an arid urban setting: Shiraz. The study aims to evaluate the role of green infrastructure in mitigating urban heat island effects and enhancing outdoor conditions. By utilizing environmental modeling tools, specifically the ENVI-met 5.1.1 and Design Builder 7.0.2 software, a comprehensive analysis was conducted across various scenarios during both the summer and winter seasons. The results show that permeable pavements with 80% grass coverage reduced the mean average air temperature by 1.18 °C in summer mornings compared to the reference case. In both the summer and winter scenarios, the living wall intervention consistently emerged as the most effective strategy, showcasing substantial reductions in cooling consumption, CO2 emissions, and electricity consumption. With a 25% reduction in cooling consumption, a 14.7% decrease in CO2 emissions, and an impressive 53.4% decline in electricity consumption, the living wall excelled in its environmental impact, and it stands out for its substantial electricity savings. While the green roof and permeable pavement scenarios demonstrated more modest gains, their integration could offer a synergistic solution, warranting further exploration for optimized energy efficiency and environmental sustainability. These findings indicate the intrinsic connection between sustainable landscaping strategies and their influence on urban microclimate and building energy efficiency.

1. Introduction

Indoor thermal comfort constitutes a pivotal concern within office buildings, exerting significant impacts on occupants’ well-being, productivity, and satisfaction. A plethora of studies have underscored the imperative of maintaining optimal thermal conditions within workspaces. Notably, research by Zhang elucidated that providing a comfortable thermal environment enhances job satisfaction and cognitive performance among office workers [1]. Moreover, empirical evidence has established a direct correlation between indoor thermal comfort and employee productivity, elucidating the fact that discomfort stemming from excessive heat or cold can precipitate diminished work performance [2,3,4]. Additionally, it is pertinent to recognize that buildings account for a substantial portion of global final energy consumption [5], with a notable fraction attributable to indoor environmental quality, particularly thermal energy requisites [6,7,8,9]. Since the building sector stands as the foremost energy consumer worldwide [10], the heating, ventilation, and air conditioning (HVAC) systems of typical office buildings encompass a significant proportion of the total energy consumption. Furthermore, a considerable share of countries’ electricity usage is attributed to buildings [11]. The potential societal advantages of indoor environmental enhancement are profound [12,13], with estimates suggesting that expenses related to substandard indoor environments exceed heating and ventilating costs [2].
Indoor thermal conditions heavily influence energy consumption in office buildings. According to a study by Hong and Lin, improper temperature control and discomfort can lead to increased reliance on heating, ventilation, and air conditioning (HVAC) systems, resulting in higher energy consumption and associated environmental impacts [14] Therefore, considering the significance of indoor thermal comfort is crucial for both occupant well-being and achieving sustainable, energy-efficient office buildings.
The quality of indoor thermal conditions is intricately linked to various environmental factors, including vegetation and landscape design materials. Notable research by Santamouris et al. highlighted the potential of greenery to mitigate the urban heat island effect and positively influence indoor thermal conditions [15,16]. Similarly, investigations into the effects of landscape materials such as green walls and permeable pavements have revealed these materials’ role in microclimate regulation and thermal comfort enhancement [17,18,19,20,21,22]. These findings underscore the importance of integrating vegetation and material choices into landscape design to optimize indoor thermal conditions effectively.
Urban greenery has been recognized for its ability to lower outdoor air temperatures and subsequently reduce cooling energy requirements for buildings [23,24,25,26,27,28]. However, the efficacy of vegetation in temperature regulation is influenced by factors such as urban density, as evidenced by study conducted by Chen et al. [29]. Moreover, site-specific characteristics such as building and vegetation density play a significant role in determining the cooling benefits of urban vegetation [30].
These studies also showed that vegetation can have a moderate cooling effect on air temperature and energy consumption in intensively built-up regions, resulting in nominal decreases of 0.1 K and 0.2% for temperature and energy, respectively [31,32]. In other words, vegetation can have a cooling influence on air temperature and energy demand.
Moreover, cool paving and vegetated systems, including living walls and green roofs, have emerged as significant strategies for mitigating the urban heat island (UHI) effect and reducing energy consumption in buildings. The urban landscape’s increasing temperature due to UHI effects has prompted an exploration into innovative solutions to counteract rising temperatures and their adverse effects on thermal comfort and energy usage in urban environments. Cool pavements, characterized by high albedo and permeability, have been extensively studied for their potential to lower outdoor air temperatures [33,34,35,36].
Research by Akbari and Santamouris et al. has demonstrated the substantial impact of cool paving on reducing air temperatures in cities like Rome, Athens, and Los Angeles by several degrees Celsius [23,33,34]. Similarly, Kyriakodis and Santamouris and Santamouris et al. highlighted the potential of cool paving to lower air temperatures in regions like Greece and Italy [34,37]. Furthermore, studies by Battista and Pastore, Sen et al., Shahidan et al., and Taleghani and Beradi emphasized the cooling effects of highly reflective materials and different pavement albedo levels in various urban contexts [38,39,40,41,42].
Permeable pavements, designed to regulate stormwater runoff and enhance water penetration, contribute to UHI mitigation by reducing the heat retention associated with impermeable surfaces [43]. Seinfeddine et al., Wang et al., and Xie and Zhou delved into the cooling effects of permeable pavements through improved evaporation processes [43,44,45].
The combination of cool and permeable pavements presents a comprehensive approach to UHI abatement, albeit one that is influenced by regional factors and maintenance requirements [18]. Urban density plays a crucial role in determining the effectiveness of cool pavement strategies, with densely populated areas benefiting more from these interventions [33].
Living walls and green roofs, often referred to as vertical gardens and vegetated rooftops, respectively, offer promising solutions to mitigate the UHI effect and reduce indoor energy consumption [19,46]. Charoenkit and Yiemwattana highlighted the role of living walls in enhancing thermal comfort and reducing carbon emissions through shading and evaporative cooling [18]. Similarly, Ferrari et al. emphasized the cooling effects of green roofs by analyzing evapotranspiration and shading impacts [19].
In addition to mitigating UHI effects, living walls and green roofs contribute to indoor energy efficiency by serving as natural thermal insulators, thereby reducing the need for artificial cooling and heating systems [17]. Studies by Assimakopoulos et al. and Vujovic et al. underscored the energy-saving benefits of these green design elements [22].
However, the effectiveness of living walls and green roofs in reducing indoor energy consumption varies, depending on climatic conditions, building characteristics, and site-specific factors [47,48,49,50]. Factors such as the available sunlight, wind patterns, and building orientation influence the performance of these systems [49].
Du et al. highlighted the significant increase in UHI intensity and air conditioning usage in densely populated urban areas, underscoring the need for greenery interventions to mitigate these effects [51]. Pragati et al. emphasized the cooling effects of green facades, while Karimi et al. and Algarni et al. delved into the impact of green walls and roofs on energy consumption and structural integrity in different climatic contexts [49,52,53].
Aboelata’s studies advocated for tailored approaches to cool paving and green roof implementations based on urban density and climatic conditions [54,55]. Extensive and intensive green roofs offer distinct advantages, depending on building height and density, emphasizing the multifaceted benefits of green infrastructure in urban environments [46].
In conclusion, a critical literature review of these diverse studies underscores the complexity and context-specific nature of urban greenery strategies in shaping energy efficiency and environmental conditions. By 2050, an estimated 68% of the global population will live in urban areas. This trend underscores the imperative for cities to bolster their resilience to effectively navigate a range of uncertainties [56], including environmental degradation, pollution, and climate change, which have profound implications for human well-being [57]. The escalation of energy demand for cooling buildings due to climate-induced global warming has become notably pronounced. Green infrastructure (GI), encompassing elements such as trees, shrubs, and green roofs, offers a natural shading mechanism, thereby diminishing direct sunlight exposure and mitigating ambient temperatures [58]. Studies provide valuable insights into the potential benefits and challenges associated with different greenery interventions, emphasizing the need for tailored approaches that consider the specific characteristics of each urban context. Notably, green roofs and walls have emerged as pivotal contributors to substantial energy savings, emphasizing the imperative of meticulous plant selection and contextual considerations.
Consequently, in light of the varying effects of vegetation in different urban environments and its dependency on environmental and natural factors such as urban density, winds, and humidity, it is essential to consider alternative landscape design elements when evaluating indoor energy consumption.
To address existing research gaps and advance the understanding in this field, a systematic literature review was conducted using the Scopus database, complemented by bibliometric analysis using the VOSviewer 1.6.20 software. The search strategy encompassed a broad yet targeted spectrum of the relevant literature, focusing on the intersection of landscape design elements and building energy consumption across various contexts. The resulting analysis revealed a substantial increase in research activity over recent decades (Figure 1), with a pronounced scholarly focus on sustainable urban design and energy-efficient building practices [59,60].
The subsequent analysis, facilitated by VOSviewer, offers a comprehensive overview of prevalent themes within the collected literature, aiding in the identification of research gaps. The accompanying VOSviewer network visualization presents a graphical representation of interconnected research themes in urban sustainability and building performance. The map clusters related terms into discernible themes, such as ‘thermal comfort’, ‘energy efficiency’, and ‘environmental impact’, highlighting their associations with urban infrastructure components. It underscores the importance of built environment factors in promoting occupational well-being and energy conservation, as well as the growing emphasis on mitigating anthropogenic heat through design interventions. The map also reflects the increasing integration of sustainable practices in architectural planning, emphasizing the role of natural elements in climate regulation. Given the nuanced impact of vegetation on indoor energy consumption across different urban contexts, this study aimed to explore alternative landscape design elements to comprehensively evaluate and optimize energy-efficient building design (Figure 2).
When considering the varying impact of vegetation in different urban environments and its dependence on environmental and natural factors such as urban density, winds, and humidity, it becomes imperative to explore alternative landscape design elements to assess indoor energy consumption. As highlighted in numerous studies, the effectiveness of vegetation in influencing energy consumption is not uniform across all settings. Therefore, to comprehensively evaluate indoor energy consumption and optimize design strategies, this study sought to assess the effect of synthetic design elements that designers can apply to their designs to impact a building’s energy consumption. In summary, the following points represent some of the aspects that can be used to describe the uniqueness and novelty of this study:
  • The objective of this study was to address the existing research gap concerning the utilization of landscape design features to influence outdoor air temperature, enhance thermal comfort, and reduce cooling energy requirements in buildings located in Shiraz.
  • The study aimed to identify an alternative approach to using trees and grass to enhance the impact of landscape design on the energy requirements of buildings.
  • This study was conducted in an office site on the city’s outskirts, which have an extreme topography and diverse vegetation.
  • Both the summer and winter seasons were considered to investigate the effect of landscape design elements on the building’s outdoor and indoor thermal comfort and energy consumption.
The identified strategies, including cool paving and green roofs, offer nuanced insights into effective temperature modulation across diverse urban settings. Building upon these insights, the following hypotheses are proposed:
  • Green infrastructure interventions, such as green roofs and living walls, will lead to a reduction in ambient temperatures and contribute to enhanced thermal comfort.
  • Permeable and cool pavements will demonstrate a decrease in surface temperatures and mitigate heat island effects.
  • There will be a correlation between the extent of green infrastructure implementation and reductions in building energy consumption.
  • Integrating multiple green infrastructure interventions will result in synergistic benefits, improving microclimatic conditions and energy efficiency.
These hypotheses serve as guiding principles for the subsequent research and experimentation to empirically validate the efficacy of various green infrastructure strategies and pavement materials in addressing urban environmental challenges.

2. Materials and Methods

2.1. Research Design

This study employed a mixed-methods research design to examine the influence of urban greenery and pavement materials on microclimatic conditions and building energy consumption within an arid urban environment, specifically focusing on Shiraz. The research design integrated both quantitative and qualitative approaches to provide a comprehensive understanding of the effectiveness of various green infrastructure interventions.
The research’s quantitative component involved using environmental modeling tools, specifically the ENVI-met 5.1.1 and DesignBuilder 7.0.2 software. A scenario-based approach developed six distinct scenarios based on findings from a comprehensive literature review. These scenarios were then implemented in an environmental model, allowing for the simulation and comparison of microclimatic conditions and energy consumption across different scenarios during the summer and the winter. The key quantitative outcomes that were analyzed include variations in mean air temperature, humidity levels, energy consumption patterns, CO2 emissions, and electricity usage.
In parallel, the qualitative component of the study focused on gathering and interpreting observations derived from the simulation results. The aim was to explore the nuanced effects of various green infrastructure interventions on microclimatic conditions and building energy consumption. Researchers sought to synthesize findings through a qualitative analysis to identify underlying patterns, trends, and potential synergies between different interventions. This qualitative component enhances the understanding of the intricate interactions between green infrastructure and urban microclimate dynamics, providing valuable insights beyond numerical data alone.
By integrating both quantitative and qualitative approaches, this mixed-methods research design enables a holistic assessment of the impact of urban greenery and pavement materials on microclimatic conditions and building energy consumption in Shiraz. This comprehensive approach is essential for informing evidence-based decision-making and promoting sustainable urban development practices in arid urban environments.

2.2. Methodology Framework

This study investigated the effect of urban greenery and pavement materials on reducing energy demand and enhancing the indoor thermal comfort of an office building in Shiraz, Iran. Therefore, Fars Science and Technology Park was chosen as the most prominent office site in Shiraz City. Then, the area was modeled and simulated via ENVI-met 5.1.1, using the site’s current situation. Based on data derived from the literature review, six scenarios were designed, applied to the model, and simulated again to compare to the reference case regarding outdoor temperature and humidity in order to understand the effect of applied scenarios. Next, the physiological equivalent temperature (PET), an index for outdoor thermal comfort, was examined to determine which scenario best affected outdoor conditions.
The Envi-met output (air temperature, relative humidity, and wind speed) of the reference case and scenarios was used as inputs for the DesingBuilder 7.0.2 model. These data were used to create an EPW file (EnergyPlus weather). Each EPW file was applied to the DesignBuilder model to calculate energy savings and indoor thermal comfort for each scenario through air temperature and humidity fluctuations. Figure 3 visually represents the methodological framework, briefly outlining the sequential steps involved in the research process. This flowchart serves as a guiding reference, facilitating a clear understanding of the study’s methodological approach and ensuring transparency and reproducibility in the research methodology.

Envi-Met Model Evaluation

Air temperature, surface temperature, wind speed, and relative humidity were measured hourly in a micro-urban area in Shiraz on the following two days:
  • Summer: 15 June 2022 from 8 a.m. to 10 p.m.
  • Winter: 19 February 2022 from 8 a.m. to 7 p.m.
Figure 4 and Figure 5 clearly illustrate the areas designated for collecting meteorological information and installing data loggers. The unique topographical features of the location, particularly the rocky terrain, significantly influenced the strategic selection of the best points. Table 1 provides a complete analysis of each specified point, clearly explaining the reasons behind their selection.
A device known as the Testo 480 was utilized to gather meteorological data from the field. It has the ability to measure, save, and analyze all the data pertaining to air conditioning, like airflow, temperature, humidity, pressure, degree of turbulence, heat radiation, CO2, illumination intensity, and PMV/PPD. Testo was founded in the Black Forest, Southern Germany, in 1957. The Testo 480 model, utilized in data collecting for this research, can connect and run many data loggers simultaneously. This enabled us to gather and store the information that was required concurrently. This device was used to measure and record a variety of factors throughout this research, including the temperature, humidity, wind speed, and amount of carbon dioxide present. Additionally, it was used to monitor and record these variables at each sampling point. Figure 6 and Figure 7 show the data loggers used to collect weather data.
In addition, with the help of the Testo 905 data logger, the surface temperature was also measured and recorded manually.
Data for each point were collected hourly. Starting at 8:00 a.m., the device had to stay still at the location for five minutes and record and save the meteorological data of the chosen spot every twenty seconds. Then, it was moved to the next chosen spot. After every hour, the measurement was reset to the initial measurement point. Data collection was completed after 12 h.

2.3. Envi-Met Modeling

To conduct a simulation on this region, ENVI-met version 5.1.1 was utilized. For 15 June and 19 January, the study deliberately focused on a specific winter day identified as the coldest recorded in Shiraz, as documented in the EPW records, and the recognized hottest summer day. This deliberate selection of extreme weather conditions aimed to comprehensively assess the potential impact of green infrastructure and pavement materials on air temperature regulation across contrasting climates. These carefully chosen days serve as pivotal benchmarks, offering significant insights into the efficacy and resilience of green infrastructure and pavement materials throughout the annual cycle. Furthermore, conducting a thorough investigation during these critical periods facilitates the derivation of meaningful conclusions and the projection of performance under comparable circumstances across diverse seasons or years. The simulation started at midnight and continued for the entire day for each season. In addition, the simulation results were limited to 1.70 m, and the domain size was 150 by 100 by 30 with a dz value of 3 and 10 nesting grids. This was done to reduce the likelihood of any numerical issues occurring in the model’s core as a consequence of the model edges. The configuration of the model is presented in Table 2. The ENVI-met simple forcing approach considers both the hourly air temperature and the relative humidity of the surrounding air. Subsequently, the measured parameters, air temperature, and relative humidity were compared with the simulated values. After the present situation was analyzed, each scenario was individualized, modeled in ENVI-met, and then simulated.
Figure 8 illustrates each scenario, which was modeled in the ENVI-met 5.1.1 software. To comprehend and quantify the scenarios formulated for the Fars Science and Technology Park site regarding the temperature, radiation, humidity, wind, and their impact on outdoor thermal comfort, each scenario was simulated using the Envi-met 5.1.1 software. Following an analysis of the current situation, each scenario was implemented and evaluated using the primary model in the Envi-met 5.1.1 software. The scenarios encompassed the following:
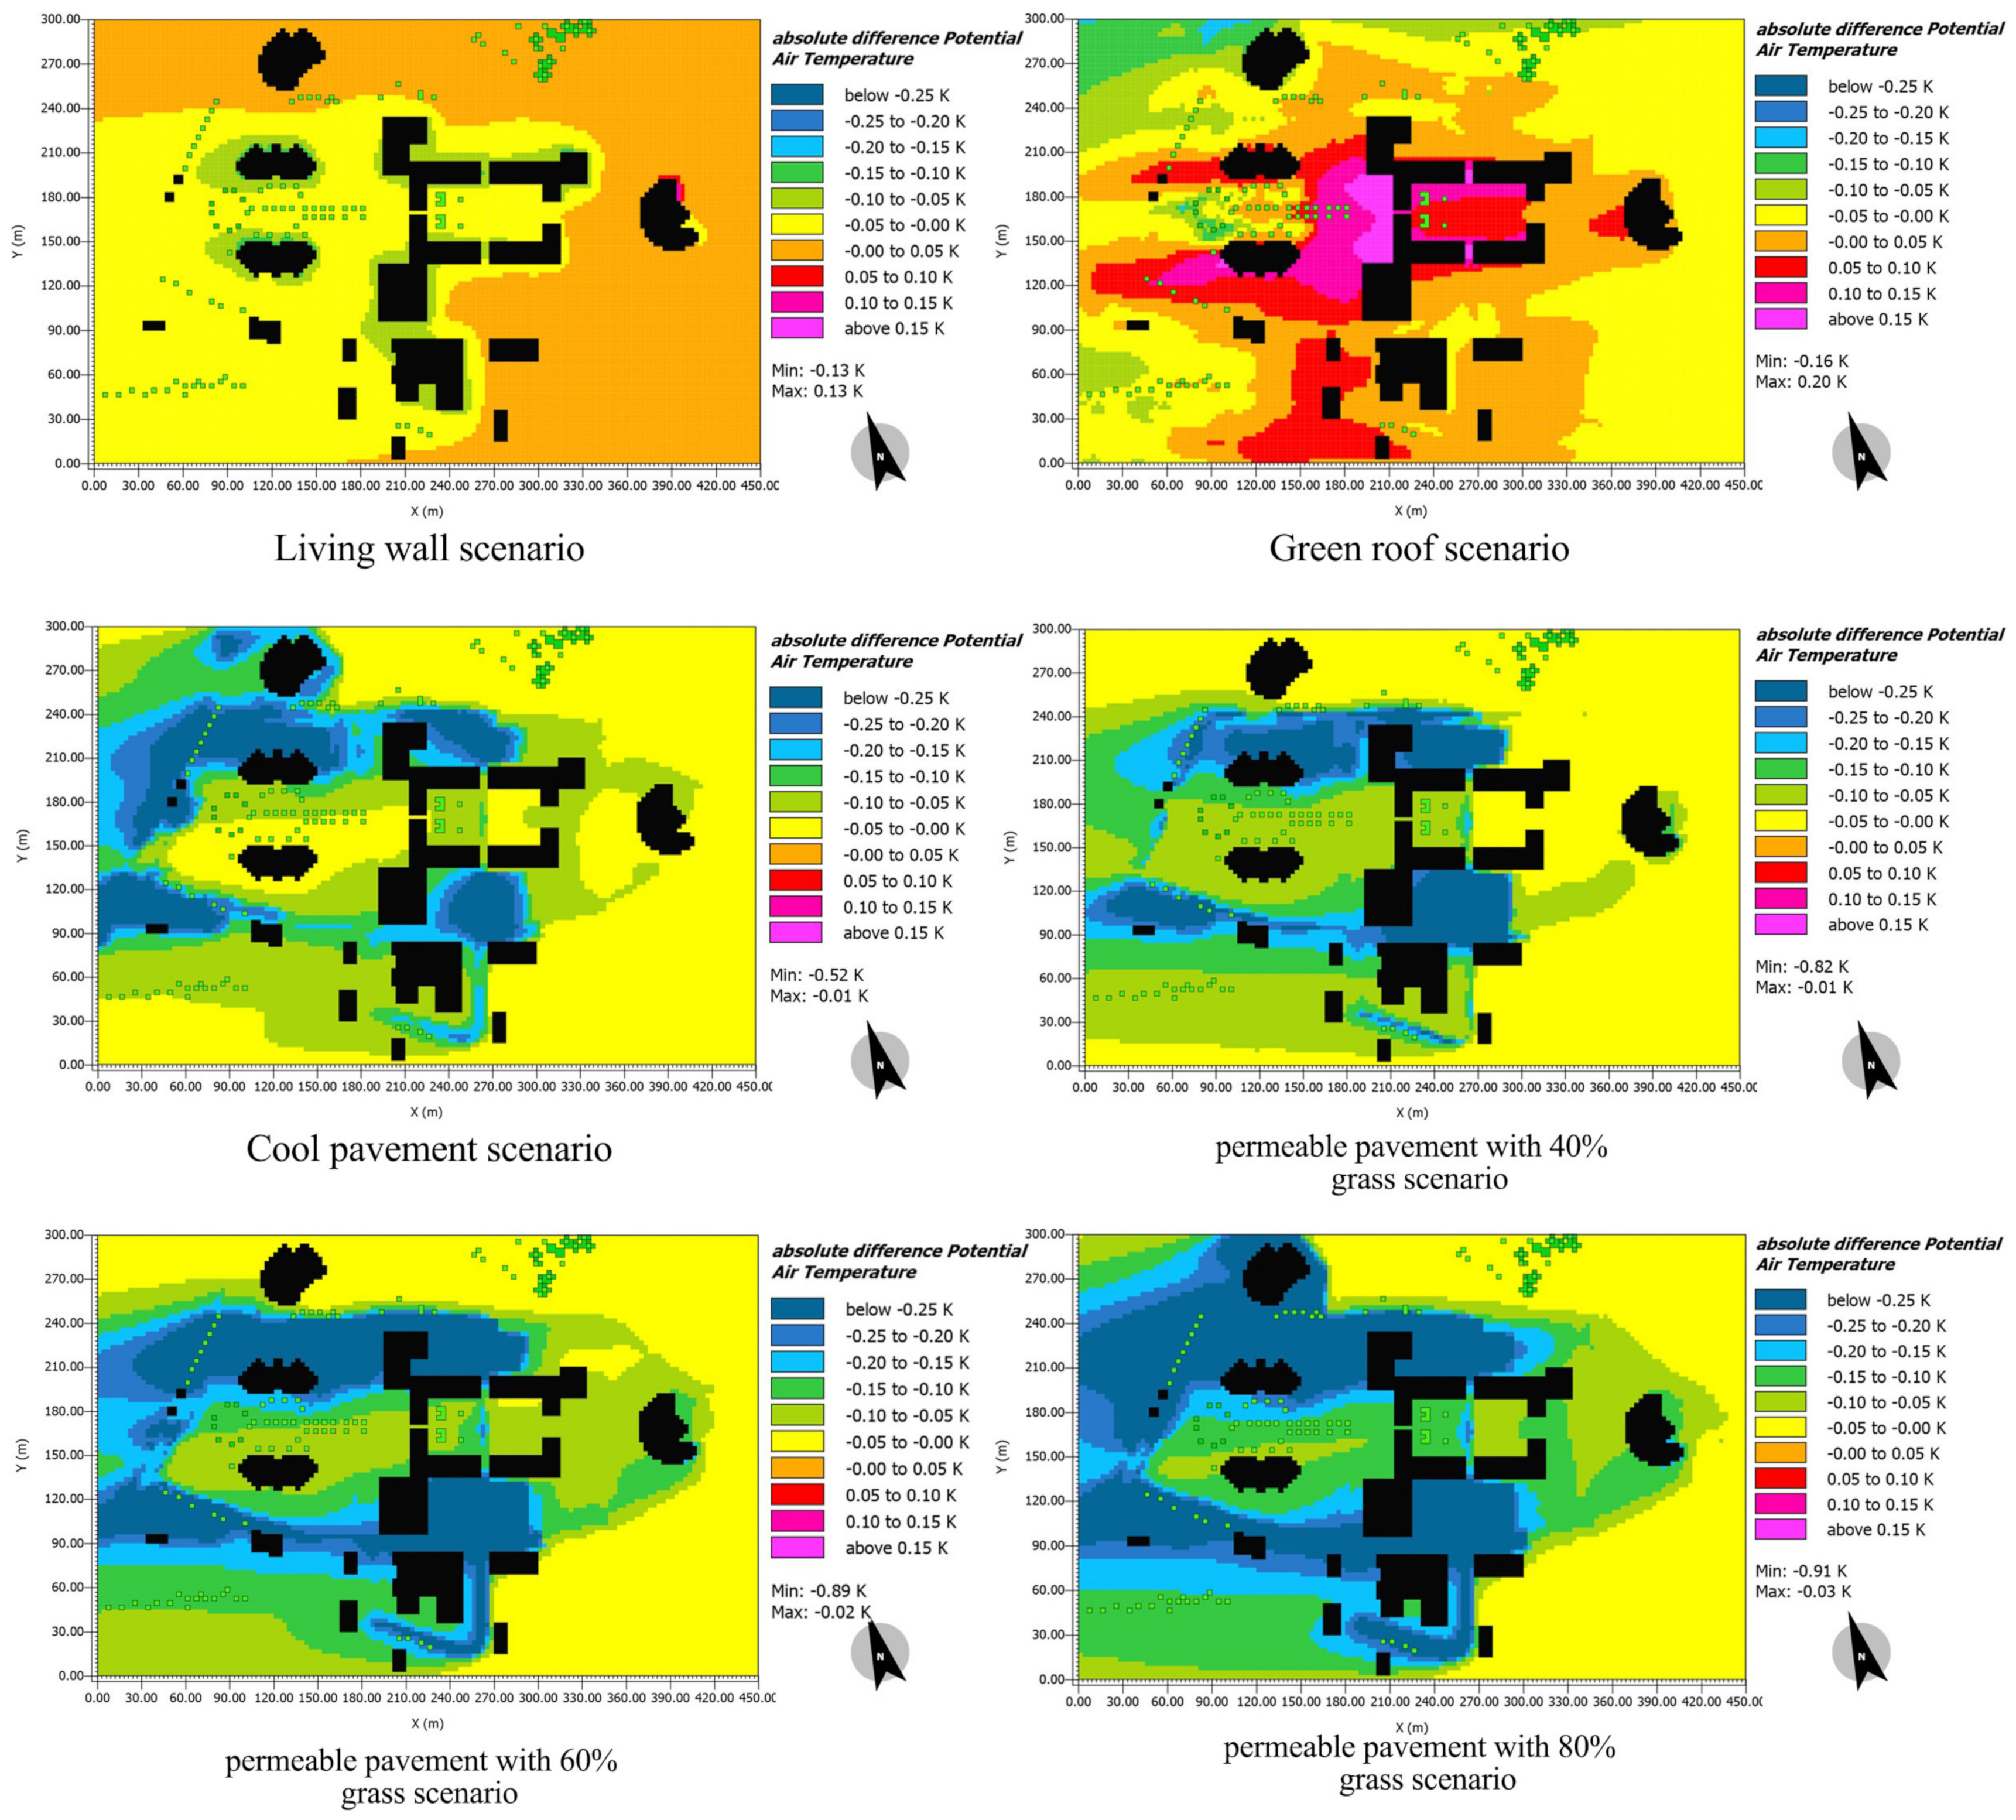
  • The utilization of cool pavement: the implementation of asphalt coloration to enhance the albedo index.
  • The implementation of cool pavement: utilizing permeable pavement instead of current asphalt; 40% of the pavement was permeable, consisting of 30% permeable pavement and 10% grass.
  • The composition of the permeable pavement with 40% pavement and 20% grass, making up a total of 60%.
  • The permeable pavement consisted of 50% pavement and 30% grass, making up a total of 80% of the pavement’s composition.
  • The implementation of green roofs across every building on the premises.
  • The implementation of a living wall across all structures on the premises. Table 3 illustrates each scenario and the rationale for selecting it for analysis.

ENVI-Met 5.1.1 Modeling Validation

Figure 9 and Figure 10 compare the air temperature and relative humidity curves identified via the Envi-met simulation and the measured data. It is evident from the figures that there was a remarkable alignment between the simulated and measured values. Specifically, the relative humidity demonstrated a coefficient of determination (R2) of 0.93, while the air temperature exhibited an R2 of 0.94. These coefficients closely correspond with those reported in previous studies, typically ranging from 0.89 to 0.99, indicating high consistency and reliability in the findings [55]. Additionally, in Figure 9 and Figure 10, the air temperature and relative humidity exhibit RMSEs of 5% and 2.3, respectively. In their review, Tsoka et al. stated that the temperature’s RMSE should be below 4.30 °C, and the relative humidity’s RMSE should be under 10.2% [63,64]. As a result, the model is considered credible and reliable.

2.4. Study Area

Shiraz is a metropolis in Iran and the capital of Fars Province in the country’s south. In 2016, the population of Shiraz was 1,565,572, which totaled 1,869,001, including the population living in the suburbs. Shiraz is located in the central part of Fars Province, 1486 m above sea level, in the mountainous region of Zagros, with a moderate climate. The city is limited to the west by Mount Drak and to the north by the mountains of Bamoo, Sabzpooshan, Chehel Magham, and Babakoohi from the Zagros Mountains. Shiraz Municipality is divided into 11 independent urban districts covering a total area of 240 km2 [65].
This study was conducted at Fars Science and Technology Park, located in Shiraz City, Iran. Shiraz is a city in south Iran known for its rich history, culture, and beautiful gardens. Over the last few decades, the City of Shiraz has undergone significant population growth, driven by factors such as rural-to-urban migration, the construction of industrial estates, and work environments on the city’s outskirts. This growth has resulted in the city’s physical expansion and changes in urban land use, with green spaces being replaced with infrastructure such as buildings, streets, and roads. As a result, urban heat islands have become more pronounced in Shiraz. The selected site is situated in a low-density urban region with sparse vegetation consisting mostly of plantain trees and bare soil devoid of grass. Furthermore, this location is situated in an area with a rugged topography. Figure 11 shows the location of Fars Science and Technology Park.

2.5. DesignBuilder Model

DesignBuilder 7.0.2 is an EnergyPlus-based software tool used to optimize building performance, reduce energy consumption, and improve occupant comfort and environmental sustainability [66]. Many studies conducted by researchers confirmed the accuracy of DesignBuilder. Mustafaraj et al. (2014) simulated a model university building by comparing it with actual measurements taken in the field. Similarly, Sun (2014) performed validation by comparing the simulated and measured outcomes of six university buildings in the United States [67,68].
The ENVI-met modeling process yielded meteorological results for the specified area and each scenario, including air temperature, wind speed, and relative humidity. The EPW files containing these outputs were utilized as input files in the DesignBuilder model v.7.0.2. The EPW files were used to ascertain the simulated weather data for each scenario. Figure 12 shows Simulated model in DesignBuilder. DesignBuilder model v. 7.0.2 was used to replicate the researched building in the location, considering its urban setting, orientation, and building materials. This stage was conducted to compute the cooling energy requirements of the building and assess the indoor thermal comfort in the specified area for both the reference case and alternative scenarios. The model run lasted 24 h, encompassing both the winter and the summer, precisely aligning with the dates of the Envi-met simulations. The software represented trees as component blocks with their physical attributes such as height, trunk height, and crown diameter. For this reason, the physical characteristics of the trees were defined according to the parameters used in ENVI-met. The solar transmissivity of tree canopies was calculated and scheduled based on the specific season. By incorporating these features, DesignBuilder allows for the accurate modeling and analysis of the impact of ground surfaces and trees on a building’s energy performance and environmental characteristics. DesignBuilder utilizes natural ventilation when the indoor air temperature exceeds the outdoor air temperature, which is not typically the case in the summer and the winter; due to the cold, dry weather in Shiraz, the residents seldom open windows, preventing natural ventilation while using air conditioning. Table 4 and Table 5 show the model configuration used in DesignBuilder to analyze the building.

3. Results

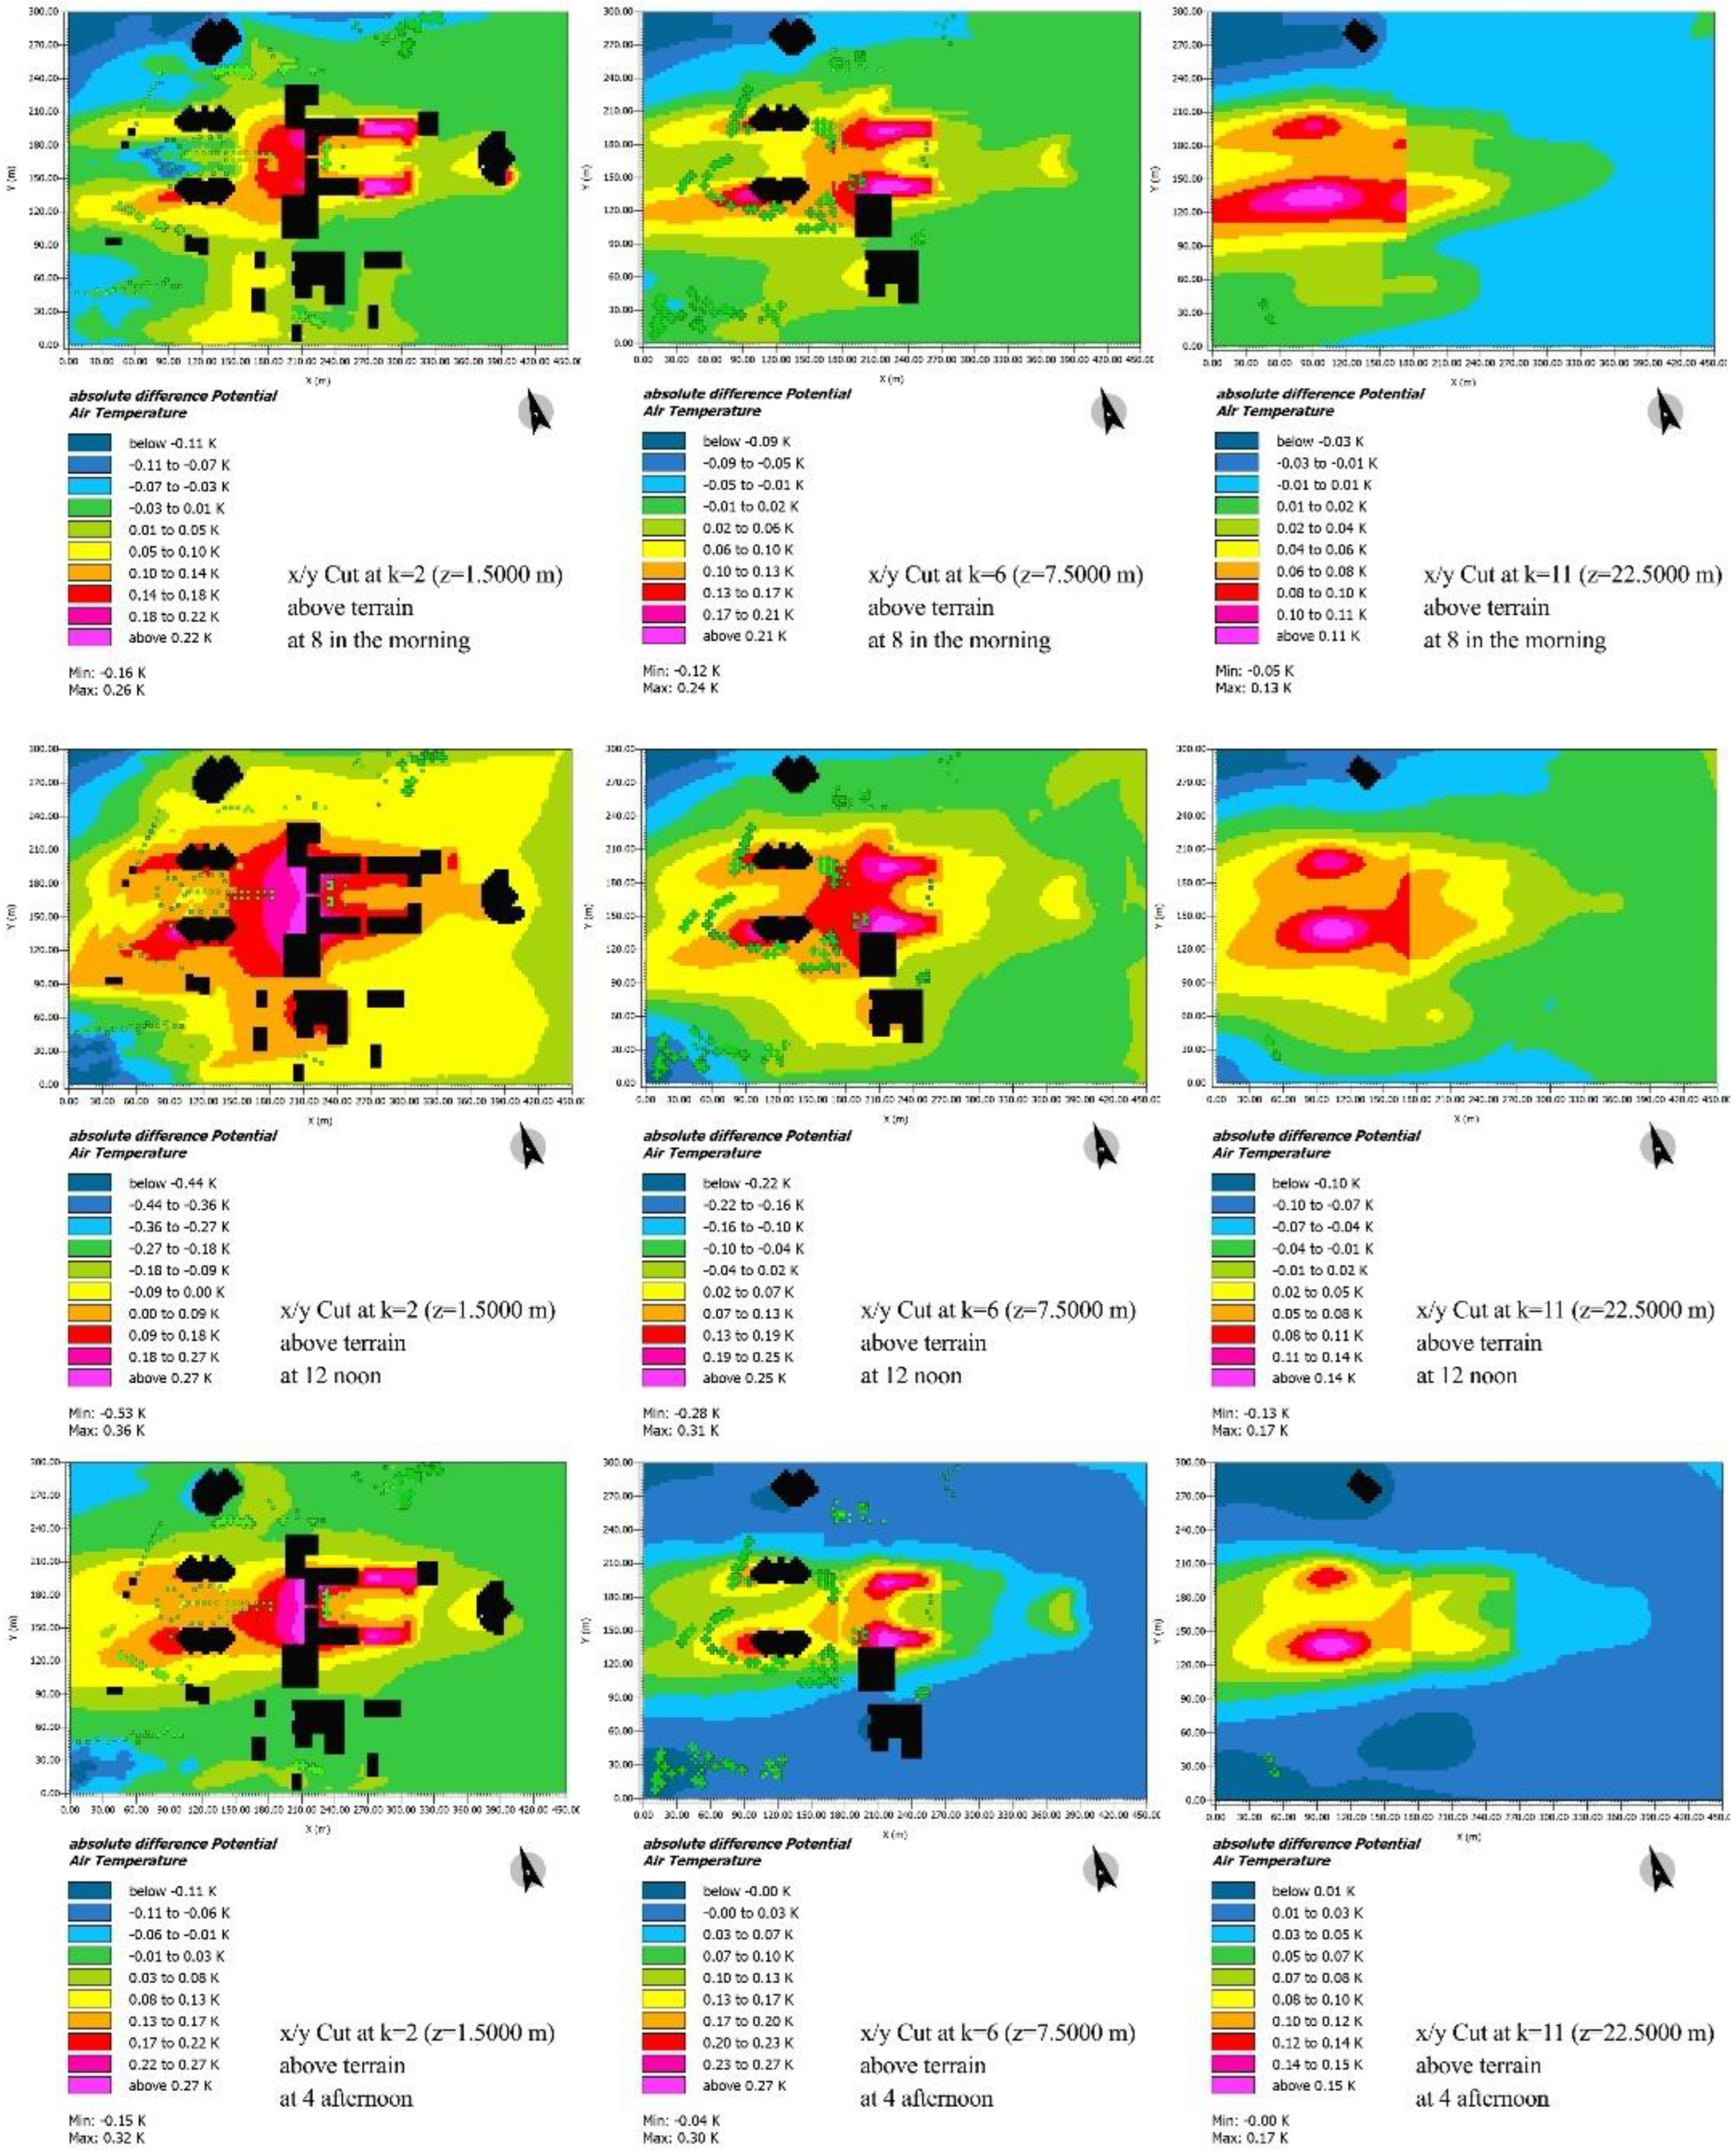
3.1. Summer Analysis Results

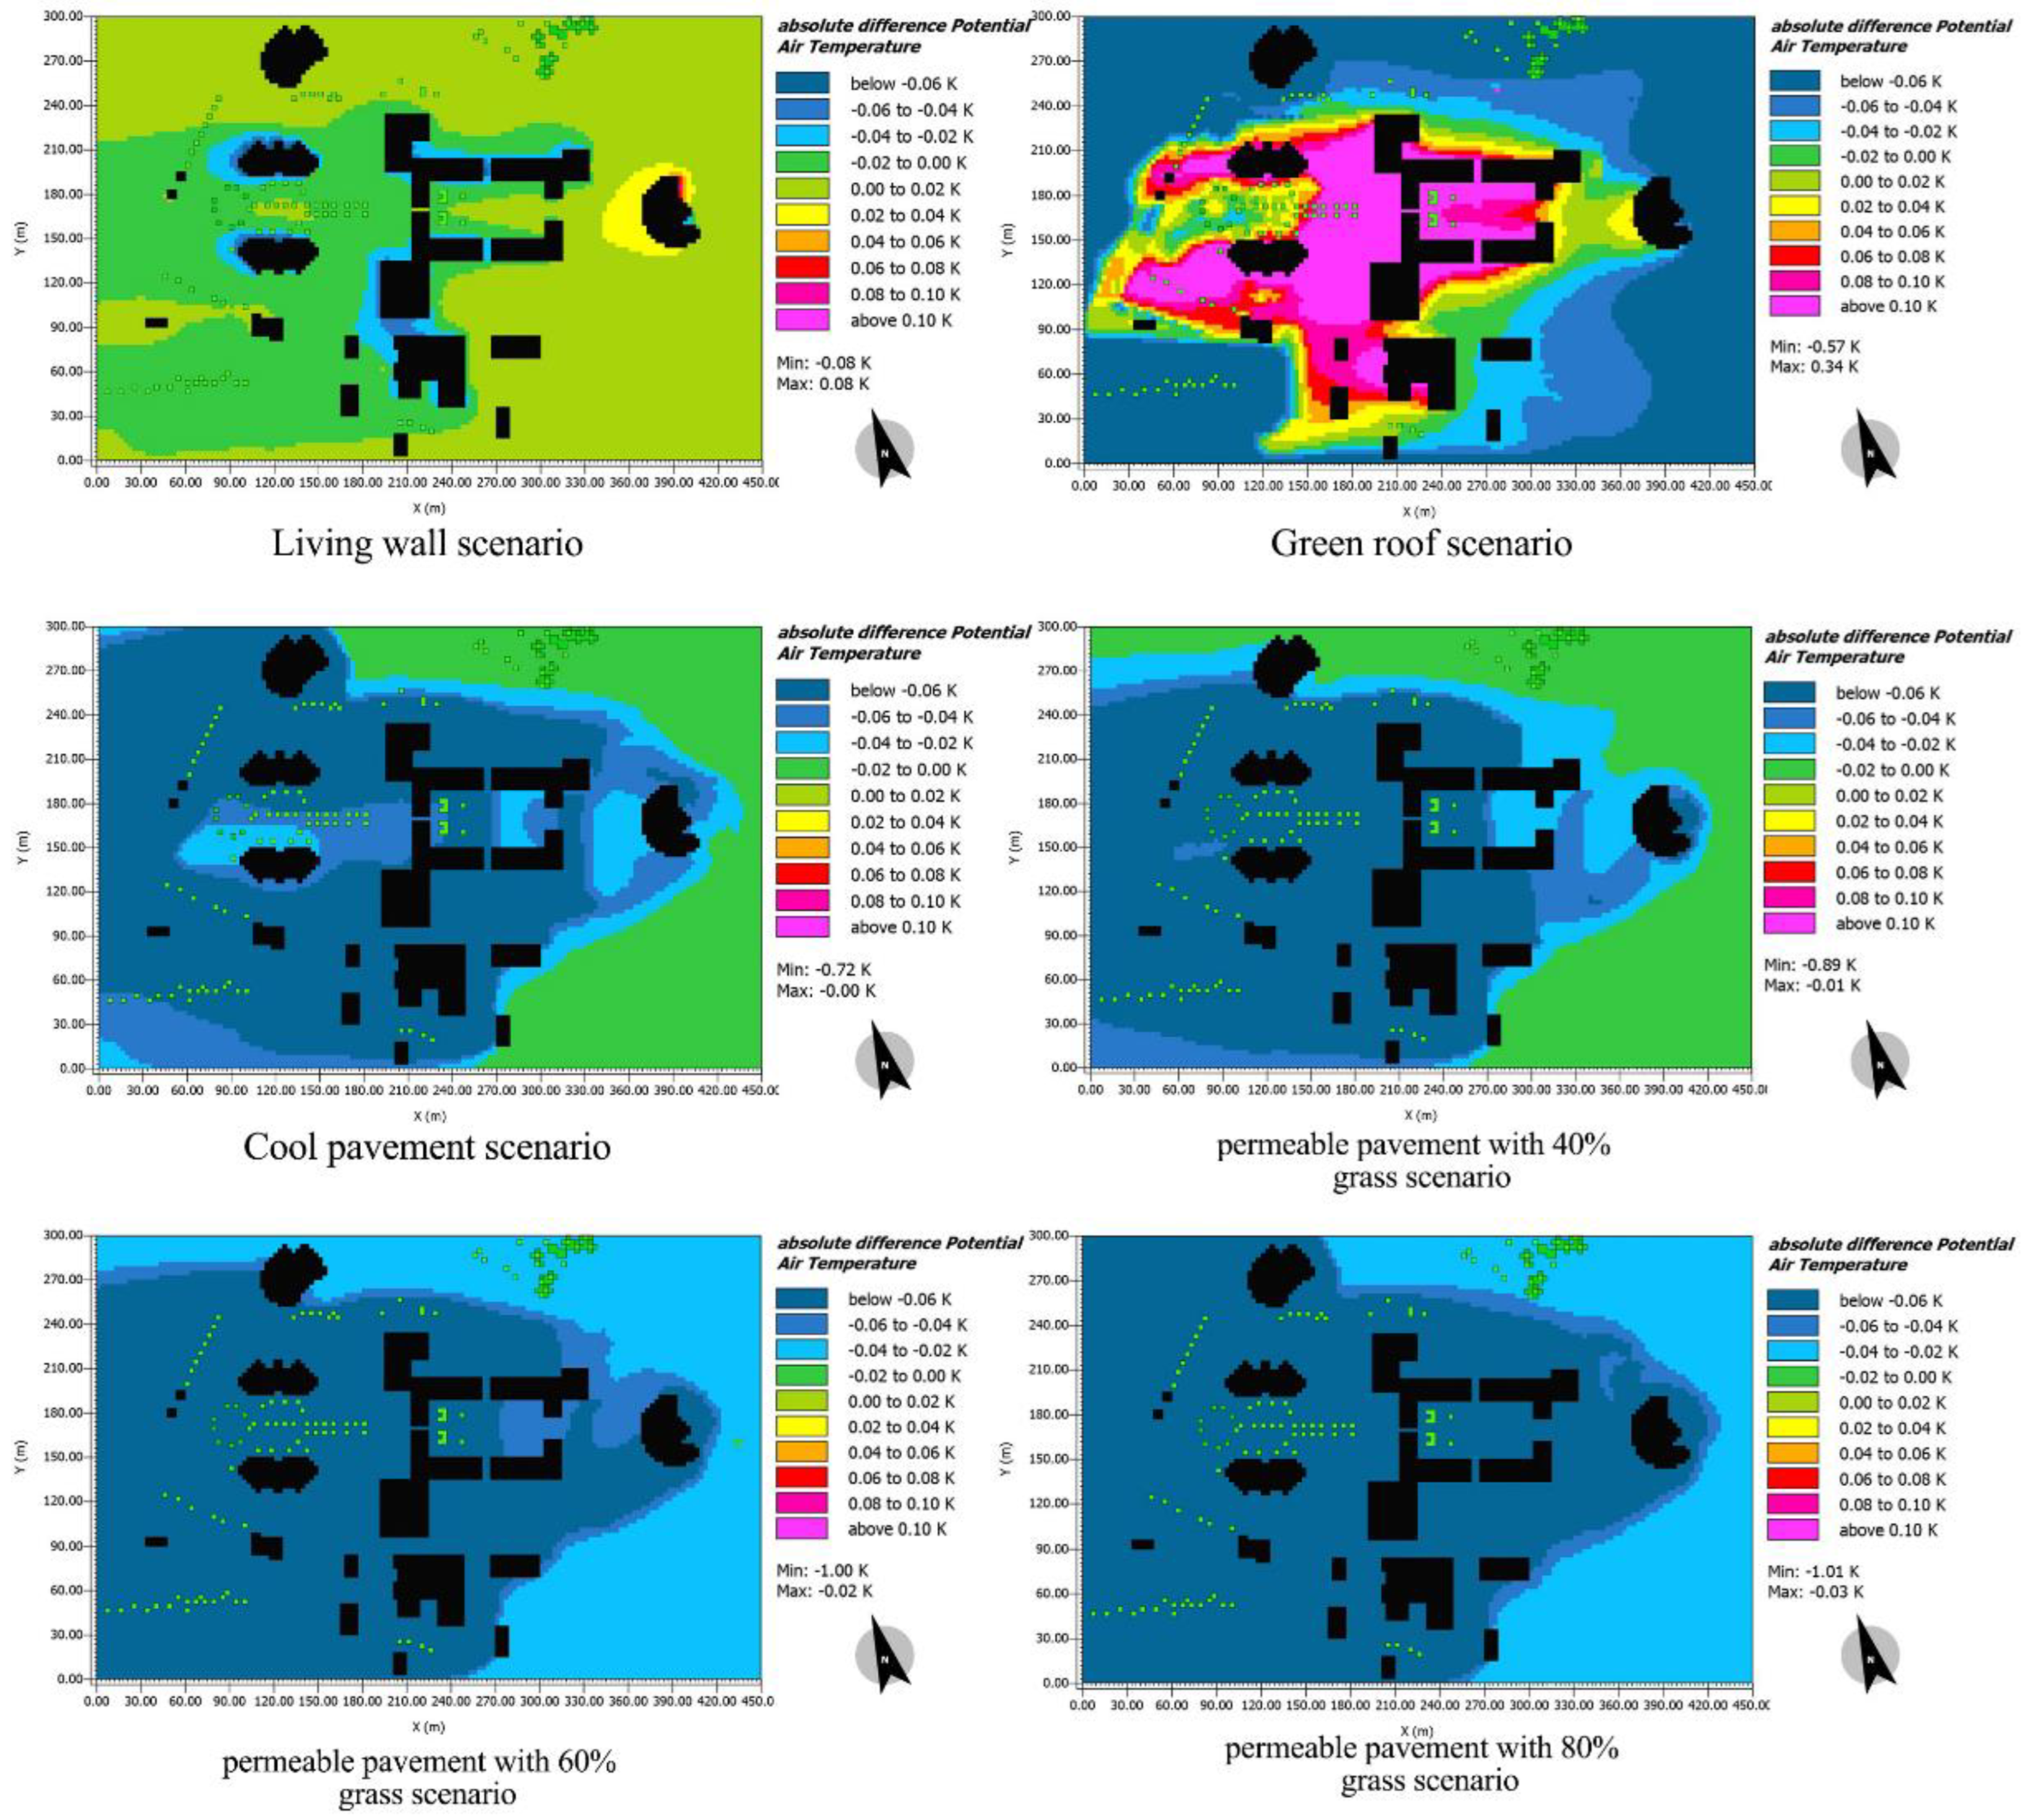
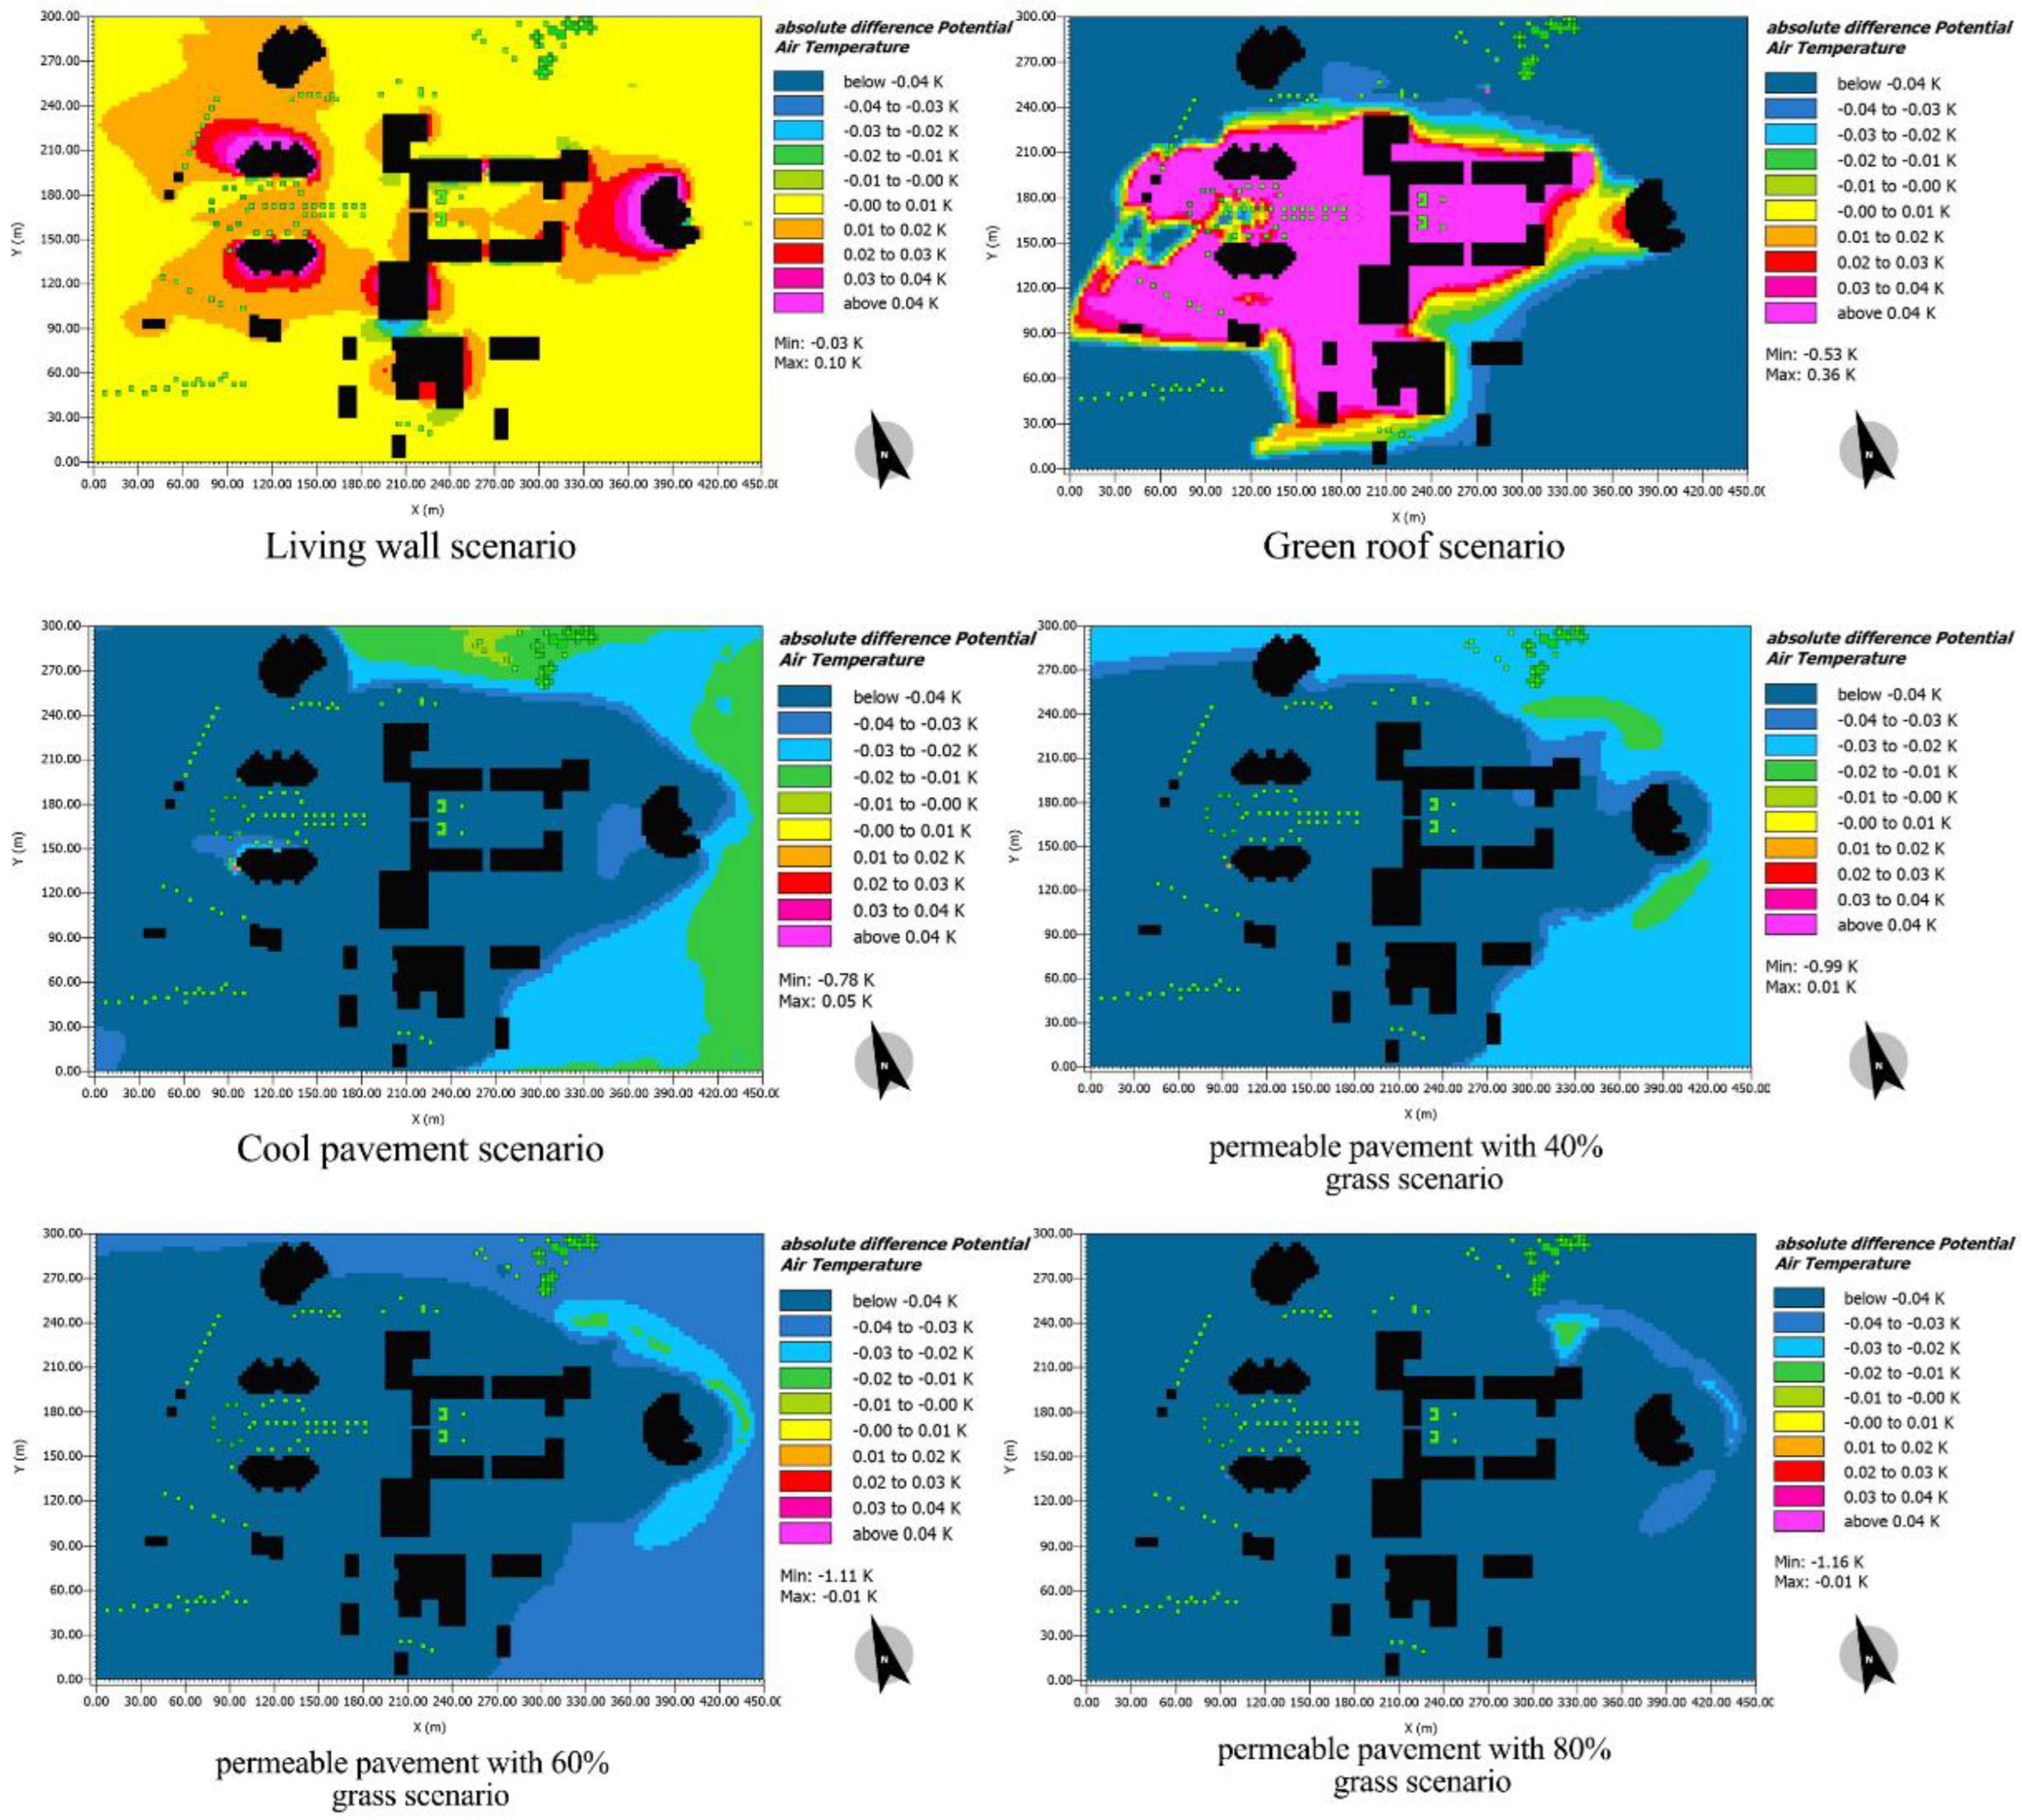
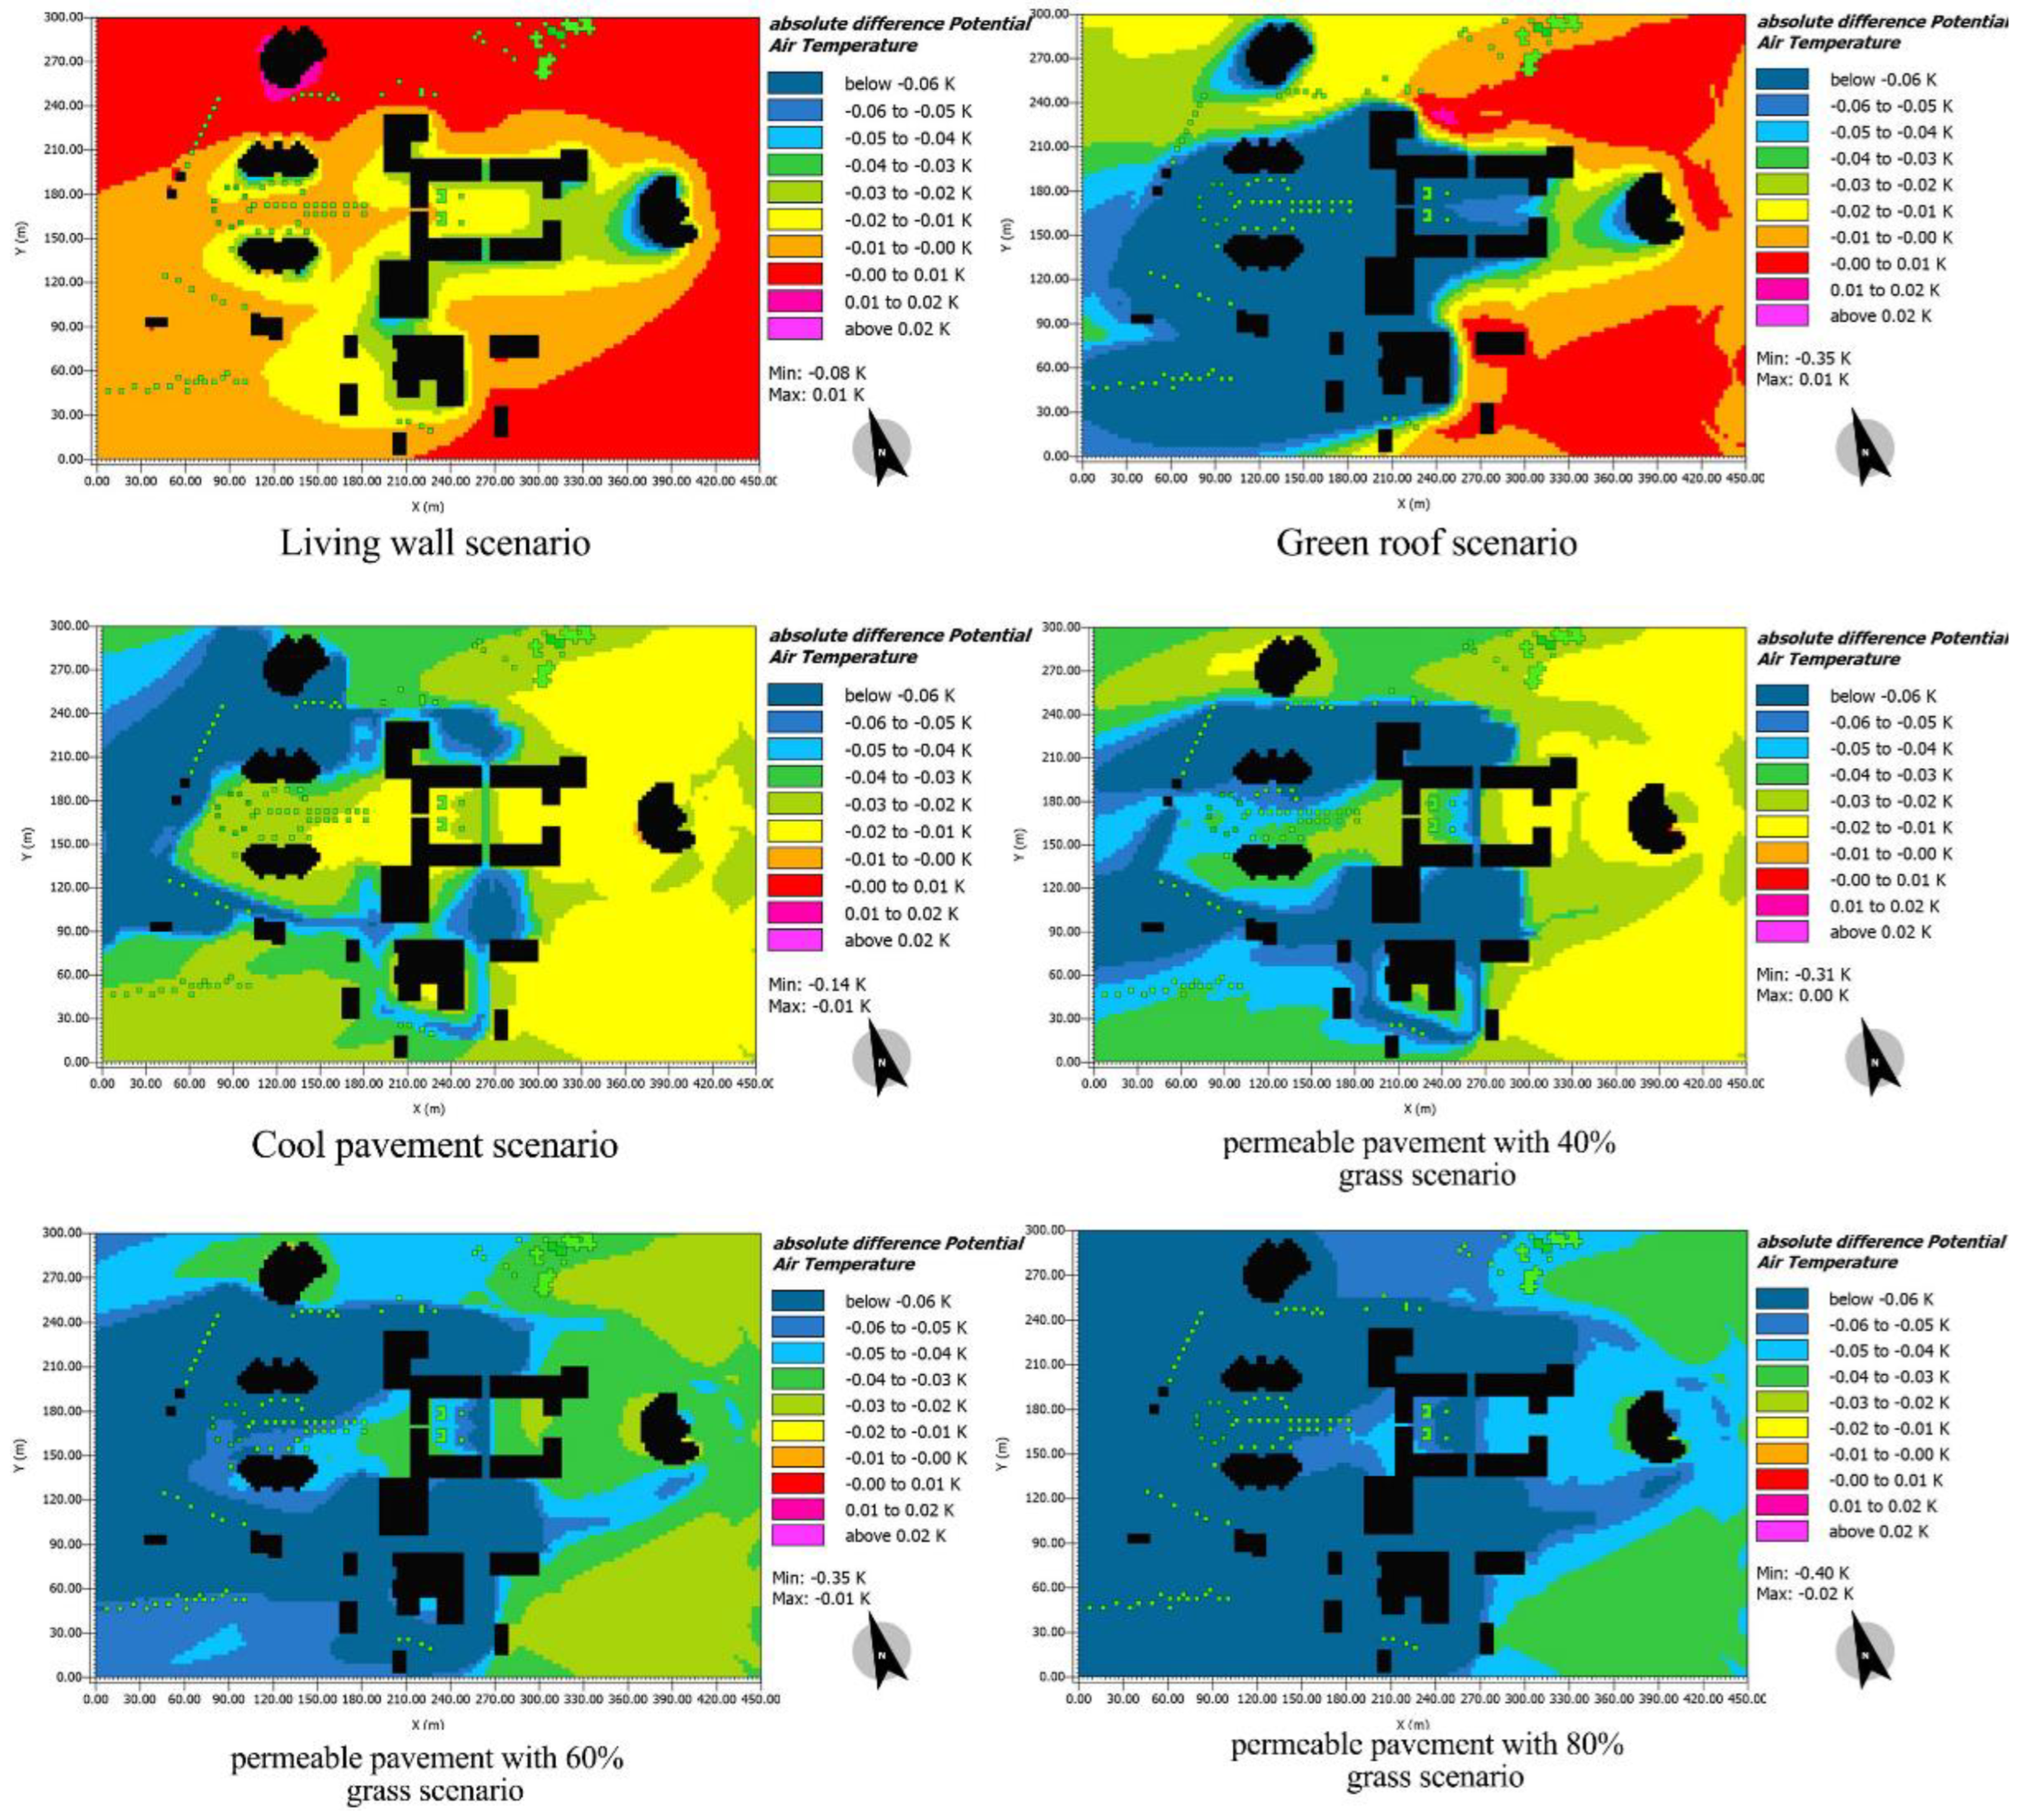
3.1.1. Air Temperature
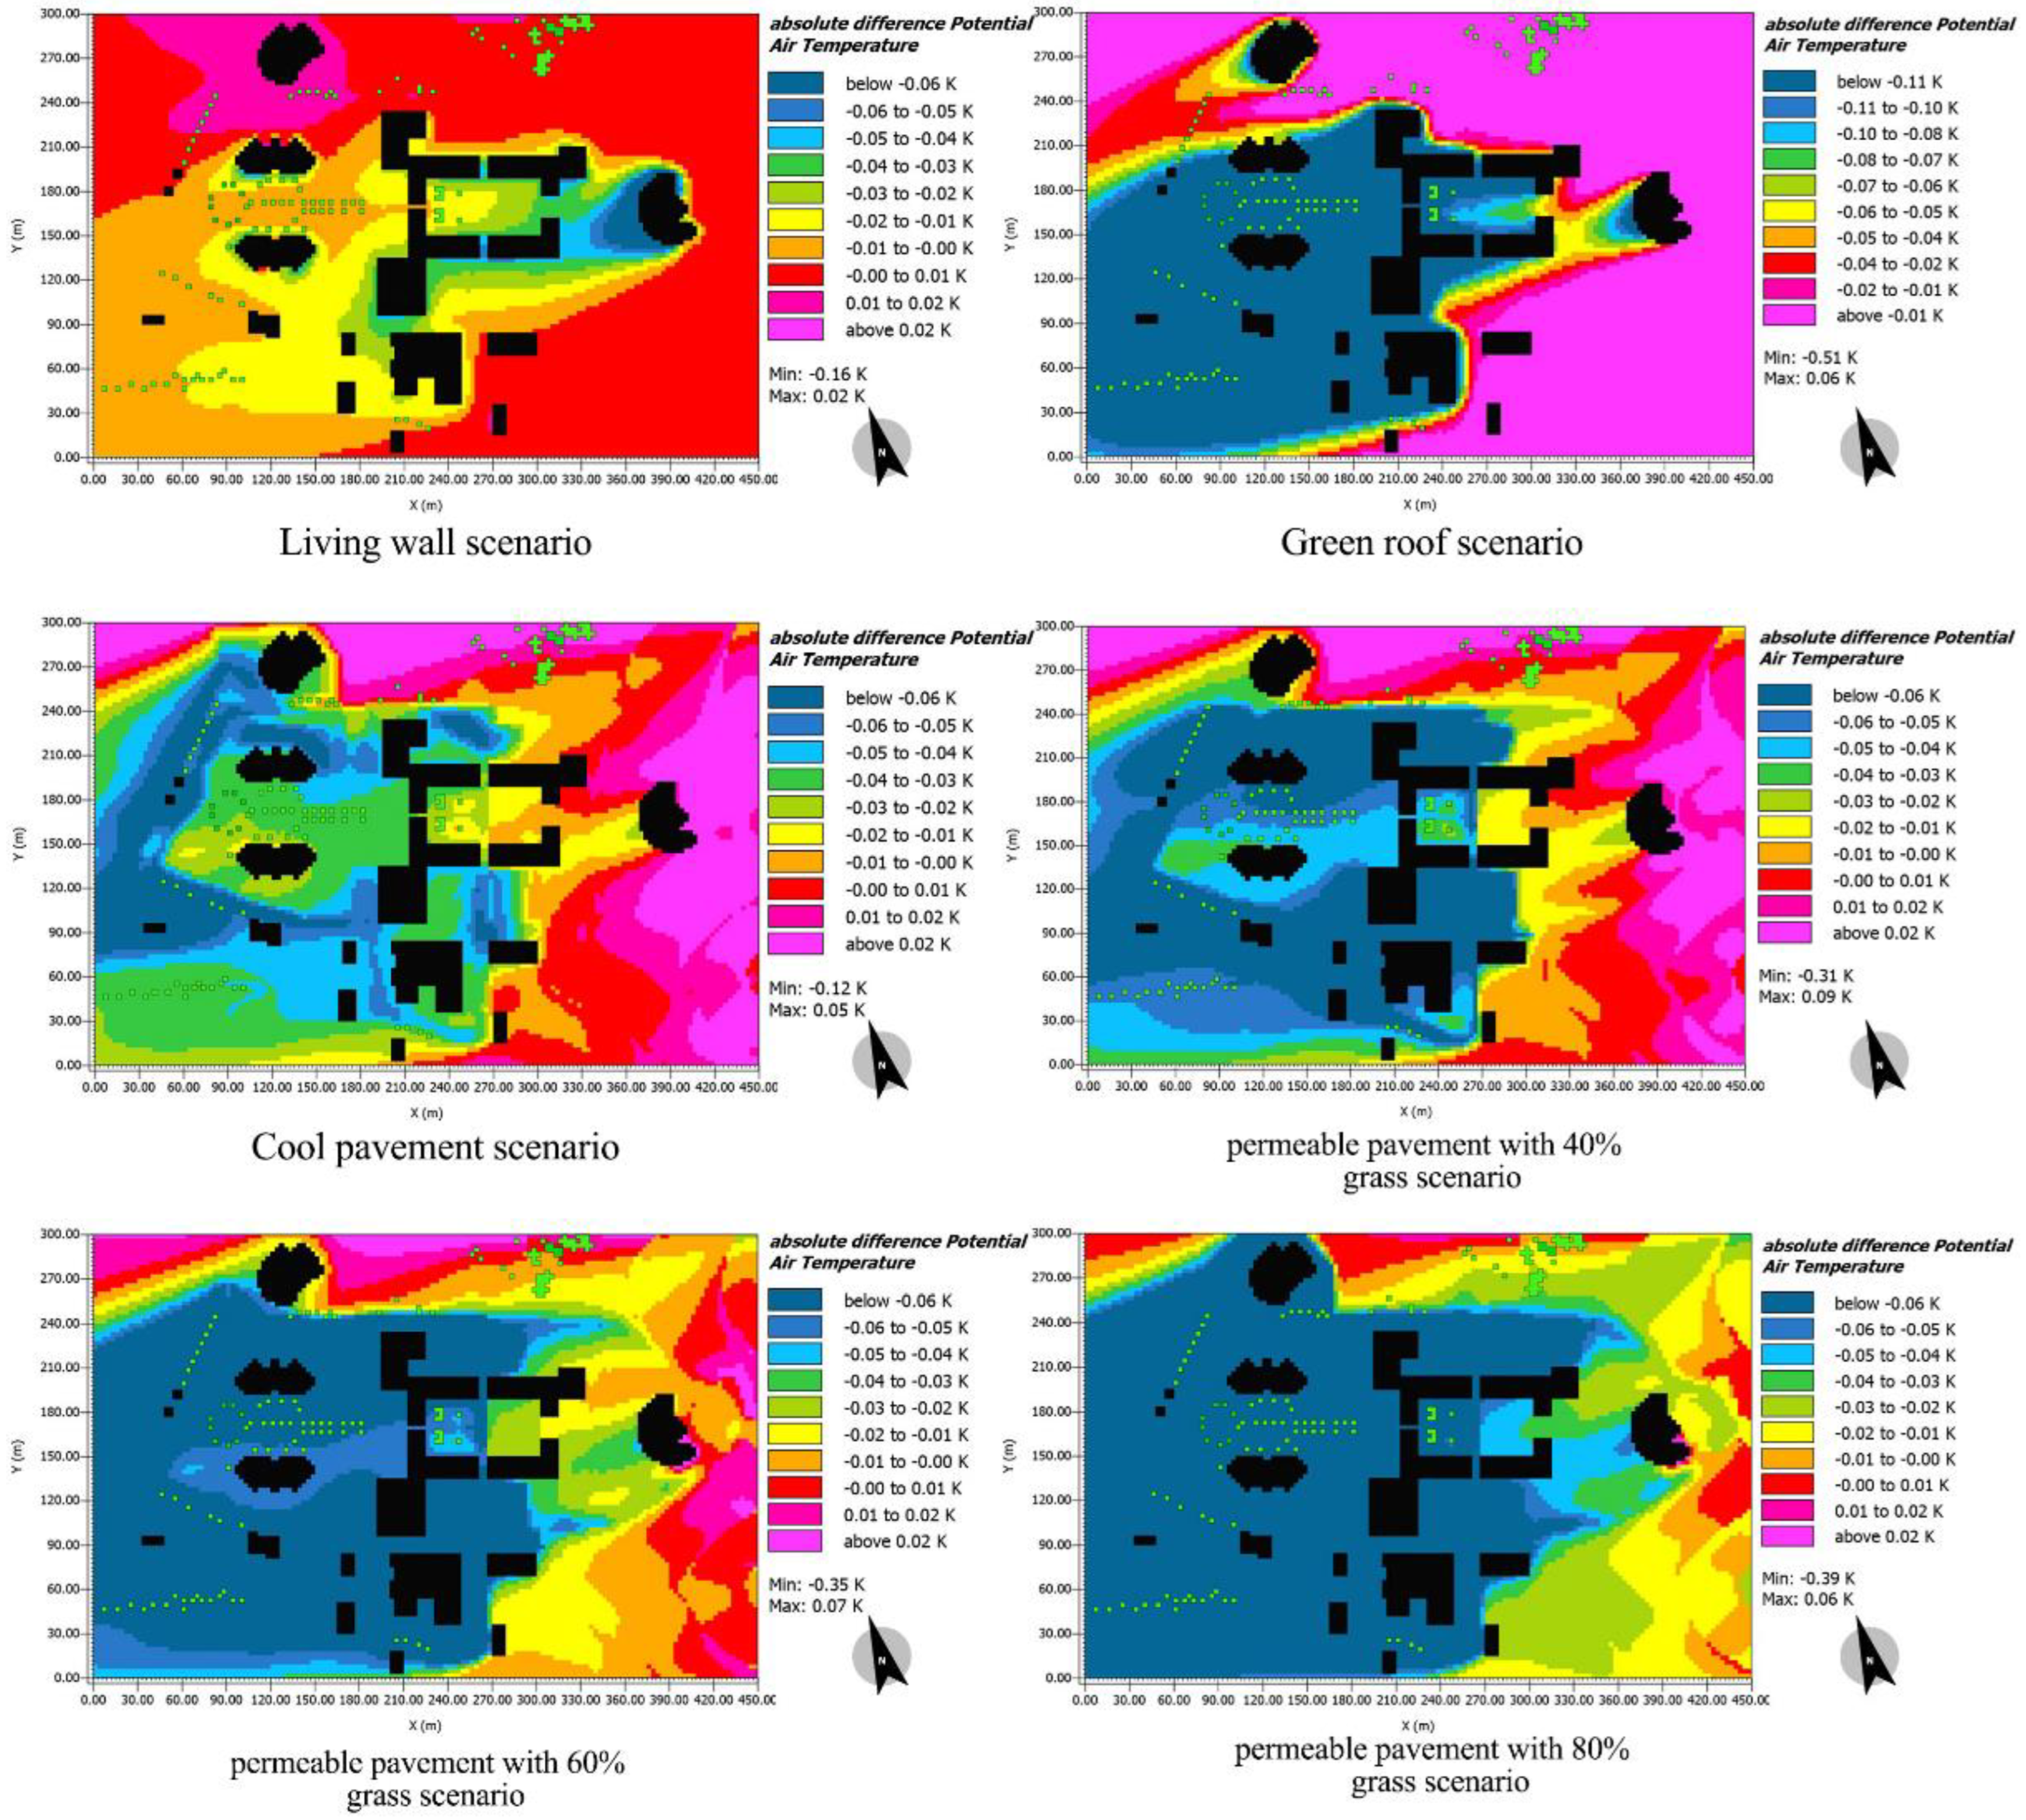
Calculating the average air temperature over the entire area at a height of 0.9 m enabled the determination of the obtained results. The Testo data logger’s height of 0.9 m was chosen as the appropriate height. In addition, this height was measured across the entirety of the site, taking into consideration the topography that was already present. Upon analyzing the heatmaps depicted in Figure 13, Figure 14, Figure 15, Figure 16, Figure 17 and Figure 18, it is evident that, during summer mornings, the permeable pavement scenario (80%) exhibited the most significant reduction in temperature, which was about 1.18c compared to the reference case, while the living wall demonstrated the least amount of change with 0.13c at its highest. In the summer morning (shown in Figure 13 and Figure 14 and Table 6), the permeable pavement scenario (80%) established a decrease in the air temperature compared to the reference model, with mean reductions of 0.91, 1.01, and 1.16 Kelvin at 8, 10, and 12, respectively. When comparing the heatmaps, it is evident that regions with a higher concentration of permeable pavement showed more substantial temperature changes compared to places where permeable pavement was combined with natural grass. Furthermore, when analyzing the heatmaps throughout the summer morning hours (Figure 13 and Figure 14), it was determined that the living wall had a minimal impact on lowering the air temperature across the entire area. (Table 6 and Table 7). The living wall had its most significant impact in reducing the air temperature at a distance of roughly 4 m from the wall. The phenomenon mentioned above was observed until 10 a.m. towards the northern and northeastern sides of the building. Figure 15 shows that, at 12 p.m., when the radiation reached its maximum vertical position, it was observed in the southern direction, mainly where the buildings’ height and distance formed a canyon. The primary impact of the living wall was a reduction of 0.15 Kelvin in the morning air temperature. During sunny summer afternoons, the living wall had a significant influence in the east and a slight effect in the northeast. Figure 19 shows the trend for the absolute difference in the potential air temperature for all the scenarios.
Studying the trend in Figure 19 reveals that, in all scenarios except for the living wall, a decreasing trend was observed until noon in the summer, followed by an increasing trend from noon to night. The maximum temperature reduction was 0.8 Kelvin for the green roof scenario, 0.79 Kelvin for the cool pavement scenario, 1.04 Kelvin for the 40% permeable pavement scenario, 1.17 Kelvin for the 60% permeable pavement scenario, and 1.18 Kelvin for the 80% permeable pavement scenario. The trend of the living wall scenario fluctuated throughout the 24 h of the summer day.
Figure 20 shows the analysis of summer thermal heatmaps of the green roof scenario. Heatmaps show that the surrounding air temperature decreased as one moved away from buildings with intensive green roofs installed.
Furthermore, an analysis of the impact of implementing a green roof at various elevations revealed a progressive enhancement in its influence on the surrounding area as the elevation increased. The presence of green roofs contributed to a reduction in the ambient temperature, as the heatmaps indicate. Initially, this influence was observed to have a detrimental effect near the building, but it transitioned into a beneficial effect as the distance from the building increased.
The findings validated that using permeable pavement (80%) can effectively reduce the outdoor air temperature in the specific location under research.

3.1.2. PET

The physiological equivalent temperature (PET) is a biometeorological metric that quantifies the human perception of temperature conditions in outdoor environments [58,59]. The PET was determined using ENVI-met BioMet, a tool capable of directly calculating PET based on atmospheric data. The PET data were derived by calculating the mean average of the PET for the whole domain at a level of 0.90 m. Table 8 and Table 9 show the difference between the PET of the reference case and the scenarios. The tables reveal that the scenarios, including plants, specifically the living wall and green roof, had detrimental effects on the PET index. The destructive impact of the living wall on the PET value was significant in the morning when the radiation had not reached its maximum and increased by about 0.85 k. In addition, the presence of cool pavement at the analyzed site also had a detrimental effect on the PET index. Specifically, it caused an increase of 0.89 Kelvin in the PET index at 11 a.m., which was the most significant impact seen.
Conversely, implementing the permeable pavements had beneficial effects on the PET index. As the usage of this pavement over the entire site expanded, its positive influence also grew. The peak impact rate occurred at noon, and ∆PETs were around −1.5, −1.73, and −2.06 k for pavements with 40%, 60%, and 80% grass, respectively.

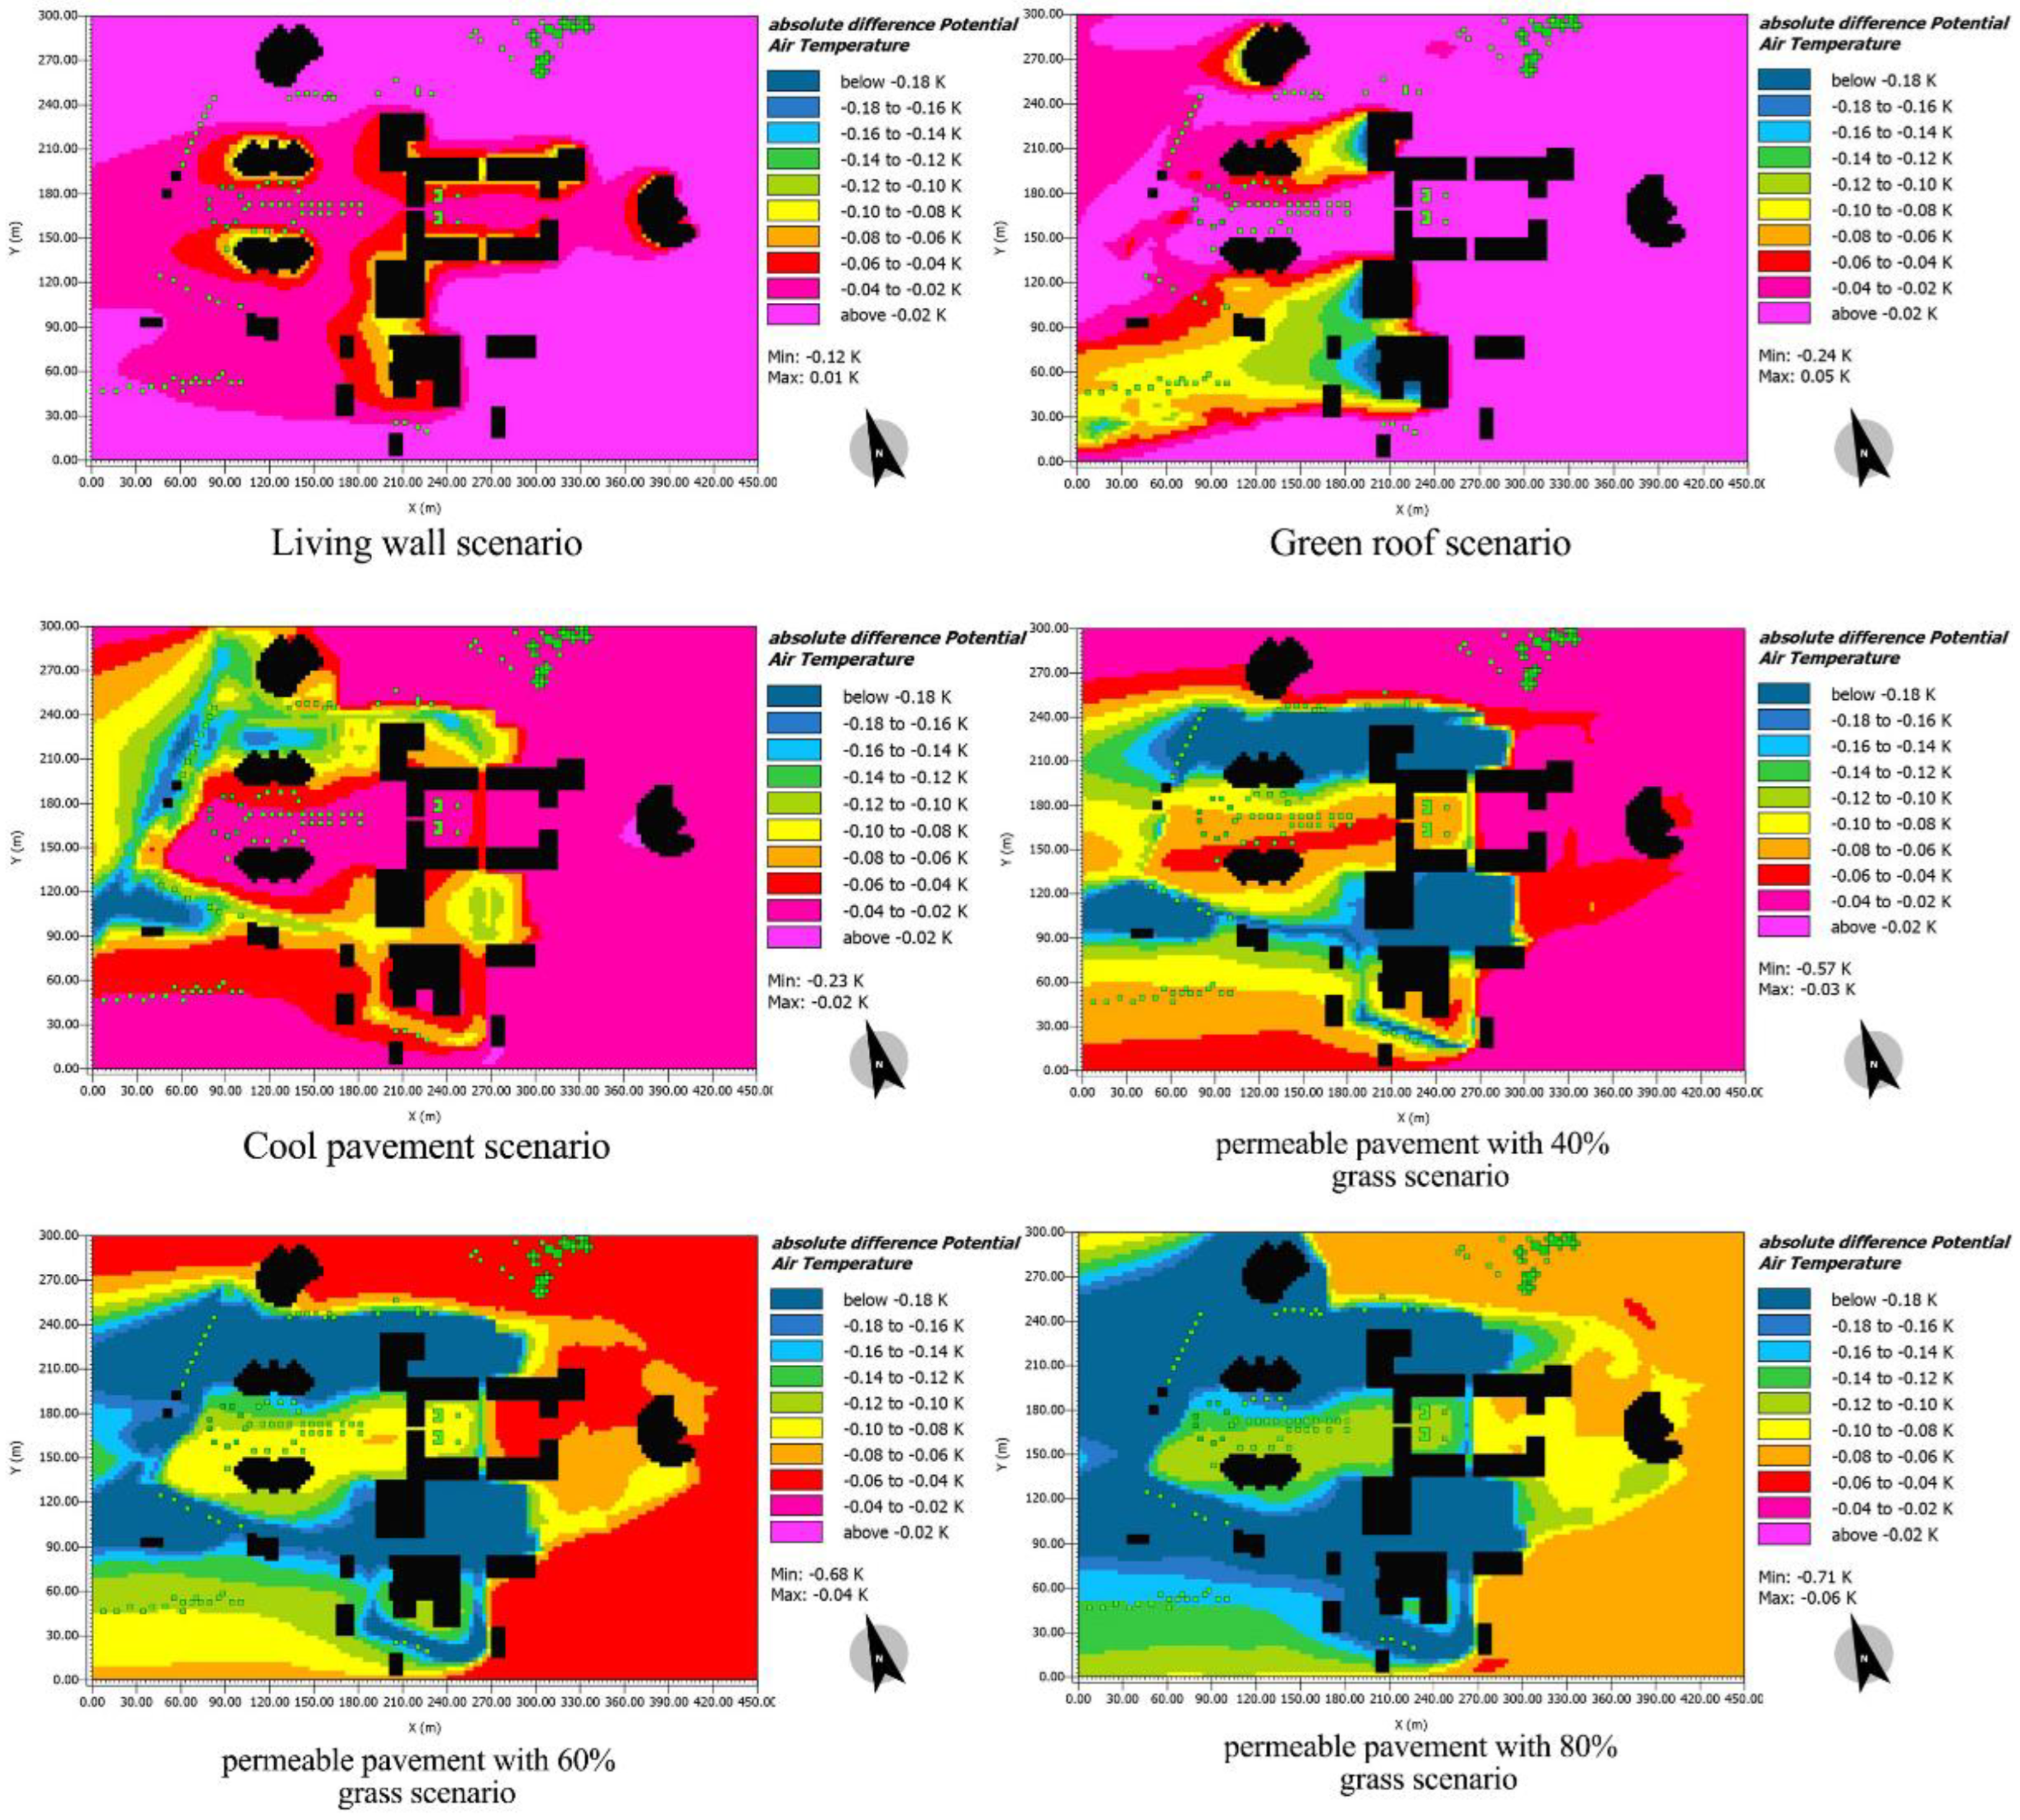
3.2. Winter Analysis Results

Analysis of the winter-season heatmaps (Figure 21, Figure 22, Figure 23, Figure 24, Figure 25 and Figure 26) revealed that green roofs significantly affected the decreasing air temperature compared to the other scenarios. Table 10 indicates that, at 6 a.m., this effect reached its maximum value of 0.71 Kelvin. However, this scenario had the most negligible impact during the day, particularly between 10 a.m. and 3 p.m., compared to the other scenarios. The scenario with permeable pavement (80%) significantly reduced the daytime air temperature, particularly from 10 a.m. to 3 p.m. The temperature ranged from 0.25 Kelvin at 7:00 a.m. to 0.66 Kelvin at 2:00 p.m. in a consistent and predictable pattern. Also, the heatmaps show that the living wall significantly reduced the air temperature near the southern side of the structure during the winter, especially when shade was present. Like the green roof, the living wall had the most substantial effect on reducing the nighttime air temperature. Its impact was reduced during daylight hours.
It was discovered via the examination of heatmaps of the winter season that the effect of the green roof’s effect in lowering the air temperature surpassed the influence of the other alternative scenarios. As Table 10 and Table 11 show, this effect achieved its highest possible value of 0.71 Kelvin at six o’clock in the morning. However, compared to the other scenarios, this one had a negligible impact during the day, specifically between ten o’clock in the morning and three o’clock in the afternoon. The scenario involving permeable pavement (80%) had the most considerable impact on lowering the air temperature during the day, specifically between ten o’clock in the morning and three o’clock in the afternoon. This effect operated continuously and regularly from a minimum of 0.25 Kelvin at seven o’clock in the morning to a maximum of 0.66 Kelvin at two o’clock in the afternoon. At a smaller scale and near the buildings, the living wall had the most significant impact on lowering the air temperature near the southern side of the building during winter, mainly when shading was present, as the heatmaps indicate. The living wall, similar to the green roof, had the most significant impact on lowering the nighttime air temperature. The effect of it was diminished during daylight hours.
The winter pet index tables (Table 12 and Table 13) demonstrate that, similar to the summer, the living wall scenario negatively impacted outdoor thermal comfort. The PET index increased to a maximum of 0.72 Kelvin at noon. Furthermore, the PET index was negatively affected in the scenario with cool pavement, with the most significant increase occurring at noon and measuring 0.88 Kelvin. Compared to the other scenarios, the 80% permeable pavement scenario proved more beneficial during the winter.
Figure 27 shows the trend for the absolute difference in the potential air temperature for all the scenarios in the winter. Examining the winter season’s air temperature revealed that the scenarios incorporating vegetation, such as living walls and green roofs, affected the temperature less. That effect decreased as the winter midday approached. Notably, these scenarios contributed to a significant reduction in the nighttime air temperature. The living wall scenario, for instance, recorded a maximum decrease of 0.23 K between 3 and 5 a.m., while the green roof scenario showed a peak reduction of 0.71 K between 6 a.m. and 7 a.m. In contrast, scenarios associated with pavement demonstrated a more pronounced trend in lowering air temperatures, steadily decreasing until 12 p.m. in the winter, after which an increasing trend was observed.
Analysis of the winter thermal heatmaps concerning the green roof scenario indicated that, in the absence of radiation or during the early hours of the day, the presence of a green roof yielded a beneficial impact around the buildings. However, this effect diminished with an increasing distance from the building. Additionally, upon analyzing the influence of the green roof at different elevations, it was observed that, as one moved away from the average human height and approached the green roof, the effect on the air temperature became positive. Nonetheless, it is essential to highlight that this effect was exceedingly minimal, amounting to a mere 0.02 Kelvin (Figure 28).

3.3. Building Energy Consumption

A building located at the site’s center was selected to evaluate the impact of designed scenarios on the energy usage of the Fars Science and Technology Park building. The DesignBuilder software was utilized to generate a comprehensive model of the building, the verdant courtyard surrounding it, and the adjacent building. The techniques and measurements outlined in the methodology section were applied to the building using the DesignBuilder software. The outcomes are presented in Table 14 and Table 15. For the evaluation, a comparison was made between the base model and two different vegetation scenarios, specifically the green wall and the green roof. Additionally, the scenario of permeable pavement (80%) was chosen from the scenarios associated with the pavements, and it was evaluated with the help of the DesignBuilder software. The selection of the scenarios related to vegetation was based on the idea that vegetation functions as insulation on the structure of the building even though it has a negative impact on the PET index. In addition, according to the simulations conducted via Envi-met, permeable pavement (80%) had the most significant beneficial influence on the PET index compared to the other pavement scenarios.
In light of the findings from the diverse scenarios investigated in Table 14, the efficacy of the interventions in mitigating building energy demands and environmental impact became apparent. The living wall scenario, characterized by a vegetated facade, emerged as the most influential intervention, displaying an 11.2% reduction in cooling consumption, an 8.5% decrease in CO2 emissions, and an 8.6% decline in electricity consumption relative to the reference case. This underscores its potential as a highly impactful strategy for fostering environmental sustainability.
Conversely, the green roof scenario, encompassing vegetation on the building roof, demonstrated a more modest impact, with a 3.7% reduction in cooling consumption, a 3.1% decrease in CO2 emissions, and a 3.2% decline in electricity consumption compared to the reference case. While ranking as the least effective among the interventions, it still surpassed the reference case regarding environmental benefits.
The permeable pavement scenario, substituting conventional pavement with grass, established itself as the second most effective intervention. This approach yielded a 5.3% reduction in cooling consumption, a 4.1% decrease in CO2 emissions, and a 4.1% decline in electricity consumption compared to the reference case. Although less impactful than the living wall, the permeable pavement scenario is a viable strategy for mitigating environmental impacts.
In light of these realizations, it seems that a strategic integration of interventions could be considered promising. It is possible that the most beneficial results might be achieved by combining the advantages of a living wall with those of permeable surfaces. It is possible that the living wall’s potential to cut down on cooling use and CO2 emissions, together with the permeable pavement’s contribution to overall environmental sustainability, could produce a synergistic impact. An integration of this kind might lead to an optimum solution that improves energy efficiency while simultaneously minimizing environmental effects. This would be a productive path for further investigation in the field of sustainable architectural techniques.
As can be seen in Table 15, the living wall intervention was the most successful technique during the winter. It resulted in a spectacular reduction of 53.4% in electricity consumption, 14.7% in CO2 emissions, and 25% in heating usage. The green roof scenario came in at a close second, with a reduction in heating use of 23.3%, a decrease in CO2 emissions of 12%, and a significant reduction in energy usage of 54.8% compared to the reference case. This solution demonstrated a great influence on the environment, as well as a substantial reduction in electricity use.

4. Discussion

Shiraz, with its semi-arid climate and varying seasonal temperatures, presents an intriguing backdrop for investigating the impact of landscape features on air temperature and building energy consumption. In this study, a critical examination of different landscape scenarios aimed to enhance thermal comfort and analyze energy demand within the Fars Science and Technology Park in Shiraz. The need for more comprehensive research in this context necessitated an exploration of the implications of interventions, such as vegetation and pavements, on air temperature and energy consumption.
The methodology framework of this study was centered on investigating the influence of urban greenery and pavement materials on reducing energy demand and improving indoor thermal comfort within an office building in Shiraz, Iran. The prominent Fars Science and Technology Park office site in Shiraz City was selected as the primary research location to achieve this objective. The study leveraged the ENVI-met 5.1.1 software to model and simulate the chosen area, aiming to accurately replicate its current environmental conditions.
Drawing from insights obtained through a comprehensive literature review, six distinct scenarios were meticulously designed and applied to the model. These scenarios served as experimental conditions, allowing for an examination of their respective effects on microclimatic conditions. Specifically, outdoor temperature and humidity were compared between the reference case and the applied scenarios to ascertain the impact of different interventions.
Furthermore, the study employed the physiological equivalent temperature (PET) index to evaluate outdoor thermal comfort across various scenarios. By utilizing this index, researchers could gauge the effectiveness of each scenario in enhancing outdoor conditions, thus contributing to a comprehensive understanding of the implications of urban greenery and pavement materials.
The outputs generated via the ENVI-met software, encompassing air temperature, relative humidity, and wind speed data, were then utilized as inputs for the subsequent analysis conducted through the DesignBuilder model. This phase assessed each scenario’s energy savings and indoor thermal comfort by analyzing air temperature and humidity fluctuations.
In terms of using cool pavements to reduce the air temperature, the findings of this study corroborate prior research, indicating that the implementation of pavements with higher albedos, such as permeable pavements and cool pavements, significantly lowers the air temperature [28,37,39,69]. A study conducted by Aboelata (2021) found that implementing cool pavement in a low-density urban area can decrease the air temperature by up to 0.6 kelvin in the summer [54]. This study supports those findings by showing that cool pavement could reduce air temperature in a low-density urban area by up to 0.79 kelvin in summer and 0.45 kelvin in winter. (As shown in Table 6, Table 7, Table 10 and Table 11). However, as many previous studies have shown, raising the albedo uniformly throughout the urban area might lead to significant overheating issues [70,71]. Yang, Wang, and Kaloush and Qin stated that substantial quantities of reflected radiation can be absorbed by nearby surfaces, leading to elevated street temperatures. Changing the ground albedo can either warm or cool a nearby object, based on the item’s albedo [71,72]. As depicted in Table 8, Table 9, Table 12 and Table 13, the PET index increased due to using cool pavement, which illustrates that it has a detrimental effect on outdoor thermal comfort.
Notably, permeable pavements, particularly those incorporating grass or vegetation, exhibited a more pronounced impact on reducing air temperature compared to cool pavements (Table 6, Table 7, Table 10 and Table 11). This effect is attributed to the permeation and retention of water within the pavement structure, facilitating heat dissipation through evaporation and providing shade, aligning with established principles in the literature [44,50]. Also, the results of this study showed that the permeable pavement scenario had a beneficial effect on building energy consumption, which differed from the results of previous studies [73]. The results of this study showed that combining grass with permeable pavement had the most significant effect on the air temperature, reducing the air temperature by means of 1.04, 1.17, and 1.18 K for pavements with 40%, 60%, and 80% permeable material in the summer and 0.41, 0.50, and 0.66 K for pavements with 40%, 60%, and 80% permeable material in the winter. Furthermore, the permeable pavement resulted in a 4.1% reduction in electricity usage. This finding aligns with earlier research that has demonstrated an 8.9% decrease in electricity consumption for providing clean water throughout the operational phase [74]. The discrepancy in the results may stem from the complete application of permeable pavement throughout the site in the mentioned study. In contrast, the current research only allowed a maximum of 80% asphalt (50% permeable pavement with 30% grass) as permeable flooring over the entire site. It is pertinent to highlight that the tested pavement scenarios were implemented on existing asphalt with an albedo of 0.12. At the same time, the model analysis employed cool pavements and permeable pavements with an albedo coefficient of 0.4. Distinctly, using grass with an albedo coefficient of 0.5 in the permeable pavements model underscored the potential outcome variability. Nevertheless, certain studies have suggested that cool and reflecting pavements with higher albedo coefficients may yield superior outcomes compared to permeable pavements [22].
The results also show that the impact of green roofs and living walls on lowering the air temperature was influenced by building height and the distance from a building. Figure 20 and Figure 28 show ENVI-met thermal maps of the air temperature for the difference between the air temperature of the reference case and the green roof scenarios in the summer and the winter, respectively. As the maps illustrate, green roofs achieved the most significant air temperature reduction when used on low-rise buildings at the site’s center. These results are consistent with those of prior research [55,75]. In this specific case, it can be inferred that the first hypothesis outlined in this study held true, particularly when evaluating the influence of the green roof on thermal comfort and taking into account the height of the building. Furthermore, this study validates green roofs as an effective mitigation method for workplace buildings in hot and arid climates like the climate of Shiraz City, where there may be limited room for planting large trees with shade, and open outdoor areas not readily available. This substantial decrease in the air temperature can lead to a 3.7% reduction in buildings’ cooling energy during the summer and a considerable 23.3% reduction in building heating energy during the winter. The savings validate the effectiveness of green roofs in Shiraz City. Green roofs are viewed as a cutting-edge solution to reduce costs for these areas. The roofs could be utilized for planting productive plants to generate cash for office managers and decrease their electricity expenses. Intensive green roofs provide the most significant decrease in air temperature, reduce buildings’ cooling energy consumption, and enhance the PET index [55].
According to the findings of the study conducted by Ramadhan and Mahmoud (2023), the indirect green facade with planter boxes of green walls reduced high energy consumption compared to buildings with direct and indirect green facades, increased thermal comfort, and reduced CO2 emissions [76]. The estimation in this study revealed that the energy demand of a building with a living wall was lower than that of a building without a living wall, resulting in 11.2% cooling energy savings on a summer day and 25% heating energy savings on a winter day.
The investigation also delved into the impact of pavement and plant scenarios, such as living walls and green roofs, on outdoor thermal comfort. Remarkably, permeable pavement, specifically with a proportion of grass, emerged as the most influential factor in positively affecting the PET outdoor thermal comfort index. The model further revealed that the optimal location for a living wall, despite diminishing temperature reduction effects with an increasing distance, holds significant promise in minimizing building energy consumption.
Using the information obtained from the heatmaps and tables to address the research hypotheses is possible. These hypotheses suggest that a living wall and a green roof, when employed as part of landscape design, can significantly reduce energy consumption. This is due to the fact that these elements offer insulating layers on the outside walls of the structure. Regarding the efficiency of these types of green infrastructure in controlling outdoor thermal comfort, it is vital to take into consideration that the effectiveness of these green infrastructures is influenced by aspects such as the cultivated area, the plant species, and their closeness to the building, as was investigated in this research.
In addition, according to Table 8, Table 9, Table 12 and Table 13, permeable pavement considerably impacts the changes in air temperature over the summer and winter seasons. Additionally, it improves thermal comfort. Based on these tables, the PET index is improved when permeable pavements are added.
Finally, based on the research results, each of the components of landscape design, such as green infrastructures like living walls, green roofs, and pavement materials like the ones mentioned in this research, has a unique impact on the temperature of the air outside, the level of outdoor thermal comfort, and the amount of energy that the building consumes. It is preferable to use a combination of these components in the design in order to achieve the goal of enhancing the thermal comfort of the landscape-designed space while simultaneously having a discernible effect on the amount of energy that the building consumes.
This study contributes valuable insights into the nuanced impacts of landscape interventions on Shiraz’s air temperature and building energy consumption, offering a foundation for informed decision-making in sustainable urban development practices.

5. Conclusions

To tackle the urgent issue of urban heat and energy consumption in buildings, it has become necessary to develop creative strategies in landscape design. This study aimed to address the current lack of research by investigating how landscape design characteristics can impact outdoor air temperature and enhance thermal comfort and energy needs in buildings, specifically in Shiraz’s distinct setting.
Instead of using traditional approaches focusing on adding trees and grass, this research aimed to create a new and unique path. The objective was to discover alternative approaches to enhance landscape design’s influence on buildings’ energy dynamics. The study examined an office site on the city’s outskirts, known for its unique landscape and abundant plant life. By doing so, the study gained valuable insights relevant to the various difficulties and possibilities associated with such environments.
The study intentionally concentrated on a specific winter day designated as the coldest day recorded in Shiraz, according to the EPW records, as well as a summer day recognized as the hottest. The harsh weather conditions were chosen to assess the potential influence of green infrastructure and pavement materials on regulating air temperatures in different climates. These selected days served as benchmarks that provided significant information on how well green infrastructure and pavement materials perform and endure throughout the year. Moreover, conducting an in-depth investigation on these crucial days enabled the derivation of conclusions and the prediction of how green infrastructure and pavement materials would function under comparable circumstances in various seasons or years. While analyzing data across several years or seasons could offer more insights, this study’s approach provided a targeted and practical assessment that has laid a robust foundation for future research and the implementation of Shiraz’s green infrastructure and pavement materials.
An essential factor highlighting the thoroughness of this investigation was its timeframe. The intricate relationship between seasonal fluctuations and landscape factors, encompassing both the summer and winter seasons, was carefully analyzed. This methodology not only enhanced the results but also provided a thorough comprehension of how landscape design features might adjust outdoor and indoor thermal conditions, thus impacting the energy usage patterns of buildings.
This study highlights the potential of landscape design as an effective tool in creating sustainable and energy-efficient urban habitats. The research findings offer valuable guidance for future efforts to integrate built environments with nature, particularly in places like Shiraz that are facing increasing challenges related to urban heat and energy demands.
The findings underscore the significant influence of urban greenery and specific materials on mitigating temperature differentials, thereby enhancing indoor thermal comfort. Particularly in the summer, the permeable pavement scenario with 80% grass emerged as a potent solution, while the green wall showcased its effectiveness in the winter, especially in the north and northeast directions.
The study offers actionable insights into optimizing landscape design elements for practitioners and policymakers to achieve sustainable indoor thermal conditions. Specifically, installing green walls in north-facing orientations could serve as a strategic approach to balancing thermal comfort across seasons. Although this study has offered valuable insights into the impact of green infrastructure on urban sustainability concerns, there are still many opportunities for further research and improvement in this field. An area worth exploring further is incorporating blue–green infrastructure, which combines natural and manufactured water systems to control stormwater, mitigate urban heat island effects, and promote biodiversity. Studying the combined advantages of blue–green infrastructure in reducing flood risks, enhancing water quality, and improving building energy consumption should be a key priority for subsequent research. Studying the socio-economic effects and public opinions of blue–green infrastructure projects can offer valuable insights into their acceptance and efficiency in various metropolitan settings. It is essential to investigate new design techniques and technologies to enhance the efficiency of blue–green infrastructure in various climatic areas and urban environments to promote sustainable urban development objectives. Efforts to blend built environments with nature, especially by using blue–green infrastructure, are crucial for tackling urban sustainability issues and developing healthier, more resilient communities for future generations.

Author Contributions

Conceptualization, A.H.; methodology, A.H.; software, N.K. and A.H.; validation, N.K. and A.H.; formal analysis, N.K and A.H.; investigation, N.K.; resources, N.K. and A.H.; data curation, A.H.; writing—original draft preparation, A.H. and N.K.; writing—review and editing, A.H. and N.K.; visualization, N.K.; supervision, A.H.; project administration, A.H. All authors have read and agreed to the published version of the manuscript.

Funding

This research received no external funding.

Data Availability Statement

The original contributions presented in the study are included in the article, further inquiries can be directed to the corresponding authors.

Acknowledgments

The authors express their gratitude to Shiraz University for providing the foundational support for research and study in this field, as well as for the provision of data logger instruments. Special thanks are extended to Bruce for generously gifting the Envi-met license to our department. The authors also acknowledge Fathi for his invaluable consultation throughout the project.

Conflicts of Interest

The authors declare no conflicts of interest.

References

  1. Zhang, F.; de Dear, R.; Hancock, P. Effects of moderate thermal environments on cognitive performance: A multidisciplinary review. Appl. Energy 2019, 236, 760–777. [Google Scholar]
  2. Seppänen, O.A.; Fisk, W. Some quantitative relations between indoor environmental quality and work performance or health. HVAC R Res. 2006, 12, 957–973. [Google Scholar] [CrossRef]
  3. Al Horr, Y.; Arif, M.; Kaushik, A.; Mazroei, A.; Katafygiotou, M.; Elsarrag, E. Occupant productivity and office indoor environment quality: A review of the literature. Build. Environ. 2016, 105, 369–389. [Google Scholar]
  4. Langevin, J.; Wen, J.; Gurian, P. Modeling thermal comfort holistically: Bayesian estimation of thermal sensation, acceptability, and preference distributions for office building occupants. Build. Environ. 2013, 69, 202–226. [Google Scholar] [CrossRef]
  5. Lucon, O.; Ürge-Vorsatz, D.; Ahmed, A.Z.; Akbari, H.; Bertoldi, P.; Cabeza, L.F.; Vilariño, M.V. Buildings. Climate change 2014: Mitigation of climate change. In Contribution of Working Group III to the Fifth Assessment Report of the Intergovernmental Panel on Climate Change; Cambridge University: Cambridge, UK, 2014; pp. 671–738. [Google Scholar]
  6. Brager, G.; Zhang, H.; Arens, E. Evolving Opportunities for Providing Thermal Comfort. Build. Res. Inf. 2015, 43, 274–287. [Google Scholar] [CrossRef]
  7. Gutierrez, A.L.; Williams, E. Co-alignment of comfort and energy saving objectives for U.S. office buildings and restaurants. Sustain. Cities Soc. 2016, 27, 32–41. [Google Scholar] [CrossRef]
  8. Derrible, S.; Reeder, M. The Cost of Over-Cooling Commercial Buildings in the United States. Energy Build. 2015, 108, 304–306. [Google Scholar] [CrossRef]
  9. Baniyounes, A.; Ghadi, Y.Y.; Rasul, M.G.; Khan, M.M.K. An overview of solar assisted air conditioning in Queensland’s subtropical regions, Australia. Renew. Sustain. Energy Rev. 2013, 26, 781–804. [Google Scholar]
  10. Cao, X.; Xilei, D.; Liu, J. Building energy-consumption status worldwide and the state-of-the-art technologies for zero-energy buildings during the past decade. Energy Build. 2016, 128, 198–213. [Google Scholar]
  11. Synnefa, A.; Santamouris, M.; Akbari, H. Estimating the effect of using cool coatings on energy loads and thermal comfort in residential buildings in various climatic conditions. Energy Build. 2007, 39, 1167–1174. [Google Scholar] [CrossRef]
  12. Fisk, W. Health and productivity gains from better indoor environments and their relationship with building energy efficiency. Annu. Rev. Energy Environ. 2000, 25, 537–566. [Google Scholar] [CrossRef]
  13. Fisk, W.J. Estimates of potential nationwide productivity and health benefits from better indoor environments: An update. In Indoor Air Quality Handbook; Springer: Berlin/Heidelberg, Germany, 2000; Volume 4. [Google Scholar]
  14. Hong, T.; Lin, H.-W. Occupant Behavior: Impact on Energy Use of Private Offices; Ernest Orlando Lawrence Berkeley National Laboratory: Berkeley, CA, USA, 2012.
  15. Pastore, L.; Corrao, R.; Heiselberg, P. The effects of vegetation on indoor thermal comfort: The application of a multi-scale simulation methodology on a residential neighborhood renovation case study. Energy Build. 2017, 146, 1–11. [Google Scholar] [CrossRef]
  16. Santamouris, M.; Ding, L.; Fiorito, F.; Oldfield, P.; Osmond, P.; Paolini, R.; Prasad, D.; Synnefa, A. Passive and active cooling for the outdoor built environment—Analysis and assessment of the cooling potential of mitigation technologies using performance data from 220 large scale projects. Sol. Energy 2016, 154, 14–33. [Google Scholar]
  17. Assimakopoulos, M.-N.; De Masi, R.F.; de Rossi, F.; Papadaki, D.; Ruggiero, S. Green Wall Design Approach towards Energy Performance and Indoor Comfort Improvement: A Case Study in Athens. Sustainability 2020, 12, 3772. [Google Scholar] [CrossRef]
  18. Charoenkit, S.; Yiemwattana, S. Living walls and their contribution to improved thermal comfort and carbon emission reduction: A review. Build. Environ. 2016, 105, 82–94. [Google Scholar]
  19. Ferrari, A.; Kubilay, A.; Derome, D.; Carmeliet, J. The use of permeable and reflective pavements as a potential strategy for urban heat island mitigation. Urban Clim. 2020, 31, 100534. [Google Scholar]
  20. Nasrollahi, N.; Ghosouri, A.; Khodakarami, J.; Taleghani, M. Heat Mitigation Strategies to Improve Pedestrian Thermal Comfort in Urban Environments: A Review. Sustainability 2020, 12, 10000. [Google Scholar] [CrossRef]
  21. Faragallah, R.N.; Ragheb, R.A. Evaluation of thermal comfort and urban heat island through cool paving materials using ENVI-Met. Ain Shams Eng. J. 2022, 13, 101609. [Google Scholar] [CrossRef]
  22. Vujovic, S.; Haddad, B.; Karaky, H.; Sebaibi, N.; Boutouil, M. Urban Heat Island: Causes, Consequences, and Mitigation Measures with Emphasis on Reflective and Permeable Pavements. CivilEng 2021, 2, 459–484. [Google Scholar] [CrossRef]
  23. Akbari, H.; Pomerantz, M.; Taha, H. Cool Surfaces and Shade Trees to Reduce Energy Use and Improve Air Quality in Urban Areas. Sol. Energy 2001, 70, 295–310. [Google Scholar] [CrossRef]
  24. Bowler, D.E.; Buyung-Ali, L.; Knight, T.M.; Pullin, A.S. Urban greening to cool towns and cities: A systematic review of the empirical evidence. Landsc. Urban Plan. 2010, 97, 147–155. [Google Scholar]
  25. Escobedo, F.; Kroeger, T.; Wagner, J. Urban forests and pollution mitigation: Analyzing ecosystem services and disservices. Environ. Pollut. 2011, 159, 2078–2087. [Google Scholar] [CrossRef]
  26. Li, D.; Bou-Zeid, E.; Oppenheimer, M. The Effectiveness of Cool and Green Roofs as Urban Heat Island Mitigation Strategies. Environ. Res. Lett. 2014, 9, 055002. [Google Scholar] [CrossRef]
  27. Solecki, W. Urban Environmental Challenges and Climate Change Action in New York City. Environ. Urban. 2012, 24, 557–573. [Google Scholar] [CrossRef]
  28. Santamouris, M.; Papanikolaou, N.; Livada, I.; Koronakis, I.; Georgakis, C.; Argiriou, A.; Assimakopoulos, D.N. On the impact of urban climate on the energy consuption of building. Sol. Energy 2001, 70, 201–216. [Google Scholar] [CrossRef]
  29. Chen, T.; Meili, N.; Fatichi, S.; Hang, J.; Tan, P.Y.; Yuan, C. Effects of tree plantings with varying street aspect ratios on the thermal environment using a mechanistic urban canopy model. Build. Environ. 2023, 246, 111006. [Google Scholar]
  30. Coutts, A.; White, E.C.; Tapper, N.J.; Beringer, J.; Livesley, S.J. Temperature and human thermal comfort effects of street trees across three contrasting street canyon environments. Theor. Appl. Climatol. 2015, 124, 55–68. [Google Scholar]
  31. Aboelata, A.; Sodoudi, S. Evaluating the effect of trees on UHI mitigation and reduction of energy usage in different built up areas in Cairo. Build. Environ. 2020, 168, 106490. [Google Scholar] [CrossRef]
  32. Aboelata, A.; Sodoudi, S. Evaluating urban vegetation scenarios to mitigate urban heat island and reduce buildings’ energy in dense built-up areas in Cairo. Build. Environ. 2019, 166, 106407. [Google Scholar] [CrossRef]
  33. Akbari, H.; Matthews, H.D. Global Cooling Updates: Reflective Roofs and Pavements. Energy Build. 2012, 55, 2–6. [Google Scholar] [CrossRef]
  34. Santamouris, M.; Synnefa, A.; Karlessi, T. Using advanced cool materials in the urban built environment to mitigate heat islands and improve thermal comfort conditions. Sol. Energy 2011, 85, 3085–3102. [Google Scholar]
  35. Wang, C.; Wang, Z.-H.; Kaloush, K.E.; Shacat, J. Cool pavements for urban heat island mitigation: A synthetic review. Renew. Sustain. Energy Rev. 2021, 146, 111171. [Google Scholar]
  36. Taha, H. Urban climates and heat islands: Albedo, evapotranspiration, and anthropogenic heat. Energy Build. 1997, 25, 99–103. [Google Scholar] [CrossRef]
  37. Kyriakodis, G.; Santamouris, M. Using reflective pavements to mitigate urban heat island in warm climates—Results from a large scale urban mitigation project. Urban Clim. 2018, 24, 326–339. [Google Scholar] [CrossRef]
  38. Battista, G.; Pastore, E.M. Using cool pavements to mitigate urban temperatures in a case study of Rome (Italy). Energy Procedia 2017, 113, 98–103. [Google Scholar]
  39. Sen, S.; Roesler, J.; Ruddell, B.; Middel, A. Cool Pavement Strategies for Urban Heat Island Mitigation in Suburban Phoenix, Arizona. Sustainability 2019, 11, 4452. [Google Scholar] [CrossRef]
  40. Taleghani, M.; Sailor, D.; Ban-Weiss, G.A. Micrometeorological simulations to predict the impacts of heat mitigation strategies on pedestrian thermal comfort in a Los Angeles neighborhood. Environ. Res. Lett. 2016, 11, 024003. [Google Scholar] [CrossRef]
  41. Jones, P.J.; Gwilliam, J.; Salleh, E. An evaluation of outdoor and building environment cooling achieved through combination modification of trees with ground materials. Build. Environ. 2012, 58, 245–257. [Google Scholar]
  42. Taleghani, M.; Berardi, U. The effect of pavement characteristics on pedestrians’ thermal comfort in Toronto. Urban Clim. 2018, 24, 449–459. [Google Scholar] [CrossRef]
  43. Seifeddine, K.; Amziane, S.; Toussaint, E. Experimental investigation of physical characteristics to improve the cooling effect of permeable pavements. Constr. Build. Mater. 2022, 345, 128342. [Google Scholar] [CrossRef]
  44. Wang, J.; Meng, Q.; Tan, K.; Zhang, L.; Zhang, Y. Experimental investigation on the influence of evaporative cooling of permeable pavements on outdoor thermal environment. Build. Environ. 2018, 140, 184–193. [Google Scholar]
  45. Xie, J.; Zhou, Z. Numerical Analysis on the Optimization of Evaporative Cooling Performance for Permeable Pavements. Sustainability 2022, 14, 4915. [Google Scholar] [CrossRef]
  46. Saadatian, O.; Sopian, K.; Salleh, E.; Lim, C.; Riffat, S.; Saadatian, E.; Toudeshki, A.; Sulaiman, M. A review of energy aspects of green roofs. Renew. Sustain. Energy Rev. 2013, 23, 155–168. [Google Scholar]
  47. Castleton, H.F.; Stovin, V.; Beck, S.B.M.; Davison, J.B. Green roofs; Building energy savings and the potential for retrofit. Energy Build. 2010, 42, 1582–1591. [Google Scholar] [CrossRef]
  48. Susca, T.; Zanghirella, F.; Colasuonno, L.; Del Fatto, V. Effect of green wall installation on urban heat island and building energy use: A climate-informed systematic literature review. Renew. Sustain. Energy Rev. 2022, 159, 112100. [Google Scholar]
  49. Karimi, K.; Farrokhzad, M.; Roshan, G.; Aghdasi, M. Evaluation of effects of a green wall as a sustainable approach on reducing energy use in temperate and humid areas. Energy Build. 2022, 262, 112014. [Google Scholar]
  50. Wang, X.; Li, H.; Sodoudi, S. The effectiveness of cool and green roofs in mitigating urban heat island and improving human thermal comfort. Build. Environ. 2022, 217, 109082. [Google Scholar] [CrossRef]
  51. Du, R.; Liu, C.-H.; Li, X.-X. A new method for detecting urban morphology effects on urban-scale air temperature and building energy consumption under mesoscale meteorological conditions. Urban Clim. 2024, 53, 101775. [Google Scholar]
  52. Pragati, S.; Priya, R.S.; Pradeepa, C.; Senthil, R. Simulation of the Energy Performance of a Building with Green Roofs and Green Walls in a Tropical Climate. Sustainability 2023, 15, 2006. [Google Scholar]
  53. Algarni, S.; Almutairi, K.; Alqahtani, T. Investigating the performance of energy management in office buildings by using a suitable green roof design to reduce the building’s energy consumption. Sustain. Energy Technol. Assess. 2022, 54, 102825. [Google Scholar] [CrossRef]
  54. Aboelata, A. Reducing outdoor air temperature, improving thermal comfort, and saving buildings’ cooling energy demand in arid cities–Cool paving utilization. Sustain. Cities Soc. 2021, 68, 102762. [Google Scholar]
  55. Aboelata, A. Assessment of green roof benefits on buildings’ energy-saving by cooling outdoor spaces in different urban densities in arid cities. Energy 2021, 219, 119514. [Google Scholar] [CrossRef]
  56. Rossi, L.; Menconi, M.E.; Grohmann, D.; Brunori, A.; Nowak, D.J. Urban planning insights from tree inventories and their regulating ecosystem services assessment. Sustainability 2022, 14, 1684. [Google Scholar] [CrossRef]
  57. Todorov, V.; Dimov, I. Unveiling the Power of Stochastic Methods: Advancements in Air Pollution Sensitivity Analysis of the Digital Twin. Atmosphere 2023, 14, 1078. [Google Scholar]
  58. Mohammed, A.; Khan, A.; Khan, H.S.; Santamouris, M. Cooling energy benefits of increased green infrastructure in subtropical urban building environments. Buildings 2023, 13, 2257. [Google Scholar] [CrossRef]
  59. Park, J.Y.; Nagy, Z. Comprehensive analysis of the relationship between thermal comfort and building control research—A data-driven literature review. Renew. Sustain. Energy Rev. 2018, 82, 2664–2679. [Google Scholar]
  60. Viana, J.; Santos, J.V.; Neiva, R.M.; Souza, J.; Duarte, L.; Teodoro, A.C.; Freitas, A. Remote Sensing in Human Health: A 10-Year Bibliometric Analysis. Remote Sens. 2017, 9, 1225. [Google Scholar] [CrossRef]
  61. Coma, J.; Pérez, G.; de Gracia, A.; Burés, S.; Urrestarazu, M.; Cabeza, L.F. Vertical greenery systems for energy savings in buildings: A comparative study between green walls and green facades. Build. Environ. 2017, 111, 228–237. [Google Scholar] [CrossRef]
  62. Koch, K.; Ysebaert, T.; Denys, S.; Samson, R. Urban heat stress mitigation potential of green walls: A review. Urban For. Urban Green. 2020, 55, 126843. [Google Scholar] [CrossRef]
  63. Tsoka, S.; Tsikaloudaki, A.; Theodosiou, T. Analyzing the ENVI-met microclimate model’s performance and assessing cool materials and urban vegetation applications—A review. Sustain. Cities Soc. 2018, 43, 55–76. [Google Scholar]
  64. Zhang, L.; Liu, H.; Wei, D.; Liu, F.; Li, Y.; Li, H.; Dong, Z.; Cheng, J.; Tian, L.; Zhang, G.; et al. Impacts of Spatial Components on Outdoor Thermal Comfort in Traditional Linpan Settlements. Int. J. Environ. Res. Public Health 2022, 19, 6421. [Google Scholar] [CrossRef]
  65. Zandi, R.; Zanganeh, Y.; Karami, M.; Khosravian, M. Analysis of the Spatio-temporal variations of thermal patterns of Shiraz city by satellite images and GIS processing. Egypt. J. Remote Sens. Space Sci. 2022, 25, 1069–1088. [Google Scholar]
  66. Abba, H.; Majid, R.A.; Ahmed, M.H.; Ayegbusi, O.G. Validation of Designbuilder Simulation Accuracy Using Field Measured Data of Indoor Air Temperature in a Classroom Building. J. Tour. Hosp. Environ. Manag. 2022, 7, 171–178. [Google Scholar] [CrossRef]
  67. Mustafaraj, G.; Marini, D.; Costa, A.; Keane, M. Model calibration for building energy efficiency simulation. Appl. Energy 2014, 130, 72–85. [Google Scholar]
  68. Sun, Y.; Heo, Y.; Tan, M.; Xie, H.; Wu, C.J.; Augenbroe, G. Uncertainty quantification of microclimate variables in building energy models. J. Build. Perform. Simul. 2014, 7, 17–32. [Google Scholar] [CrossRef]
  69. Akbari, H.; Menon, S.; Rosenfeld, A. Global cooling: Increasing world-wide urban albedos to offset CO2. Clim. Change 2009, 94, 275–286. [Google Scholar] [CrossRef]
  70. Qin, Y. Urban canyon albedo and its implication on the use of reflective cool pavements. Energy Build. 2015, 96, 86–94. [Google Scholar] [CrossRef]
  71. Alchapar, N.L.; Correa, E.N. The use of reflective materials as a strategy for urban cooling in an arid “OASIS” city. Sustain. Cities Soc. 2016, 27, 1–14. [Google Scholar]
  72. Yang, J.; Wang, Z.-H.; Kaloush, K.E. Environmental impacts of reflective materials: Is high albedo a ‘silver bullet’for mitigating urban heat island? Renew. Sustain. Energy Rev. 2015, 47, 830–843. [Google Scholar]
  73. Citraningrum, A. The Impact of Different Types of Permeable Pavement Utilization on Air Temperature and Building Energy Consumption. RUAS Rev. Urban. Archit. Stud. 2012, 10, 23–33. [Google Scholar] [CrossRef]
  74. Antunes, L.N.; Ghisi, E.; Severis, R.M. Environmental assessment of a permeable pavement system used to harvest stormwater for non-potable water uses in a building. Sci. Total Environ. 2020, 746, 141087. [Google Scholar] [CrossRef] [PubMed]
  75. Ng, E.; Chen, L.; Wang, Y.; Yuan, C. A study on the cooling effects of greening in a high-density city: An experience from Hong Kong. Build. Environ. 2012, 47, 256–271. [Google Scholar] [CrossRef]
  76. Ramadhan, A.M.; Mahmoud, A.H. Evaluating the efficiency of a living wall facade as a sustainable energy-saving alternative in hot arid regions. J. Eng. Appl. Sci. 2023, 70, 96. [Google Scholar] [CrossRef]
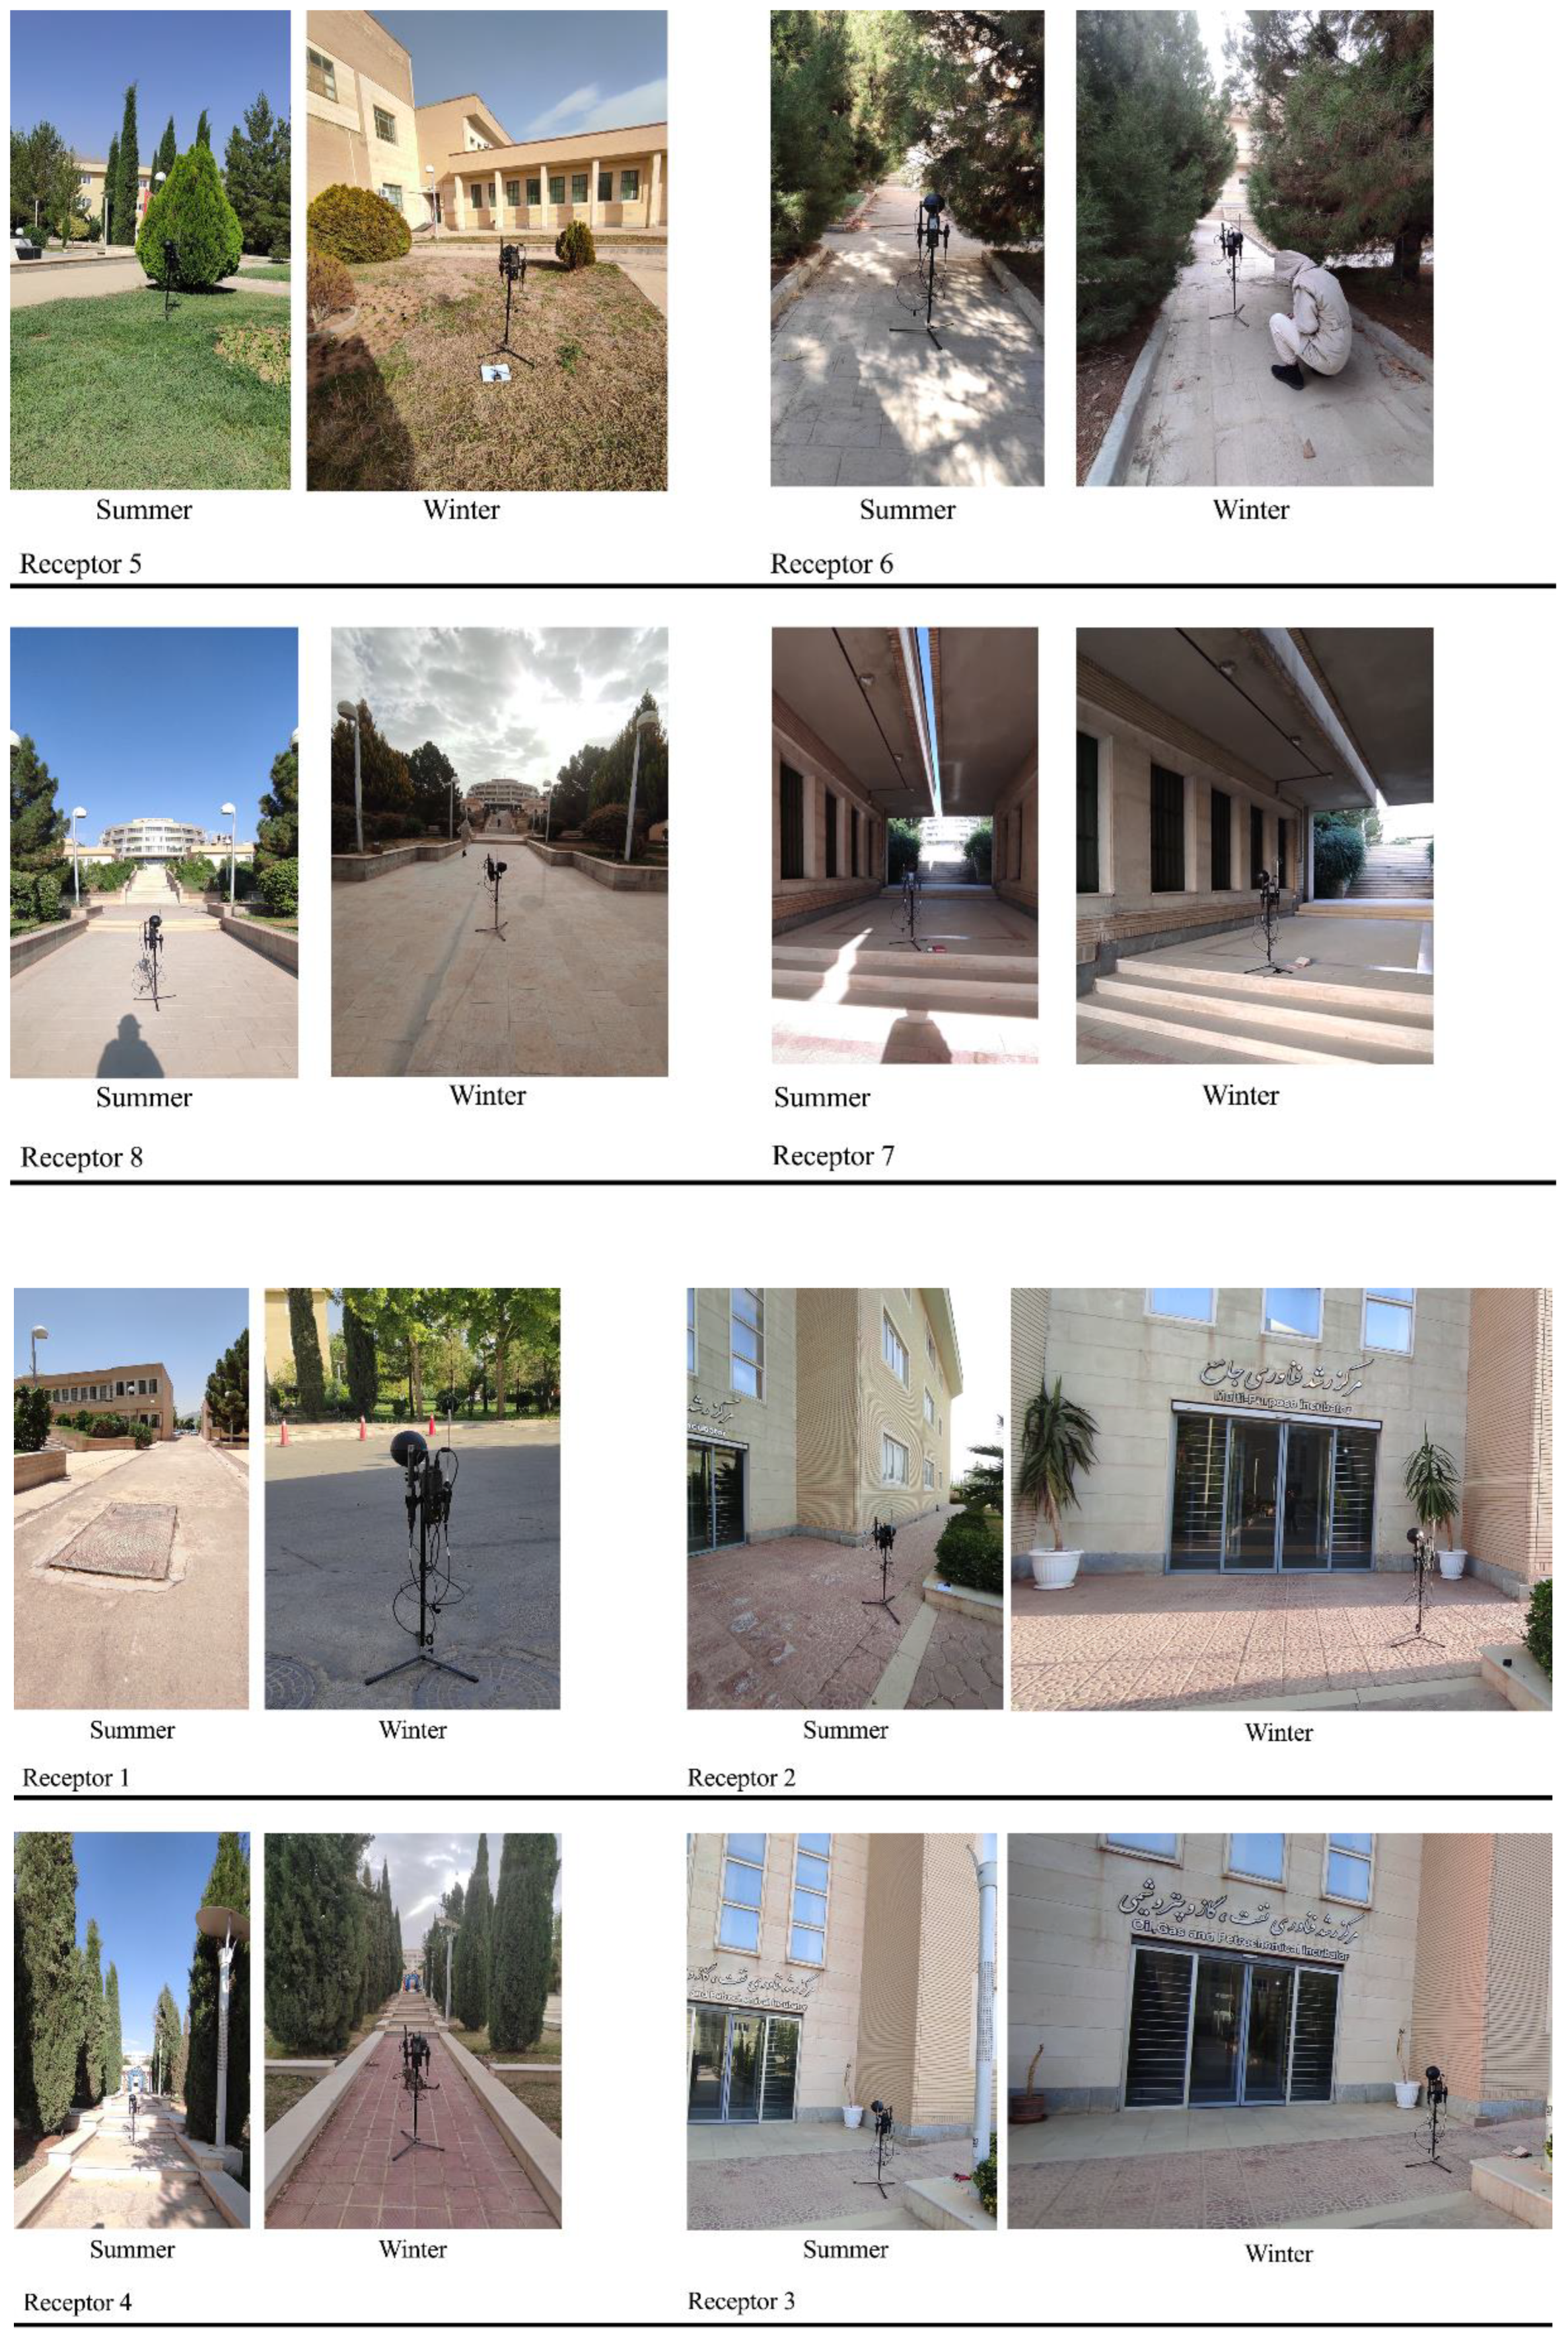
Figure 1. The trend of scholarly publications from 1977 to 2021 illustrates the increasing research interest in the field.
Buildings 14 00825 g001
Figure 2. Bibliometric network visualization of key research themes related to sustainable urban design and building performance.
Buildings 14 00825 g002
Figure 3. Methodology framework of the research.
Buildings 14 00825 g003
Figure 4. Specific areas designated for the collection of meteorological information and the installation of data loggers.
Buildings 14 00825 g004
Figure 5. Data logger placement points at the studied site.
Buildings 14 00825 g005
Figure 6. Testo 480 data logger.
Buildings 14 00825 g006
Figure 7. Testo 905 data logger.
Buildings 14 00825 g007
Figure 8. Modeling the reference case and each scenario in ENVI-met 5.1.1 software. (A) Applying a living wall, (B) applying a green roof, (C) cool pavement, (D) 40% permeable pavement, (E) 60% permeable pavement, and (F) 80% permeable pavement.
Buildings 14 00825 g008
Figure 9. Comparison of measured air temperature curves from Envi-met simulation and measured data.
Buildings 14 00825 g009
Figure 10. Comparison of relative humidity curves from Envi-met simulation and measured data.
Buildings 14 00825 g010
Figure 11. Site Location.
Buildings 14 00825 g011
Figure 12. DesignBuilder model.
Buildings 14 00825 g012
Figure 13. ENVI-met thermal maps of the air temperature for the difference between the air temperature of the reference case and the scenarios (ΔT = scenario − reference case) at 8.00 a.m. in the summer, 15 June 2022.
Buildings 14 00825 g013
Figure 14. ENVI-met thermal maps of the air temperature for the difference between the air temperature of the reference case and the scenarios (ΔT = scenario − reference case) at 10.00 a.m. in the summer, 15 June 2022.
Buildings 14 00825 g014
Figure 15. ENVI-met thermal maps of the air temperature for the difference between the air temperature of the reference case and the scenarios (ΔT = scenario − reference case) At 12.00 p.m. in the summer, 15 June 2022.
Buildings 14 00825 g015
Figure 16. ENVI-met thermal maps of the air temperature for the difference between the air temperature of the reference case and the scenarios (ΔT = scenario − reference case) at 4.00 p.m. in the summer, 15 June 2022.
Buildings 14 00825 g016
Figure 17. ENVI-met thermal maps of the air temperature for the difference between the air temperature of the reference case and the scenarios (ΔT = scenario − reference case) at 6.00 p.m. in the summer, 15 June 2022.
Buildings 14 00825 g017
Figure 18. ENVI-met thermal maps of the air temperature for the difference between the air temperature of the reference case and the scenarios (ΔT = scenario − reference case) at 8.00 p.m. in the summer, 15 June 2022.
Buildings 14 00825 g018
Figure 19. The absolute difference in the potential air temperature trend for summer.
Buildings 14 00825 g019
Figure 20. ENVI-met thermal maps of the air temperature for the difference between the air temperature of the reference case and the green roof scenarios (ΔT = scenario − reference case) at different heights in the summer, 15 June 2022.
Buildings 14 00825 g020
Figure 21. ENVI-met thermal maps of the air temperature for the difference between the air temperature of the reference case and the scenarios (ΔT = scenario − reference case) at 8.00 a.m. in the winter, 19 February 2022.
Buildings 14 00825 g021
Figure 22. ENVI-met thermal maps of the air temperature for the difference between the air temperature of the reference case and the scenarios (ΔT = scenario − reference case) at 10.00 a.m. in the winter, 19 February 2022.
Buildings 14 00825 g022
Figure 23. ENVI-met thermal maps of the air temperature for the difference between the air temperature of the reference case and the scenarios (ΔT = scenario − reference case) at 12.00 p.m. in the winter, 19 February 2022.
Buildings 14 00825 g023
Figure 24. ENVI-met thermal maps of the air temperature for the difference between the air temperature of the reference case and the scenarios (ΔT = scenario − reference case) at 4.00 p.m. in the winter, 19 February 2022.
Buildings 14 00825 g024
Figure 25. ENVI-met thermal maps of the air temperature for the difference between the air temperature of the reference case and the scenarios (ΔT = scenario − reference case) at 6.00 p.m. in the winter, 19 February 2022.
Buildings 14 00825 g025
Figure 26. ENVI-met thermal maps of the air temperature for the difference between the air temperature of the reference case and the scenarios (ΔT = scenario − reference case) at 8.00 p.m. in the winter, 19 February 2022.
Buildings 14 00825 g026
Figure 27. The absolute difference in the potential air temperature trend—winter.
Buildings 14 00825 g027
Figure 28. ENVI-met thermal maps of the air temperature for the difference between the air temperature of the reference case and the green roof scenarios (ΔT = scenario − reference case) at different heights in the winter, 19 February 2022.
Buildings 14 00825 g028
Table 1. The rationale for choosing the locations of data logger placements.
Data Logger Placement PointReason for Choosing this Point
P1Asphalt flooring materials that have a low albedo coefficient (0.2)
Direct radiation on the floor without natural or artificial shading
P2The entrance to one of the park’s first office buildings is under direct sunlight until noon
P3The entrance to one of the first office buildings of the complex, which is shadowless since one o’clock in the afternoon
P4A corridor formed via tall cypress trees and shaded for some hours
The main footpath to the main building of the park
Flooring material: rubble
P5Grass field
P6In full shade and under pine trees
P7In complete shade, including the shade provided via the building itself, as well as the shade provided via the tunnel formed by the shade of two neighboring structures
P8In the vicinity of tall pine trees with asphalt flooring
Table 2. The configuration of the ENVI-met model.
Model Geometryx-Grids = 150, y-Grids = 100, z-Grids = 30
Size of grid cell in metersdx = 3, dy = 3, dz = 3
Nesting grids10
General settings of the ENVI-met models
Simulation day19 February 2022
15 June 2022
Simulation start time00.00.00
Position on EarthLatitude(deg, +N, −S) = 29.61
longitude(deg, −W, +E) = 52.53
Table 3. Designed and evaluated scenarios in ENVI-met.
CategoryDesigned ScenarioReference Article
GreeneryLiving wallThe results of many studies align in confirming that the living wall system achieves better energy performance than the green facade system in both the summer and the winter [61,62]. The architecture of the built environment, including building orientation, spacing, form, and current pavement materials, restricts the use of green facades and planting vegetation in the soil near buildings. Therefore, the most suitable solution is a living wall.
Green roof (intensive)An intensive green roof could reduce the air temperature, improve thermal comfort (PET), and lower buildings’ cooling energy compared to an extensive green roof [55].
PavementsCool pavement (cool paint)Colored coating with an albedo of 0.52 and emissivity of 0.93 [63].
40% of the pavement was permeable, consisting of 30% permeable pavement and 10% grassUtilizing permeable pavements and incorporating grass into outdoor spaces can significantly mitigate outdoor air temperature. Permeable pavements allow rainwater to infiltrate the ground, reducing surface runoff and heat buildup and lowering surrounding air temperatures. Moreover, the presence of grass helps absorb heat and provides a cooling effect through transpiration, thereby further reducing ambient temperatures. Implementing these strategies not only helps to combat the urban heat island effect but also enhances the overall environmental quality of outdoor areas. These scenarios were chosen based on the findings of previous literature reviews [32].
The composition of the permeable pavement was 40% pavement and 20% grass, making up a total of 60%
The permeable pavement consisted of 50% pavement and 30% grass, making up a total of 80% of the pavement’s composition
Table 4. Design builder model configuration.
ComponentMaterialThickness (m)Density (kg/m3)Specific Heat (KJ/kg.K)Thermal Conductivity (W/m.K)
External wallsBrickwork, outer0.117008000.84
XPS (extruded polystyrene), CO2-blowing0.07953514000.034
Concrete block (medium)0.1140010000.51
Gypsum plastering0.013100010000.4
Internal wallsGypsum plasterboard0.02590010000.25
An air gap of 10 mm0.1---
Gypsum plasterboard0.02590010000.25
RoofAsphalt 10.01210010000.7
MW glass wool (rolls)0.1445128400.04
Air gap ≥ 25 mm0.2---
Plasterboard0.01328008690.25
FloorUrea formaldehyde foam0.13271014000.04
Cast concrete0.1200010001.13
Floor/roof screed0.0712008400.41
Timber flooring0.0365012000.14
Table 5. User and appliance data added to the DesignBuilder model.
SubjectDescription
Working timeWeekdays from Monday to Wednesday: 8 a.m. to 4 p.m.
HVAC systemFan coil unit andair-cooled chiller (COP 1.8)
Electric applianceComputer–printer–telephone–Wi-Fi–Lighting
Number of occupants 0.111 people m 2
Clothing coefficientSummer: 0.9
Clothing coefficientWinter: 1
Set point temperature25 °C cooling
Set point temperature23 °C heating
Table 6. Difference between the air temperature of the reference case and the scenarios (ΔT = scenario − reference case). Summer, 15 June 2022, from 1 a.m. to 12 noon.
Time
Scenario
123456789101112
LW−0.02−0.03−0.04−0.04−0.04−0.12−0.15−0.13−0.11−0.08−0.06−0.03
GR−0.12−0.08−0.05−0.02−0.02−0.01−0.05−0.16−0.31−0.57−0.80−0.53
CP00000−0.08−0.29−0.52−0.65−0.72−0.79−0.78
PP40−0.23−0.25−0.26−0.25−0.24−0.32−0.55−0.82−0.84−0.89−0.98−0.99
PP60−0.26−0.30−0.31−0.31−0.30−0.38−0.61−0.89−0.92−1.00−1.10−1.11
PP80−0.29−0.33−0.35−0.35−0.35−0.43−0.65−0.91−0.94−1.01−1.13−1.16
Table 7. Difference between the air temperature of the reference case and the scenarios (ΔT = scenario − reference case). Summer, 15 June 2022, from 12 p.m. to 12 a.m.
Time
Scenario
131415161718192021222324
LW−0.06−0.10−0.12−0.14−0.13−0.12−0.09−0.11−0.12−0.13−0.13−0.13
GR−0.36−0.27−0.22−0.18−0.17−0.24−0.27−0.31−0.35−0.38−0.32−0.25
CP−0.79−0.76−0.67−0.55−0.42−0.23−0.14−0.11−0.08−0.07−0.05−0.03
PP40−1.03−1.04−0.95−0.80−0.74−0.57−0.59−0.56−0.52−0.49−0.45−0.42
PP60−1.15−1.17−1.08−0.97−0.88−0.68−0.66−0.62−0.58−0.54−0.52−0.48
PP80−1.17−1.18−1.09−0.99−0.91−0.71−0.68−0.65−0.61−0.57−0.55−0.53
Table 8. Difference between the PET of the reference case and the scenarios (Δ PET = scenario − reference case). Summer, 15 June 2022 from 1 a.m. to 12 p.m.
Time
Scenario
123456789101112
LW0.180.260.340.420.750.710.850.750.620.430.510.56
GR0000.040.040.060.11−0.05−0.16−0.29−0.31−0.18
CP00000.10.190.220.400.460.730.890.71
PP400.030.070−0.01−0.04−0.05−0.5−0.9−1.19−1.26−1.41−1.50
PP600.050.030.02−0.05−0.13−0.09−0.8−1.00−1.45−1.32−1.62−1.73
PP800.090.070.06−0.03−0.16−0.13-−1.06−1.53−1.68−1.96−2.07
Table 9. Difference between the PET of the reference case and the scenarios (Δ PET = scenario − reference case). Summer, 15 June 2022 from 12 p.m. to 12 a.m.
Time
Scenario
131415161718192021222324
LW0.570.600.610.380.210.200.220.140.150.150.17
GR0.020.060.150.310.280.050−0.01−0.03−0.03−0.010
CP0.620.250.270.150.15−0.08−0.08−0.08−0.02−0.02−0.02−0.01
PP40−1.23−1.12−1.07−0.95−0.58−0.56−0.21−0.14−0.09−0.0300
PP60−1.87−1.56−1.32−1.74-−0.75−0.62−0.41−0.29−0.16−0.070
PP80−2.19−1.92−1.46--−1.15−0.82−0.81−0.54−0.20−0.030.02
Table 10. Difference between the air temperature of the reference case and the scenarios (ΔT = scenario − reference case). Winter, 19 February 2022—from 1 a.m. to 12 p.m.
Time
Scenario
123456789101112
LW−0.21−0.22−0.23−0.23−0.23−0.23−0.17−0.18−0.12−0.07−0.09−0.10
GR−0.55−0.61−0.65−0.68−0.70−0.71−0.59−0.32−0.19−0.11−0.08−0.07
CP−0.02−0.01−0.01−0.01−0.01−0.01−0.03−0.28−0.45−0.40−0.41−0.40
PP40−0.36−0.31−0.27−0.23−0.21−0.19−0.17−0.31−0.44−0.39−0.38−0.38
PP60−0.40−0.34−0.30−0.27−0.24−0.22−0.21−0.34−0.47−0.44−0.43−0.47
PP80−0.42−0.37−0.33−0.29−0.27−0.25−0.24−0.35−0.48−0.50−0.57−0.62
Table 11. Difference between the air temperature of the reference case and the scenarios (ΔT = scenario − reference case). Winter, 19 February 2022—from 12 p.m. to 12 a.m.
Time
Scenario
131415161718192021222324
LW−0.09−0.10−0.11−0.10−0.08−0.08−0.13−0.16−0.18−0.20−0.21−0.21
GR−0.06−0.07−0.07−0.13−0.26−0.35−0.43−0.51−0.55−0.59−0.62−0.59
CP−0.41−0.39−0.35−0.28−0.20−0.14−0.13−0.12−0.11−0.09−0.08−0.05
PP40−0.40−0.41−0.40−0.33−0.33−0.31−0.31−0.31−0.29−0.27−0.25−0.27
PP60−0.50−0.50−0.52−0.51−0.36−0.35−0.35−0.35−0.33−0.31−0.30−0.32
PP80−0.65−0.66−0.64−0.60−0.45−0.40−0.38−0.39−0.37−0.35−0.33−0.35
Table 12. Difference between the PET of the reference case and the scenarios (Δ PET = scenario − reference case). Winter, 19 February 2022—from 1 a.m. to 12 p.m.
Time
Scenario
123456789101112
LW0.200.200.210.210.210.260.320.300.340.380.600.72
GR−0.19−0.21−0.22−0.24−0.25−0.20−0.19−0.14−0.11−0.450.030.02
CP0.020.010.010.010.010.020.020.130.270.430.560.88
PP40−0.20−0.21−0.22−0.23−0.23−0.201.40.05−0.3−0.5−0.7−0.7
PP60−0.02−0.19−0.18−0.18−0.18−0.04−0.1−0.2−0.29−0.5−0.7−0.9
PP80--−0.18−0.15−0.14−0.02−0.14−0.29−0.31−0.56−0.78−1.10
Table 13. Difference between the PET of the reference case and the scenarios (Δ PET = scenario − reference case). Winter, 19 February 2022—from 12 p.m. to 12 a.m.
Time
Scenario
131415161718192021222324
LW0.620.350.330.290.230.180.140.190.190.190.190.20
GR0.020.010.01−0.02−0.06−0.07−0.08−0.11−0.15−0.17−0.18−0.18
CP0.600.450.27−0.05−0.05−0.05−0.05−0.04−0.04−0.02−0.02−0.02
PP40−0.6−0.40−0.40−0.20−0.30−0.11−0.18−0.03−0.05−0.05−0.17−0.19
PP60−1.10−0.5−0.6−0.4−0.30−0.13−0.15−0.1−0.1−0.05−0.04−0.04
PP80−1.30−0.90−0.90−0.5−0.30−0.10−0.17−1.11−0.12−0.06−0.06−0.08
Table 14. Buildings’ energy demands and CO2 emissions in three chosen scenarios and the reference case, summer, 15 June 2022.
ScenarioBuilding Cooling Daily
Consumption/kW
CO2 Emissions/kgElectricity/kw
AmountDaily
Savings
AmountDaily
Reduction
AmountDaily
Savings
Reference case2877.063-1089.229-1769.91-
Living wall2554.073322.99996.415992.81311617.889152.021
Green roof2770.598106.4651055.28433.9451713.90756.003
Permeable pavement with 80% grass2725.156151.9071045.09844.1311697.09972.811
Table 15. Buildings’ energy demands and CO2 emissions in three chosen scenarios and the reference case, winter, 19 February 2022.
ScenarioBuilding Heating Daily Consumption/kWCO2 Emissions/kgElectricity/kw
AmountDaily SavingsAmountDaily ReductionAmountDaily Savings
Reference case3020.263-1186.836-1382.593-
Living wall2265.237755.0261012.89173.946644.0712738.5218
Green roof2315.735704.5281044.832142.004625.4768757.1162
Disclaimer/Publisher’s Note: The statements, opinions and data contained in all publications are solely those of the individual author(s) and contributor(s) and not of MDPI and/or the editor(s). MDPI and/or the editor(s) disclaim responsibility for any injury to people or property resulting from any ideas, methods, instructions or products referred to in the content.

