
Demand-Side Management Method for Households with Self-Generation and Storage of Electricity


Abstract
:1. Introduction
2. State-of-the-Art
- Time-based DR programmes are based on offering consumers different tariffs for different time periods. In this context, consumers tend to transfer their manageable loads to periods with a lower price, resulting in a demand reduction at peak hours of the day, benefiting grid management. Consumers actively influence their load usage profile patterns according to the change in tariffs (Real-Rime or Time-of-use), but no direct equipment control occurs [24,25,26,27].
- Incentive-based DR programmes. In this programme, DR actions are agreed upon in advance between the consumer and the utility or aggregator. In this agreement, specific customer incentives and conditions for load management are defined (e.g., pre-notice time, energy packages to be managed, duration of the event, etc). DR events may result in load interruption or load translation to more convenient time periods for the grid, which may cause undesirable inconveniences for the final users. Some examples are Direct load control (DLC), interruptible/reduced rates, or Demand bidding programmes [28,29,30].
3. Methodology
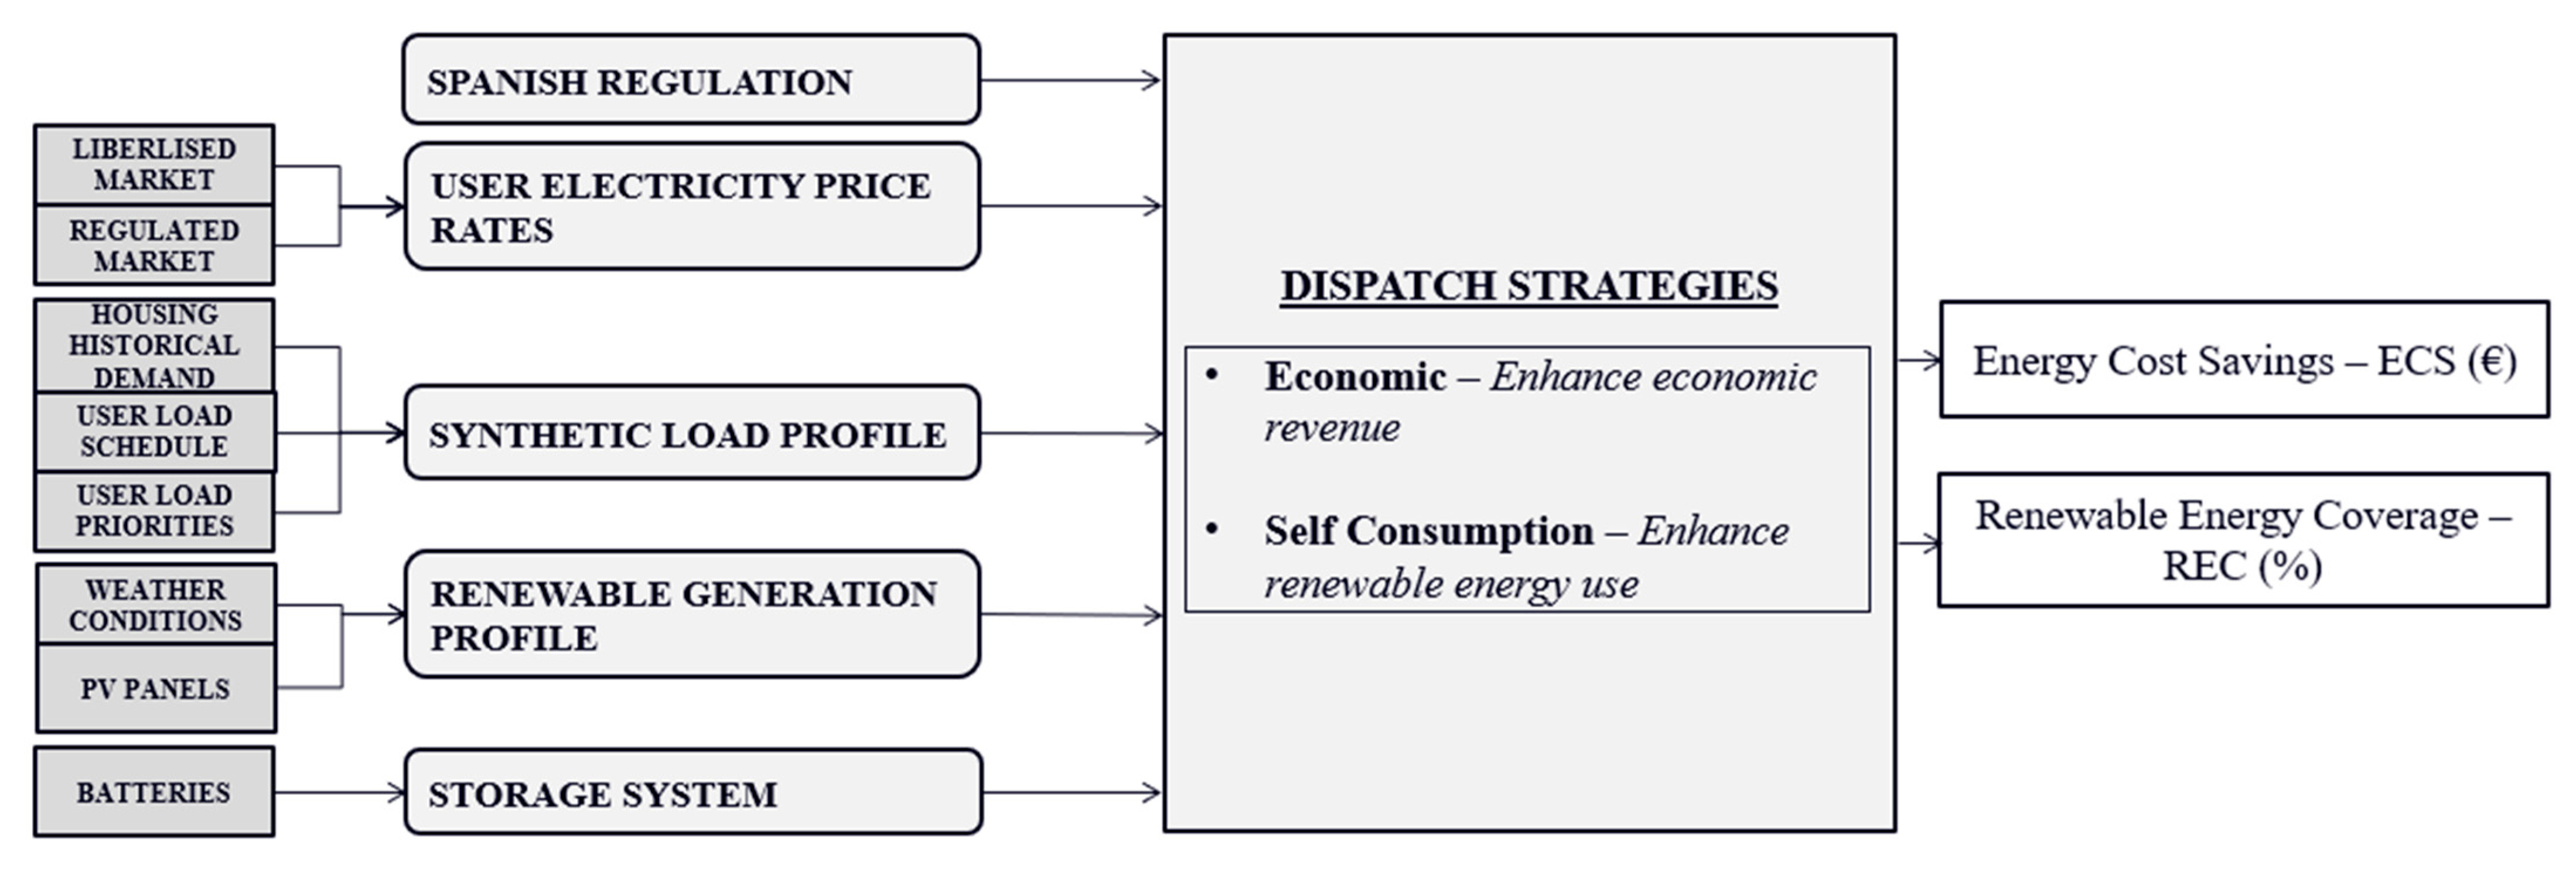
3.1. Input Parameters
- Spanish regulation [60]: Provides information about the policies of the current legislation. At this moment in Spain, the actual self-consumption regulation allows small domestic consumers to adopt a compensation regime, acquiring and delivering energy packages from and to the grid based on the consumer demand needs.
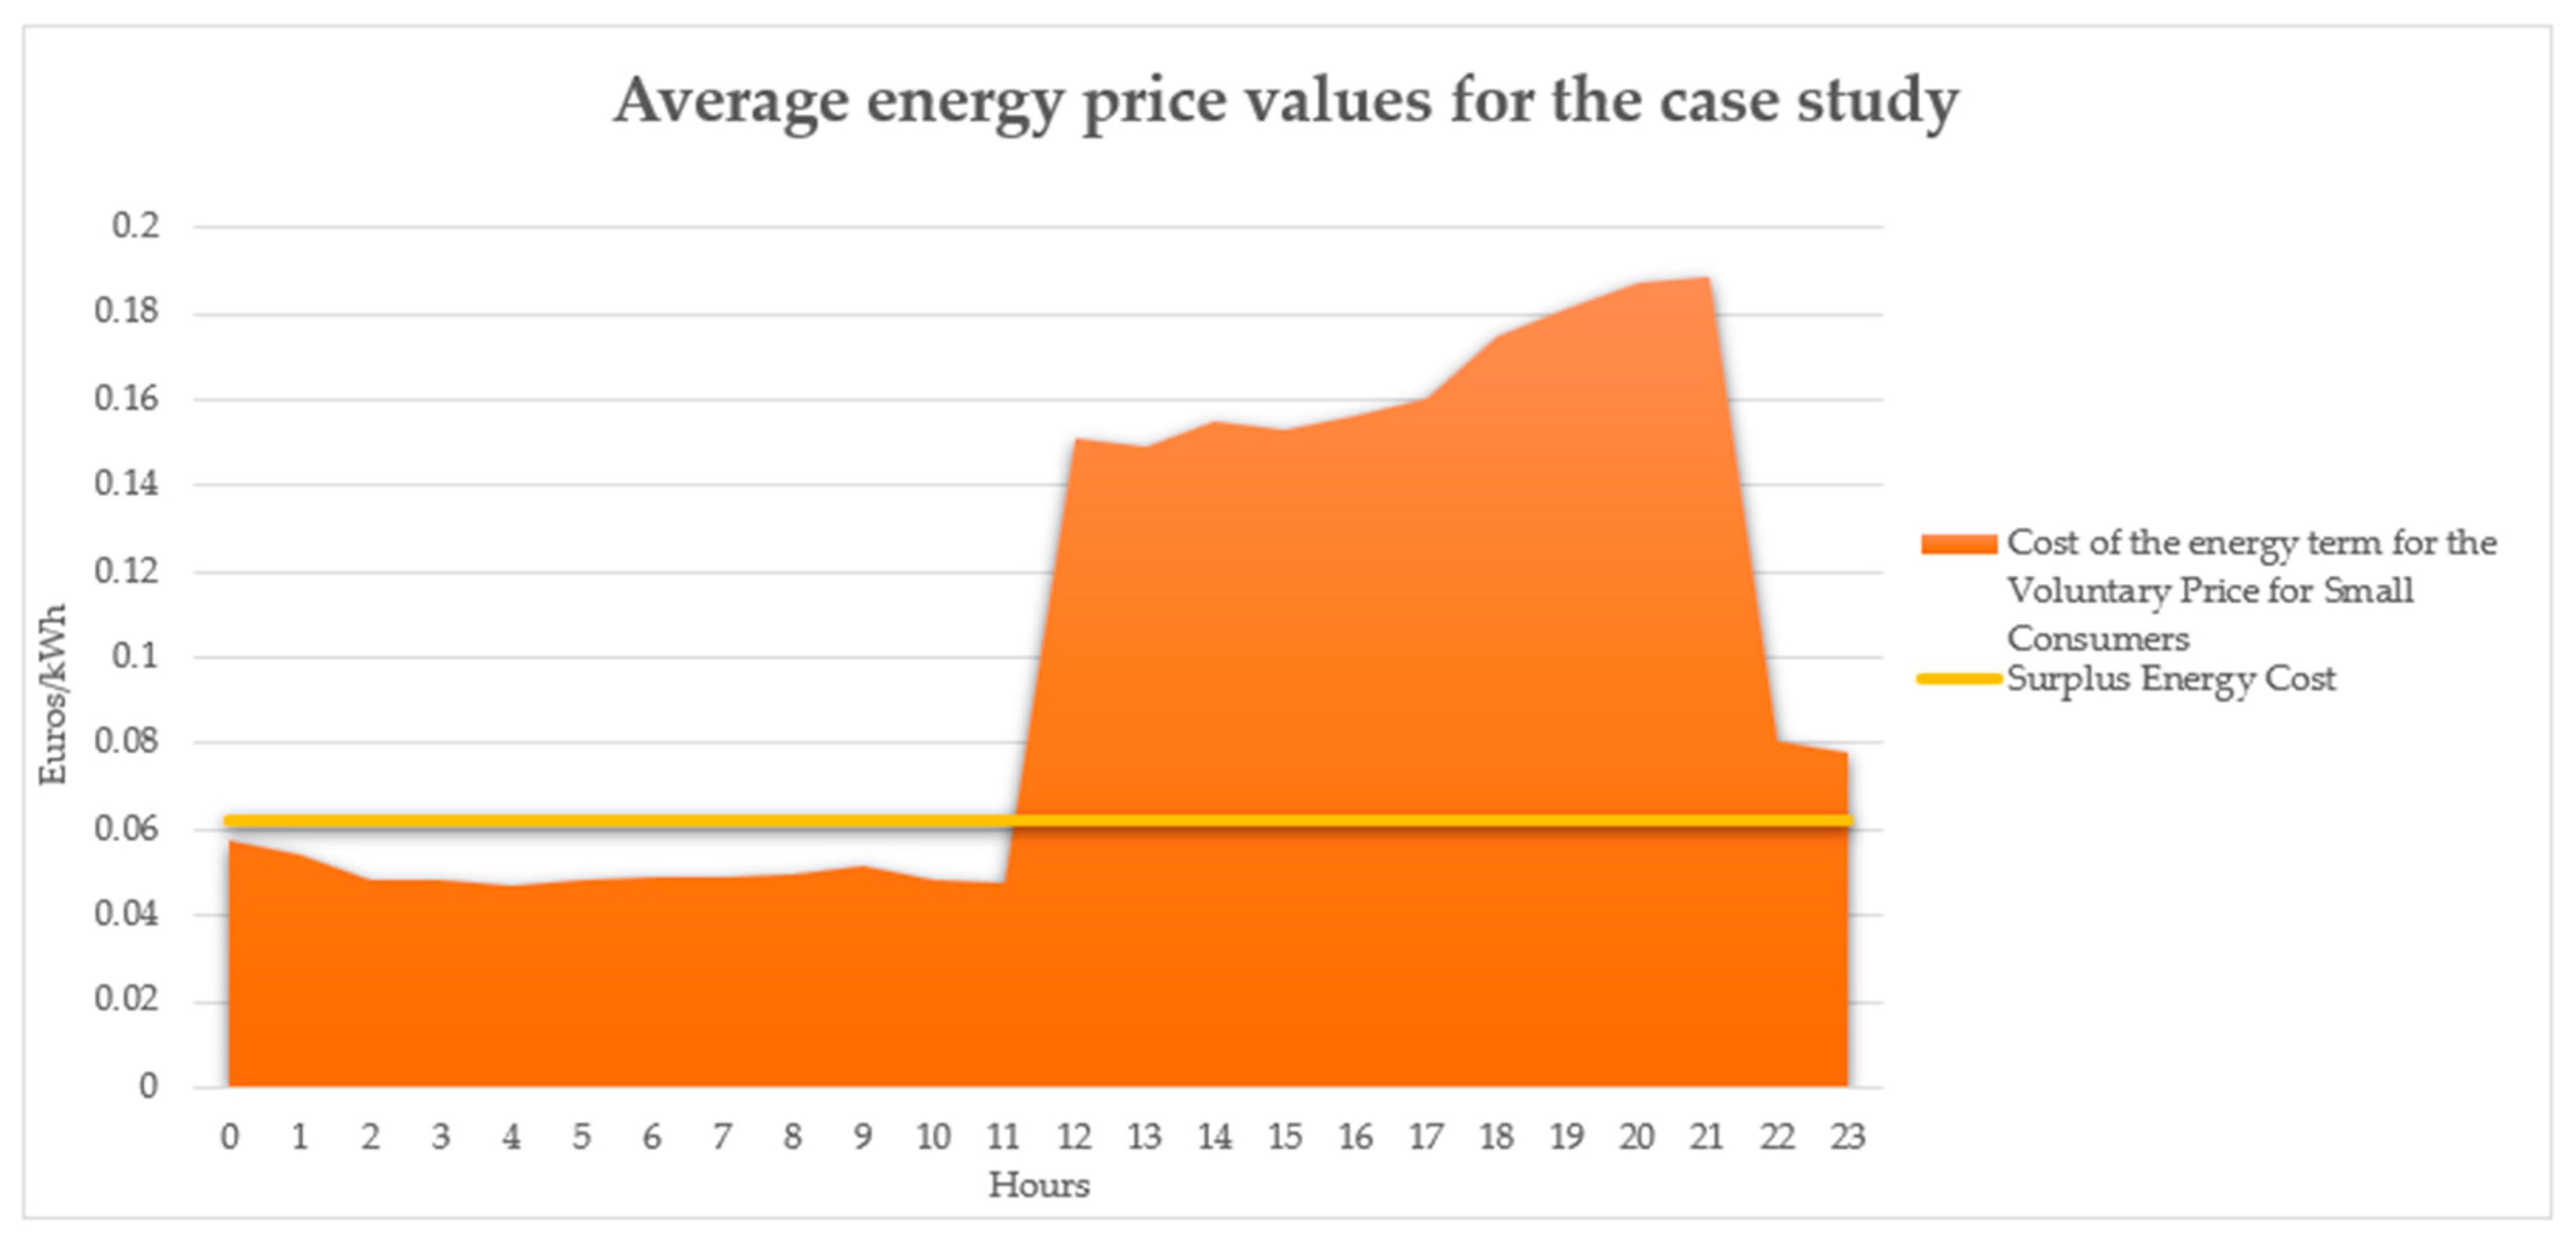
- User Electricity Price Rates: Corresponds to the hourly electricity price paid by the small consumer for consuming electricity at a specific hour of the day. It is obtained from the Spanish System Operator (OMIE) [61], based on the actual energy contract of the consumer (regulated tariff or real-time energy market prices).
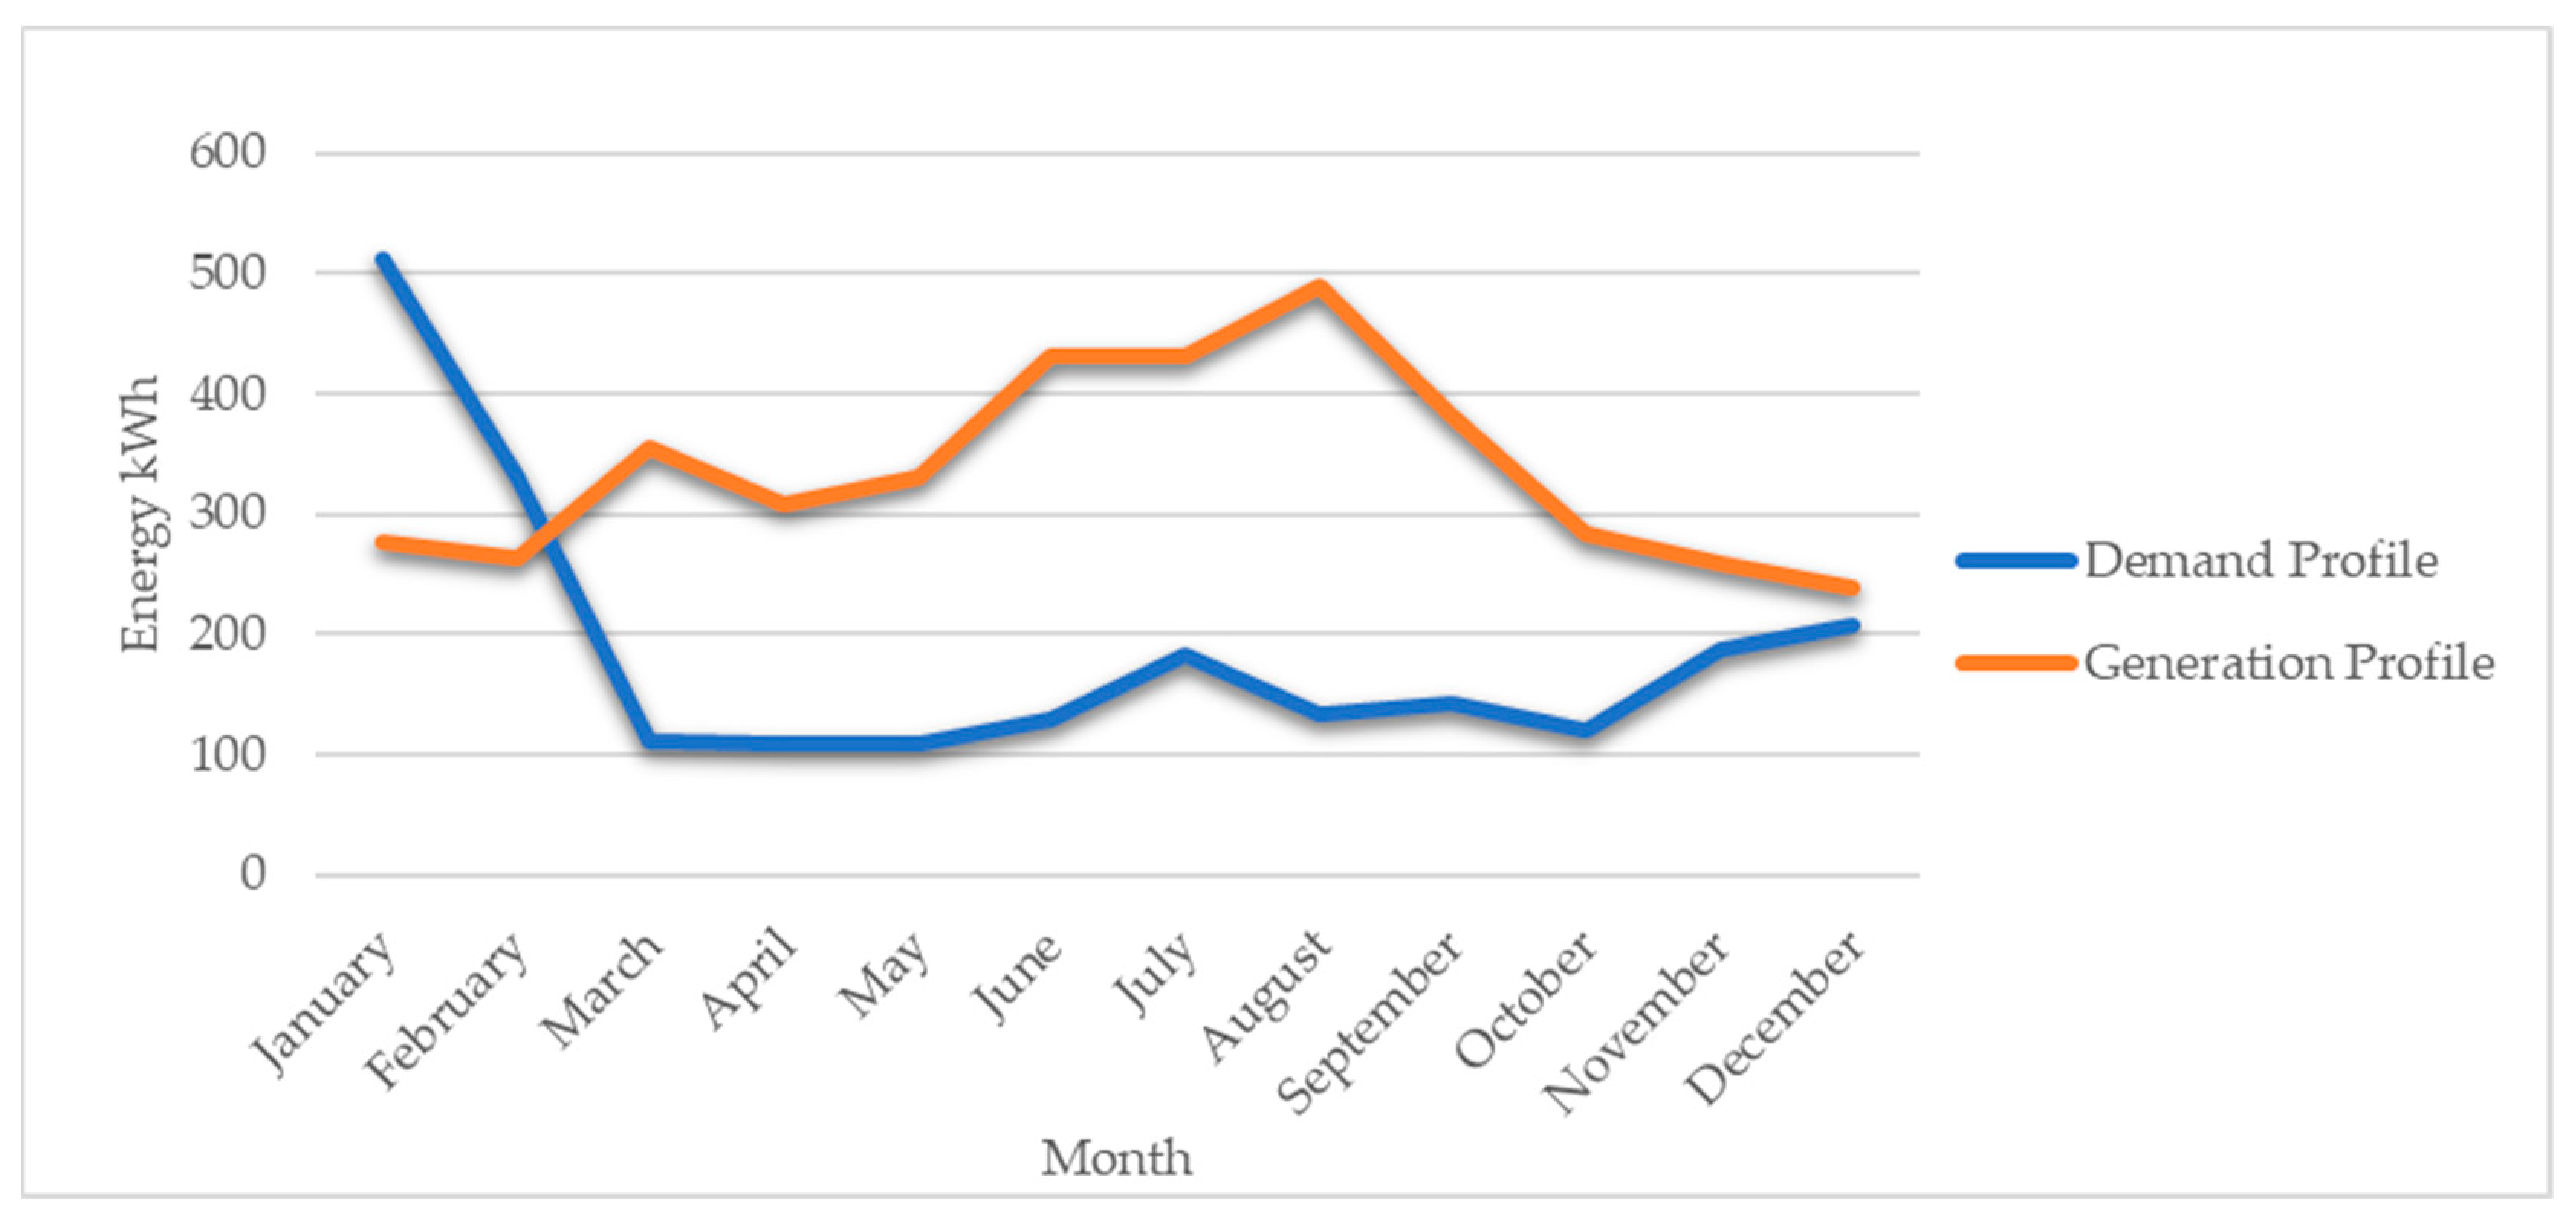
- Synthetic Load Profile: Represents the hourly electricity demand of the small domestic consumer. The Synthetic Residential Load Electricity profile is composed of a continuous and a discontinuous load profile. The input parameters are based on historical demand, the consumer’s usage preferences associated with their household equipment, the time range of use, and the flexibility of use (whether they are willing to consume the energy package at other times of the day).
- Renewable Generation Profile: This input provides an hourly data vector with 8760-values of the annual electricity generated with the home renewable system. Renewable generation depends on the solar radiation of the location and the characteristics of the photovoltaic solar installation.
- o
- Weather Conditions: Temperature and solar radiation parameters are used to calculate the power generator with photovoltaic panels.
- o
- Characteristics of the PV installation: Technical specifications of the whole photovoltaic system (number of panels, inverter, wiring, etc.).
- Storage system: Represents the technical characteristics of the battery storage system and main parameters such as the state of charge, depth of charge, and storage capacity.
3.2. Dispatch Strategies
3.2.1. Self-Consumption Dispatch Strategy
3.2.2. Economic Dispatch Strategy
3.3. Output Parameters
- Energy Cost Savings—ECS (€): Cost savings in the electrical energy purchased from the grid. It compares the cost of purchasing all the customer´s energy needs from the grid with the energy purchased from the grid when the prosumer manages their energy resources, including the home renewable energy system, battery storage system, and load management resource.
- Renewable Energy Coverage—REC (%): It represents the degree of energy independency of the customer from the grid. It represents the energy coverage of the customer’s electricity demand with the energy produced by the renewable energy.
- Cost of the total electricity purchased , (€)
- Revenue of the total electricity sold to the market (€)
- Total electricity purchased from the grid (kWh)
- Total electricity delivered to the grid (kWh)
3.4. Output Calculation Methods
3.4.1. Calculation of Energy Cost Savings (ECS)
- They are moved to times set by the consumer when the battery is available.
- In the Economic Dispatch Strategy, the condition that they are transferred to the most economical hour (in the off-peak period) is added.
3.4.2. Calculation of Renewable Energy Coverage (REC)
3.4.3. Supplementary Terms
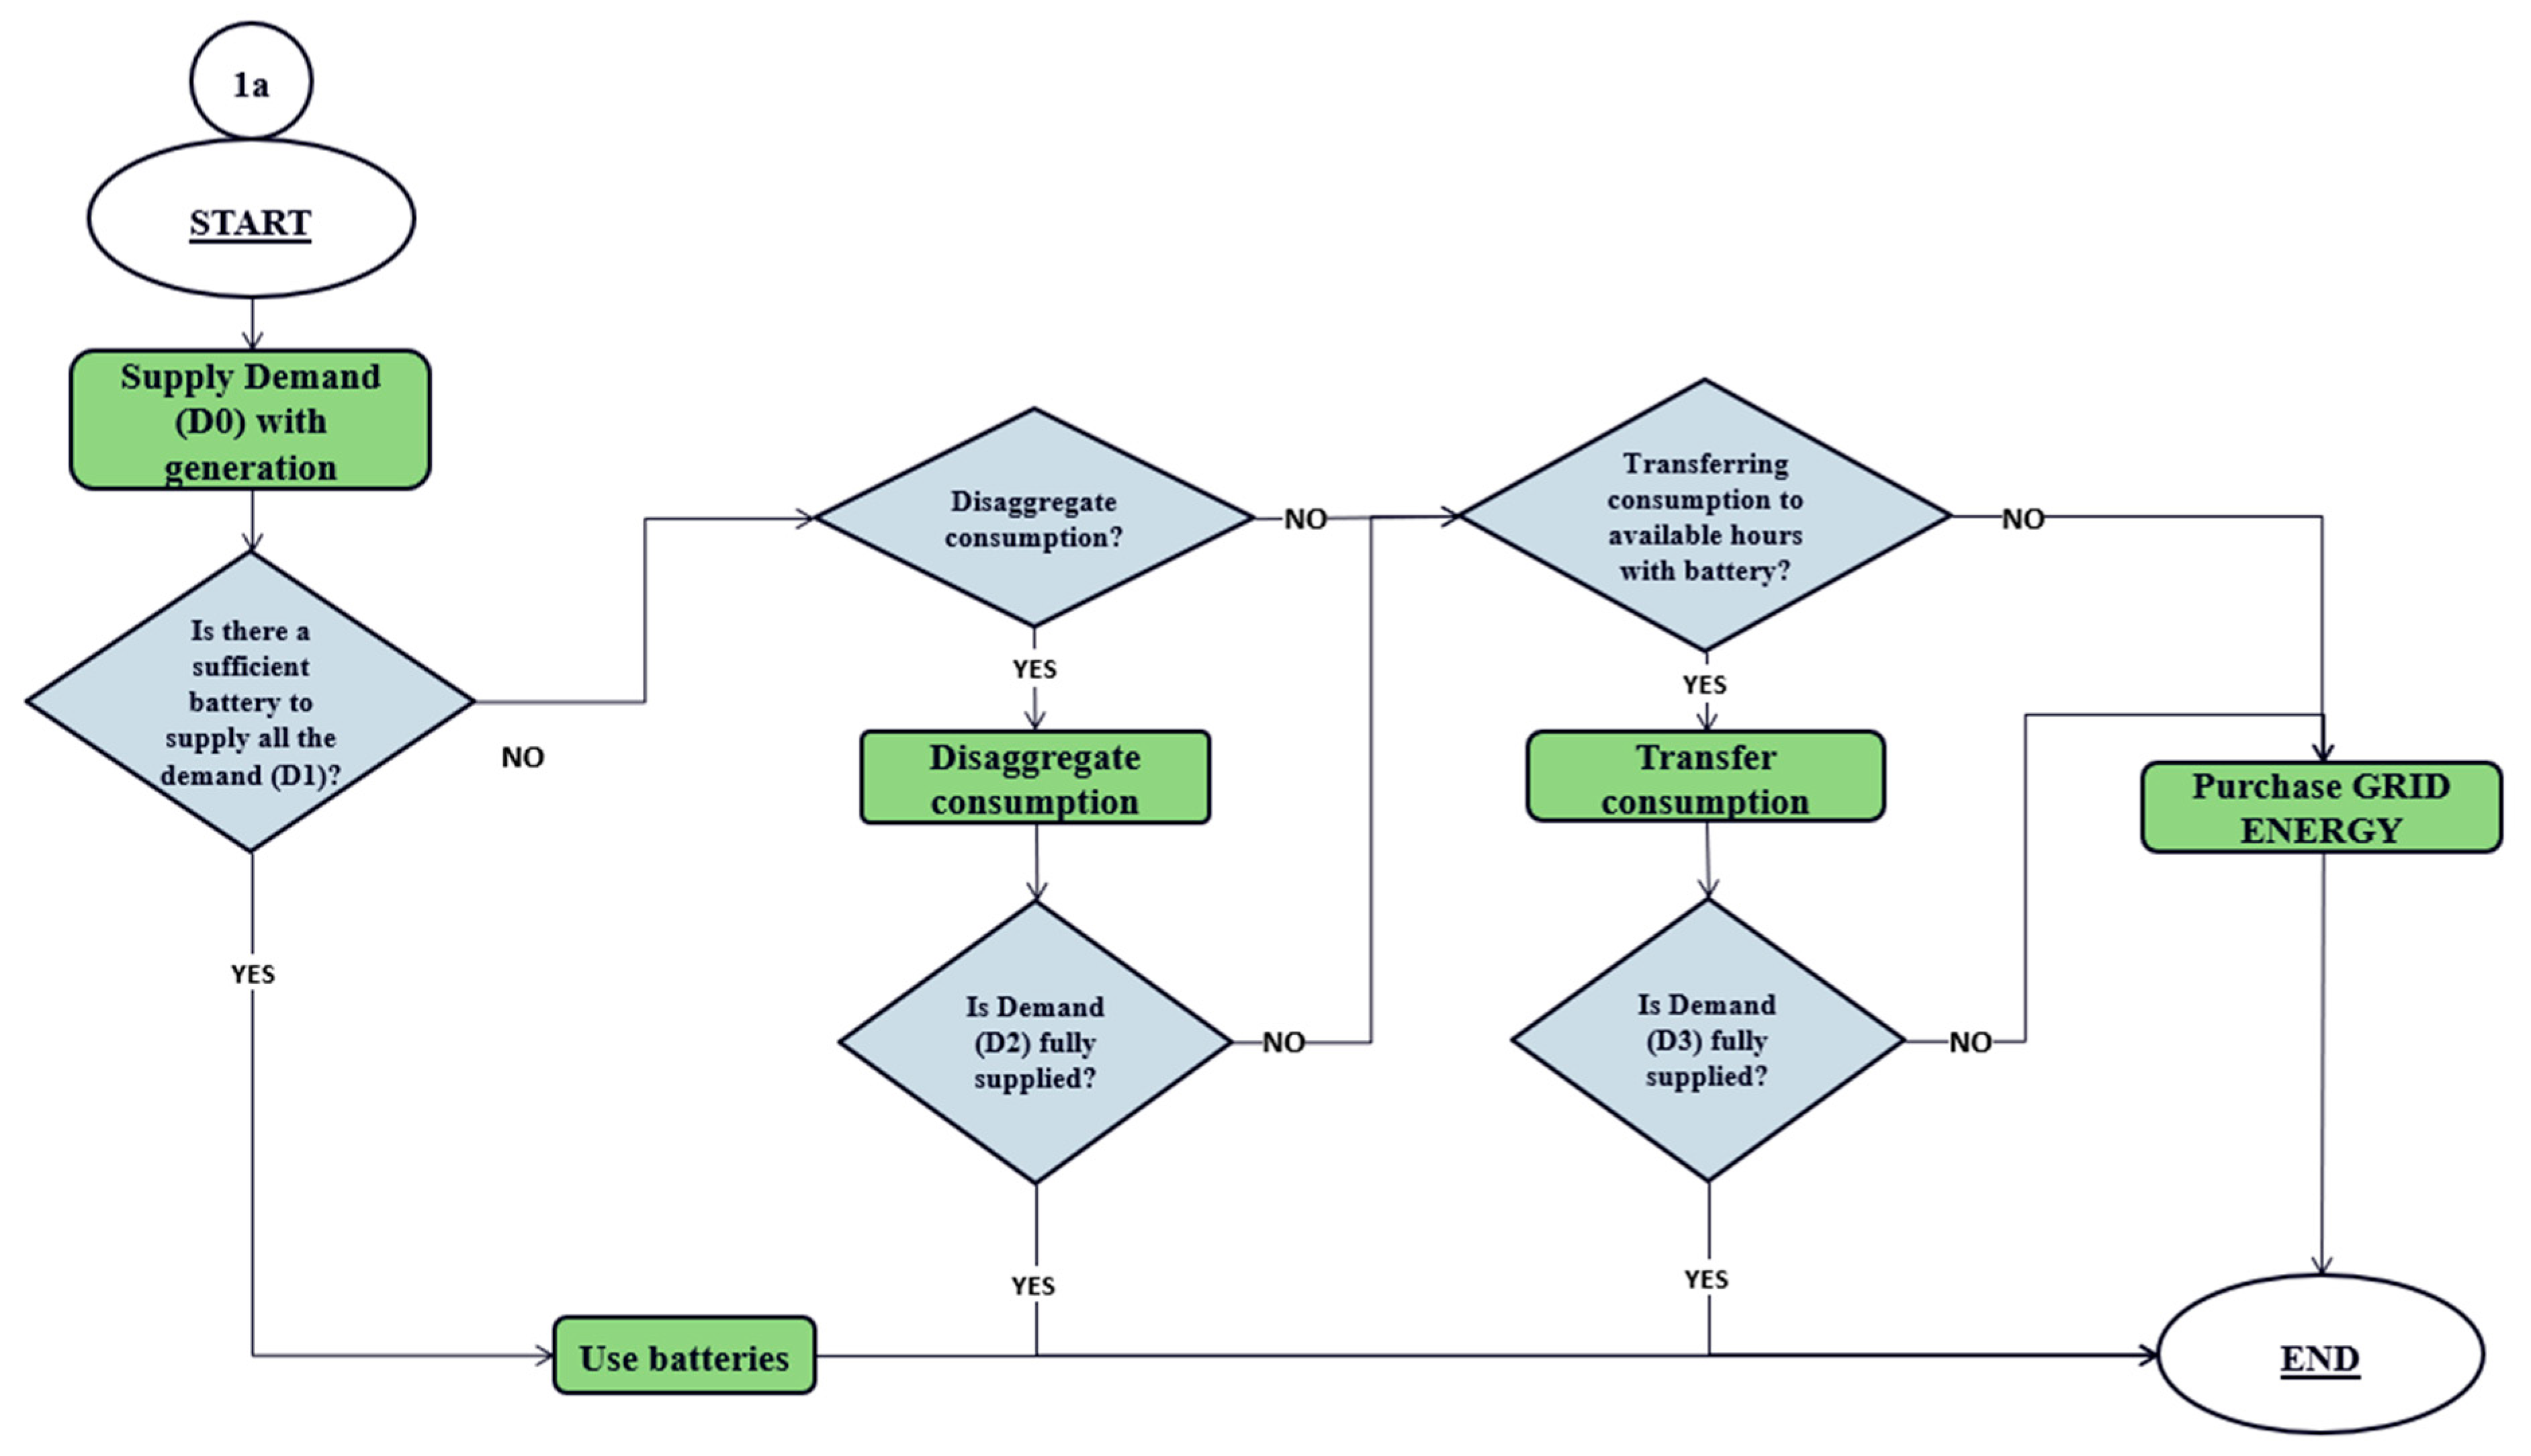
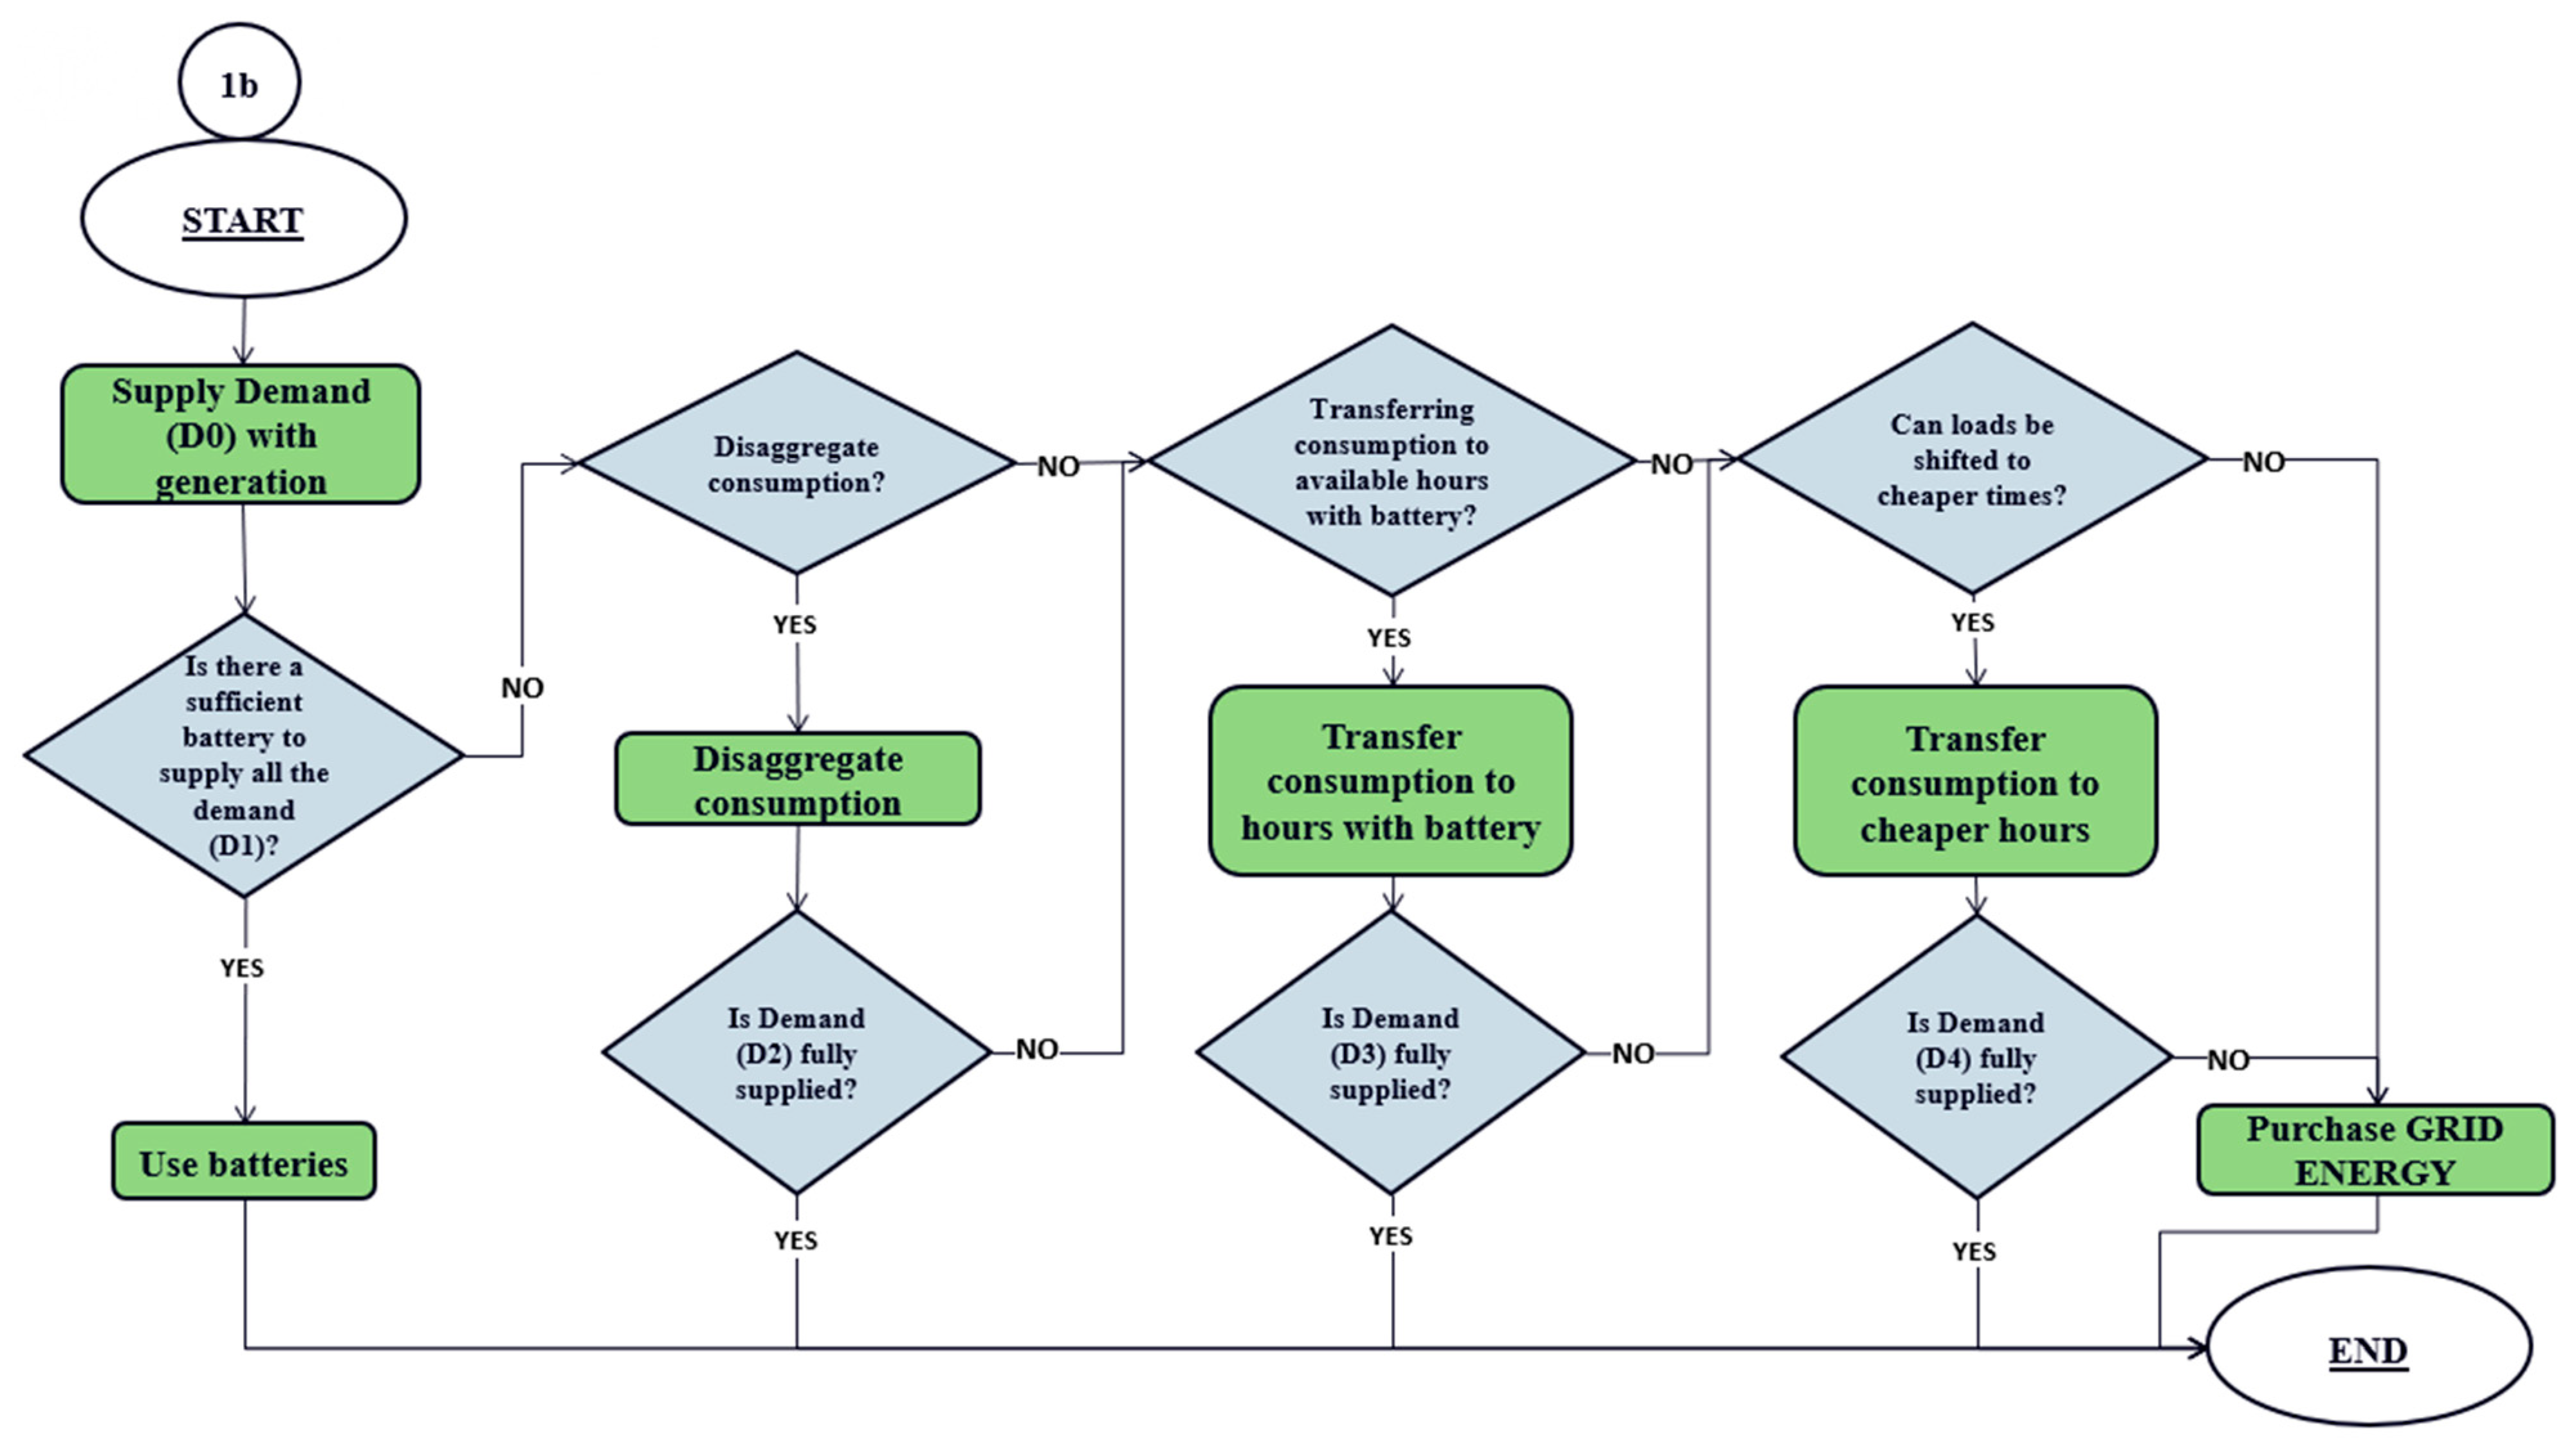
- Disaggregate (: This strategy is common to both Dispatch Strategies (self-consumption and economic). It states that if it is not possible to supply all the demand for an hour i, the battery will supply those devices j in order according to the priority k given by the user, until the maximum available battery is used.
- Load transfer : This action is also applicable to both Dispatch Strategies and is implemented after the disaggregation one. If devices have not been supplied due to lack of battery power, they can be moved to hours when battery power is available. This is conducted based on the user´s load priorities.
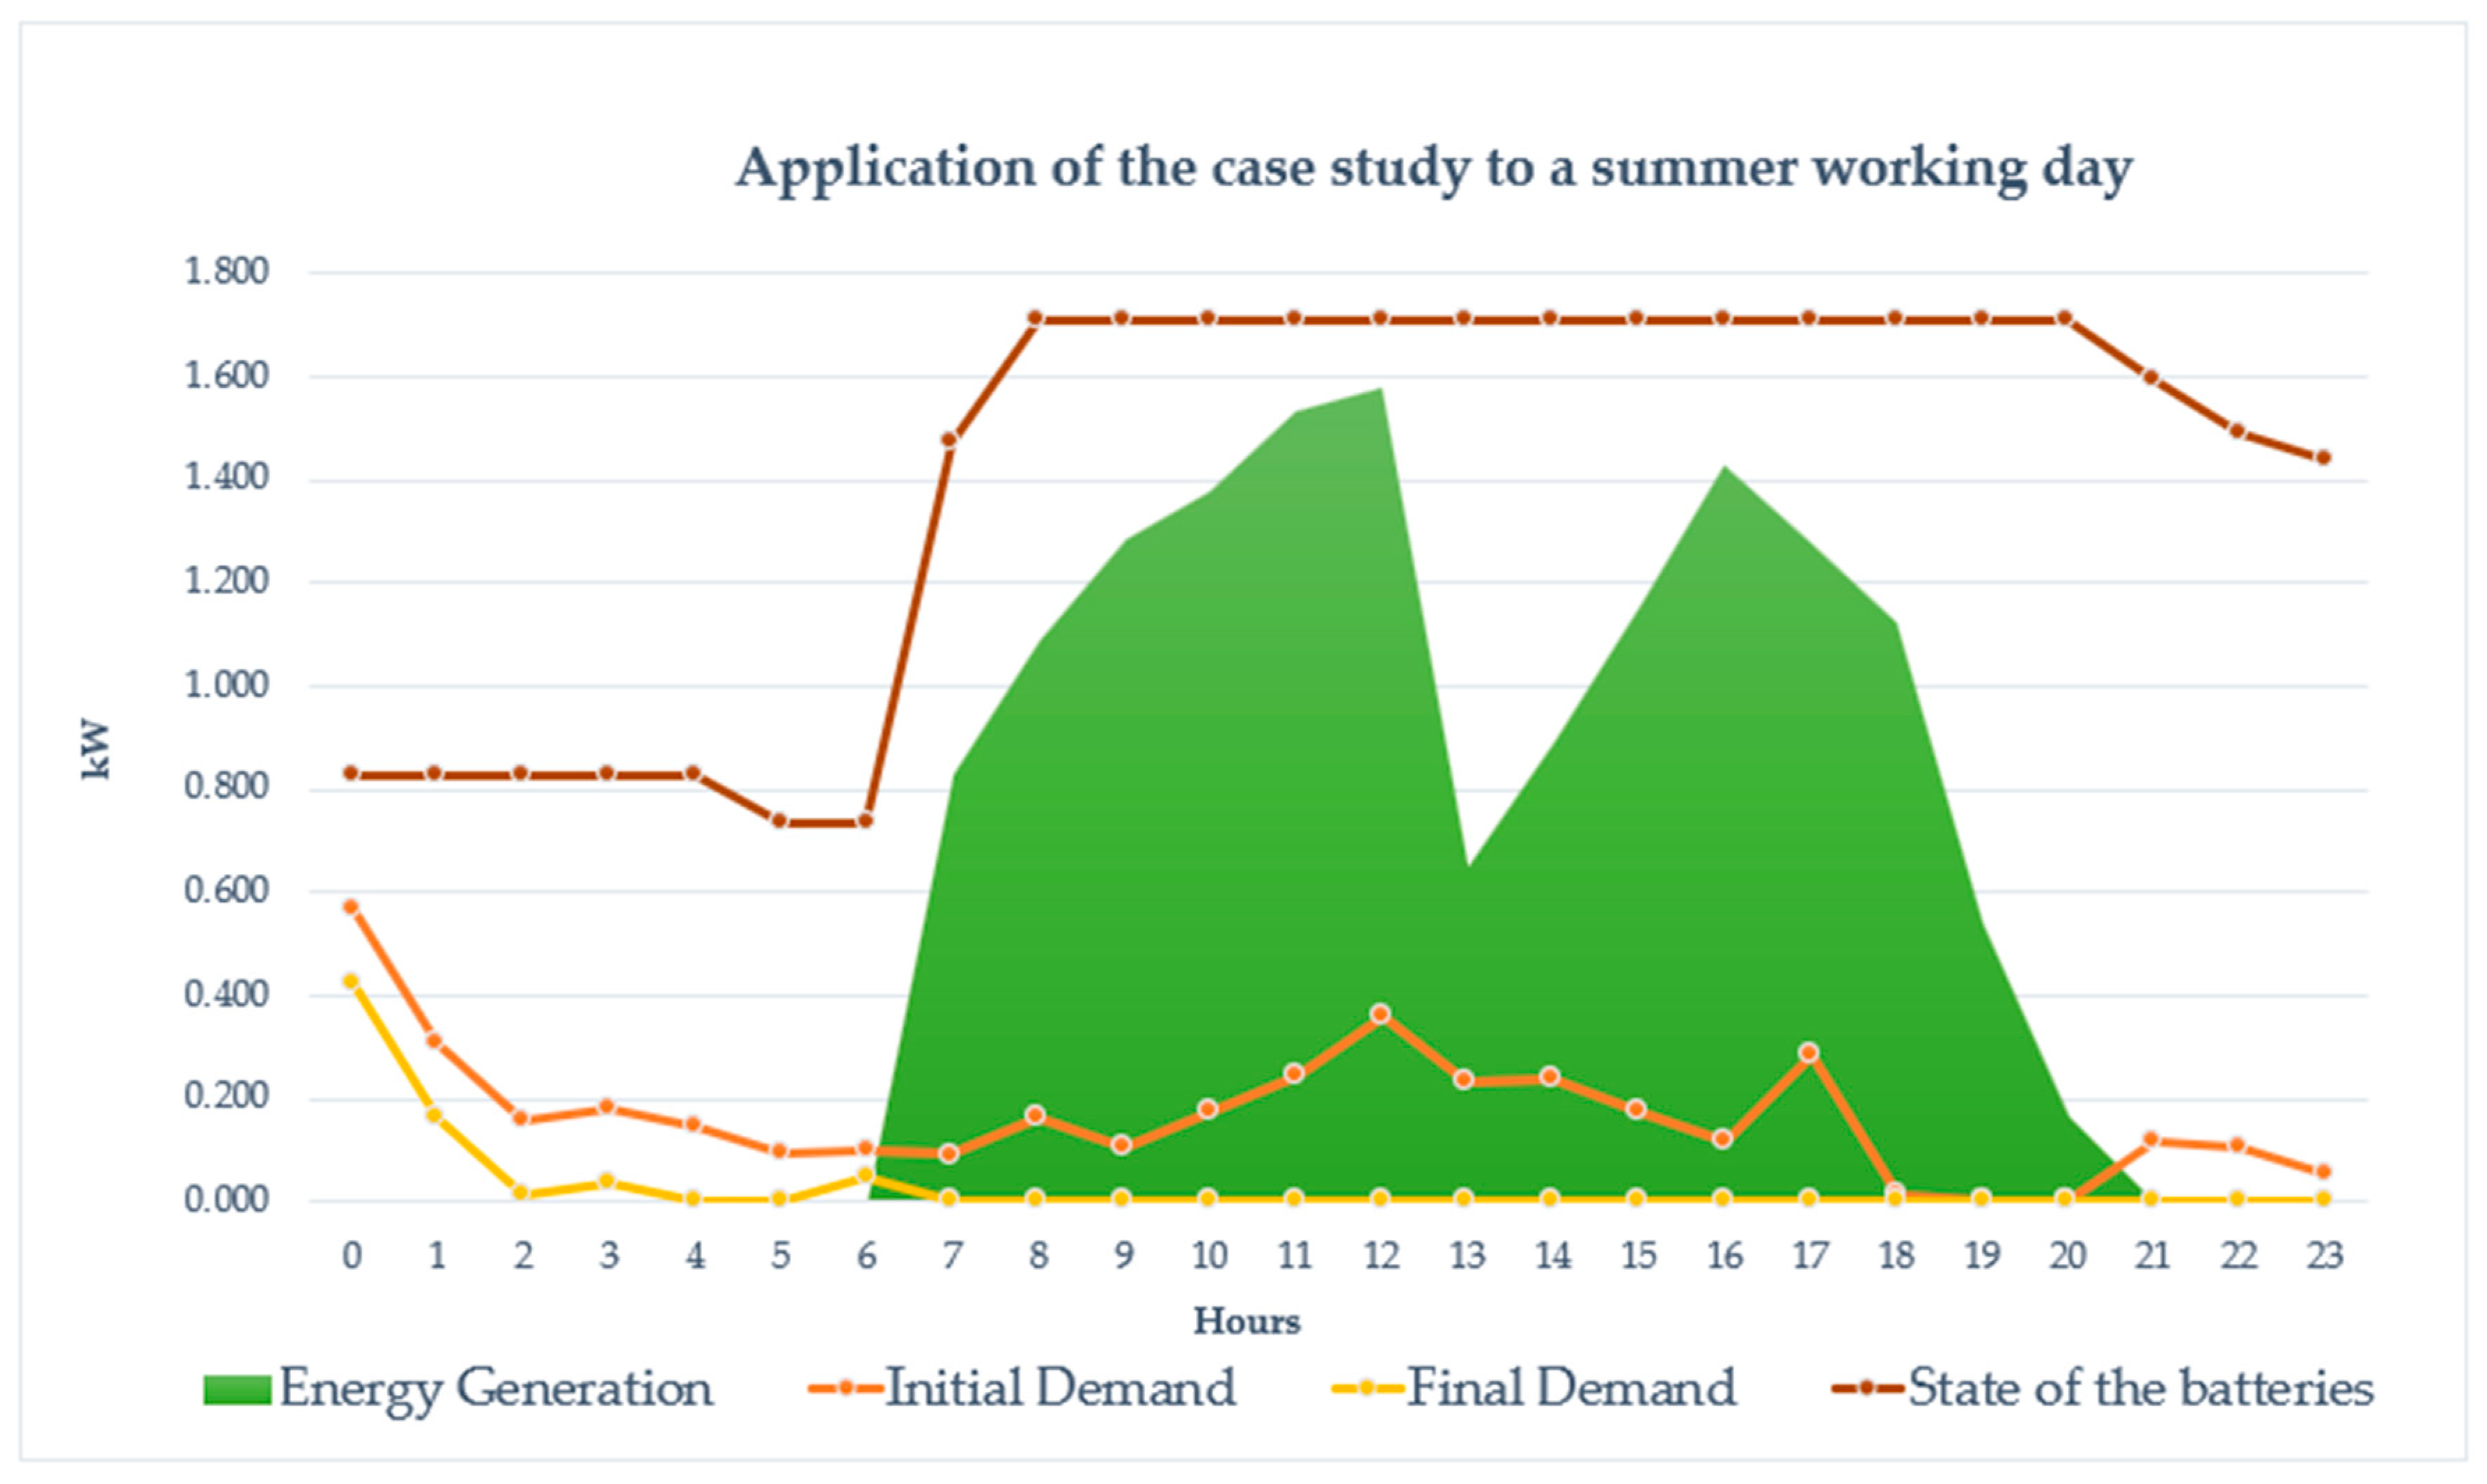
3.5. Case Study
4. Results
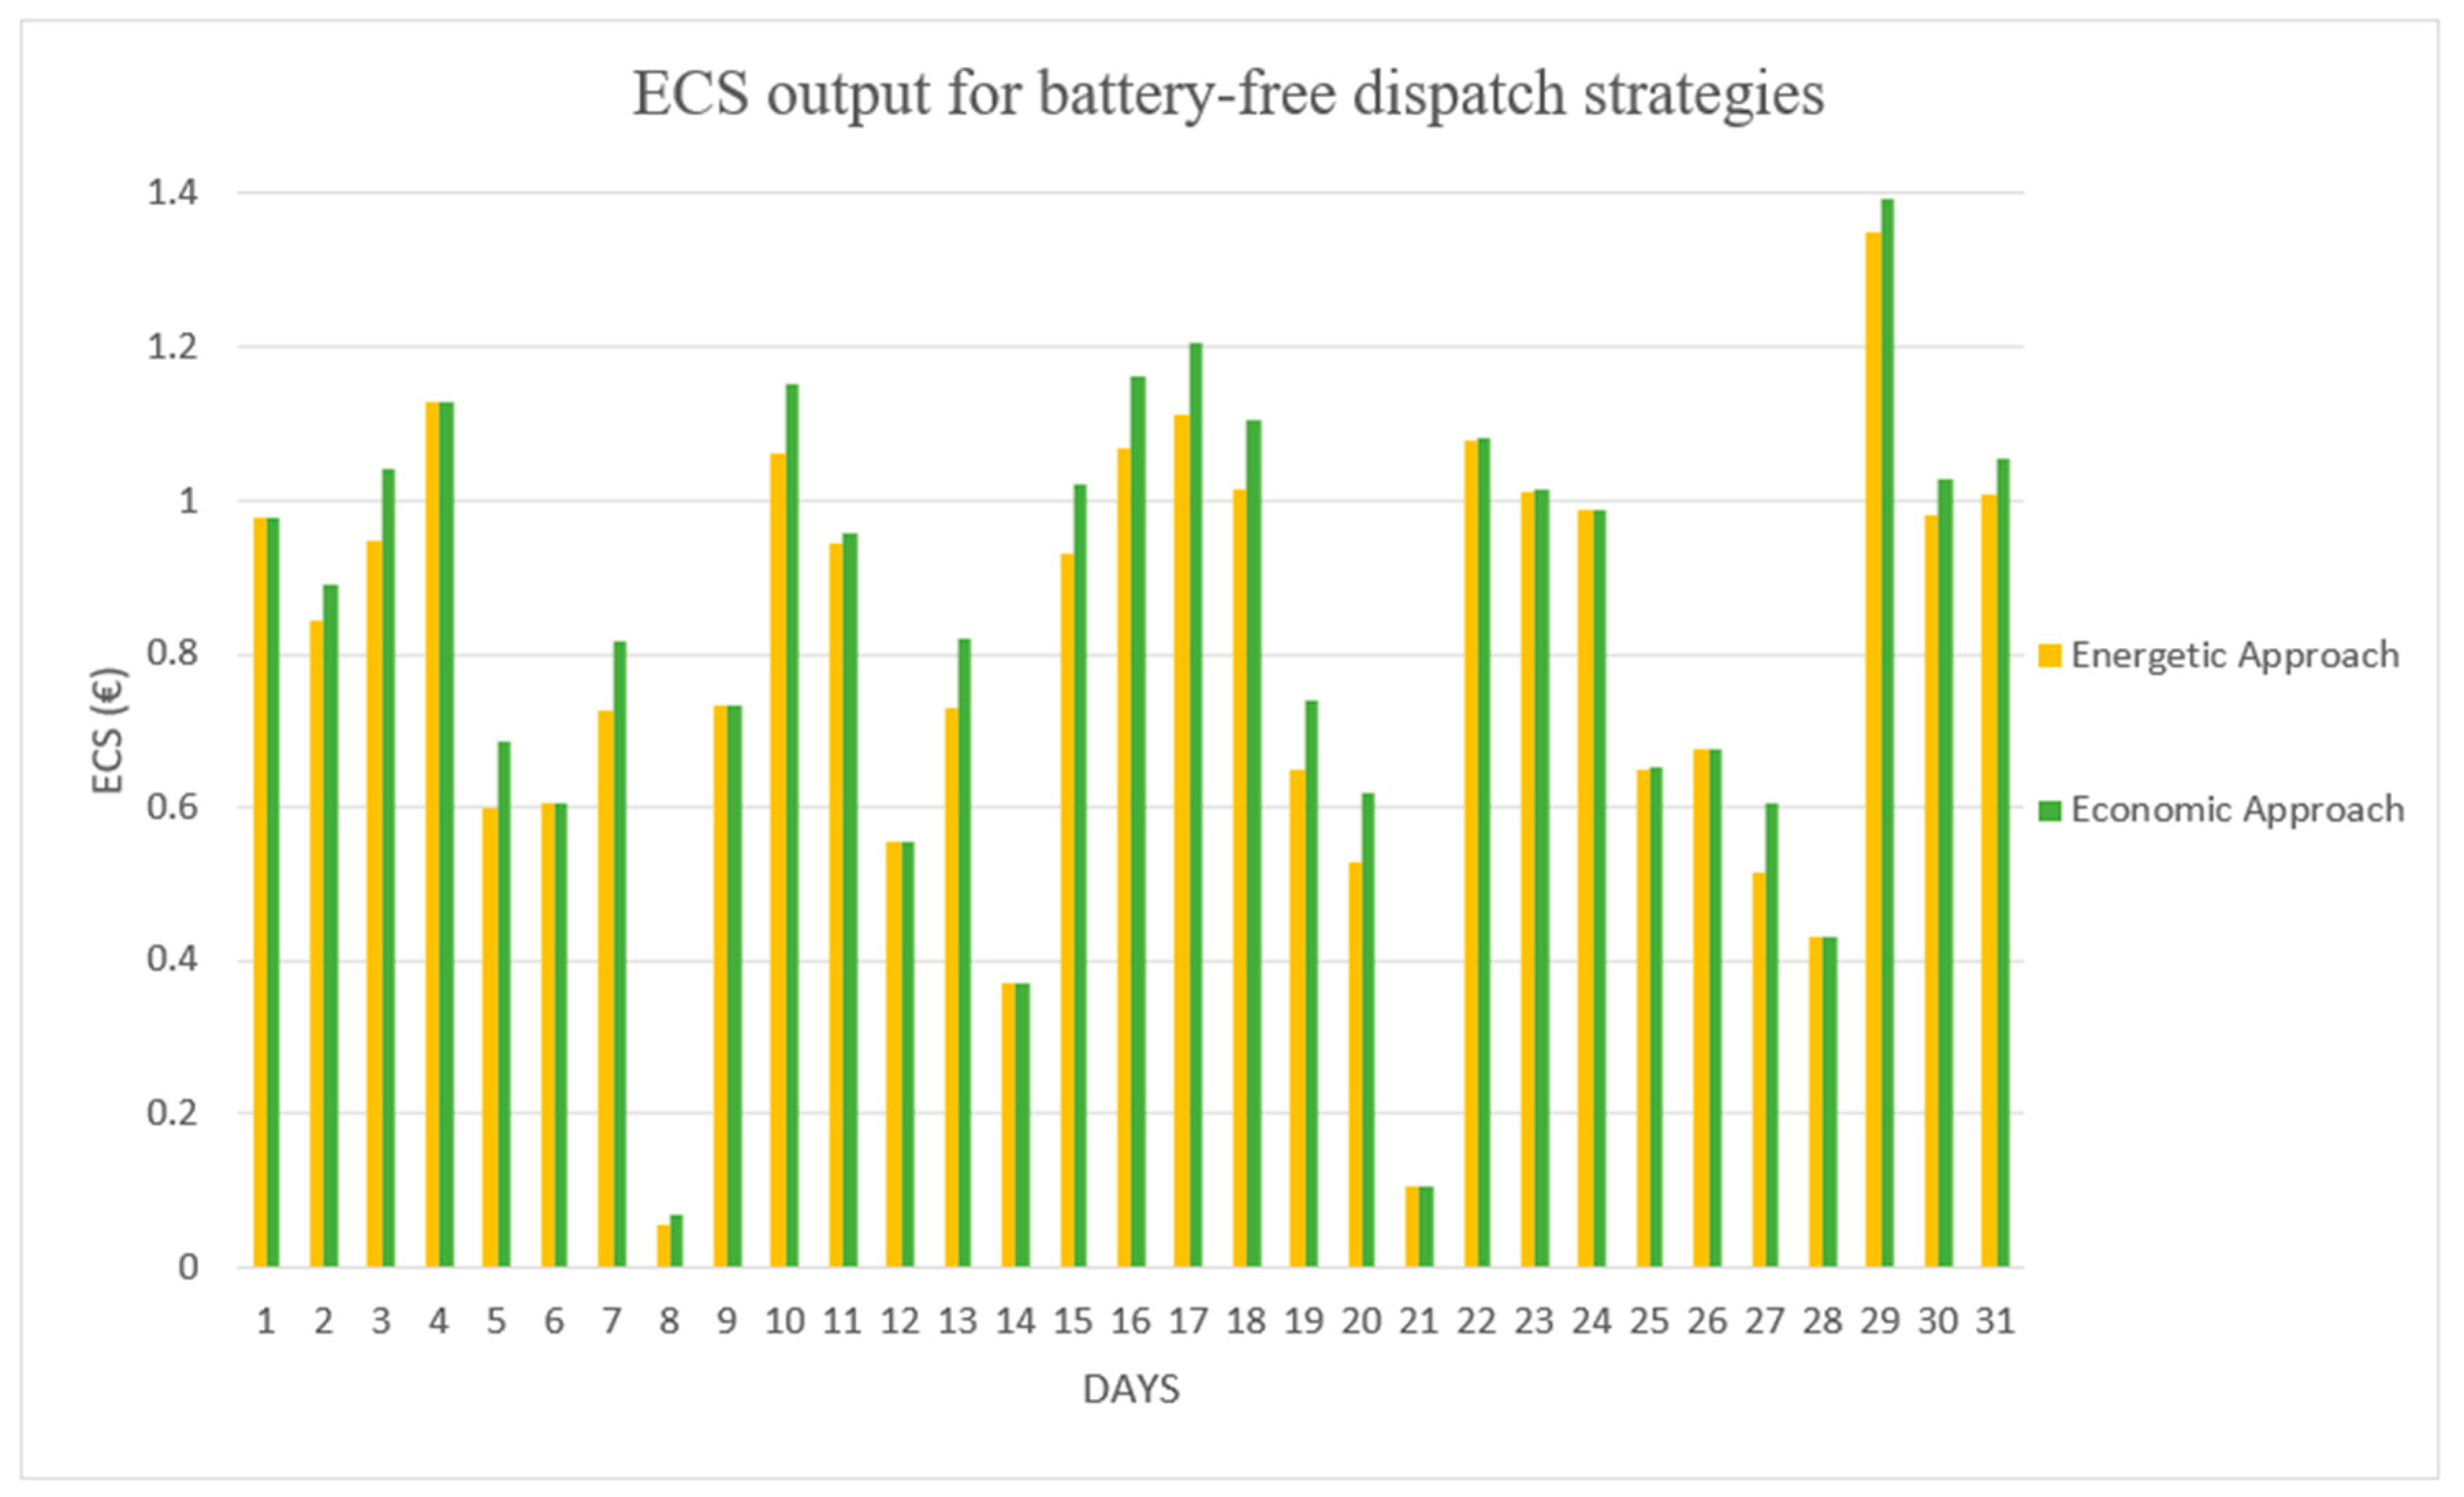
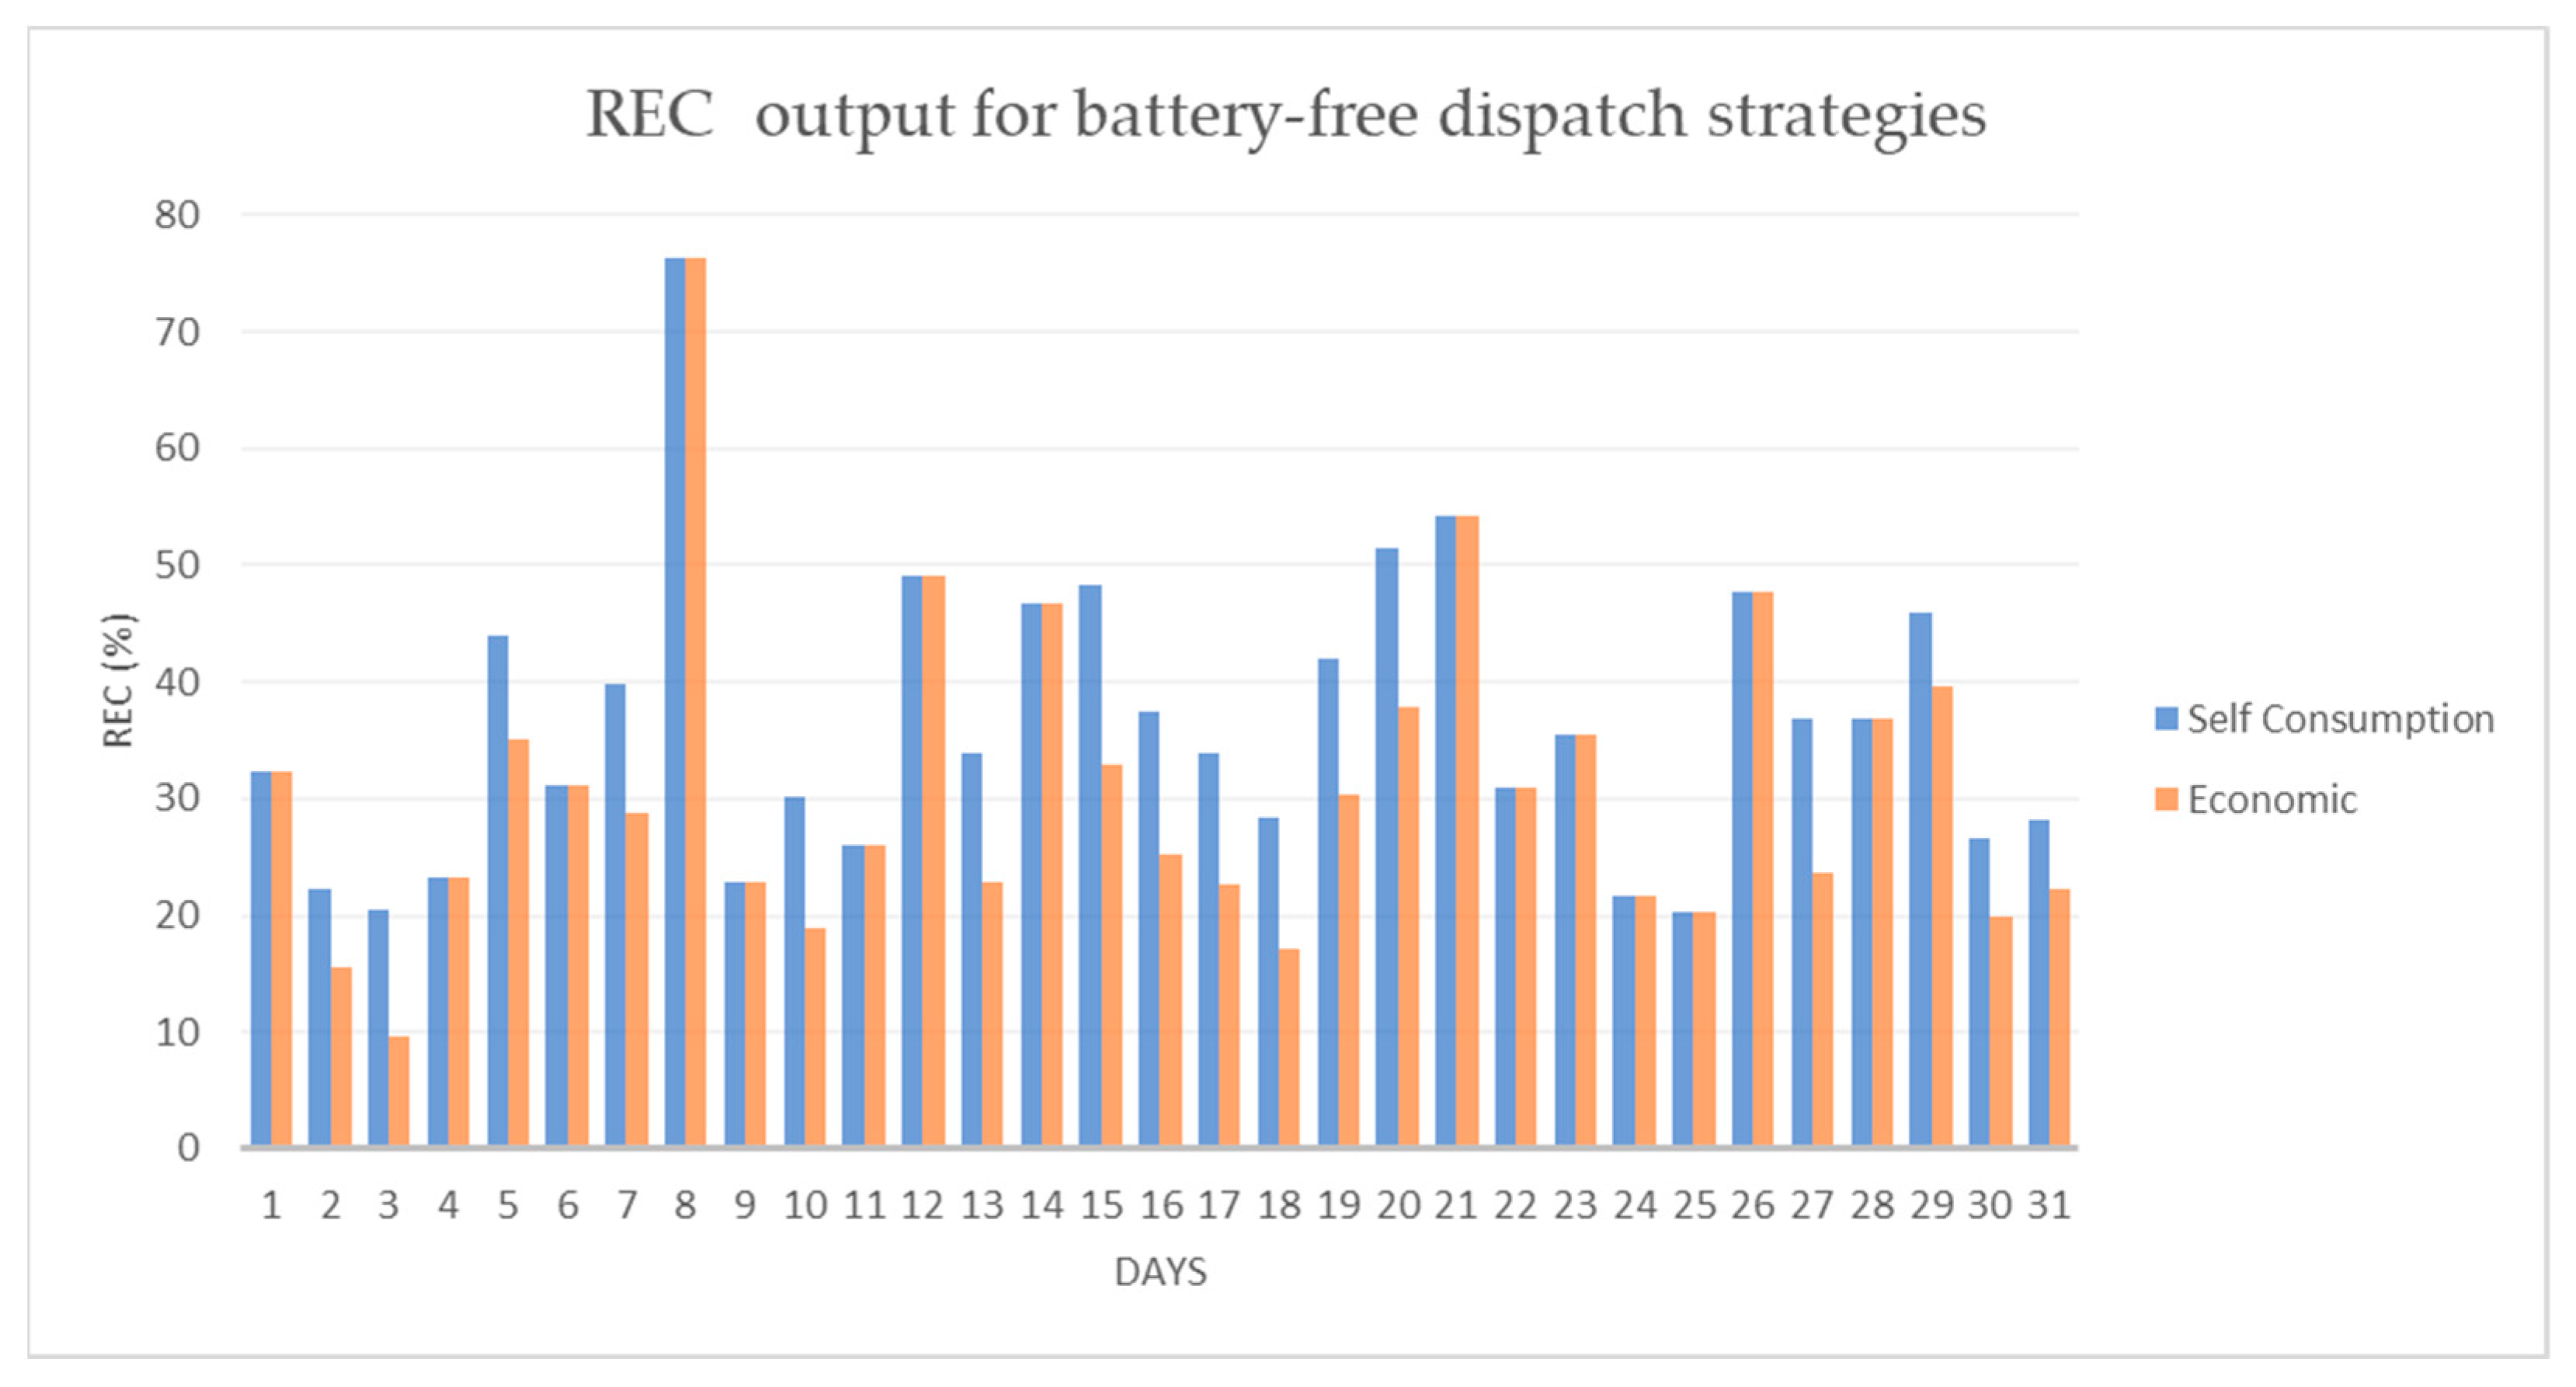
4.1. Case Study without Batteries
- Energy Cost Savings (ECS) (€): Average economic savings of about 20€ per month are achieved. The economic dispatch strategy presents slightly higher economic savings than self-consumption since it prioritises the transferability of loads to cheaper hours and the sale of energy excess.
- Renewable Energy Coverage (REC) (%): The annual percentage of demand covered by renewable energies is higher than 30% for both criteria, but slightly higher for the self-consumption dispatch strategy since, by introducing secondary consumption, the demand supplied with generation is higher.
- Cost of the total electricity purchased (€): The total energy purchase is about 18€ per month on average, a little higher in the self-consumption strategy because the loads are not shifted to more economical periods.
- Revenue of the total electricity sold to the market (€): This term refers to revenues obtained from the sale of energy. For the economic dispatch strategy, the revenue is equivalent to about 15€ per month. It is slightly lower for the self-consumption strategy. The main difference between the two strategies is that the economic strategy injects all the surplus into the grid, while the self-consumption strategy previously supplies secondary consumption.
- Total electricity purchased from the grid (kWh): This term is provided in terms of energy to be aware of the energy consumed. As can be seen, for both strategies, it is the same value because the demand supplied in terms of energy with respect to the base demand is the same (does not consider secondary consumption).
- Total electricity delivered to the grid (kWh). The energy injected into the grid is superior for the economic strategy since the surplus is not used to supply secondary consumption.
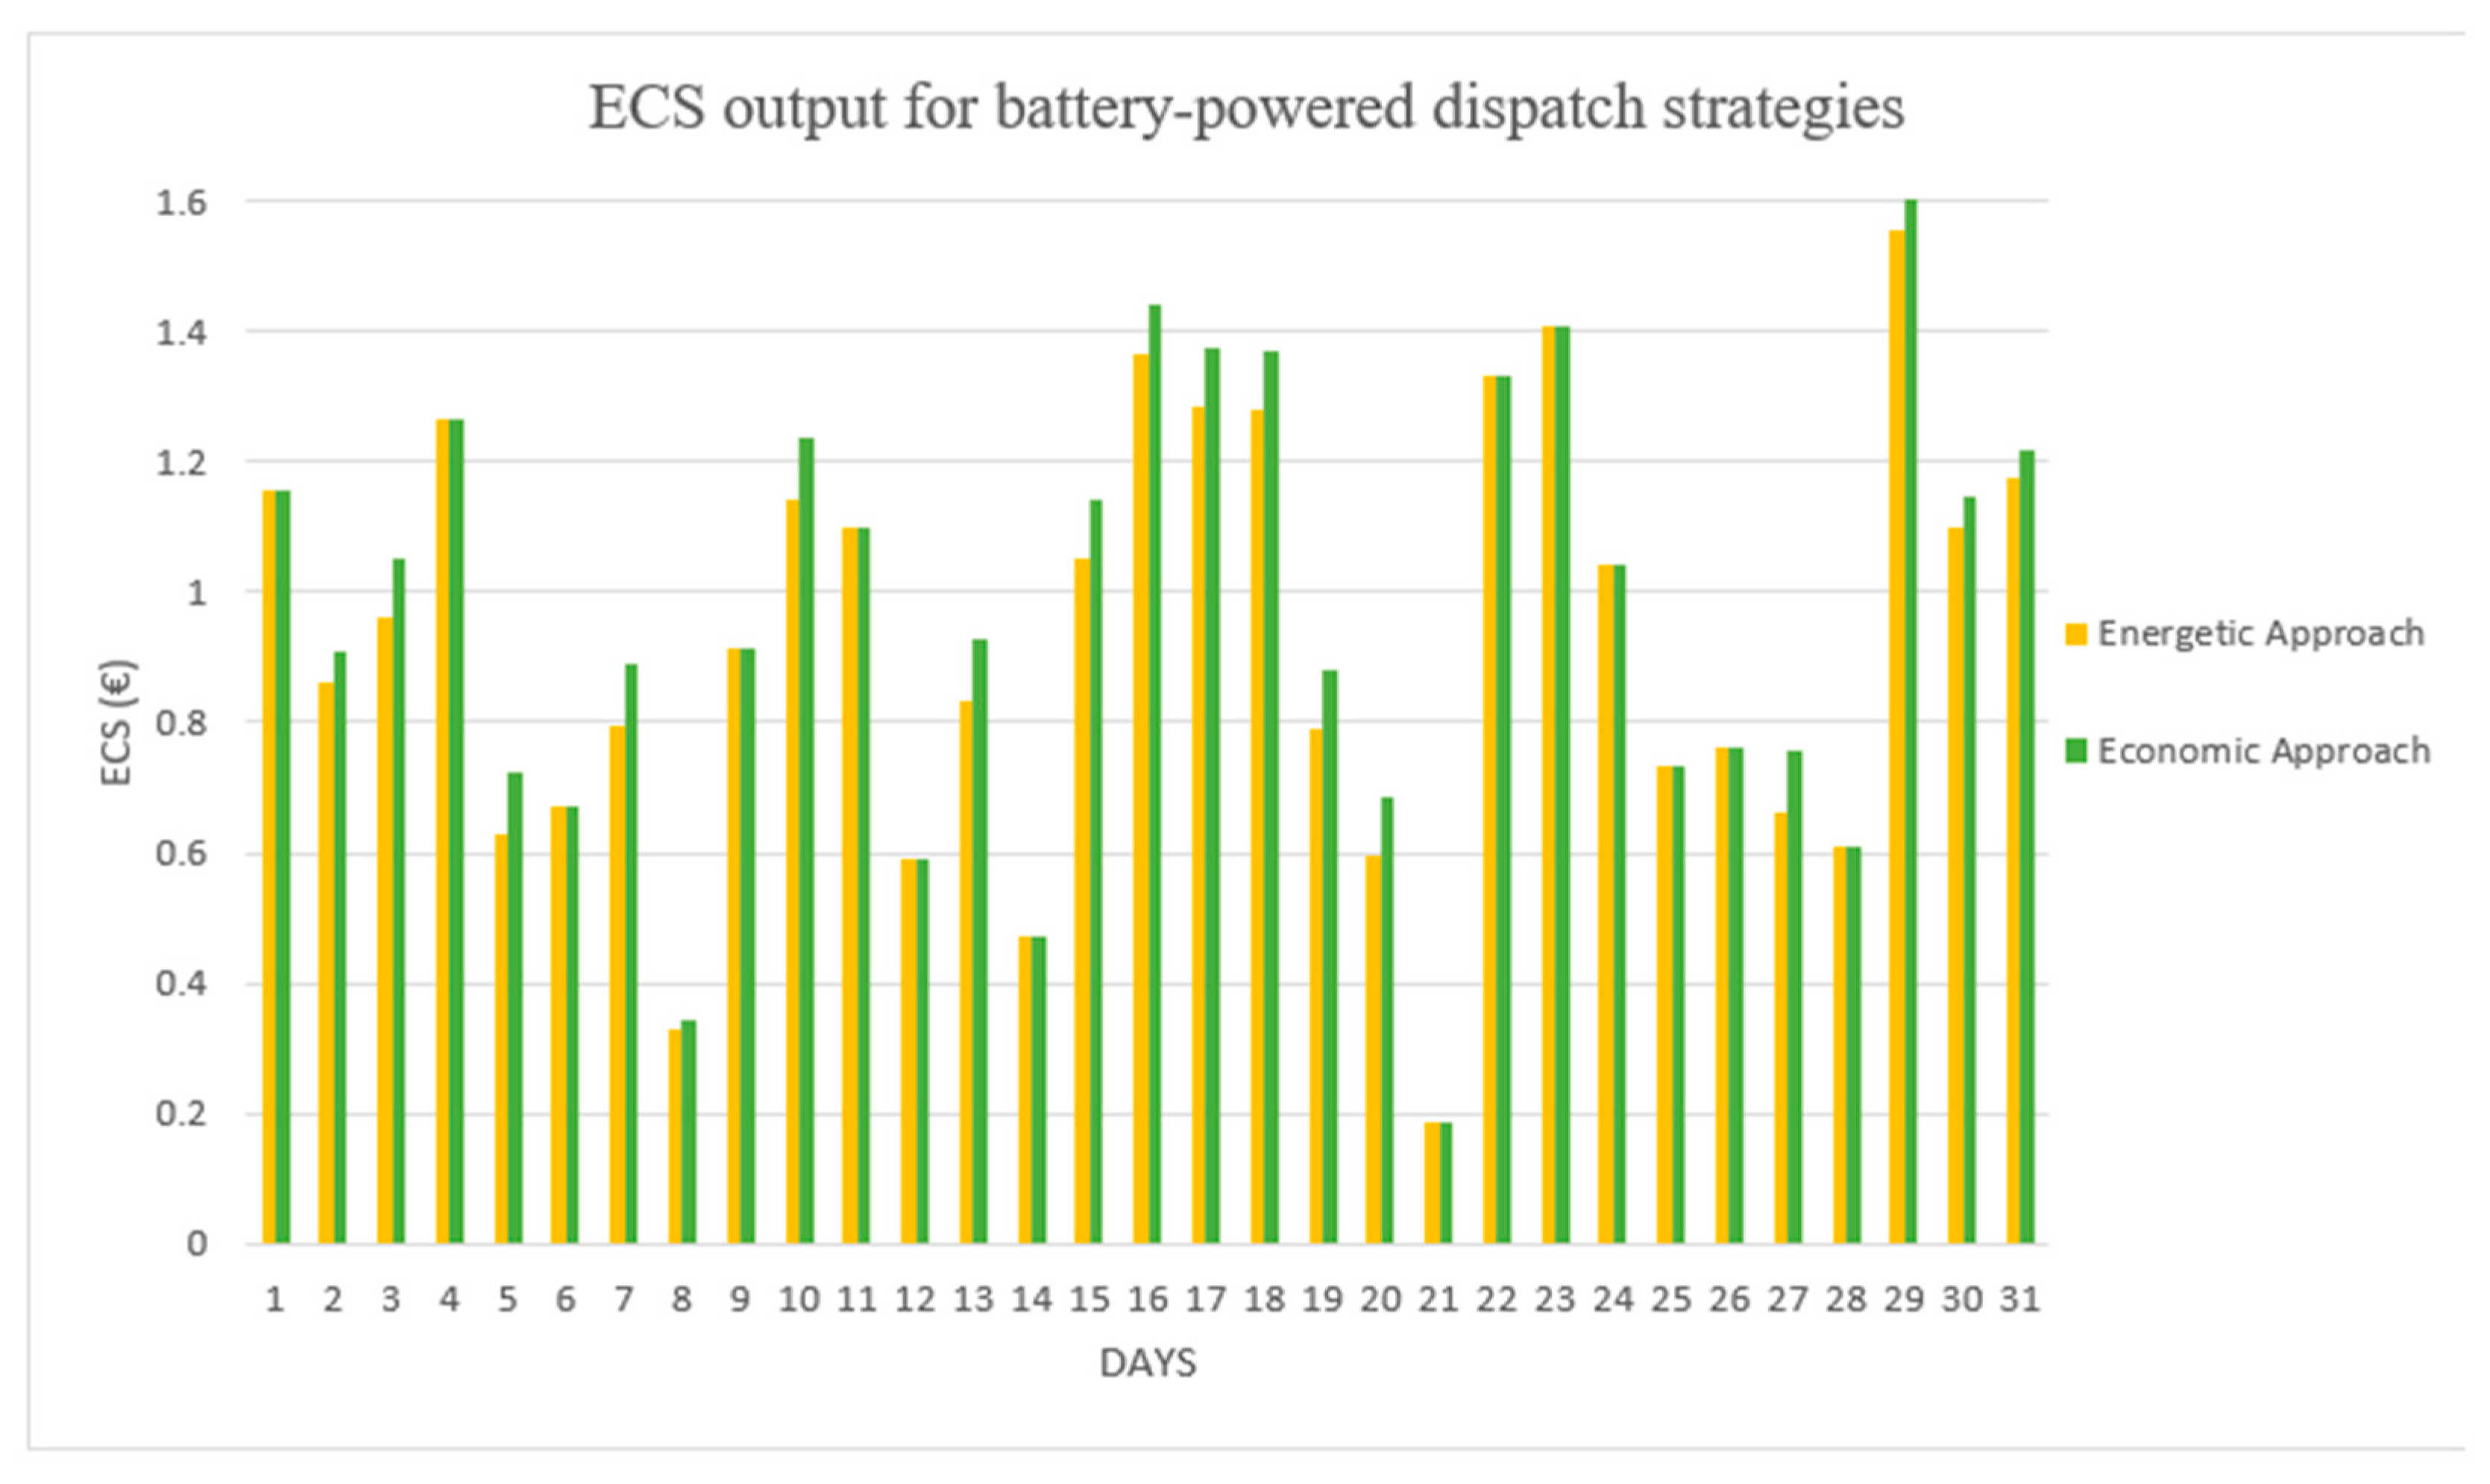
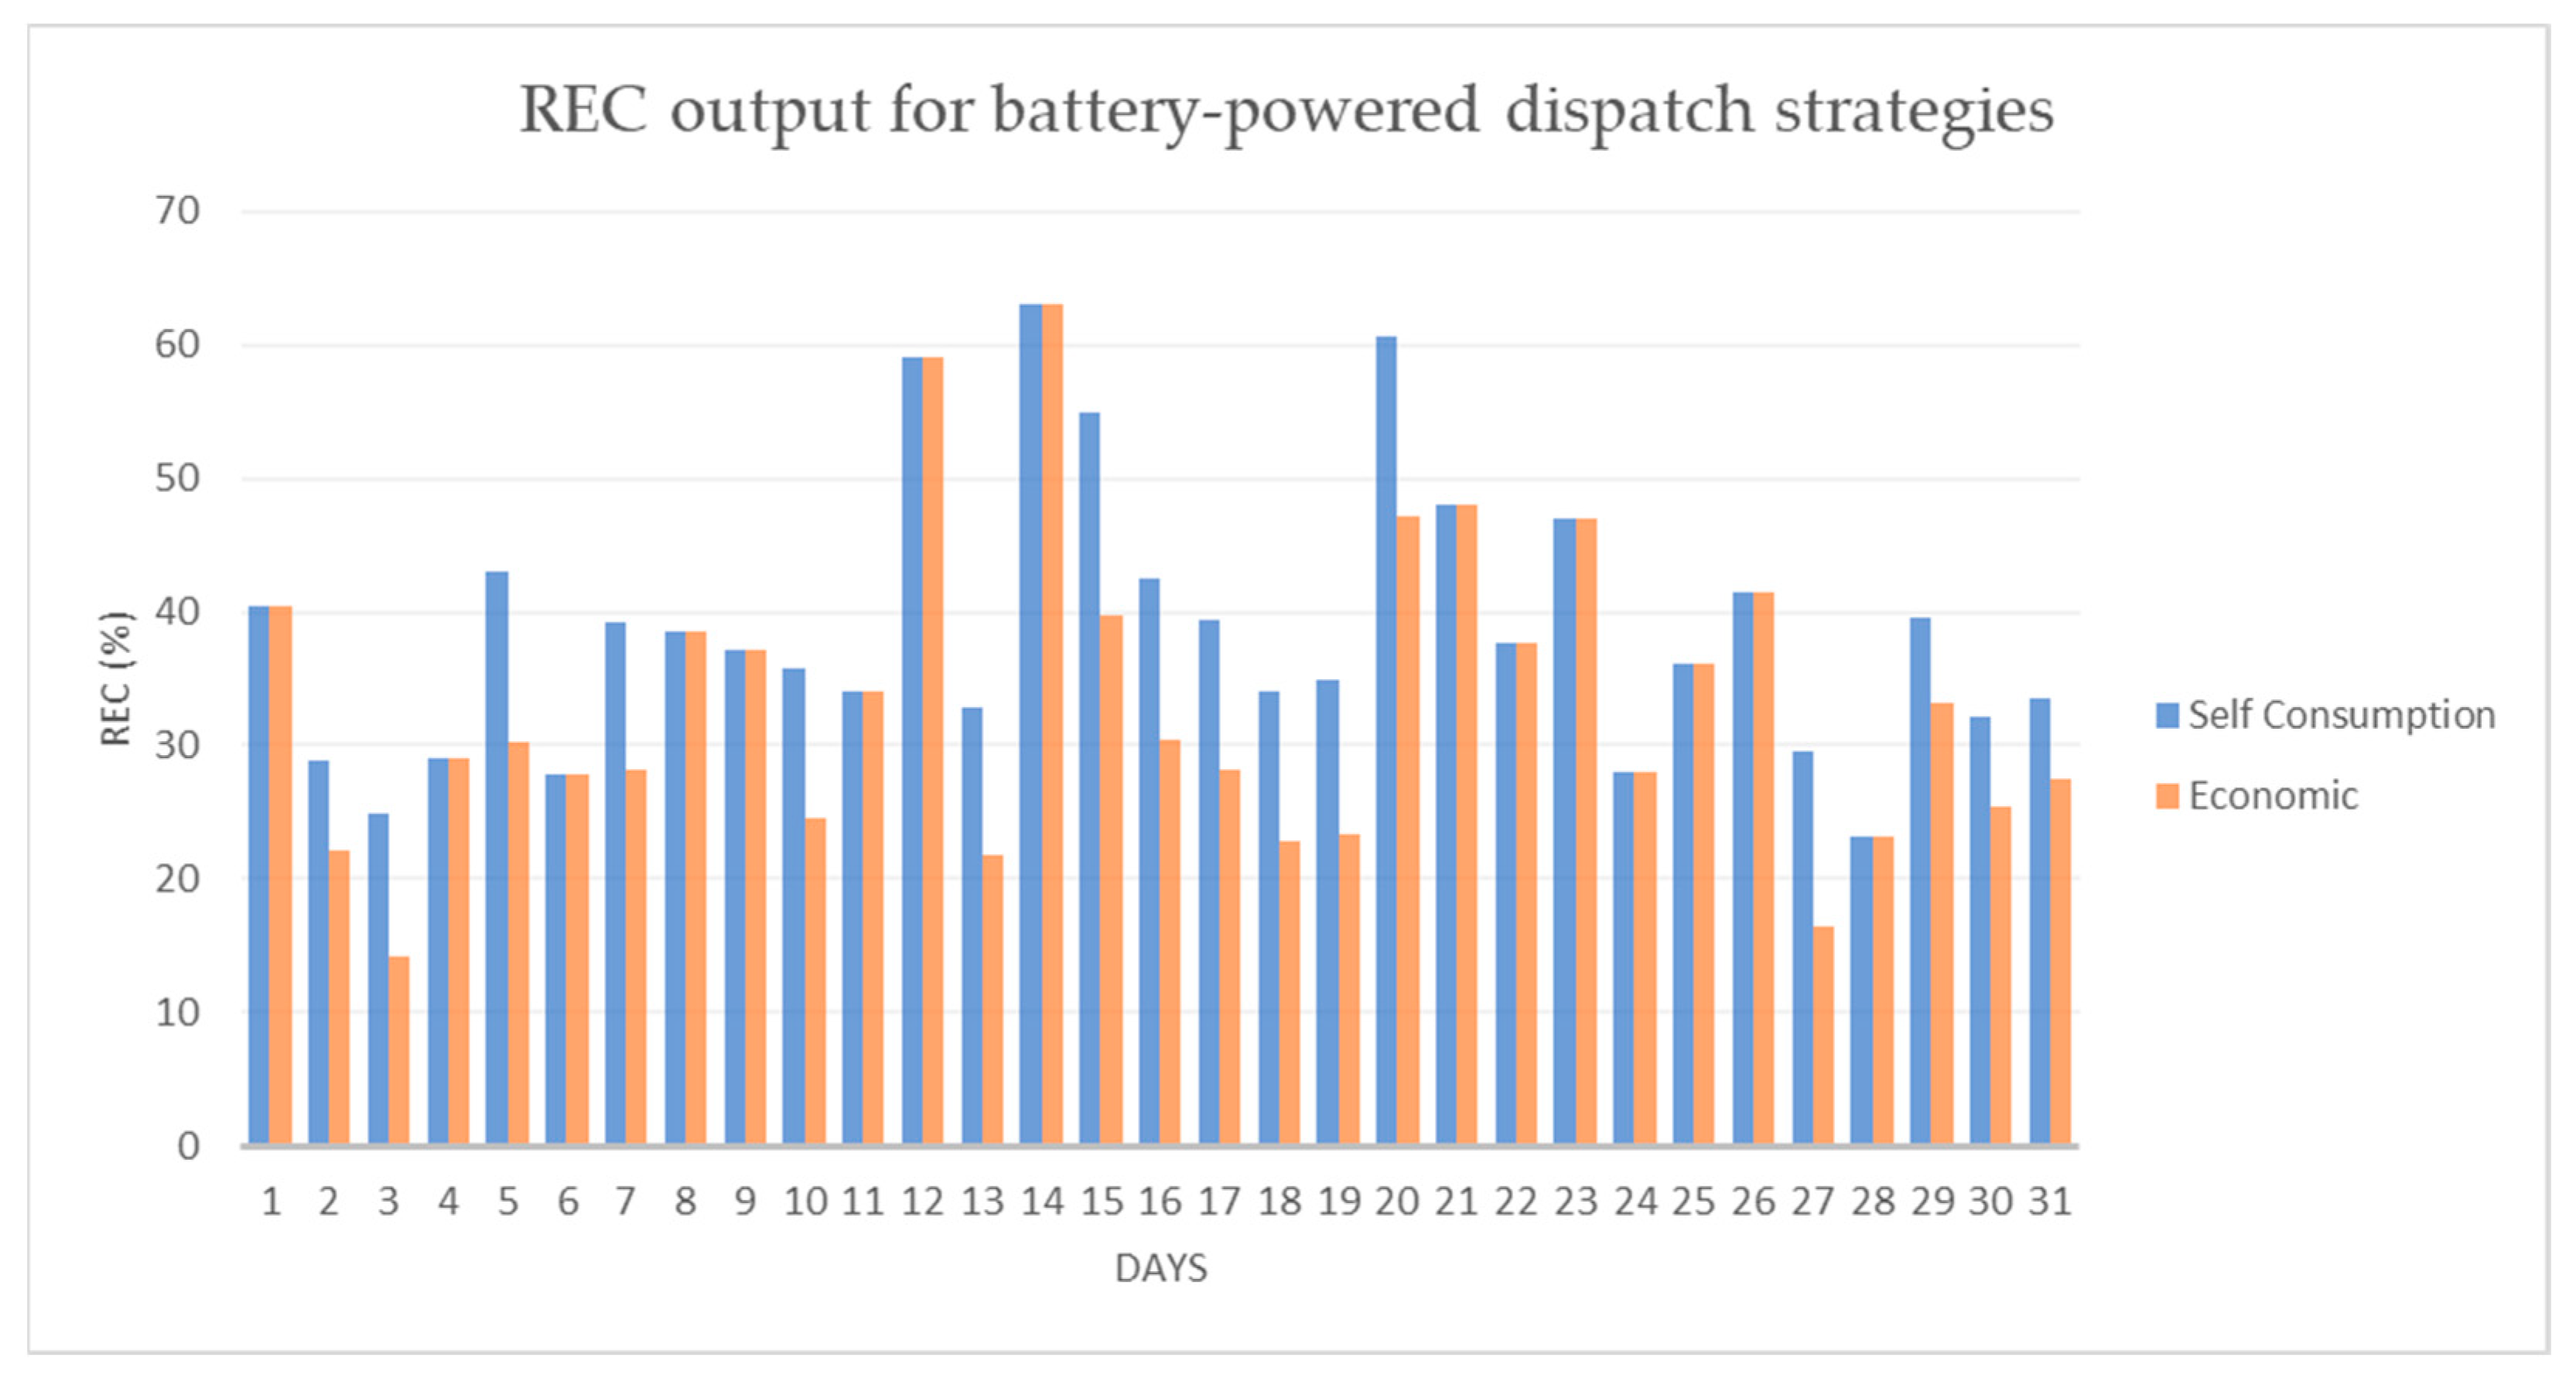
4.2. Case Study with Batteries
- Energy Cost Savings (ECS) (€): In this case, economic savings are equivalent to about 24€ per month on average, i.e., about 4€ per month more than in the case without a battery. As in the previous case, higher values are obtained in the economic dispatch strategy than in the self-consumption dispatch strategy.
- Renewable Energy Coverage (REC) (%): The coverage of renewable energy over demand is 35% for both criteria, but as in the case of batteries, it is slightly higher in the self-consumption dispatch strategy.
- Cost of the total electricity purchased (€): In the case of batteries, the average monthly energy purchase is about 11€ on average for the self-consumption dispatch strategy and slightly less for the economic one.
- Revenue of the total electricity sold to the market (€): For the economic dispatch strategy, the revenue is equivalent to about 14€ on average per month, and it is slightly lower than the self-consumption strategy.
- Total electricity purchased from the grid (kWh): Demand that must be purchased because it is not supplied by renewable sources. This is identical to the case without batteries.
- Total electricity delivered to the grid (kWh): The energy injected into the grid is superior for the economic strategy, since the surplus is not used to supply secondary consumption.
5. Discussion
6. Conclusions
Author Contributions
Funding
Data Availability Statement
Conflicts of Interest
Abbreviations
| Acronyms | ECS | Energy Cost Savings indicator | |
| USA | United States | REC | Renewable Energy Coverage indicator |
| PURPA | Public Utility Regulatory Policies Act | PV | Photovoltaic |
| DSM | Demand Side Management | SLP | Synthetic Load Profile (kWh) |
| DR | Demand Response | SoC | State of Charge (%) |
| DLC | Direct Load Control | DoD | Depth of Discharge (%) |
| ESPP | Energy-Smart Pricing Plan | Equations | |
| EV | Electric Vehicle | ECS | Economic costs saved after applying the methodology (€) |
| OMIE | Iberian Energy Market Operator | REC | Demand covered with renewable energy over total demand supplied (%) |
| Final energy consumed in each hour i after applying the methodology (kWh) | Energy consumed from the battery in hour i (kWh) | ||
| Self-consumed energy from the renewable source in each hour i after applying the methodology (kWh) | Energy consumed by the secondary consumptions in hour i (kWh) | ||
| Energy delivered from the renewable source to the grid in each hour i after applying the methodology (kWh) | C0 | Cost of the energy initially consumed (€) | |
| Energy from the PV panels in each hour i after applying the methodology (kWh) | Cf | Cost of the energy finally consumed (€) | |
| Self-consumed demand in each hour i after applying the methodology (kWh) | Demand transferred from another hour and entered in hour i (kWh) | ||
| Total demand consumed in each hour i after applying the methodology (kWh) | Demand leaving hour i and transferred to another hour (kWh) | ||
| Final demand consumed in each hour i after applying the methodology (kWh) | Historical demand transferred at hour i due to j user-defined devices (kWh) | ||
| Demand transferred in hour i after application of the methodology (kWh) | |||
| Synthetic profile of the demand initially created to apply the methodology (kWh) | Minimum battery capacity (kWh) | ||
| Continuous synthetic load profile created from the user’s demand history (kWh) | Battery capacity used to supply j equipment transferred at hour i (kWh) | ||
| Total energy generated by the PV panels in each hour i (kWh) | Battery capacity used to supply j equipment transferred at hour i (kWh) | ||
| Initial energy of the battery at hour i before applying the methodology (kWh) | Parameters | ||
| Final energy of the battery at hour i after applying the methodology (kWh) | Demand 0 calculated as the difference between the real generation and the historical demand (kWh) | ||
| Variables | Maximum battery capacity (kWh) | ||
| Energy price set by the market or the trader in hour i (€/kWh) | Minimum battery capacity (kWh) | ||
| Surplus energy price set by the market or the trader in hour i (€/kWh) | Battery capacity used to supply j equipment transferred at hour i (kWh) | ||
| Demand supplied from the power grid in hour i (kWh) | Battery capacity used to supply j equipment transferred at hour i (kWh) | ||
| Symbols | |||
| Synthetic perturbation for synthetic load profile modeling. | i | Time variable that includes the 24 h of a day | |
| Area covered by the PV Panels (m2) | j | Number of user-defined electrical loads | |
| Daily perturbation | k | Load transfer priorities according to low, medium, or high. | |
| Instantaneous perturbation | ∀ | Universal quantifier meaning “for all”. | |
| t | Hour of the year (complete year includes the 8760 h). | ||
References
- International Energy Agency (EA). World Energy’s Outlook; International Press: Somerville, MA, USA, 2020. [Google Scholar]
- EU Building Stock Observatory from European Commission. Available online: https://ec.europa.eu/energy/en/eubuildings (accessed on 9 August 2023).
- Pérez-Lombard, L.; Ortiz, J.; Pout, C. A review on buildings energy consumption information. Energy Build. 2008, 40, 394–398. [Google Scholar] [CrossRef]
- International Energy Agency (IEA). Final Energy Consumption of Buildings Relative to Other Sectors. Available online: https://www.iea.org/data-and-statistics/charts/final-energy-consumption-of-buildings-relative-to-other-sectors-2022 (accessed on 9 August 2023).
- EUROSTAT. Change in Electricity Prices for Non-Household Consumers Compared with Previous Year’s Same Semester, First Half 2023 (%). Available online: https://ec.europa.eu/eurostat/databrowser/view/nrg_pc_204/default/table?lang=en (accessed on 3 January 2024).
- GlobalPetrolPrices. Average Cost of Electricity Per Continent. Available online: https://www.globalpetrolprices.com/electricity_prices/#:~:text=The%20prices%20are%20per%20kWh,per%20kWh%20for%20business%20users (accessed on 3 January 2024).
- Balakrishnan, R.; Geetha, V.; Kumar, M.R.; Leung, M.-F. Reduction in Residential Electricity Bill and Carbon Dioxide Emission through Renewable Energy Integration Using an Adaptive Feed-Forward Neural Network System and MPPT Technique. Sustainability 2023, 15, 14088. [Google Scholar] [CrossRef]
- Motta, L.L.; Ferreira, L.C.B.C.; Cabral, T.W.; Lemes, D.A.M.; Cardoso, G.d.S.; Borchardt, A.; Cardieri, P.; Fraidenraich, G.; de Lima, E.R.; Neto, F.B.; et al. General Overview and Proof of Concept of a Smart Home Energy Management System Architecture. Electronics 2023, 12, 4453. [Google Scholar] [CrossRef]
- Venizelou, V.; Makrides, G.; Efthymiou, V.; Georghiou, G.E. Methodology for deploying cost-optimum price-based demand side management for residential prosumers. Renew. Energy 2020, 153, 228–240. [Google Scholar] [CrossRef]
- Niamir, L.; Ivanova, O.; Filatova, T.; Voinov, A.; Bressers, H. Demand-side solutions for climate mitigation: Bottom-up drivers of household energy behavior change in the Netherlands and Spain. Energy Res. Soc. Sci. 2020, 62, 101356. [Google Scholar] [CrossRef]
- Francisco, A.; Truong, H.; Khosrowpour, A.; Taylor, J.E.; Mohammadi, N. Occupant perceptions of building information model-based energy visualizations in eco-feedback systems. Appl. Energy 2018, 221, 220–228. [Google Scholar] [CrossRef]
- Yoo, S.; Eom, J.; Han, I. Factors driving consumer involvement in energy consumption and energy-efficient purchasing behavior: Evidence from Korean residential buildings. Sustainability 2020, 12, 5573. [Google Scholar] [CrossRef]
- Hargroves, K.; James, B.; Lane, J.; Newman, P. The Role of Distributed Energy Resources and Associated Business Models in the Decentralised Energy Transition: A Review. Energies 2023, 16, 4231. [Google Scholar] [CrossRef]
- Ndebele, T. Energy Transition and Consumer Support for Green Energy Beyond the 50% Renewable Energy Target: Evidence from Stated Choice Experiments; Clark University: Worcester, MA, USA, 2023. [Google Scholar]
- Ojeda, V.M.M. State of the Art of Electric Energy Management. Master’s Thesis, School of Engineering, University of Sevilla, Sevilla, Spain, 2021. [Google Scholar]
- Gellings, C.W. The concept of demand-side management for electric utilities. Proc. IEEE 1985, 73, 1468–1470. [Google Scholar] [CrossRef]
- Faruqui, A.; Gellings, C.W. Should demand-side management be a top-down or a bottom-up process. In Strategic Planning and Marketing for Demand-Side Management: Selected Seminar Papers; EPREA-4308; Electric Power Research Institute: Palo Alto, CA, USA, 1985. [Google Scholar]
- Gellings, C.W.; Chamberlin, J.H. Demand-Side Management: Concepts and Methods; U.S. Department of Energy, Office of Scientific and Technical Information: Oak Ridge, TN, USA, 1987. Available online: https://www.osti.gov/biblio/5275778 (accessed on 9 August 2023).
- Gellings, C.W.; Smith, W.M. Integrating demand-side management into utility planning. Inst. Electr. Electron. Eng. 1989, 77, 908–918. [Google Scholar] [CrossRef]
- Gellings, C.W. Evolving practice of demand-side management. J. Mod. Power Syst. Clean Energy 2017, 5, 1–9. [Google Scholar] [CrossRef]
- Rahman, S. An efficient load model for analyzing demand side management impacts. IEEE Trans. Power Syst. 1993, 8, 1219–1226. [Google Scholar] [CrossRef] [PubMed]
- Qdr, Q. Benefits of Demand Response in Electricity Markets and Recommendations for Achieving Them; Technology Reper; US Department of Energy: Washington, DC, USA, 2006; Volume 2006, p. 95. [Google Scholar]
- Stephenson, J.; Ford, R.; Nair, N.K.; Watson, N.; Wood, A.; Miller, A. Smart grid research in New Zealand–A review from the GREEN Grid research programme. Renew. Sustain. Energy Rev. 2018, 82, 1636–1645. [Google Scholar] [CrossRef]
- Torriti, J. Price-based demand side management: Assessing the impacts of time-of-use tariffs on residential electricity demand and peak shifting in Northern Italy. Energy 2012, 44, 576–583. [Google Scholar] [CrossRef]
- Rowlands, I.H.; Furst, I.M. The cost impacts of a mandatory move to time-of-use pricing on residential customers: An Ontario (Canada) case-study. Energy Effic. 2011, 4, 571–585. [Google Scholar] [CrossRef]
- Schrammel, J.; Diamond, L.M.; Fröhlich, P.; Mor, G.; Cipriano, J. Influencing residential electricity consumption with tailored messages: Long-term usage patterns and effects on user experience. Energy Sustain. Soc. 2023, 13, 15. [Google Scholar] [CrossRef]
- Andrada-Monrós, C.; Peñalvo-López, E.; León-Martínez, V.; Valencia-Salazar, I. Methodology to optimise electricity demand in the residential sector through efficient load management. Renew. Energy Power Qual. J. 2022, 20, 719–723. [Google Scholar] [CrossRef]
- Panda, S.; Mohanty, S.; Rout, P.K.; Sahu, B.K.; Bajaj, M.; Zawbaa, H.M.; Kamel, S. Residential Demand Side Management model, optimization and future perspective: A review. Energy Rep. 2022, 8, 3727–3766. [Google Scholar] [CrossRef]
- Jasim, A.M.; Jasim, B.H.; Flah, A.; Bolshev, V.; Mihet-Popa, L. A new optimized demand management system for smart grid-based residential buildings adopting renewable and storage energies. Energy Rep. 2023, 9, 4018–4035. [Google Scholar] [CrossRef]
- Mehra, V.; Amatya, R.; Ram, R.J. Estimating the value of demand-side management in low-cost, solar micro-grids. Energy 2018, 163, 74–87. [Google Scholar] [CrossRef]
- Fell, M.J.; Shipworth, D.; Huebner, G.M.; Elwell, C.A. Public acceptability of domestic demand-side response in Great Britain: The role of automation and direct load control. Energy Res. Soc. Sci. 2015, 9, 72–84. [Google Scholar] [CrossRef]
- Cano-Martínez, J.; Peñalvo-López, E.; León-Martínez, V.; Valencia-Salazar, I. Dynamic energy prices for residential users based on Deep Learning prediction models of consumption and renewable generation. Renew. Energy Power Qual. J. 2023, 21, 76–80. [Google Scholar] [CrossRef]
- Hamdani, N.; Muhamad, N.A.; Petra, R.; Ang, S.P. Study on the residential load profiles in Brunei Darussalam based on income and location. Energy Rep. 2023, 9, 737–747. [Google Scholar] [CrossRef]
- Zhou, K.; Yang, S. Understanding household energy consumption behavior: The contribution of energy big data analytics. Renew. Sustain. Energy Rev. 2016, 56, 810–819. [Google Scholar] [CrossRef]
- Andrada-Monrós, C.; Peñalvo-López, E.; Valencia-Salazar, I.; Cárcel-Carrasco, J. Review of the Energy transition assessment methods in touristic municipalities. In Proceedings of the 21th International Conference on Renewable Energies and Power Quality (ICREPQ’23), Madrid, Spain, 24–26 May 2023. [Google Scholar]
- Han, X.; Wei, C. Household energy consumption: State of the art, research gaps, and future prospects. Environ. Dev. Sustain. 2021, 23, 12479–12504. [Google Scholar] [CrossRef]
- Cano-Martínez, J.; Peñalvo-López, E.; León-Martínez, V.; Valencia-Salazar, I. Optimisation of an aggregator’s customer portfolio based on inter-user compatibility. Renew. Energy Power Qual. J. 2022, 20, 724–728. [Google Scholar] [CrossRef]
- Bhattacharjee, S.; Reichard, G. Socio-economic factors affecting individual household energy consumption: A systematic review. Energy Sustain. 2011, 54686, 891–901. [Google Scholar]
- Borozan, D. Regional-level household energy consumption determinants: The European perspective. Renew. Sustain. Energy Rev. 2018, 90, 347–355. [Google Scholar] [CrossRef]
- Iqbal, M.M.; Waseem, M.; Manan, A.; Liaqat, R.; Muqeet, A.; Wasaya, A. IoT-enabled smart home energy management strategy for DR actions in smart grid paradigm. In Proceedings of the 2021 International Bhurban Conference on Applied Sciences and Technologies (IBCAST), Islamabad, Pakistan, 12–16 January 2021; IEEE: Piscataway, NJ, USA, 2021; pp. 352–357. [Google Scholar]
- Palensky, P.; Dietrich, D. Demand side management: Demand response, intelligent energy systems, and smart loads. IEEE Trans. Ind. Inform. 2011, 7, 381–388. [Google Scholar] [CrossRef]
- Meliani, M.; Barkany, A.E.; Abbassi, I.E.; Darcherif, A.M.; Mahmoudi, M. Energy management in the smart grid: State-of-the-art and future trends. Int. J. Eng. Bus. Manag. 2021, 13, 18479790211032920. [Google Scholar] [CrossRef]
- Liu, Z.; Wu, Q.; Huang, S.; Zhao, H. Transactive energy: A review of state of the art and implementation. In Proceedings of the 2017 IEEE Manchester PowerTech, Manchester, UK, 18–22 June 2017; IEEE: Piscataway, NJ, USA, 2017; pp. 1–6. [Google Scholar]
- Abrishambaf, O.; Lezama, F.; Faria, P.; Vale, Z. Towards transactive energy systems: An analysis on current trends. Energy Strategy Rev. 2019, 26, 100418. [Google Scholar] [CrossRef]
- Huang, Q.; Amin, W.; Umer, K.; Gooi, H.B.; Eddy, F.Y.S.; Afzal, M.; Shahzadi, M.; Khan, A.A.; Ahmad, S.A. A review of transactive energy systems: Concept and implementation. Energy Rep. 2021, 7, 7804–7824. [Google Scholar] [CrossRef]
- Paterakis, N.G.; Taşcıkaraoğlu, A.; Erdinc, O.; Bakirtzis, A.G.; Catalao, J.P. Assessment of demand-response-driven load pattern elasticity using a combined approach for smart households. IEEE Trans. Ind. Inform. 2016, 12, 1529–1539. [Google Scholar] [CrossRef]
- Ma, Y.; Li, B. Hybridized intelligent home renewable energy management system for smart grids. Sustainability 2020, 12, 2117. [Google Scholar] [CrossRef]
- Sharda, S.; Singh, M.; Sharma, K. Demand side management through load shifting in IoT based HEMS: Overview, challenges and opportunities. Sustain. Cities Soc. 2021, 65, 102517. [Google Scholar] [CrossRef]
- Iqbal, S.; Sarfraz, M.; Ayyub, M.; Tariq, M.; Chakrabortty, R.K.; Ryan, M.J.; Alamri, B. A comprehensive review on residential demand side management strategies in smart grid environment. Sustainability 2021, 13, 7170. [Google Scholar] [CrossRef]
- Jordehi, A.R. Optimisation of demand response in electric power systems, a review. Renew. Sustain. Energy Rev. 2019, 103, 308–319. [Google Scholar] [CrossRef]
- Vega, A.; Amaya, D.; Santamaría, F.; Rivas, E. Active demand-side management strategies focused on the residential sector. Electr. J. 2020, 33, 106734. [Google Scholar] [CrossRef]
- Chakir, A.; Abid, M.; Tabaa, M.; Hachimi, H. Demand-side management strategy in a smart home using electric vehicle and hybrid renewable energy system. Energy Rep. 2022, 8, 383–393. [Google Scholar] [CrossRef]
- Jímenez, R. Active demand management in the residential sector. In State of the Art of Ongoing Projects; Universidad Carlos III: Madrid, Spain, 2013. [Google Scholar]
- Behzadi, A.; Thorin, E.; Duwig, C.; Sadrizadeh, Y.S. Supply-demand side management of a building energy system driven by solar and biomass in Stockholm: A smart integration with minimal cost and emission. Energy Convers. Manag. 2023, 292, 117420. [Google Scholar] [CrossRef]
- Ebrahimi, J.; Abedini, Y.M. M. A two-stage framework for demand-side management and energy savings of various buildings in multi smart grid using robust optimization algorithms. J. Build. Eng. 2022, 53, 104486. [Google Scholar] [CrossRef]
- Cooperative, C.E.; Summit Blue Consulting. Evaluation of the Energy-Smart Pricing Plan; Illinois Department of Commerce and Economic Opportunity: Chicago, IL, USA, 2004. [Google Scholar]
- Enright, T.O.N.I.; Faruqui, A. A Bibliography on Dynamic Pricing of Electricity; The Battle Group: Cambridge, MA, USA, 2012. [Google Scholar]
- CDTI. Active Demand Management Project Demand; Cenit GAD “Project”: La Coruña, Spain, 2010. [Google Scholar]
- FLEXCoop Consortium 2019. Demand Response for Energy Cooperatives. Available online: http://www.flexcoop.eu/about-flexcoop (accessed on 13 July 2021).
- Ministry of Ecological Transition. Available online: https://www.boe.es/buscar/doc.php?id=BOE-A-2019-5089 (accessed on 14 August 2023).
- Redeia. Red Electrica. Available online: https://www.ree.es/en/activities/operation-of-the-electricity-systemvoluntary-price-small-consumer-pvpc. (accessed on 21 March 2023).


| Active DSM Projects | Country | Description |
|---|---|---|
| Energy-Smart Pricing Plan (ESPP) (2004) [56] | EEUU | It studies the response of residential consumers to hourly prices imposed by the electricity market, the type of measures taken by consumers, and the definition of the magnitude of the effect. However, no advice is given to the participants, so the savings achieved can only be visualised after the measures have been implemented. |
| Newmarket Hydro Time-of-Use Pricing Pilot (2008) [57] | Canada | It aims to provide consumers with information on how to manage electricity consumption by shifting the use of household appliances to off-peak periods. In this pilot, all participants are informed about the cost of energy in each period, a comparison between tariffs according to their historical data, a questionnaire on the use of household appliances, and some tips. It is a very comprehensive pilot that incorporates the use of the Electric Vehicle (EV) for charging as an additional device. However, this pilot does not evaluate the self-consumption of the domestic prosumer and their benefits. |
| GAD Project: Active Demand Management (2010) [58] | Spain | The aim of this project is to research and develop tools to help reduce consumers’ electricity bills, and search for devices that inform the user about the price and origin of the energy. Consumers can adjust their consumption profile according to their preferences, thus reducing their electricity bills. Also, it can be integrated into homes, and considers the need to integrate devices to automate the management and information system. However, it does not address the possibility of introducing renewable energies as a source of generation to optimise the consumption curve, avoiding peaks in the electricity system, nor does it introduce the possibility of obtaining tariff incentives thanks to the use of renewable energies. |
| FLEXCoop (2021) [59] | FLEXCoop Consortium | This European project adapts demand to production but gives flexibility to consumers by allowing energy savings and using the flexibility margin obtained in the electricity market. It focuses on energy communities, so it considers other actors (Producers, Transmission System Operator, Prosumers, Aggregators, etc.) creating an energy market. This enhances the value of creating methodologies and tools to facilitate active demand management, as they would support the creation of energy communities. |
| Input Parameters | Means of Collection |
|---|---|
| Spanish regulation | Information gathered from the Spanish national government, Ministry of Ecological Transition, Decree 244/2019 of April 5, which regulates the administrative, technical, and economic conditions of the self-consumption of electrical energy [60] |
| User Electricity Price Rates | Energy price set by the electricity market (in the case of Spain, the Iberian Energy Market Operator—OMIE) [61] |
| Housing Historical Demand | Data are collected by the smart metre, owned by the energy distribution company |
| User Load Schedule | Provided by the user |
| User Load priorities | Provided by the user |
| Renewable Generation Profile | Data specifications of the components |
| Weather conditions | Specifical data of the weather from official webpages |
| Storage system | Data specifications of the components |
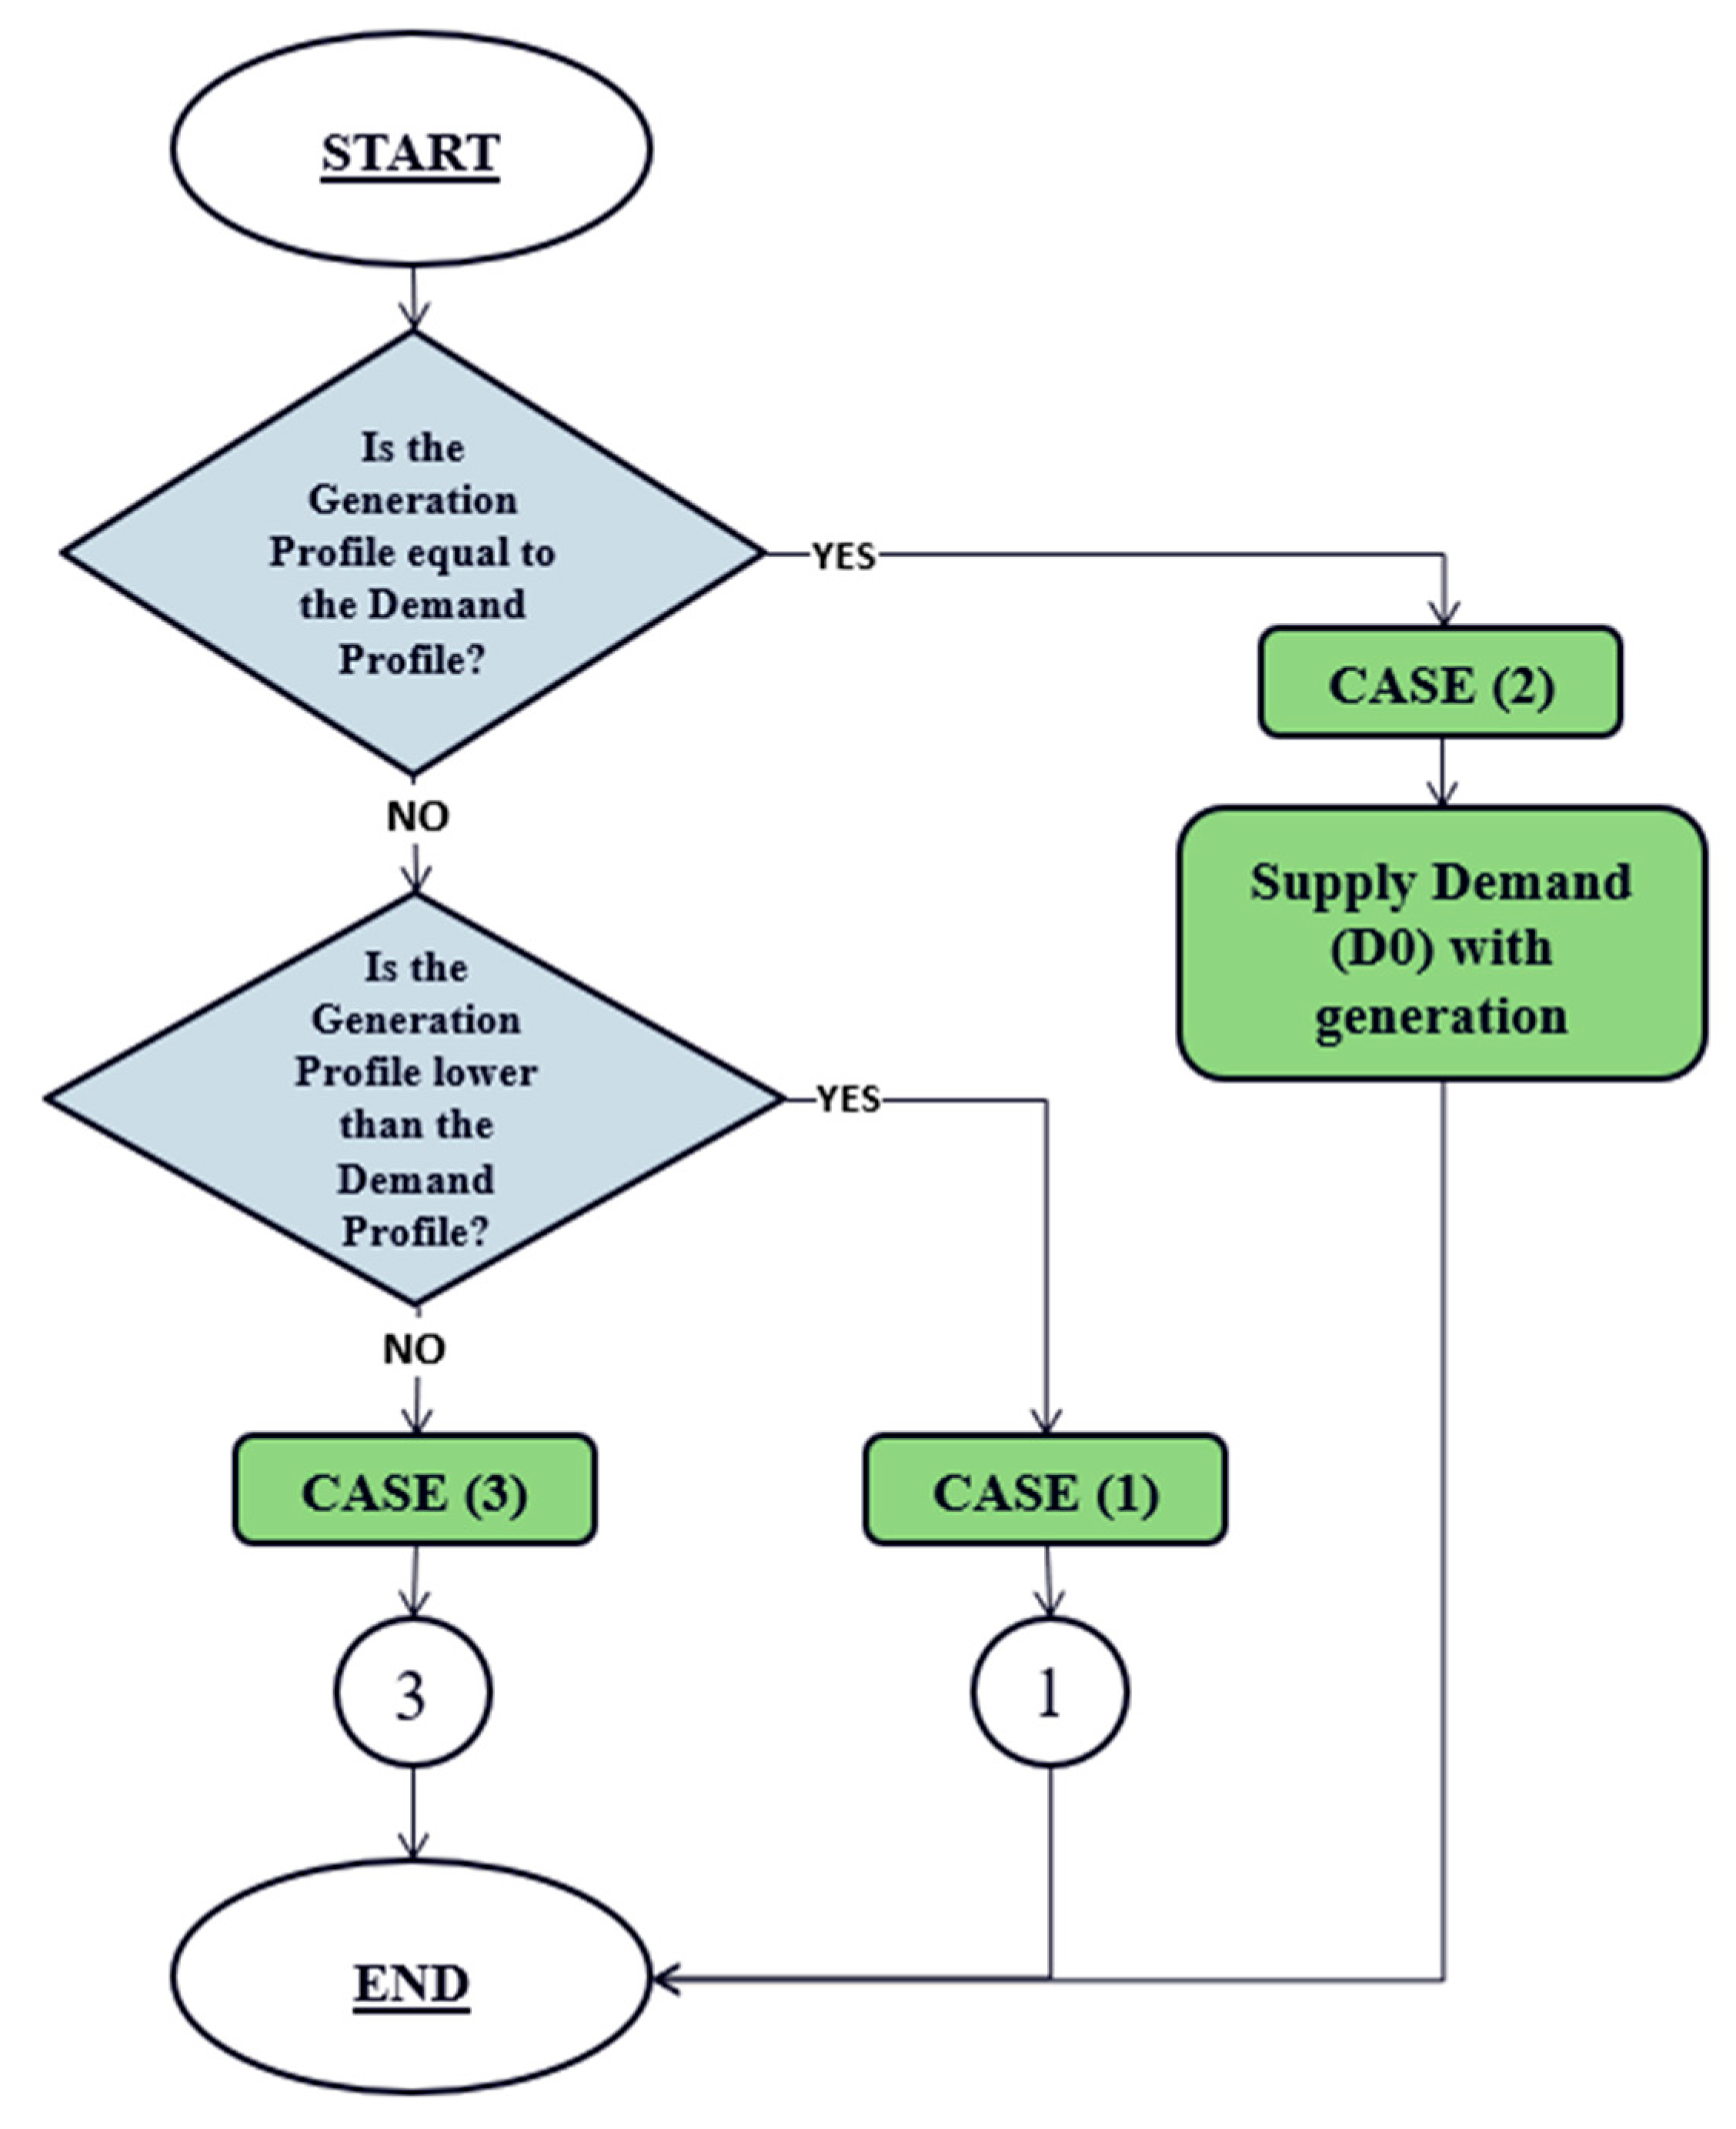
| Case | Condition | Description |
|---|---|---|
| 1 | Generation < Demand | Value of Renewable Generation in hour i is lower than the value of Demand in hour i. Instantly, only part of the demand is supplied; therefore, it is analysed whether or not there is energy available in the storage system to supply the demand completely.
|
| 2 | Generation ⩳ Demand | The value of Renewable Generation in hour i is equal to the customer´s demand for the hour under study; the demand may be fully satisfied, and there will be no energy surplus. |
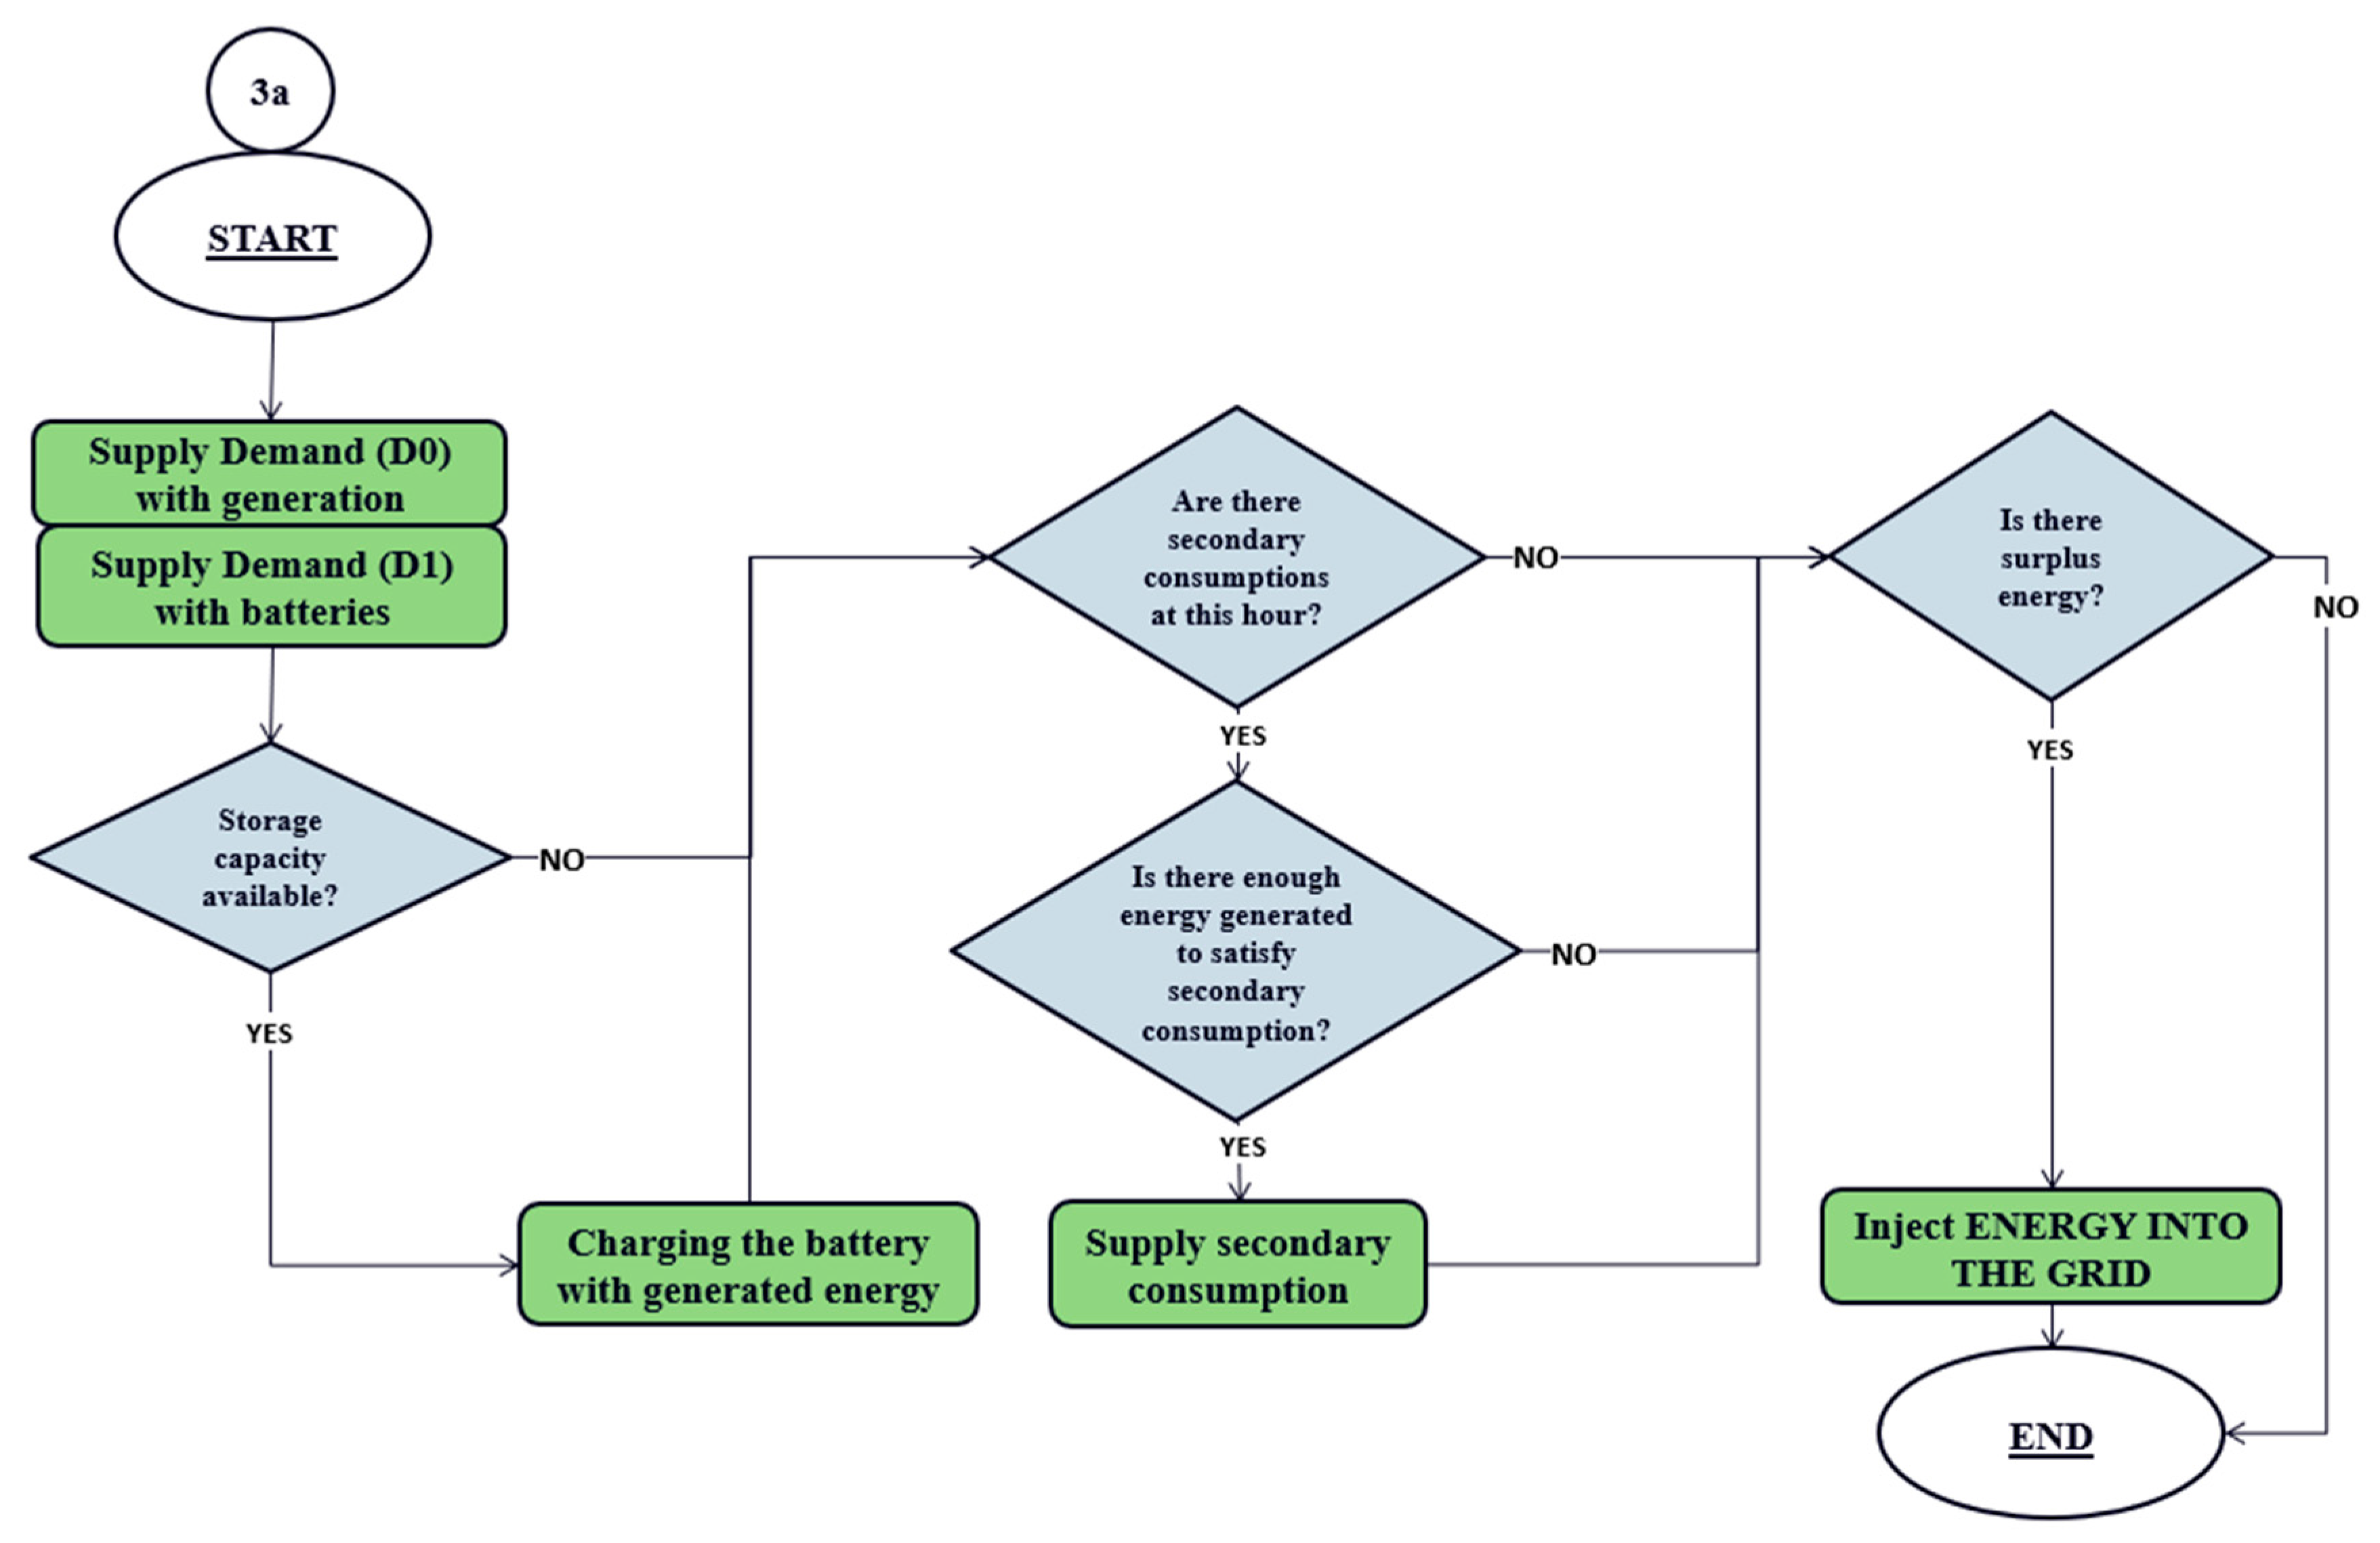
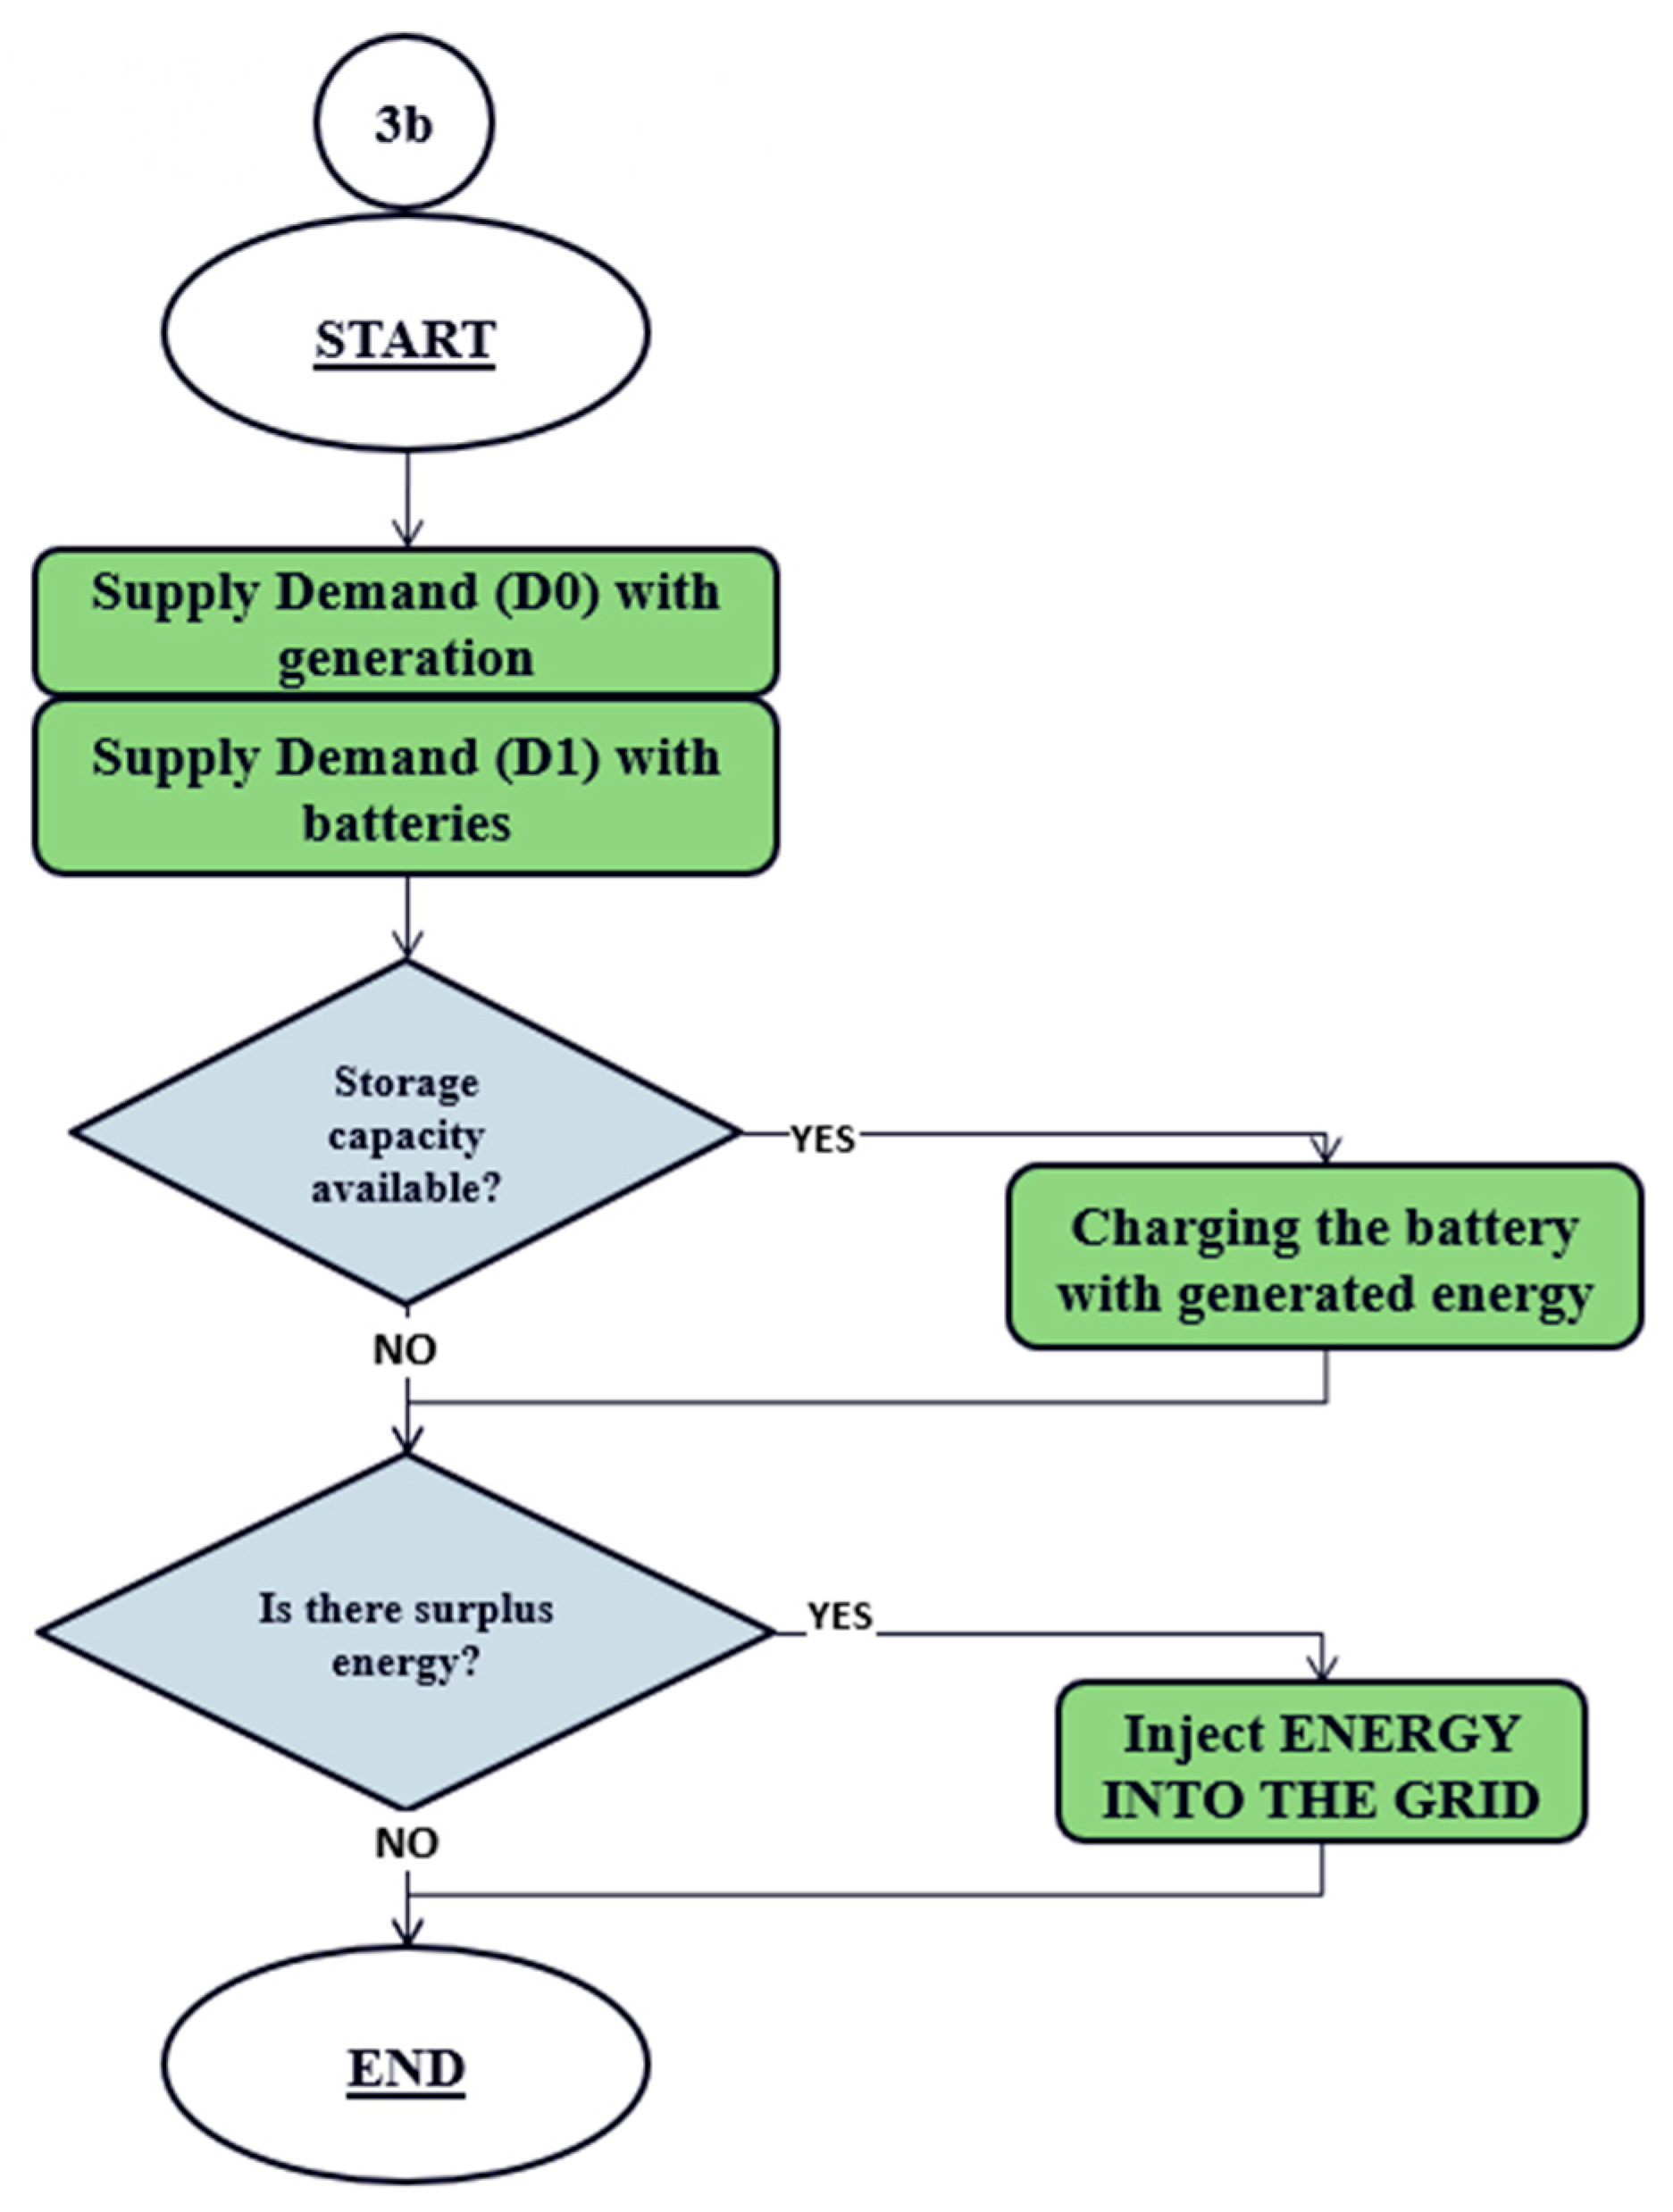
| 3 | Generation > Demand | If the value of Renewable Generation in hour i is greater than the value for that hour, the consumer’s demand can be fully satisfied, and there will be a surplus of energy.
|
| Output Parameters | Units |
|---|---|
| Energy Cost Savings—ECS | € |
| Renewable Energy Coverage—REC | % |
| Cost of the total electricity purchased— | € |
| Revenue of the total electricity sold to the market— | € |
| Total electricity purchased from the grid— | kWh |
| Total electricity delivered to the grid— | kWh |
| Input Parameter | Case Study Data |
|---|---|
| Type of installation | Self-consumption with surpluses with compensation. Contracted power: P1 = 5.5 kW P2 = 5.5 kW |
| Tariff group | 2.0TD for small consumers |
| Electrical Market prices | Iberian Energy Market Operator—OMIE |
| Synthetic Load Profile (SLP) | To define the synthetic load profile, a synthetic perturbation of up to 1.35 has been considered. The daily and instantaneous perturbation values have been randomly assigned with a maximum value of 20% and 15%, respectively, according to historical residential demand. |
| Generation Profile (PG) | Photovoltaic installation: Peak Power: 1.8 kWp, Efficiency 18%. S = 10 m2 |
| Weather conditions | Irradiance history for location (39.537–0.632) |
| Storage Technologies | Maximum capacity: 150 Ah Depth of discharge: 40% |
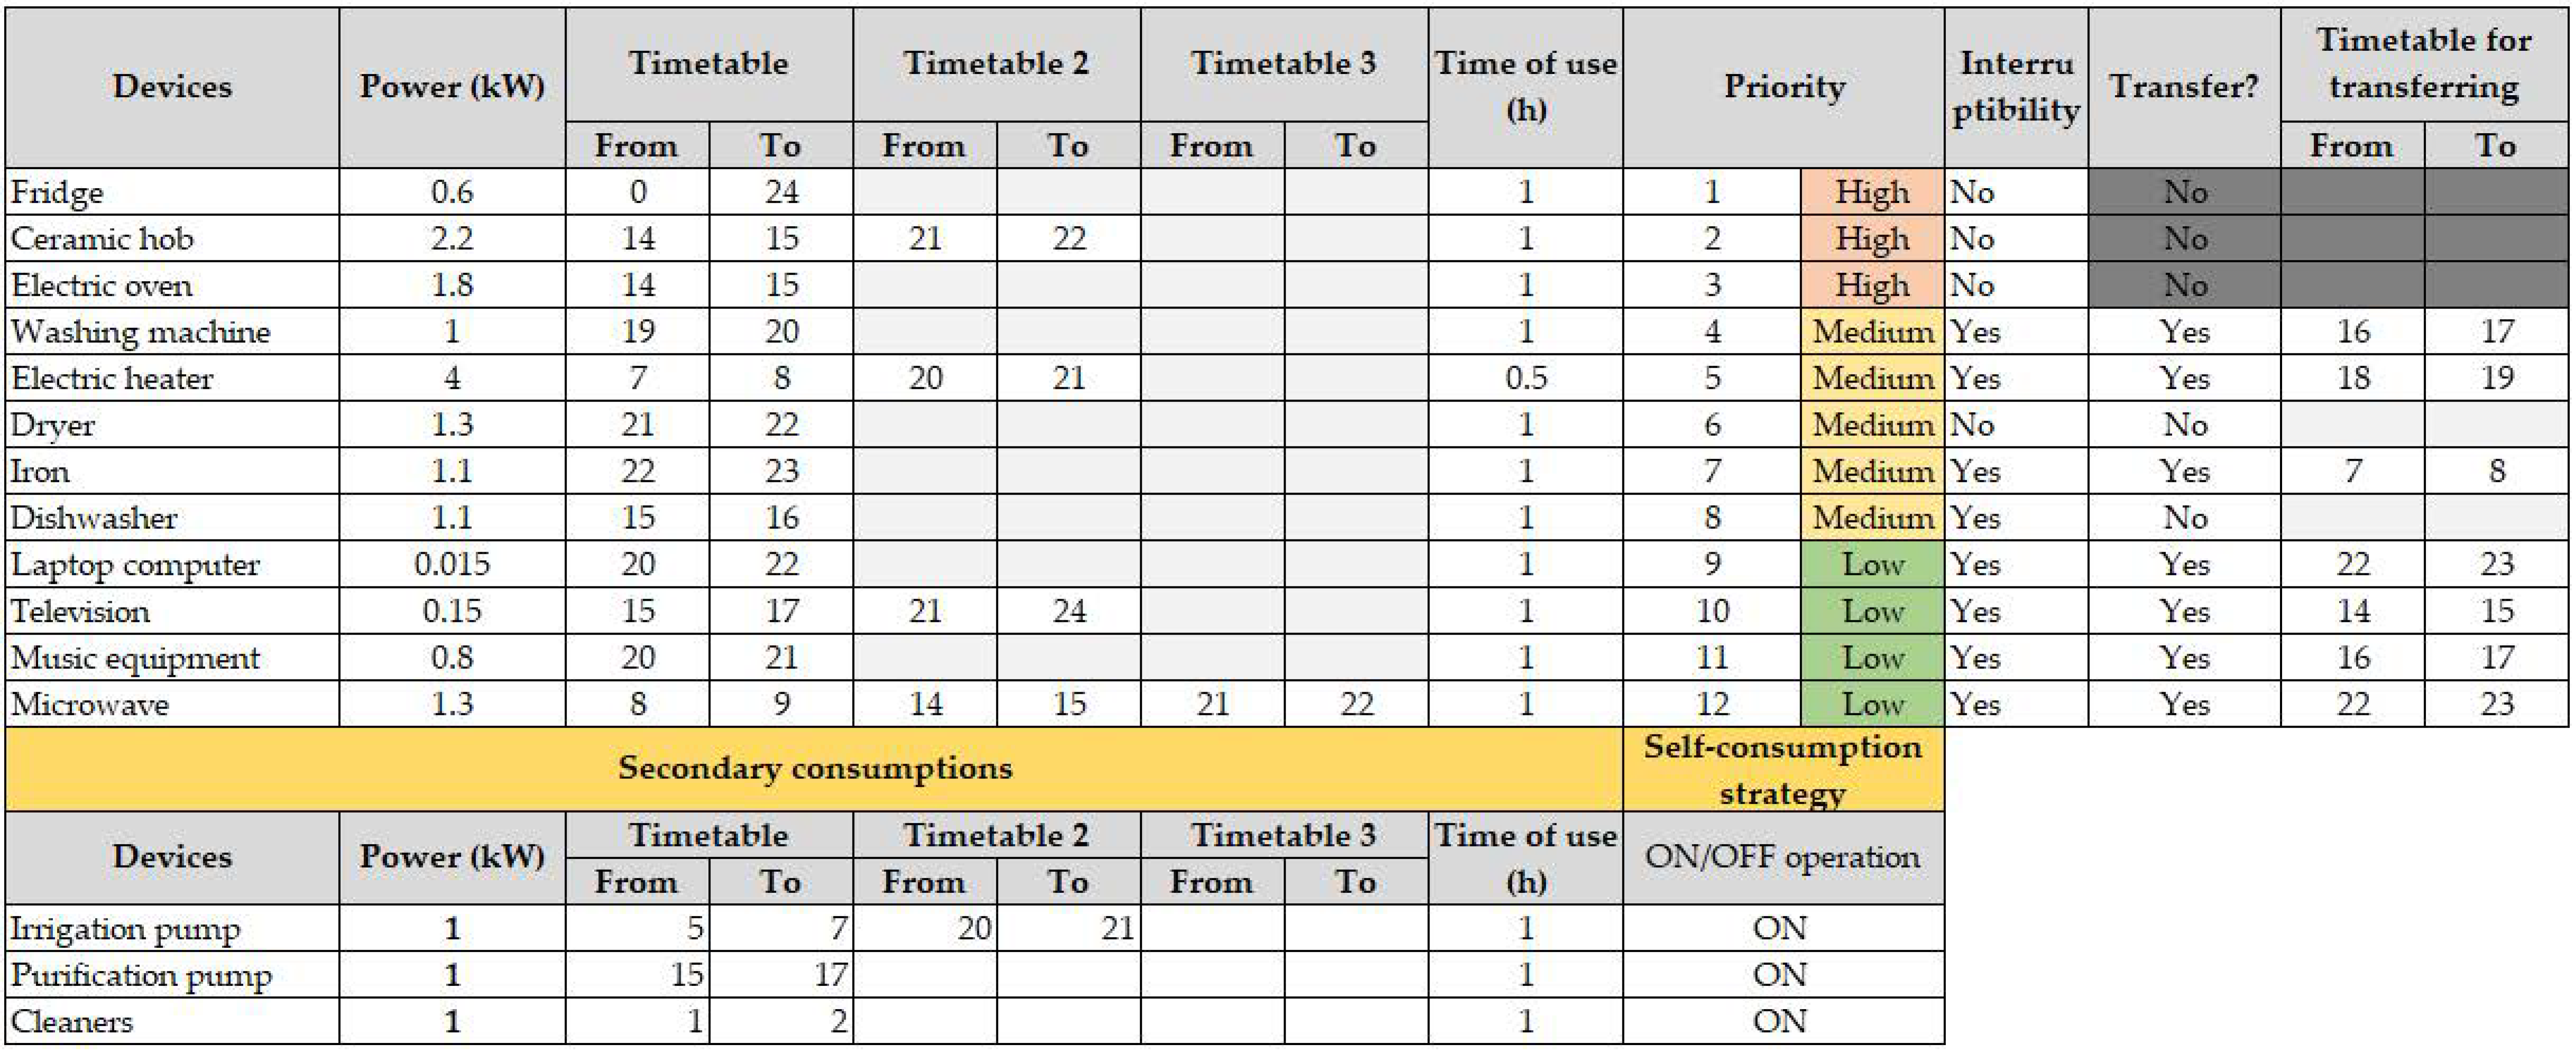
| User preferences | Number of available devices, power, weekly hours of use for working days and holidays, usage priorities (high, medium, and low), and flexibility of use for shifting to other times entered by the user. |
| Economic | Self-Consumption | |
|---|---|---|
| Energy Cost Savings (ECS) (€) | 246.59 | 233.90 |
| Renewable Energy Coverage (REC) (%) | 30.89 | 36.27 |
| Cost of the total electricity purchased (€) | 215.85 | 218.29 |
| Revenue of the total electricity sold to the market (€) | 182.21 | 169.64 |
| Total electricity purchased from the grid (kWh) | 1042.44 | 1042.44 |
| Total electricity delivered to the grid (kWh) | 2603.08 | 2429.25 |
| Economic | Self-Consumption | |
|---|---|---|
| Energy Cost Savings (ECS) (€) | 287.40 | 275.12 |
| Renewable Energy Coverage (REC) (%) | 34.15 | 39.65 |
| Cost of the total electricity purchased (€) | 129.41 | 130.34 |
| Revenue of the total electricity sold to the market (€) | 169.65 | 143.08 |
| Total electricity purchased from the grid (kWh) | 467.20 | 467.20 |
| Total electricity delivered to the grid (kWh) | 2421.76 | 2044.76 |
Disclaimer/Publisher’s Note: The statements, opinions and data contained in all publications are solely those of the individual author(s) and contributor(s) and not of MDPI and/or the editor(s). MDPI and/or the editor(s) disclaim responsibility for any injury to people or property resulting from any ideas, methods, instructions or products referred to in the content. |
© 2024 by the authors. Licensee MDPI, Basel, Switzerland. This article is an open access article distributed under the terms and conditions of the Creative Commons Attribution (CC BY) license (https://creativecommons.org/licenses/by/4.0/).
Share and Cite
León-Martínez, V.; Andrada-Monrós, C.; Peñalvo-López, E.; Saiz-Jiménez, J.Á. Demand-Side Management Method for Households with Self-Generation and Storage of Electricity. Buildings 2024, 14, 276. https://doi.org/10.3390/buildings14010276
León-Martínez V, Andrada-Monrós C, Peñalvo-López E, Saiz-Jiménez JÁ. Demand-Side Management Method for Households with Self-Generation and Storage of Electricity. Buildings. 2024; 14(1):276. https://doi.org/10.3390/buildings14010276
Chicago/Turabian StyleLeón-Martínez, Vicente, Clara Andrada-Monrós, Elisa Peñalvo-López, and Juan Ángel Saiz-Jiménez. 2024. "Demand-Side Management Method for Households with Self-Generation and Storage of Electricity" Buildings 14, no. 1: 276. https://doi.org/10.3390/buildings14010276