Article

Structural Performance and Design of Aluminum Claddings Subjected to Windborne Debris Impact

School of Engineering and Built Environment, Griffith University, Nathan 4111, Australia
*
Author to whom correspondence should be addressed.
Buildings 2024, 14(1), 135; https://doi.org/10.3390/buildings14010135
Submission received: 24 November 2023 / Revised: 22 December 2023 / Accepted: 29 December 2023 / Published: 4 January 2024

Abstract

:
Aluminum cladding panels have been used in some of the most iconic buildings around the world due to their durability, aesthetic appeal, and longevity. These panels play a critical role as the first line of defense against external forces such as wind and rain; therefore, the appropriateness of the design and resilience of aluminum cladding panels must be ensured. Previous researchers have conducted very minimal research on aluminum panels subjected to windborne debris impact. Their scope was limited to studying the response of panels when they are targeted at the center. The influence of various structural and load-related parameters on the response of such claddings has yet to be investigated. Furthermore, no design guidelines are readily available that engineers can use to predict the response of aluminum cladding panels when subjected to such loads considering various conditions (location of impact, projectile’s material, angle of impact, velocity of impact, unsupported length, and the geometry of the panels). The main aim of this paper was to develop some design guidelines that engineers can use to predict the response of aluminum cladding panels exposed to windborne debris impact. To achieve this, a series of parametric studies was conducted to generate a data bank. These parametric studies were performed with the help of a robust numerical model that has been validated with experimental results. The parametric sensitivity study revealed that the angle of impact was the most influential parameter, causing an 80% reduction in the peak impact force with a 50% decrease in the angle. The velocity, plate thickness, location of impact, and unsupported length also significantly influenced the panel’s response. The alloy type emerged as a dominant factor affecting the maximum and residual deflections. Regression equations were formulated based on the generated dataset to accurately predict the peak impact force, maximum central deflection, and residual deflection of solid aluminum cladding panels. The proposed prediction equations offer a better alternative to experimental testing.

1. Introduction

Aluminum cladding is the ideal choice of material for resilient facade systems because it enables a high strength-to-weight ratio, durability, and corrosion resistance. It is the ideal base for various finishing options to suit any project’s architectural requirements [1]. Designed to suit commercial, residential, and industrial projects, this non-combustible product allows complete architectural freedom (see Figure 1).
Strong winds and heavy rains are generated by tropical cyclones (also known as hurricanes or typhoons) that act as a potential hazard for these claddings. The effects of violent precipitation and devastating wind threaten the safety of more than a hundred million people every day [3]. Additionally, the resulting windborne debris, produced as a result of the surrounding plants, trees, and construction activities, can greatly impact the façade system and damage the building envelope [4,5]. Such damage would increase internal pressurization, which in turn could potentially cause a collapse of the outer walls if the building is not designed to withstand the high wind loads of a cyclone event [6]. Therefore, it is important to ensure the appropriateness of the design and the resilience of these cladding systems.
In recent years, engineers have started investigating the behavior of aluminum panels subjected to windborne debris impact. The effect of some structural parameters, namely the thickness of the plate and length of the plate, on the impact force–time history and deflection–time history were investigated. Li et al. (2017) [7,8] conducted a drop-weight test on an aluminum plate using five different types of impactors to determine the size, shape, and depth of the dents. One of the limitations of these studies is that only one size configuration was set for the five types of dents and, therefore, numerous finite element analyses are to be further conducted to analyze the effect of dent size, orientation, and plate size (length, width, and thickness) on the ultimate strength of panels under compression. Mohotti et al. (2013) [9] studied the influence of the thickness of the plate on the deflection time history of AA5083-H116 and concluded that the increase in thickness of the plates caused a reduction in the maximum central deflection; however, in this study, the influence of an increase in the length of the plate (span) on its dynamic impact performance was not considered. Pathirana (2018) [10,11] also explored the damage to the aluminum facades from flying objects. An analytical model for assessing the impact-induced damage to aluminum panels was proposed. This study was based on a spherical specimen as a projectile and recommended confirming the validity of the equations proposed for spherical projectiles by using non-spherical projectiles. Iqbal et al. (2008) [12,13] performed extensive research studies on aluminum plates subjected to impact loading. The effect of the thickness of the target on the displacement history and force–time history was studied; however, the influence of the varying span and the distance between the fasteners on the response of these panels was not investigated.
In addition to structure-related parameters, another major challenge was the influence of load-related parameters, i.e., the location of impact, angle of impact, and velocity of impact on the response of the aluminum cladding system. Villavicencio et al. (2012) [14,15,16] conducted a series of experimental tests on transversely impacted, clamped aluminum plates struck at the center by a mass with a spherical intender. Christiansen et al. (1993) [17] investigated the effects of highly oblique impacts on thin and thick aluminum plates. An aluminum projectile was fired from the gas gun. The speed of the projectile was maintained between 6.5 and 7 km/h, with the angle of impact varying from 0° to 88° degrees. A 6.4 mm thick aluminum plate was used as a target and a 1 mm diameter ball as the projectile. It was concluded that multiple craters can be produced by a single, solid projectile impacting at an oblique angle.
In summary, the existing research predominantly focuses on the central impact of projectiles on targeted plates, neglecting investigations into the edge-on impact of solid aluminum panels, which is a common and critical scenario, especially in practical applications such as cladding. This significance is underscored by the fact that four out of the six designated impact locations specified in AS/NZ 1170.2 are in proximity to structural supports. Thus, assessing the performance of solid aluminum cladding systems at various locations, especially those adjacent to supports, becomes imperative.
Furthermore, real-world scenarios seldom involve projectiles striking wall cladding perpendicularly, emphasizing the need to explore the oblique impact performance of these panels. Additionally, the influence of the plate dimensions, representing the span and fastener distances in cladding panels, remains uninvestigated. Furthermore, no research is available in the literature that explores the response of cladding panels subjected to timber projectiles, and there exists a gap in the literature for the identification of key structure and load-related parameters that govern the response of aluminum cladding panel systems.
The study of solid aluminum panels is not only limited to experimental investigations: Some researchers have also proposed analytical and numerical models for their studies [18,19]. Grytten et al. (2009) [19] studied square plates penetrated by a blunt-nosed projectile, modeling a quarter of the target plate with orthotropic plasticity and using a hyperelastic–viscoplastic material model for solid aluminum panels. Mohotti et al. (2013) [9] employed a quarter plate model with a deformable solid element for the aluminum plate and a rigid body model for the projectile, using the Johnson–Cook material model. Fagerholt et al. (2010) [18] used a square-shaped aluminum plate with a central blunt projectile, while Mocian (2018) [20] simulated the low-velocity impact behavior of 6082-T6 aluminum plates. The majority of these researchers have used solid deformable body models for aluminum panels; however, shell models, which simplify complex shapes, offer advantages such as computational efficiency, easier meshing, and reduced errors. Furthermore, these researchers have modeled the projectile as a rigid body and have neglected the effect of friction between the projectile and the target. Thus, there is a need to develop a robust numerical model capable of addressing these limitations to ensure precise predictions.
Therefore, the main objective of the current paper is to develop some design guidelines that can easily be used by engineers to design solid aluminum claddings exposed to windborne debris impact.
The enabling objectives are to (a) develop a robust numerical model for plain solid aluminum panels subjected to impact loading, (b) verify the numerical model, and (c) develop a data bank by conducting a series of parametric studies considering the key structural and load-related parameters.

2. Finite Element Modeling

The finite element modeling software ABAQUS 6.14-5 [21] was used for the development of a robust numerical model to ensure precise predictions.

2.1. Development of a Robust Numerical Model

The proposed model aimed to finalize the range of instrumentation to be used in experimental studies and to verify the numerical techniques. The following sections provide a detailed discussion of the role of the element types, material models, fracture strain, and the influence of Cowper–Symonds parameters in the development of the robust numerical model.

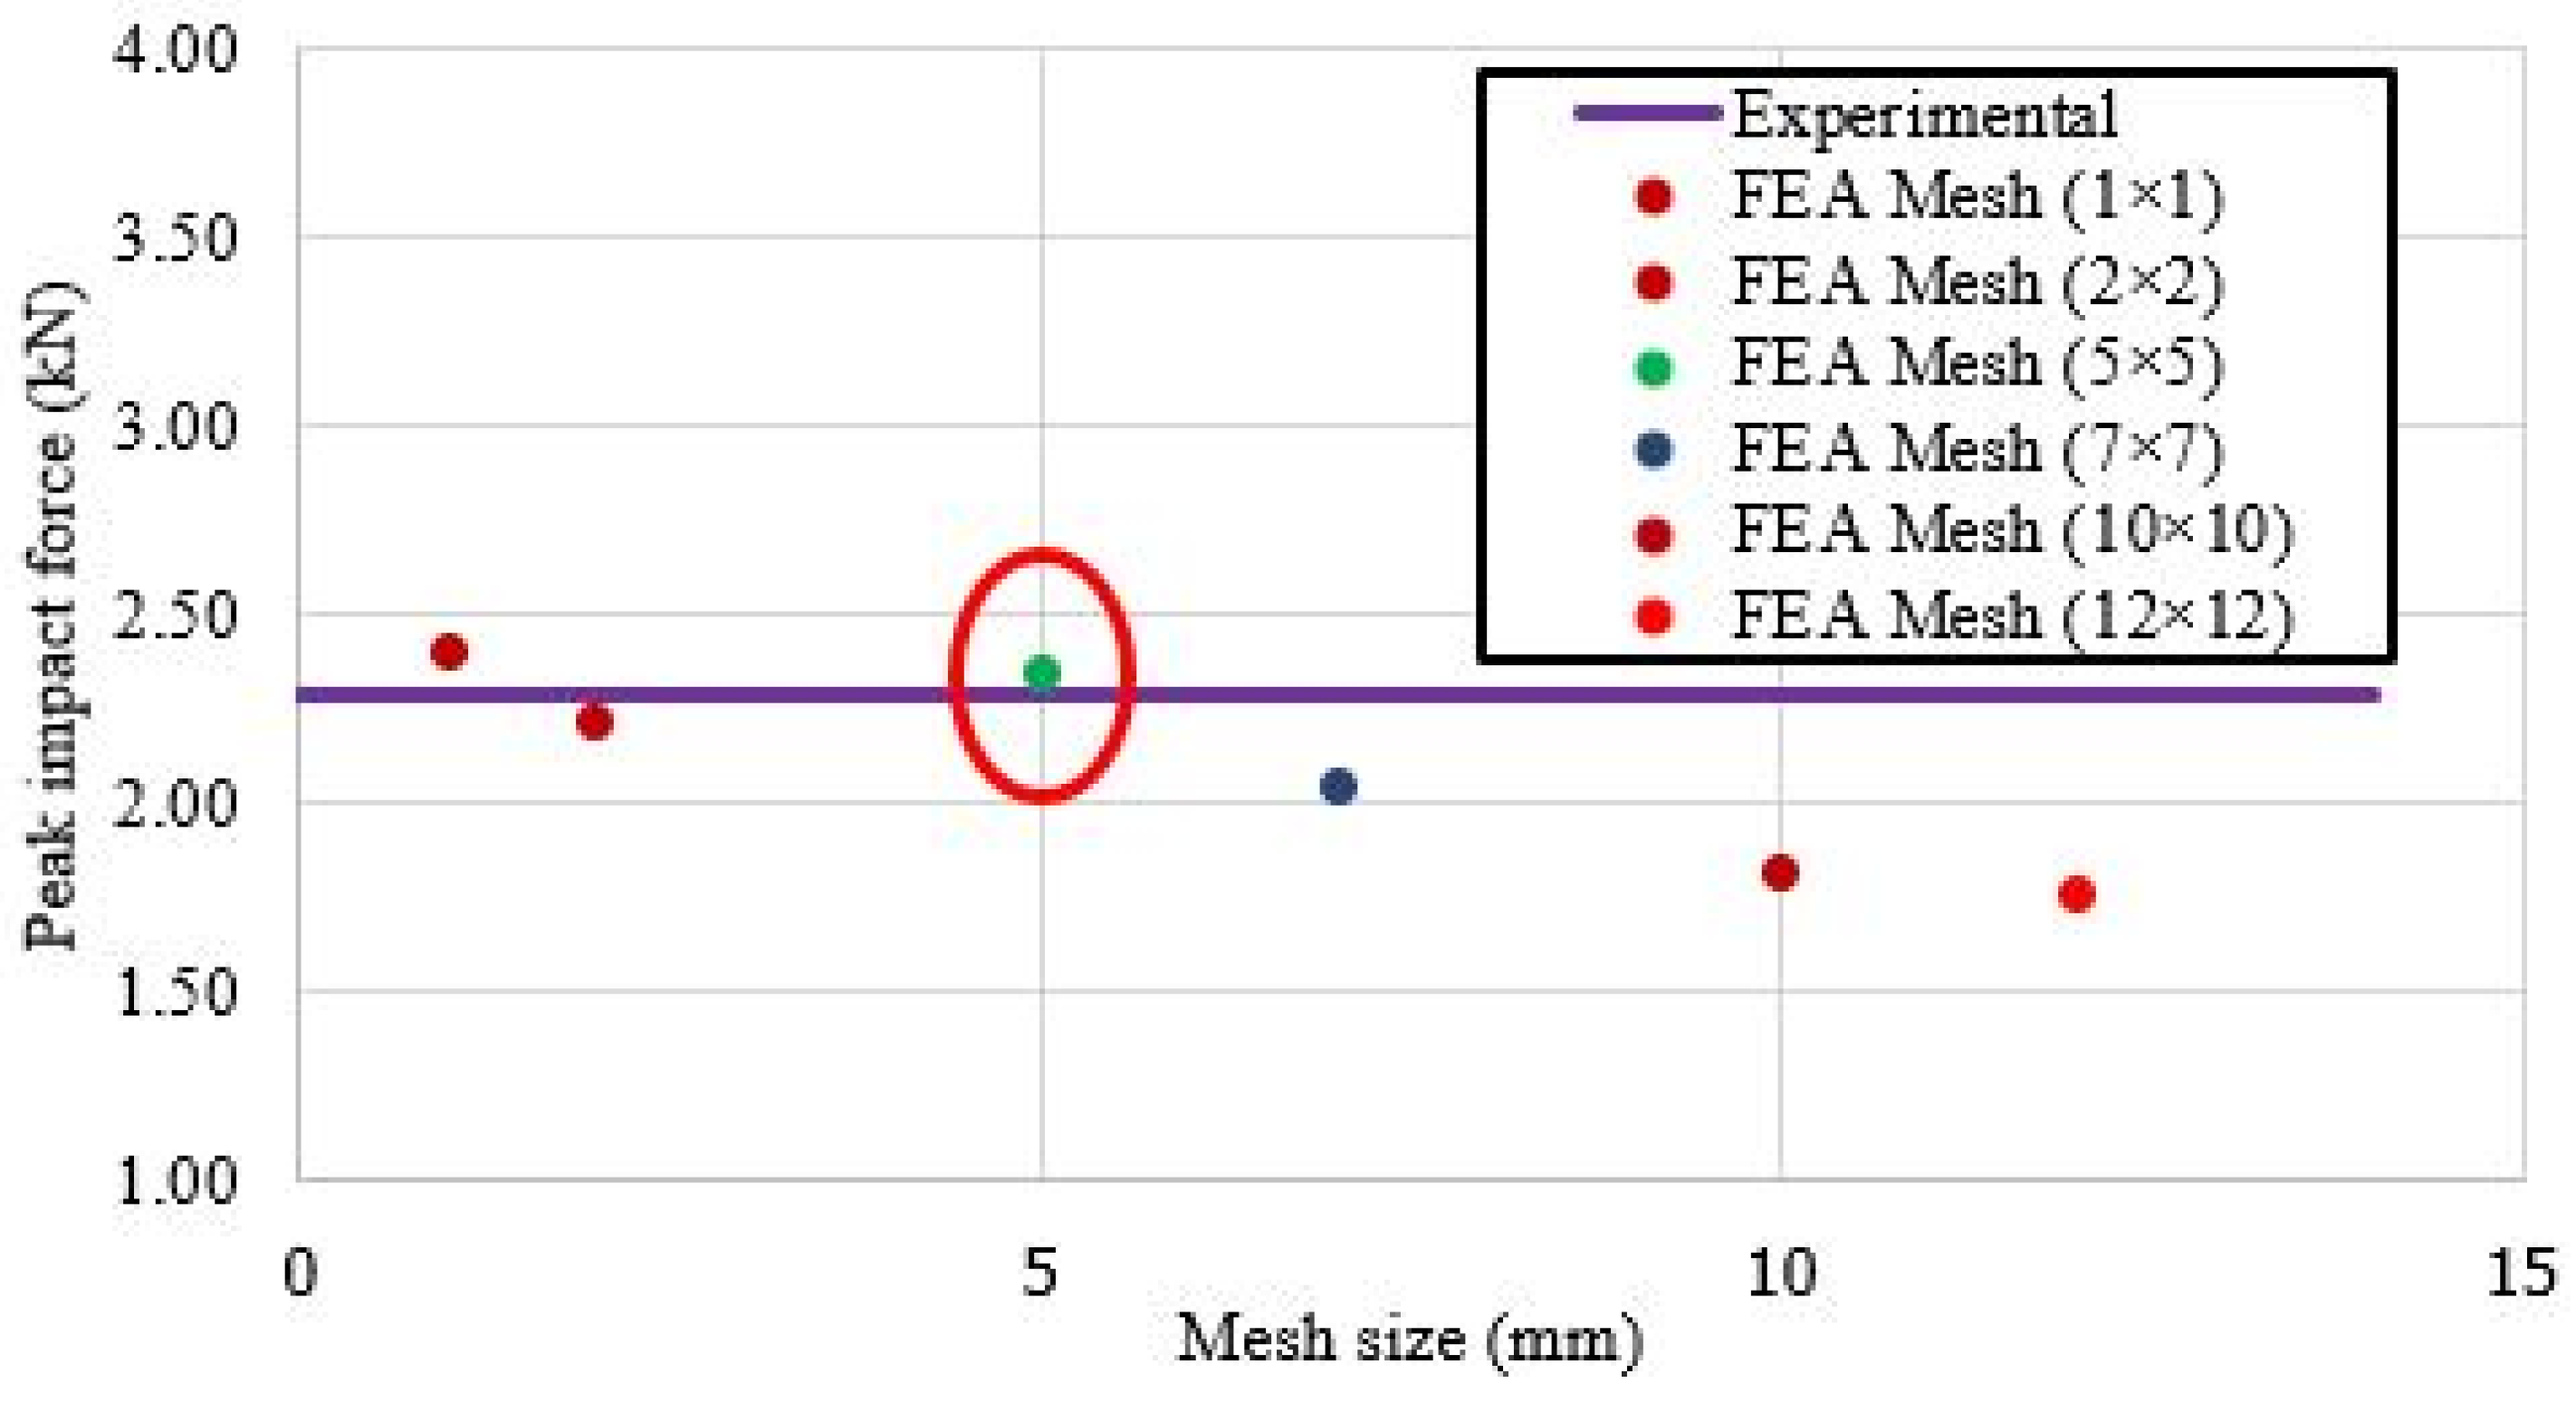
2.1.1. Element Type and Size

A review of the published literature showed the preference of the majority of researchers [9,13,18,22,23] to use a general-purpose linear brick element, with reduced integration (C3D8R), for the simulation of the targeted plate; however, shell elements can be a significant time saver because they enable the modeling of thin features with fewer elements than solid elements [24]. Furthermore, shell elements address Jacobian errors arising from thin solid features. Thus, a 4-node general-purpose shell, reduced integration with hourglass control, and finite membrane strain elements (S4R) were employed in the proposed model to simulate the behavior of aluminum panels. The computational time recorded for the analysis of the proposed model with shell elements was less than half of that when solved with solid elements (refer to Figure 2). The projectile was modeled as a solid deformable body (C3D8R). A solid deformable projectile is closer to what practically happens when a projectile (deformable body, usually roof tiles or battens) falls from the roof of the building and hits a wall/roof cladding panel.
The appropriate use of the element size is important in finite element analysis (FEA) to effectively simulate the deflection-time history and force–time history of aluminum panels. Thus, a convergence study was considered in the finite element modeling of the aluminum plates. A plateau was noted between 2 mm and 5 mm mesh size with a percentage difference of around 1%. The mesh size 5 × 5 mm (both for the projectile and the plate) was found to be the most suitable for the finite element modeling of the proposed model (refer to Figure 3).

2.1.2. Material Model

Two commonly utilized material models used for the simulation of aluminum panels are (a) the piecewise linear plasticity model and (b) the Johnson–Cook material model. Many of the previous studies [9,14,15,18] have used the Johnson–Cook model to define material properties. The Johnson–Cook material model requires various parameters to be used as input, most of which should be obtained from experimental testing. This makes it a less cost-effective solution. To address this difficulty, a piecewise linear plasticity model was employed in this study. Two different alloys of aluminum, i.e., AA5083-H116 and 6082-T6, were used to develop the proposed model. The engineering stress-strain curves for AA5083-H116 and 6082-T6 were adopted from the previous studies [9,20]. The analytical equations used for converting the engineering stress–strain into true stress–strain are shown in Equations (1) and (2), and the true strain was converted to plastic strain using Equation (3) [23].
σtrue = σengineering × (1 + εengineering)
ε true = ln ( 1 + ε engineering )
ε plastic = ε true σ t r u e E
where E represents the modulus of elasticity. The material properties used as input in the plasticity model are given in Table 1.

2.1.3. Dynamic Increase Factor

The dynamic effects of strain rates that highly influence the force–time history should be taken into consideration in the simulation of impact loading [20]. They are defined by scaling the static yield stress with the factor assumed by the Cowper–Symonds relation (POWER LAW) [21] given in Equation (4).
σ ¯ = σ 0 ( ε ¯ p l , θ , f i ) R ( ε ¯ p l , θ , f i )
where σ ¯ is a material’s yield stress, σ 0 ( ε ¯ p l , θ , f i ) is the static stress–strain behavior and ( ε ¯ p l , θ , f i ) is the ratio of the yield stress at a non-zero strain rate to the static yield stress so that R ( 0 , θ , f i ) = 1.0.
ε p l = D ( R 1 ) n
Previous studies [9,18,19,27] have neglected the effect of parameters D (multiplier) and n (exponent) on the impact force (refer to Equation (5)). In this study, based on the established ranges from the literature [6,20], a series of values, i.e., 2, 4, 4.5, 5, 5.5, and 6, were considered for the parameter n, where the value of D was kept constant at 5000. In the next phase, this value of n was kept constant, varying the value of D from 5000 to 500,000 to assess the influence of D on the impact force [20].

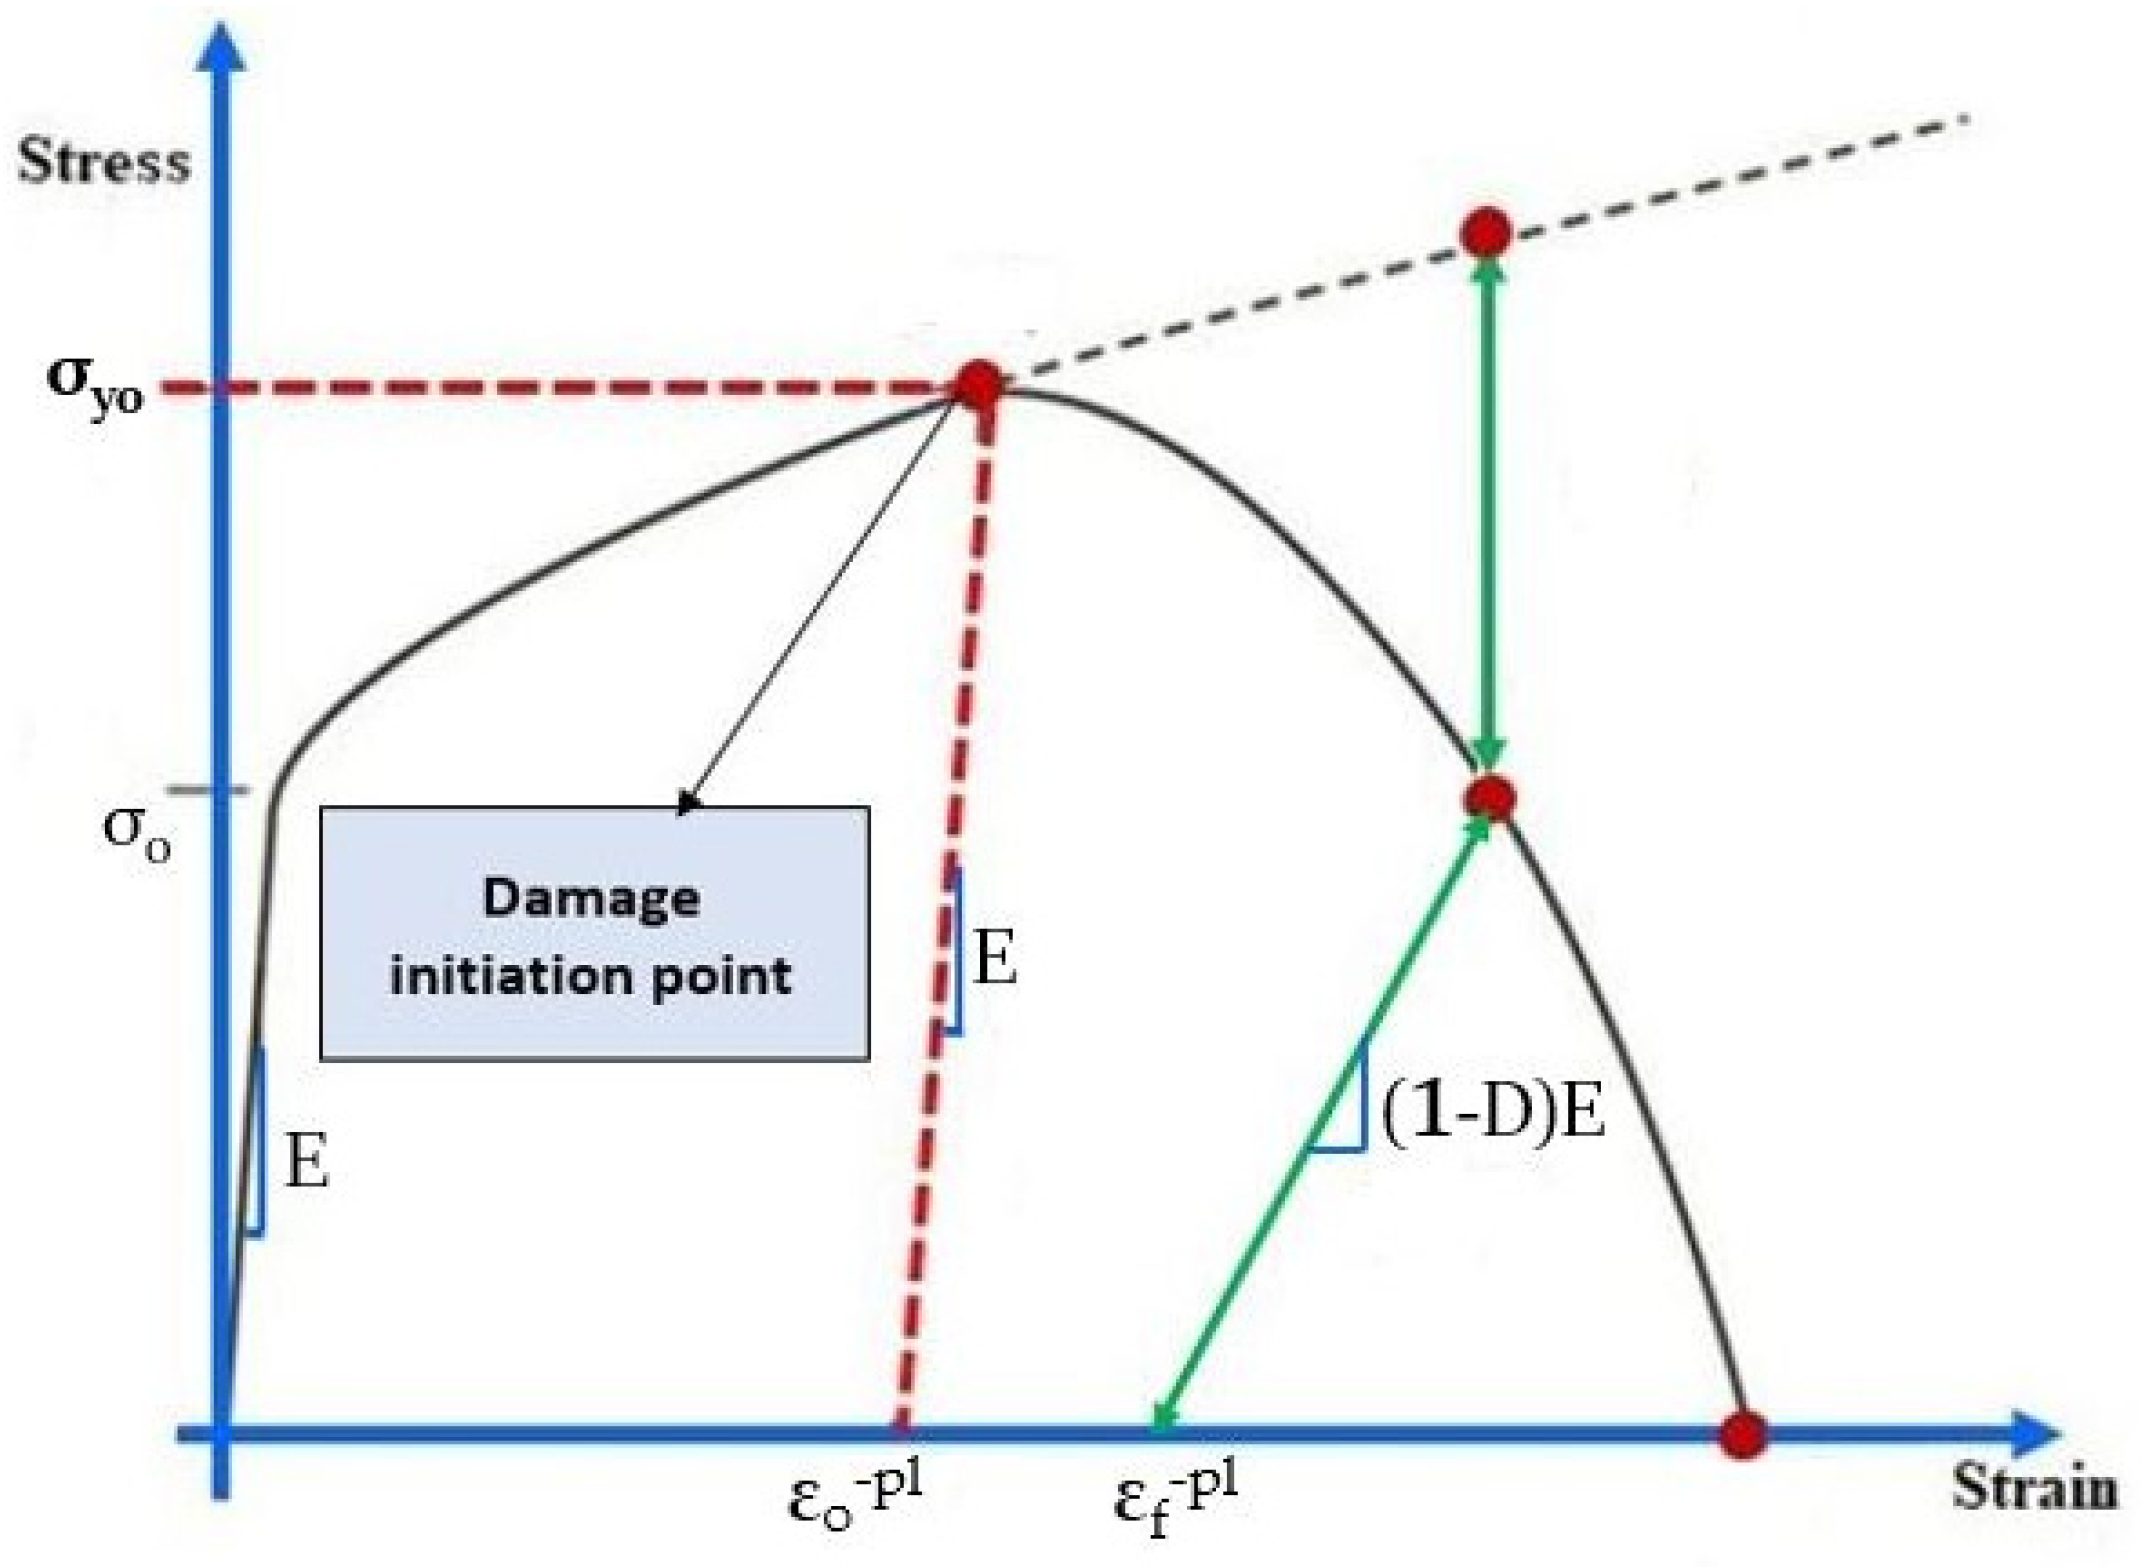
2.1.4. Damage to the Ductile Metals

The plastic behavior of aluminum is best defined using the piecewise linear plasticity material model to the point where the plate has not experienced bulging. But when fracturing is expected (at critical strain), it is important to define the damage initiation. ABAQUS [21] offers a variety of choices of damage initiation criteria for ductile metals, each associated with distinct types of material failures. The damage evolution in ABAQUS [21] is defined by using the values of the fracture strain. The fracture strain is the point where damage initiates. In Figure 4, σyo and εf−pl are the yield stress and equivalent plastic strain at the onset of damage. εo−pl is the equivalent plastic strain at failure.
Previous studies [9,20,27] have investigated the behavior of solid aluminum panels before perforation and have not studied the damage to these panels. In the proposed model, the values of the plastic strain for damage initiation (fracture strain) were calculated from the true stress vs. plastic strain curves that were plotted using Equations (1) and (3). The offset method was used to find the value of the plastic strain (0.091 mm/mm) at the ultimate yield strength (274 MPa), which is the point of damage initiation.

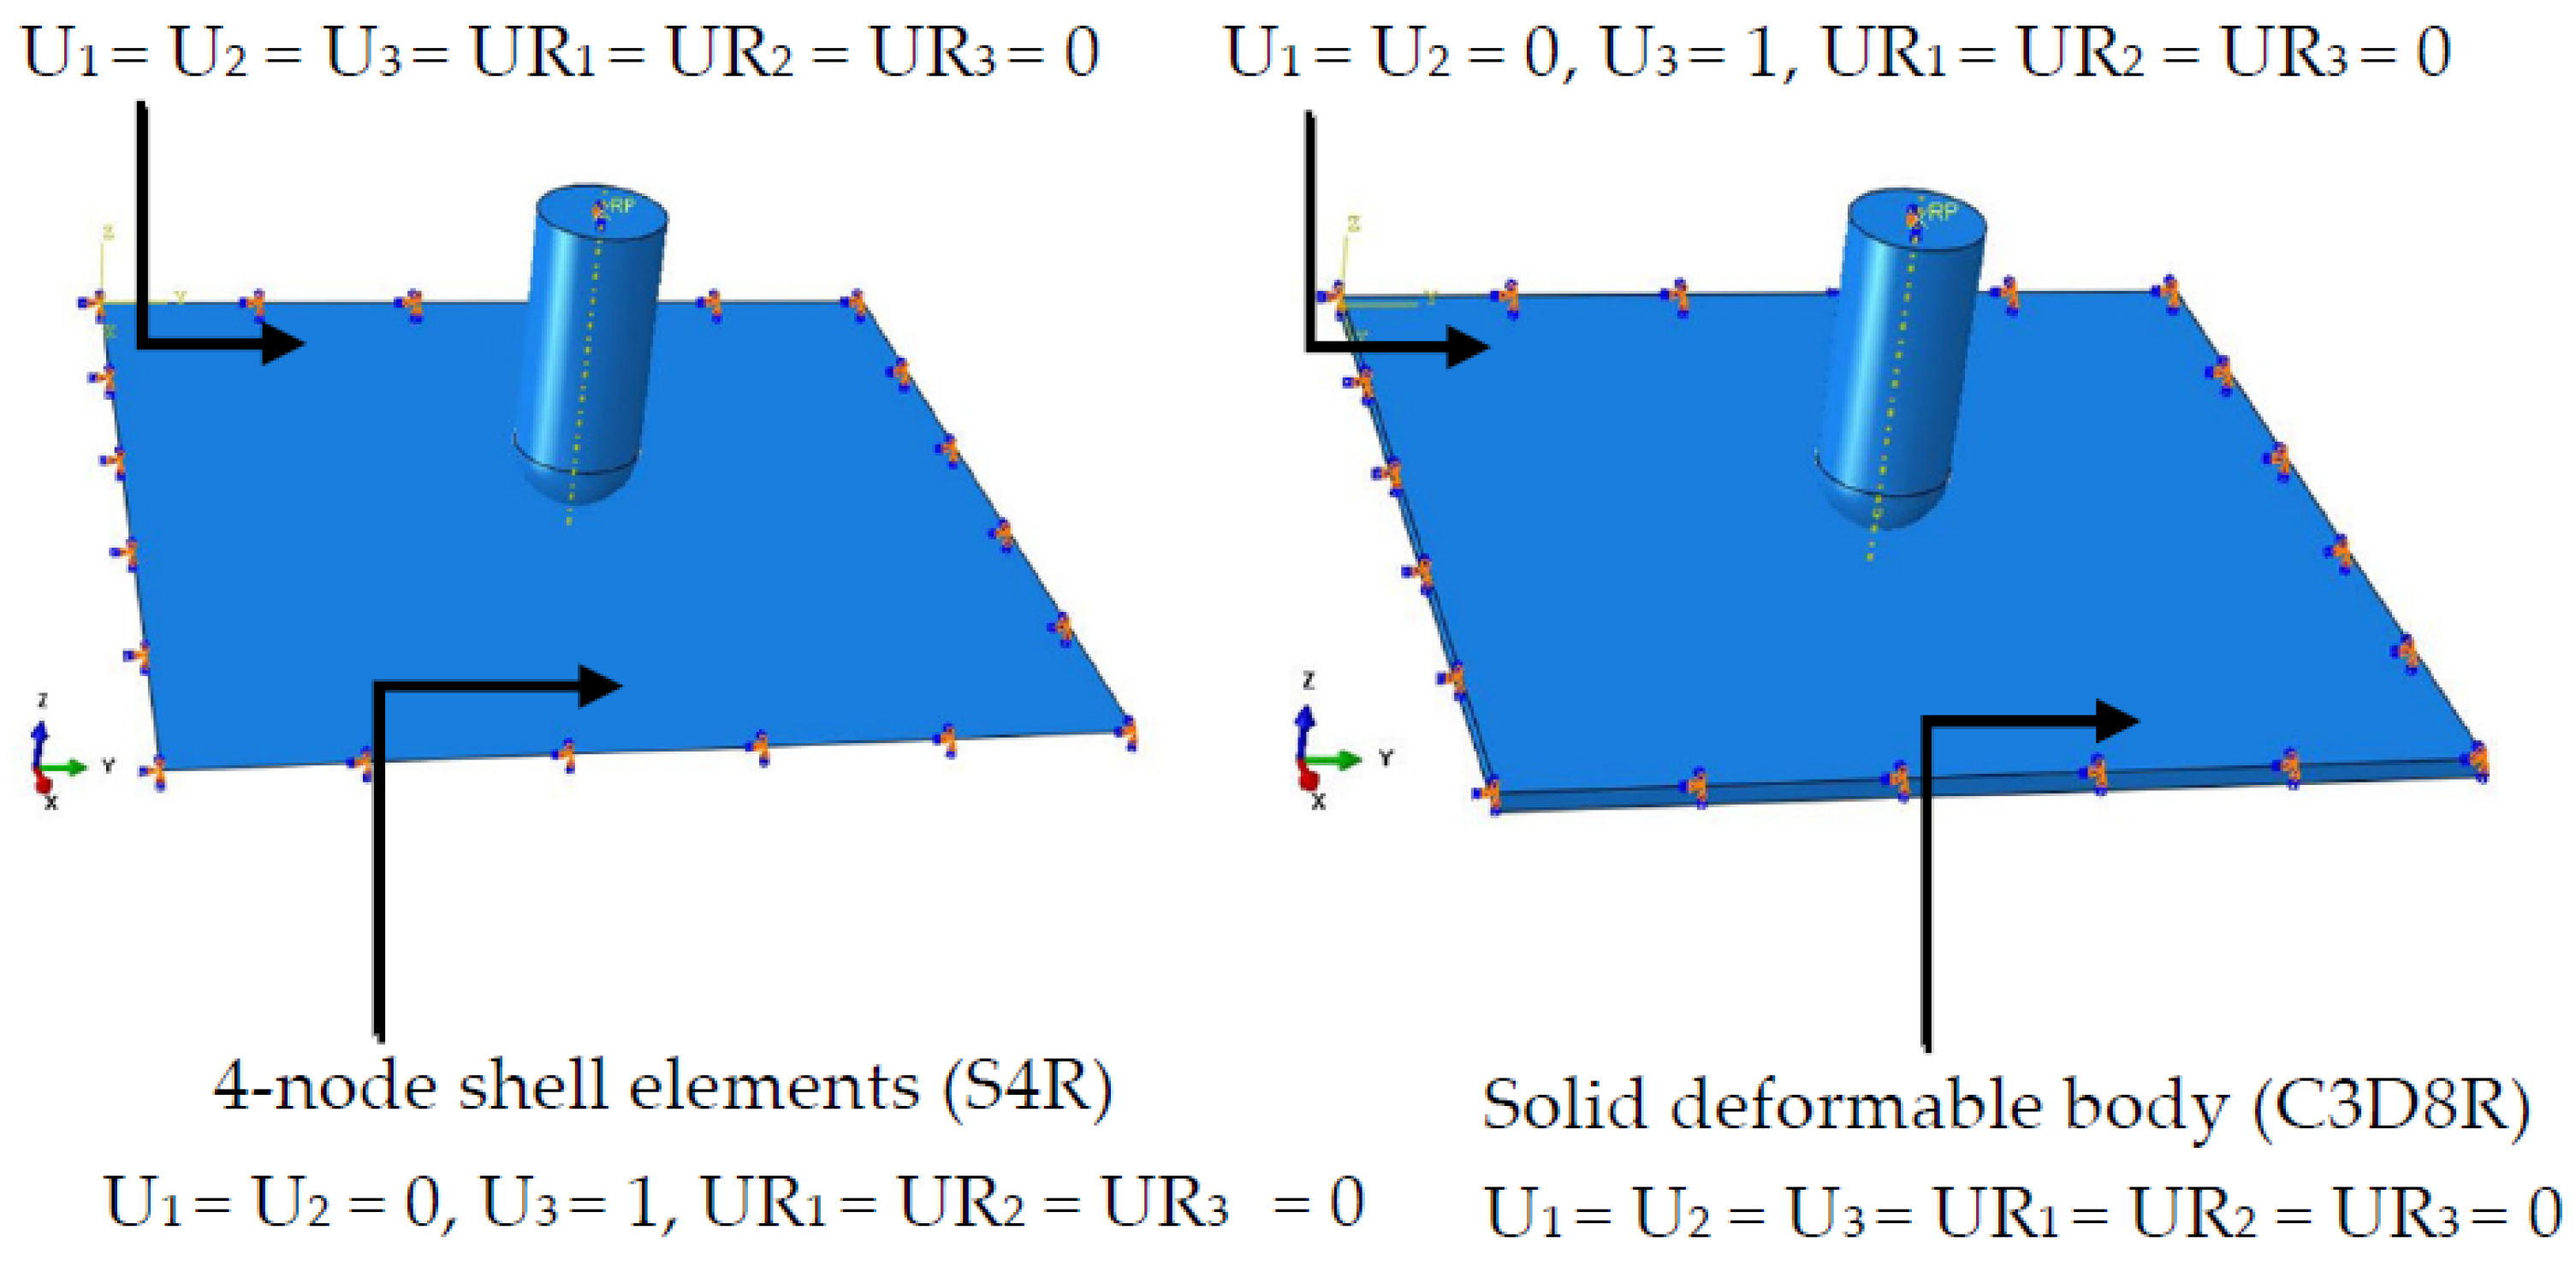
2.1.5. Loading and Boundary Conditions

The load was applied to the reference point of the projectile in terms of velocity as a predefined field. Fixed boundary conditions were used for the target plate, which means translational displacements and rotations of the plate were restrained in all directions (U1= U2 = U3= UR1 = UR2 = UR3 = 0). In the case of the projectile, its translational displacements were restricted in all directions except the direction of the velocity (U1 = U2 = 0, U3 = 1), while the rotations were restrained in all directions (UR1 = UR2 = UR3 = 0).

2.1.6. Contact Algorithm

The surface-to-surface interaction with penalty contact was employed in the proposed model. The definition of the master and slave surfaces is arbitrary; however, in general, the master surface is defined as the stiffer body or the surface with a coarser mesh if the two surfaces have comparable stiffness [29]. In the proposed model, the mesh of the projectile and the target was of the same size, which is why the projectile (a stiffer surface) was defined as the master and the target plate as the slave surface.

2.1.7. The Difference between the Proposed Model and the Previous Models

A summary of the differences between the proposed model and those already published in the literature is given in Table 2. The assemblies of the proposed models are given in Figure 5.

2.2. The Proposed Base Model for the Impact of Timber Projectile

The objectives of the base model were to conduct a sensitivity analysis, generate a data bank, and determine the key controlling structural and load-related parameters that influence the dynamic impact performance of the solid aluminum cladding system exposed to timber projectiles. A base model was developed considering the specifications given in AS/NZ 1170.2_2021 [30]. A seasoned timber, Messmate stringybark (Tasmanian oak), with a density of 780 kg/m3, modulus of elasticity of 15,000 MPa, and poison ratio of 0.40, was employed in the proposed base model [26]. The projectile was modeled as a deformable body with a mass of 4 kg. A velocity of 2.8 m/s was assigned to it (see Figure 6). To finalize the type of alloy and the dimensions of the targeted plate, a survey was conducted to find out the most commonly used alloys of aluminum and the dimensions of the plate. Based on the most commonly used criteria, a solid aluminum panel of 5052-H32 with the dimensions of 550 × 550 × 3 mm was used as a target plate [2,31,32]. A 4-node general-purpose shell, reduced integration with hourglass control, and finite membrane strain elements (S4R) were employed in the proposed model to simulate the behavior of aluminum panels. A piecewise linear plasticity model was used to define the behavior of 5052-H32 for which the stress–strain curve was obtained from the study of Ji-Woo Park [33]. The values of the density, poison ratio, and modulus of elasticity used in the base model are given in Table 1. The connection details of the plate in practice are given in Figure 7. It shows that the translational displacement and rotations of the plate are restricted in all directions by a system of screws and aluminum Z-sections fully fixed to the perimeter of the panels. Considering this, fixed boundary conditions were applied to the aluminum plate in the proposed base model. Similarly, the translational displacement and rotations of the projectile were restricted in all other directions except the direction of drop. The surface-to-surface interaction with penalty contact was employed in the base model. The top of the projectile, which comes in contact with the plate, was assigned as the master surface and the target plate as the slave surface. A mesh convergence study was conducted to find the mesh size that can provide a balance between accuracy and computational cost. A plateau was noted between the 15 and 20 mm mesh sizes, with a percentage difference of around 1%, so a mesh size of 20 × 20 mm was used in the base model.

3. Validation of the Robust Numerical Model

The values of (a) the peak impact force, (b) maximum, and residual deflection obtained from the proposed numerical model were compared with the experimental results from the previous studies as well as the results of the pilot test. The reason for comparing it with previous studies was to find the range of the instrumentation (to be used in the pilot test) and to verify the numerical techniques. The pilot test was intended to further verify the numerical techniques, particularly when a timber projectile is used.

3.1. Validation of the Proposed Model Using Previous Experimental Studies

Table 3 shows the experimental studies that were selected to validate the robustness of the proposed model. The results obtained from the proposed numerical model when compared with the previous experimental studies showed good agreement.

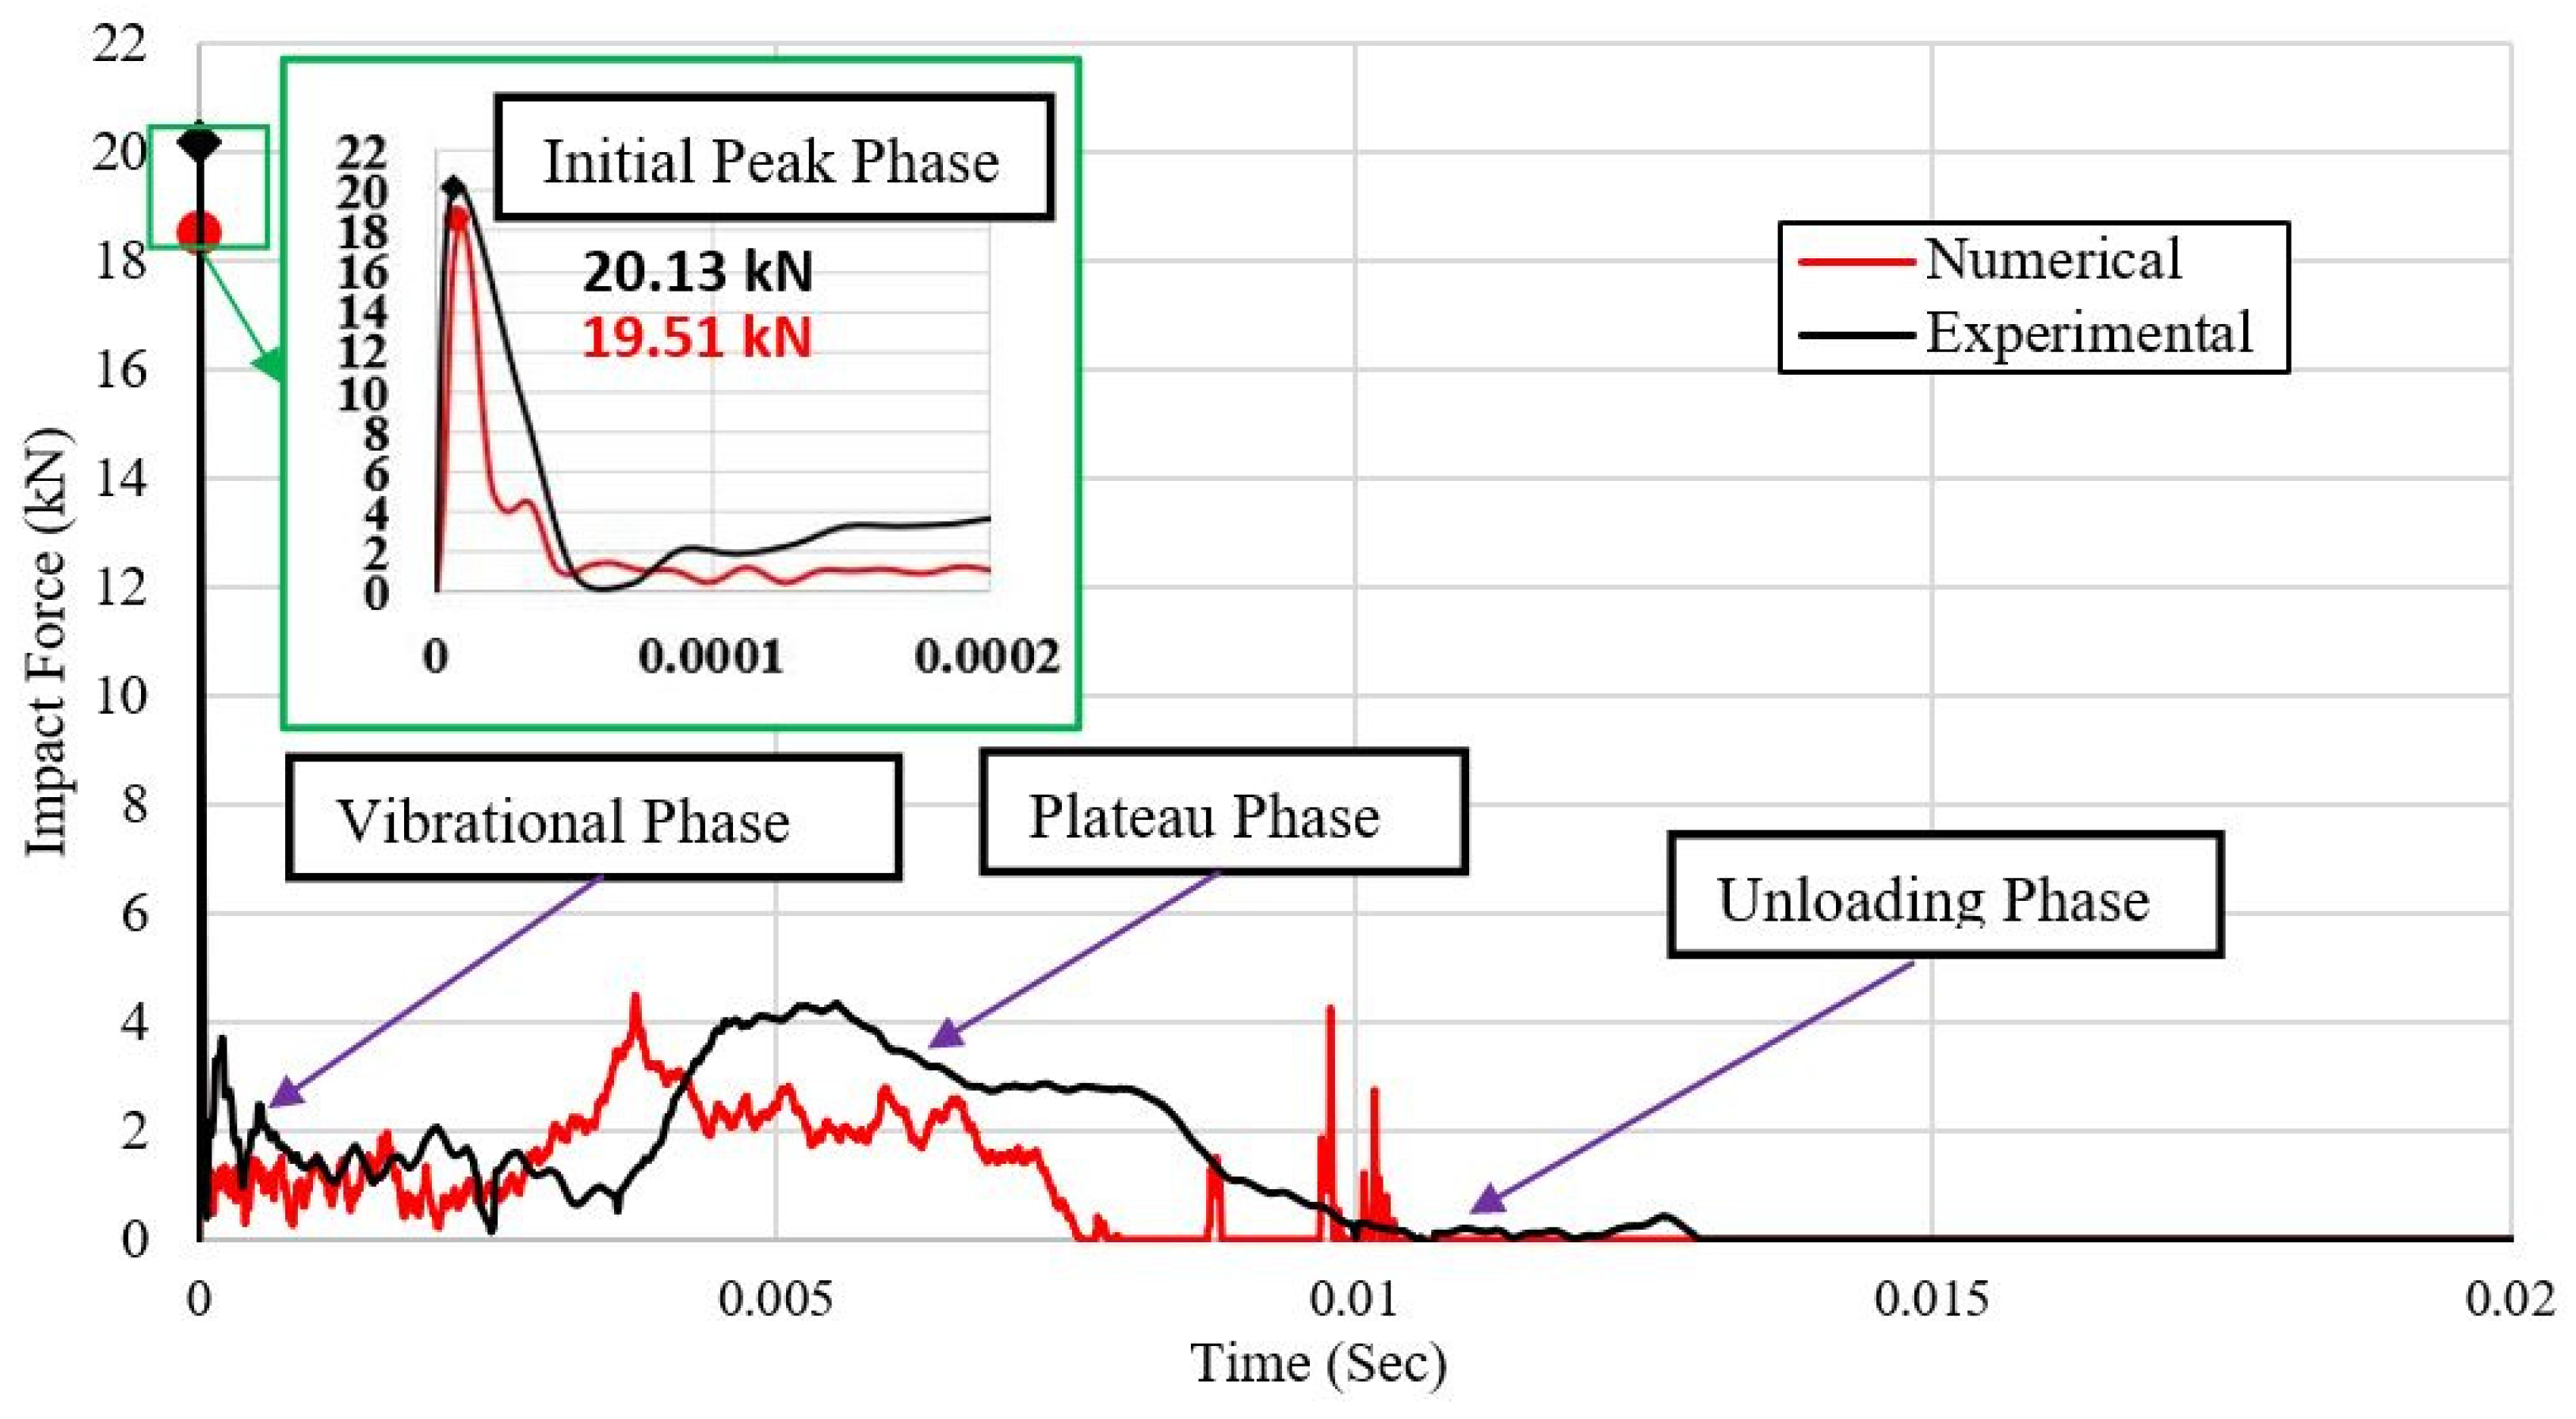
3.1.1. Comparison of the Peak Impact

Table 4, Table 5, Table 6 and Table 7 show the comparison of the results for the peak impact force. The percentage difference between the maximum value of the impact force predicted using the proposed numerical model and the values recorded during the experiments conducted by the previous researchers was found to be less than 10% for all the studies used as references. This is while the percentage difference between the previous numerical models with experimental was more than 10% for some cases, thus confirming the robustness of the proposed model [18]. The analysis of the influence of the Cowper–Symonds parameters on the peak impact force showed that as the values of the Cowper–Symonds parameters (multiplier and exponent) are increased, so are the stresses (refer to Equations (4) and (5)); however, this effect was not very prominent at lower velocities. These results were in line with the findings from the studies of Mocian et al. (2018) [20] and Hussain et al. (2021) [6].

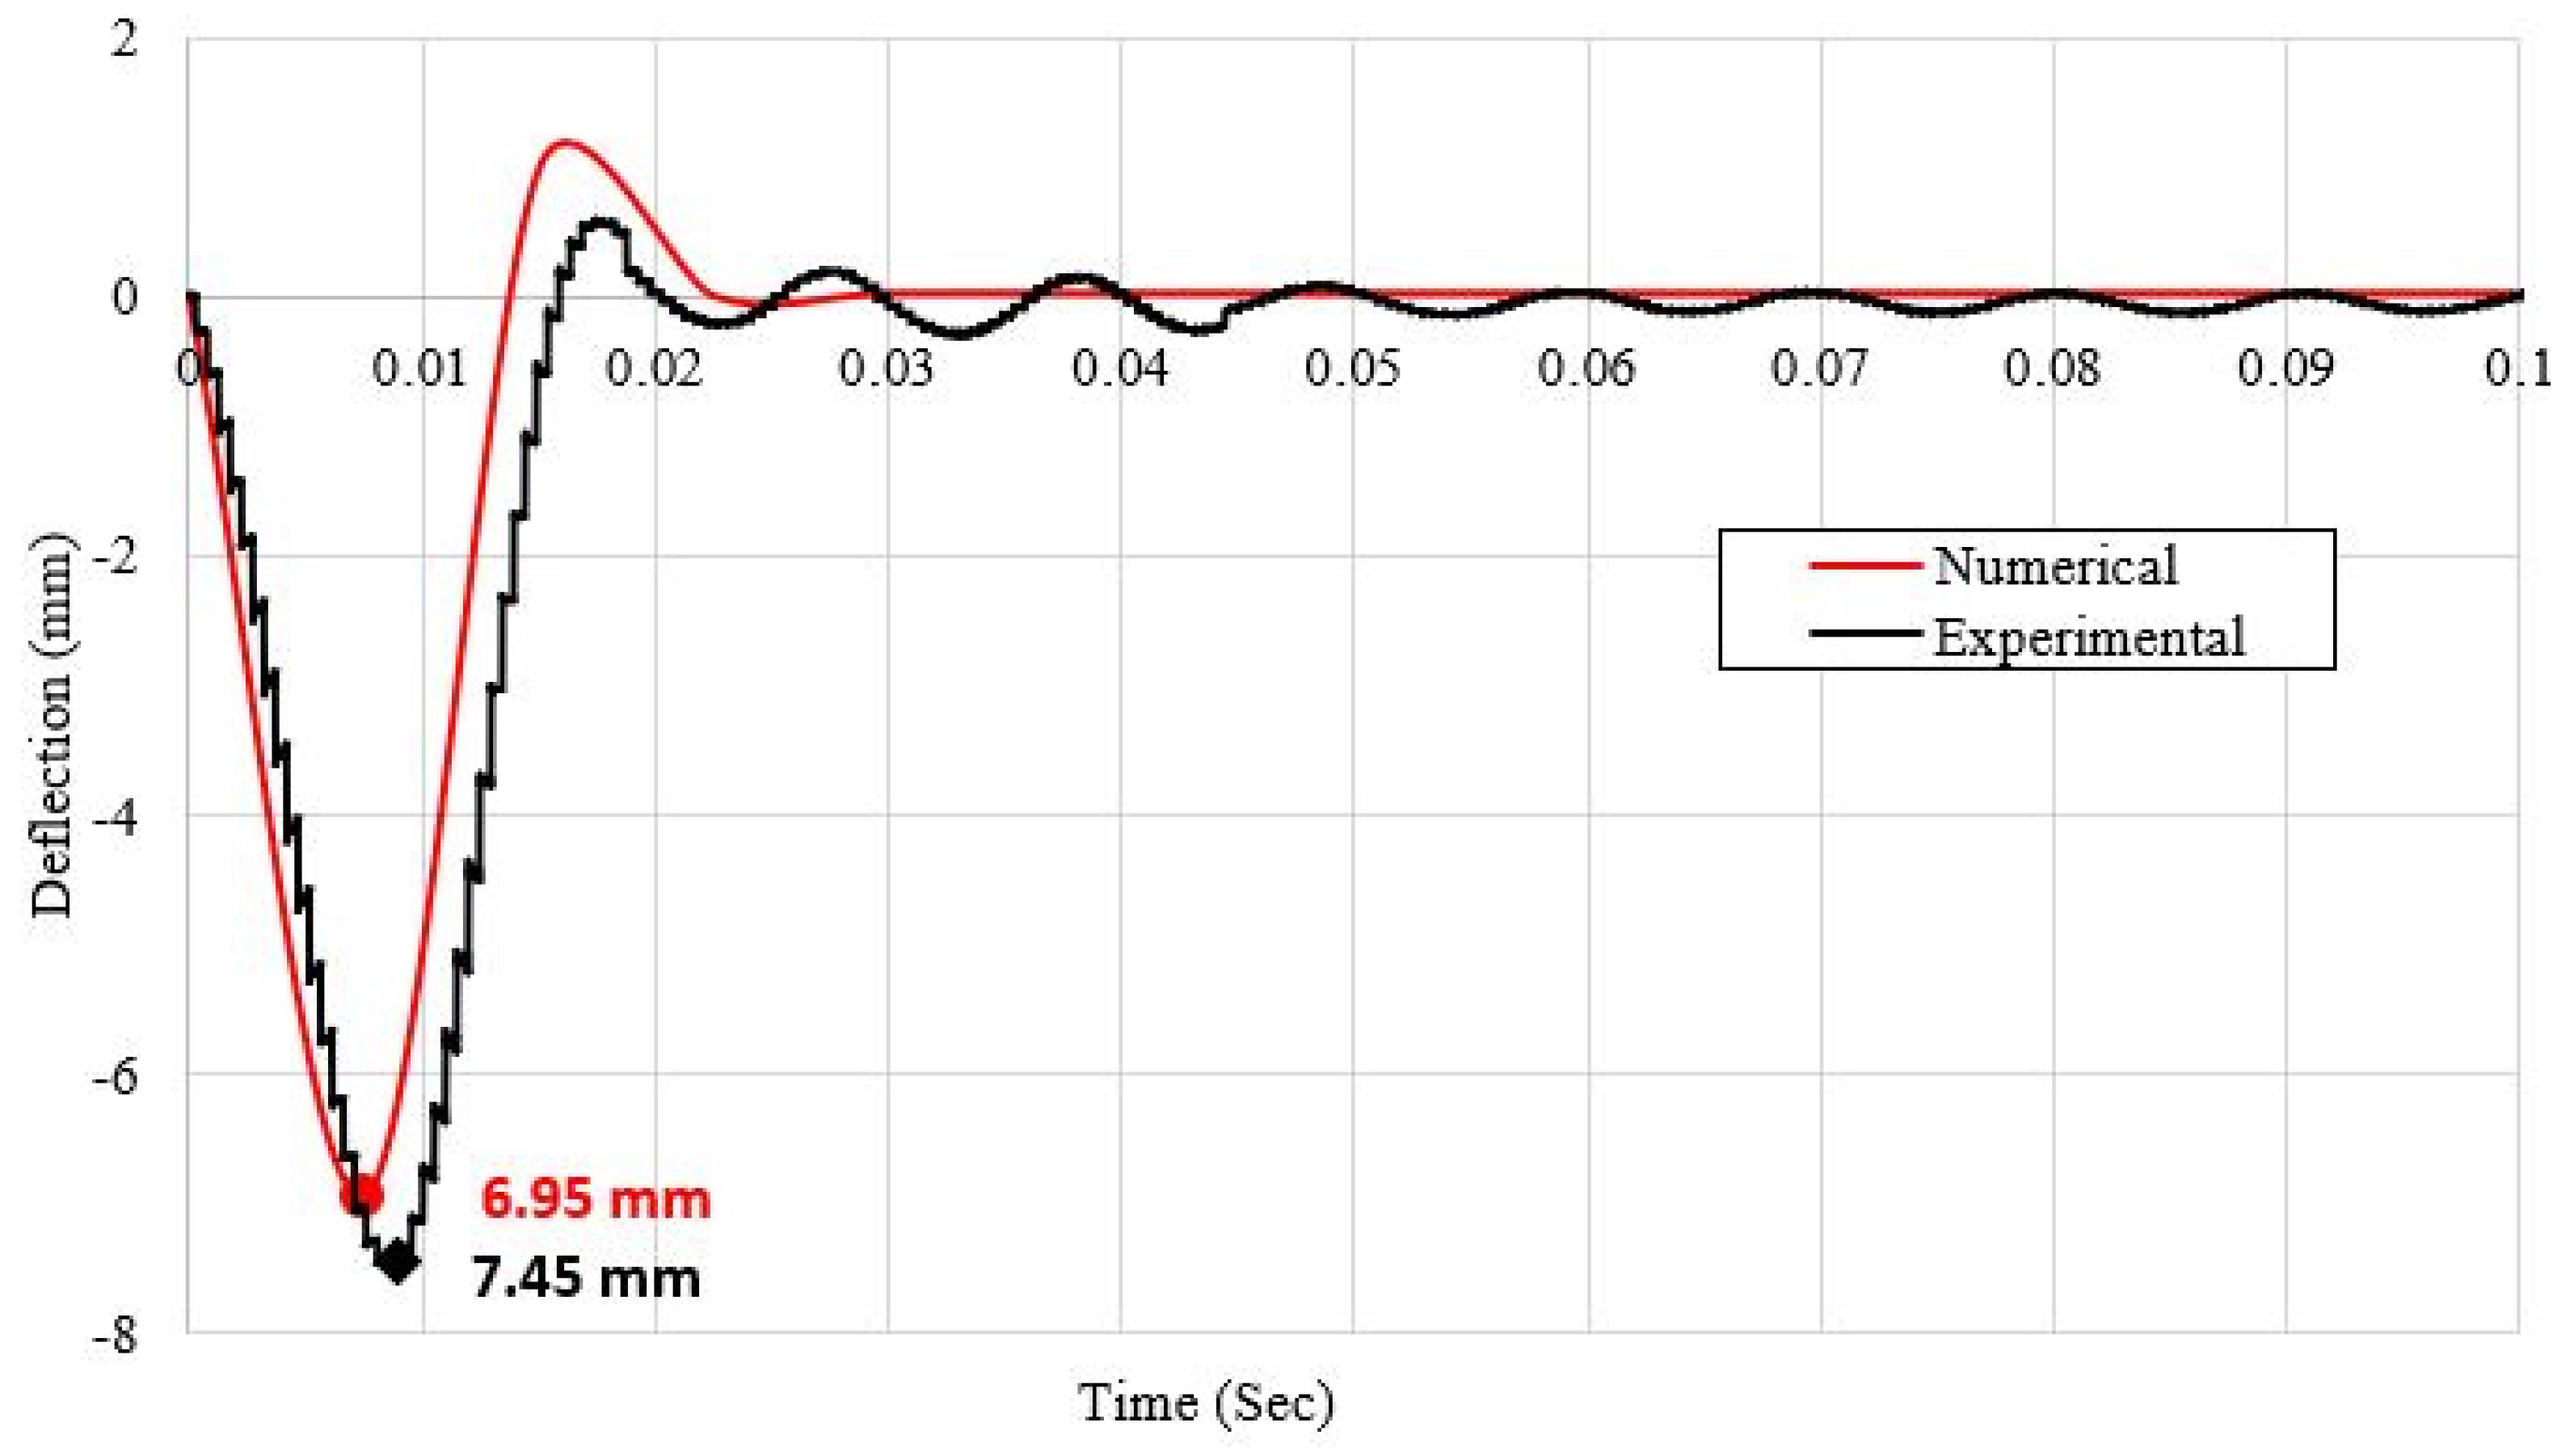
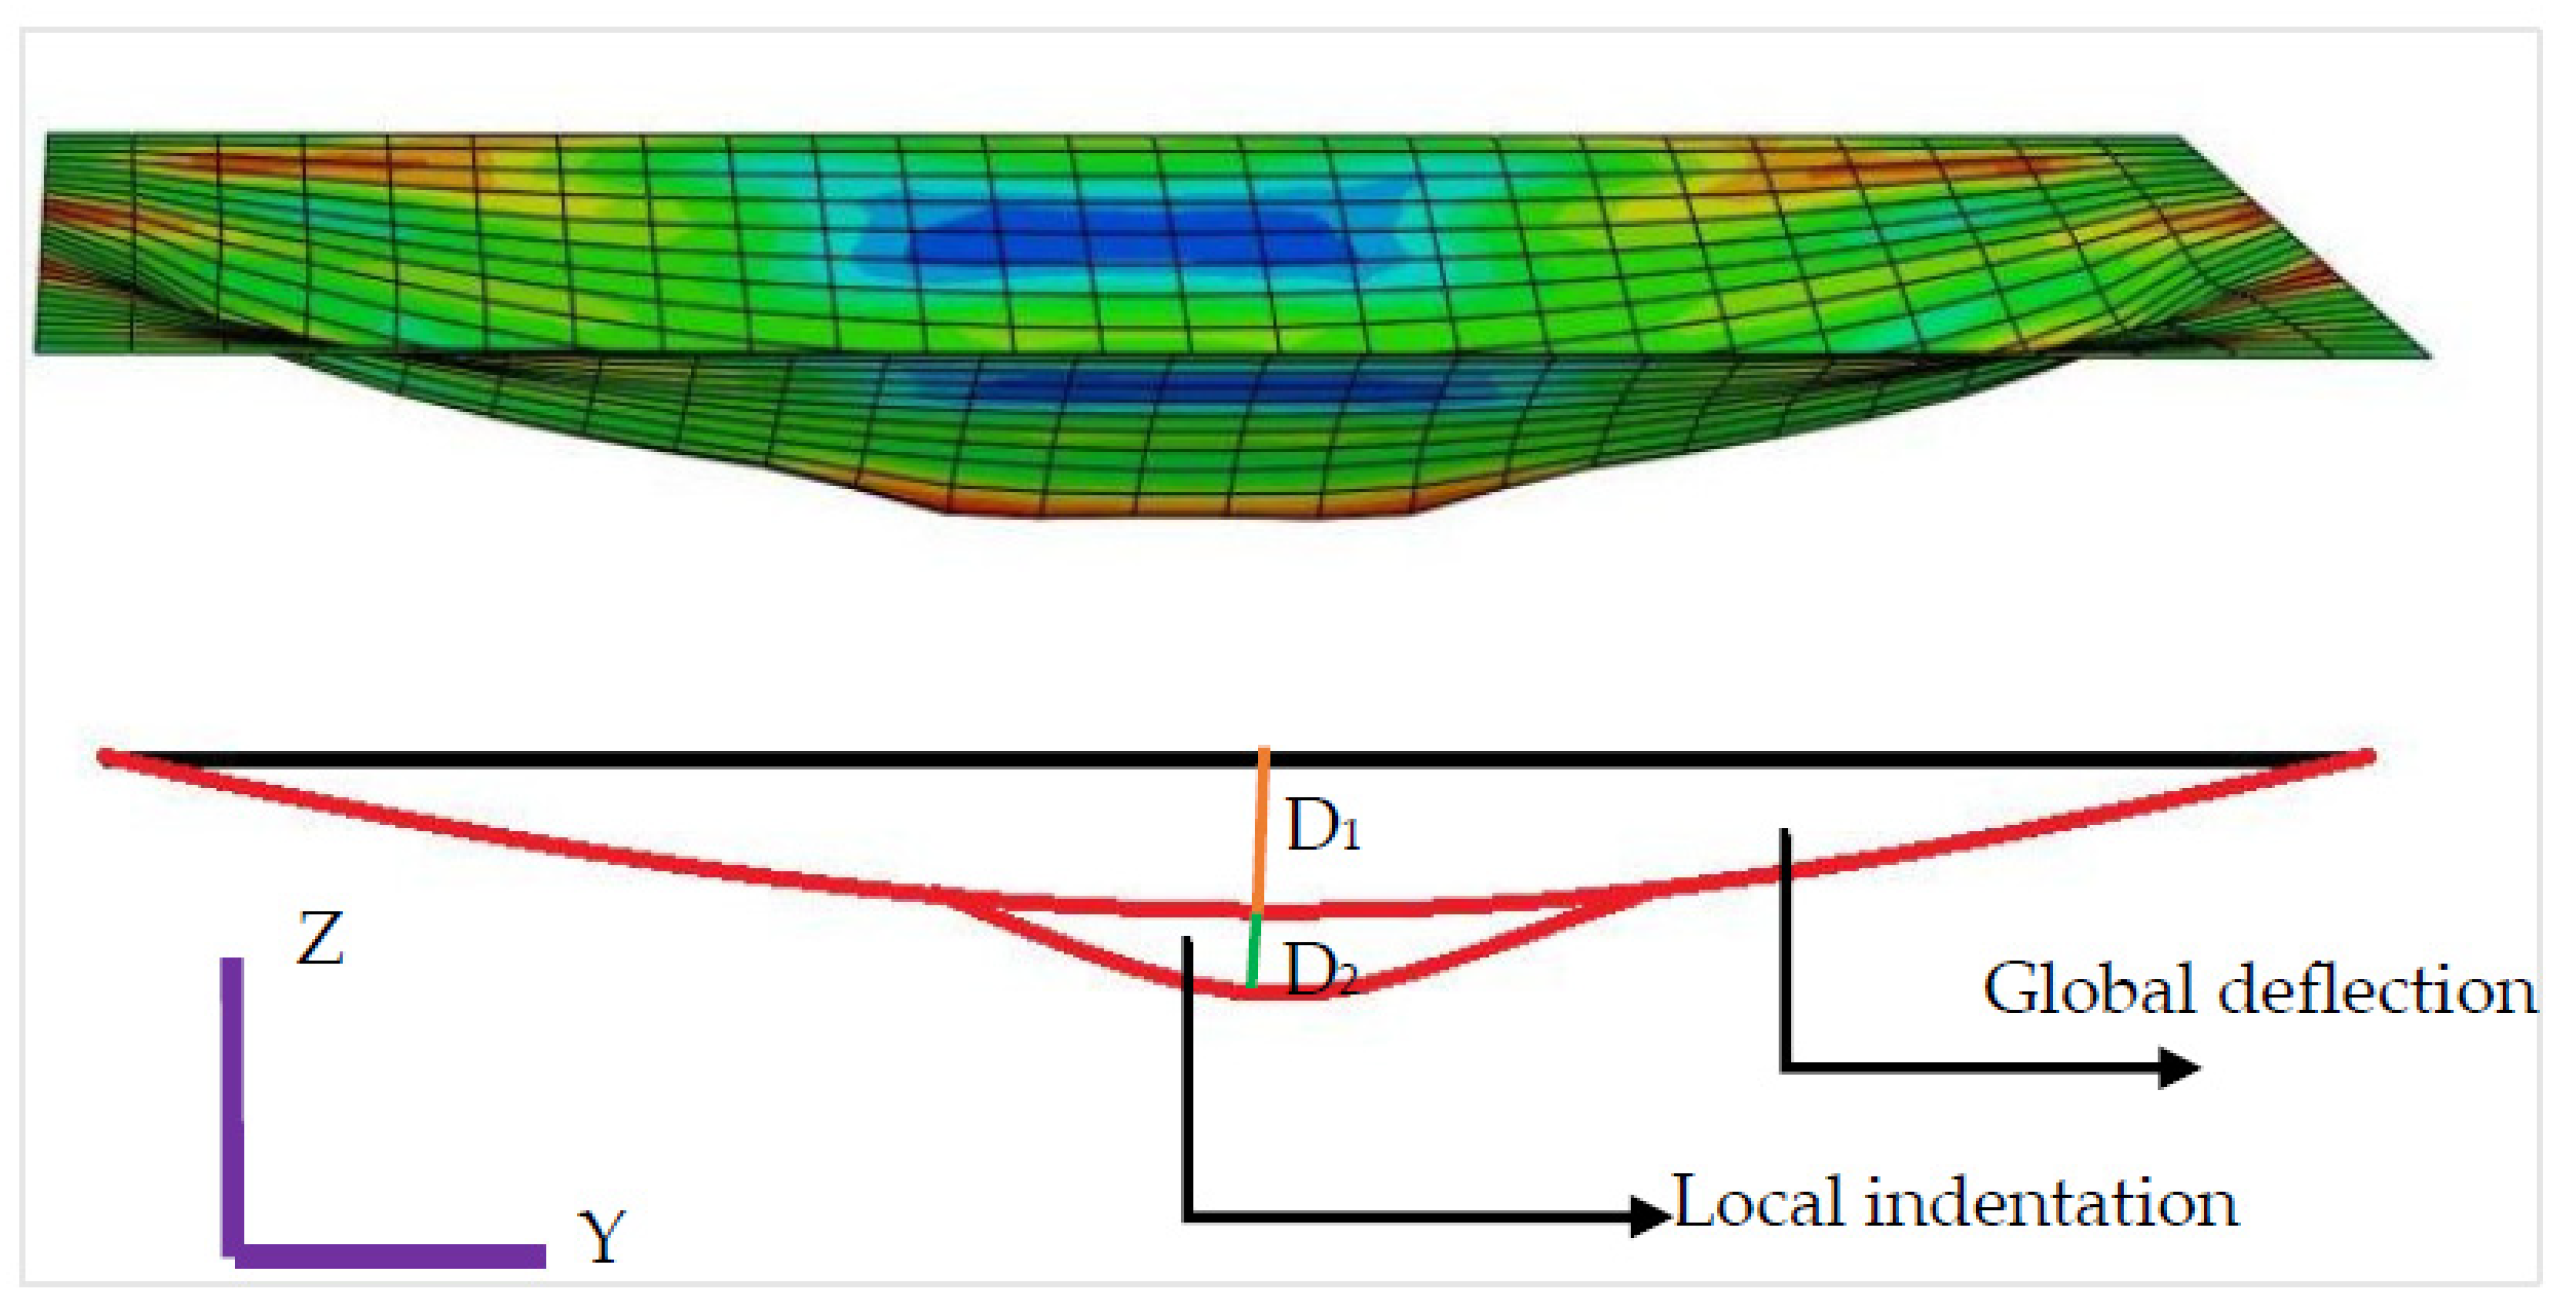
3.1.2. Comparison of the Maximum Deflection and Residual Deflection

Table 8, Table 9, Table 10 and Table 11 show the comparison of the results for the maximum deflection and the residual deflection. When compared with the study conducted by Mohotti et al. (2013) [9], the magnitude of the maximum deflection obtained from the proposed model was found to have less than a 3% difference from the experimental result (refer to Table 8); however, this percentage was slightly more (around 7%) for the residual deflection (refer to Table 9). The residual deflection was overestimated by the proposed model, similar to the one by Mohotti et al.’s (2013) [9] model. Similarly, the percentage difference in the predicted values by the proposed model had a difference of less than 10% when compared with the experimental results published by Fagerholt et al. (2010) [18] and Pathirana et al. (2018) [10] (refer to Table 10 and Table 11). Thus, it confirms the robustness of the proposed model for the prediction of the maximum and residual deflection when solid aluminum plates are subjected to impact loading.

3.2. Validation of the Proposed Model Using the Results of the Pilot Test

No existing literature provided studies in which an aluminum plate was subjected to wooden projectiles. Consequently, to validate the proposed base model with a timber projectile, an experimental test was conducted at the School of Engineering and Built Environment, Griffith University, Nathan Campus. The details of the experimental study conducted are provided in this section.

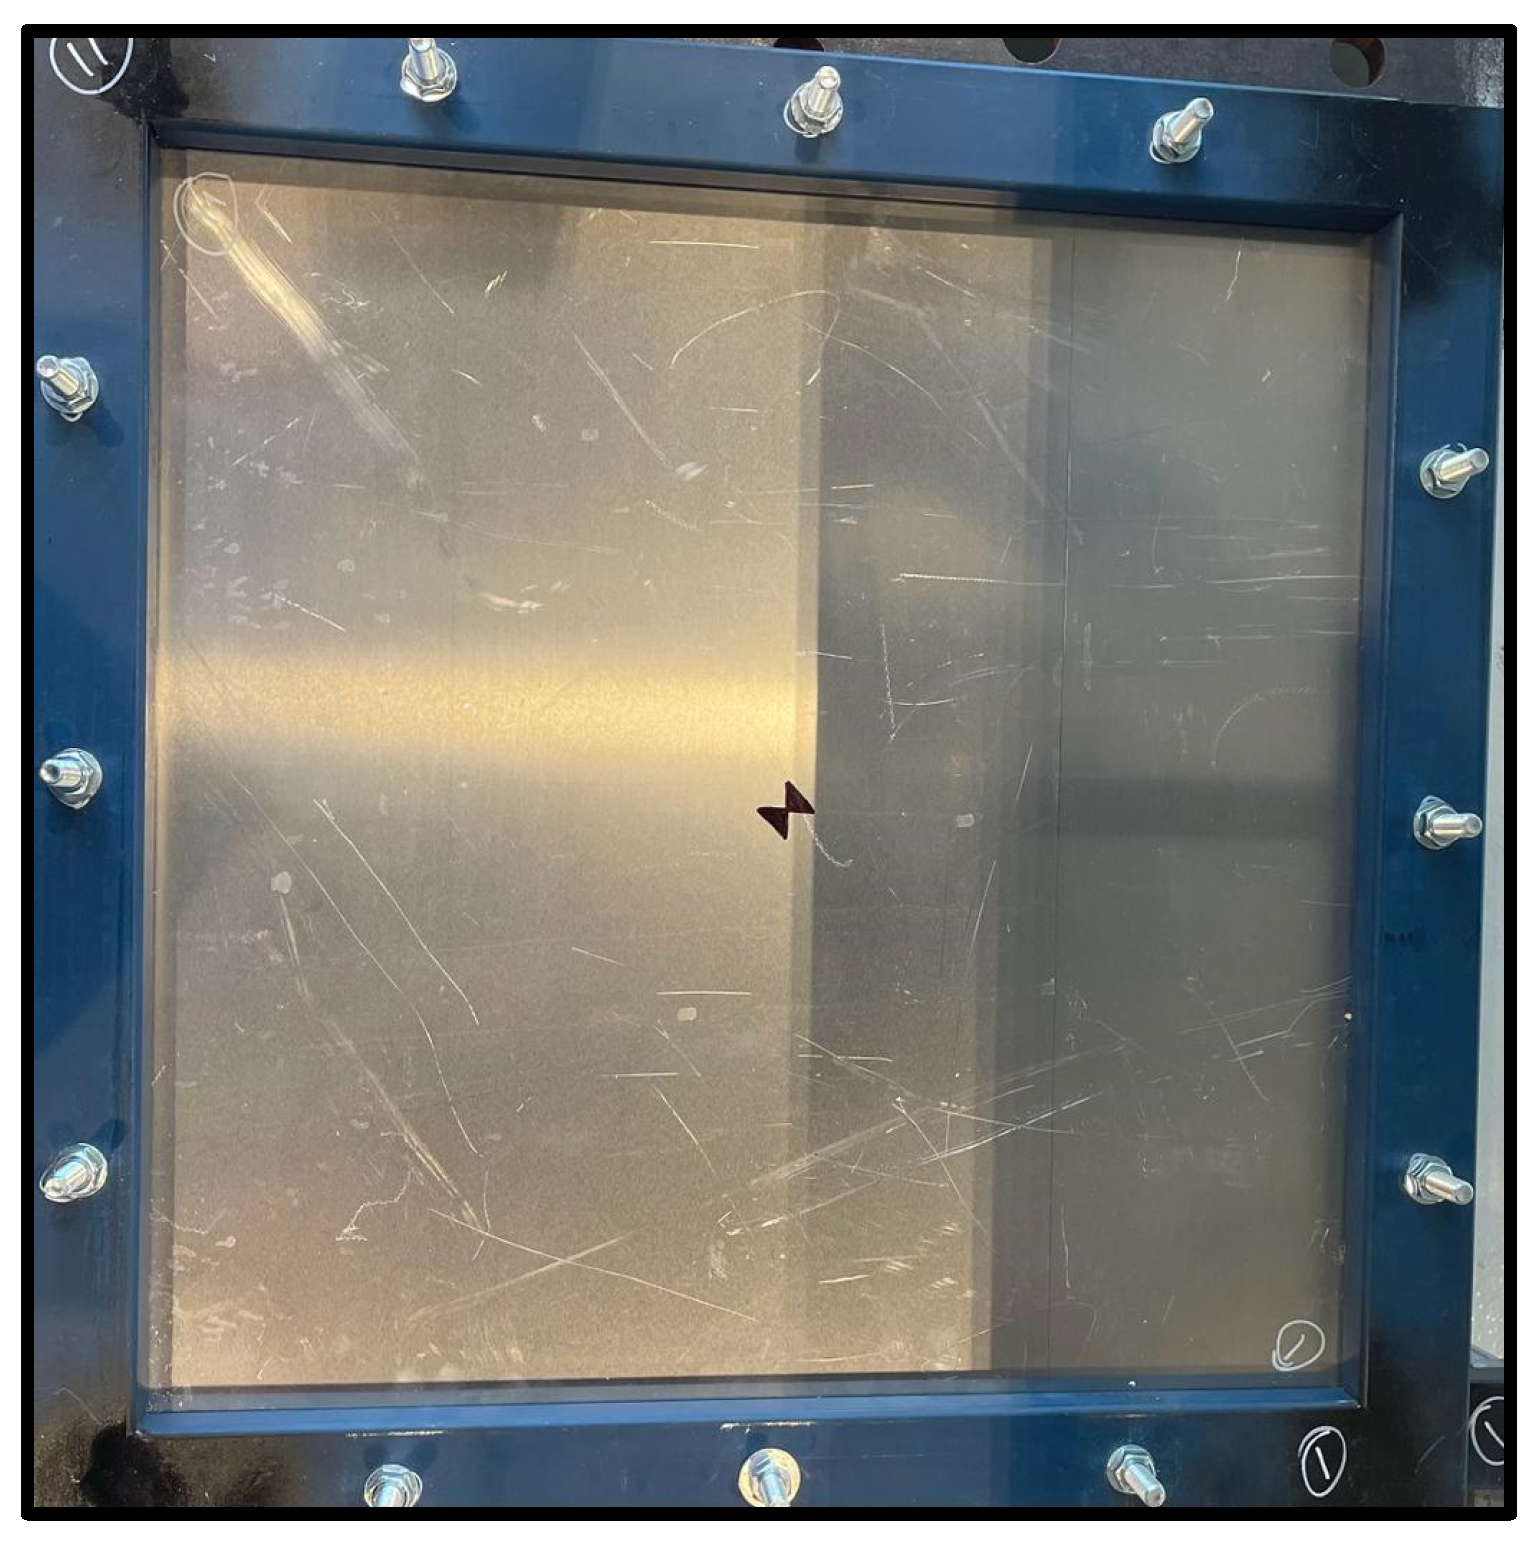
3.2.1. Test Setup and Procedure

The test setup consisted of a drop pipe to guide the projectile to hit the plate at the center. The test specimen was made up of a 3 mm thick aluminum plate of alloy 5052-H32 with a size of 550 mm × 550 mm that was held by a supporting frame using M10 bolts (see Figure 8). The unsupported area of the specimen was 500 mm × 500 mm. The AS/NZ 1170.2_2021 instructions were followed for the selection of the timber projectile. It states that where windborne debris is required for impact resistance testing, the debris loading shall be “a timber member of 4 kg mass (minimum density of 600 Kg/m3) with a nominal cross-section of 100 mm × 50 mm at the impacting end” [30]. The projectile was dropped with a velocity of 2.8 m/s from a height of 400 mm.

3.2.2. Instrumentation

A laser displacement sensor HG-C 100 was placed underneath the plate and was aligned along the vertical axis of motion of the projectile to record the readings for the deflection–time histories of the specimen for the impact test. HG-C1100 has a measurement range of ±35 mm, a sample rate of 26 K/s, and a measurement center distance of 100 mm. To record the acceleration of the projectile during the event, an accelerometer 7264D-2KTZ-2-360 ± 2000 g (a resonance frequency range of 40 kHz) was connected to the projectile at 50 mm from the impacting edge. The accelerometer was screwed inside the timber perpendicular to the direction of the drop as shown in Figure 9. It was used to record the acceleration–time history that was then employed to calculate the impact force–time history. The impact velocity of the projectile was determined using Equation (6).
V = √2gh
where V is the velocity of impact (m/s), g is the gravitational acceleration (m/s2), and h is the drop height (m).

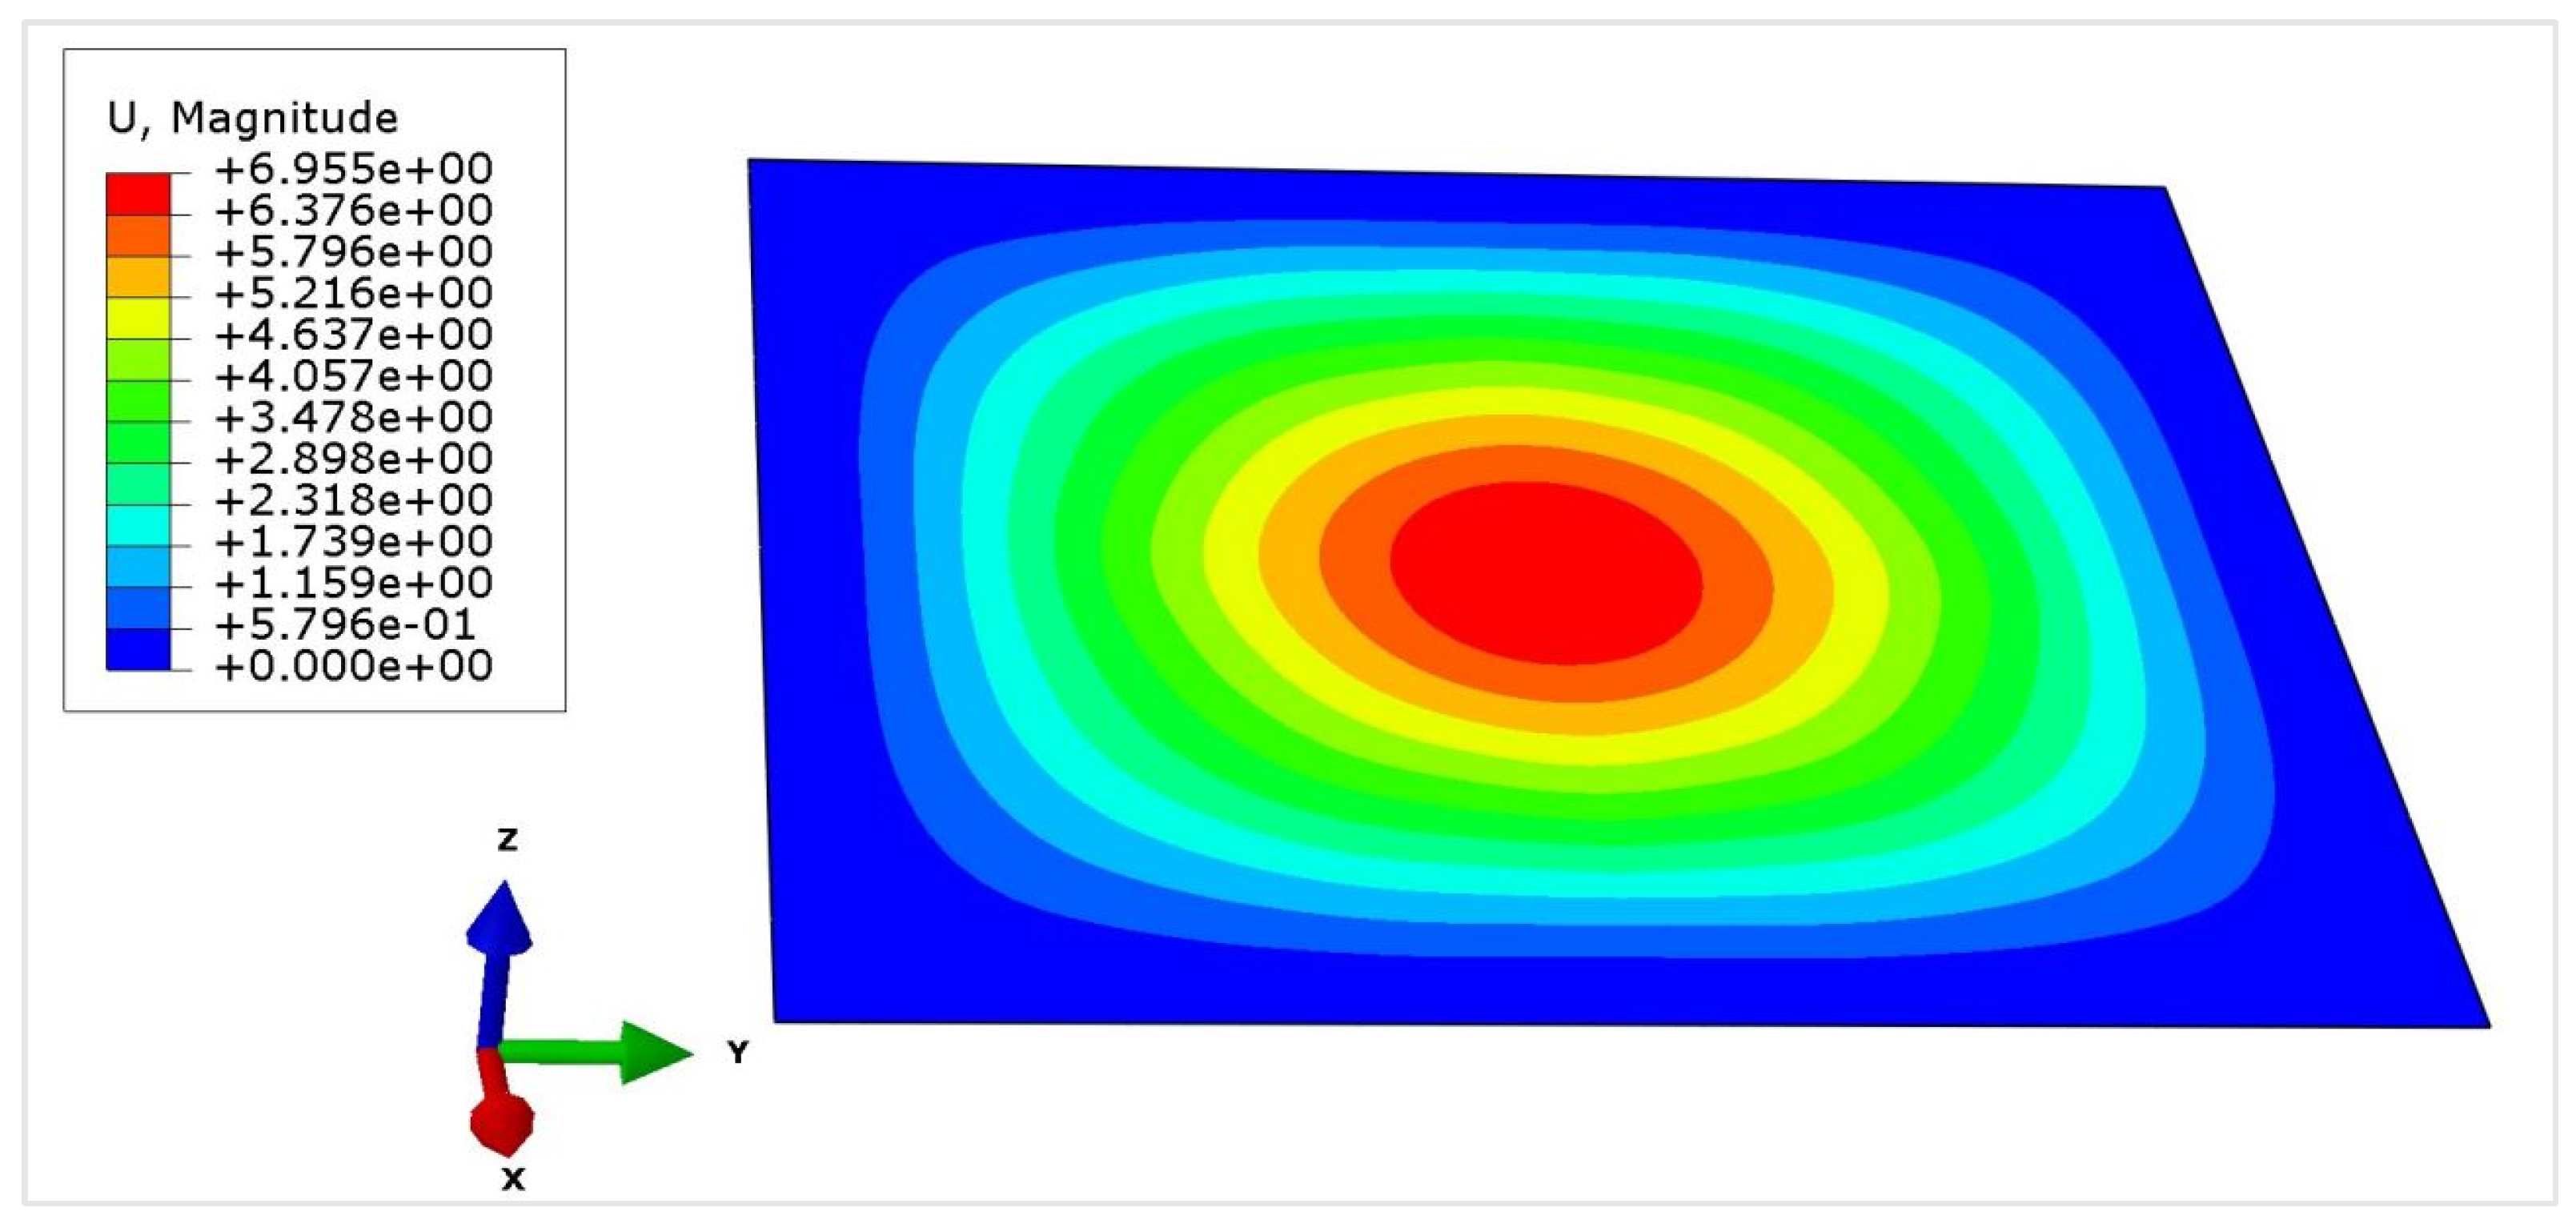
3.2.3. Comparison of the Experimental and Numerical Results

The response of the panels was recorded in terms of the impact force–time history and deflection–time history. The results showed that the impact force–time history had four phases: an initial peak phase, a vibration phase, a plateau phase, and an unloading phase. The first three stages are the parts of the impact process’s contact stage, whereas the last phase occurs during the separation stage. The impact force increases rapidly at first, reaching its peak as the strike begins, followed by following spikes of lesser amplitudes. The plate and impact head then move together and remain in contact, indicating the plateau period. This plateau period is followed by the unloading phase, in which the impact force is reduced to zero when the panel and impact head are entirely separate. The primary peak force recorded was 20.13 kN (see Figure 10). The value of the maximum central deflection recorded was 7.45 mm (see Figure 11). The comparison of the experimental and numerical results showed the percentage difference between the peak impact force recorded in the experiment and that predicted using the proposed model had a difference of less than 5%. Similarly, the difference in the value of the maximum displacement predicted using the base model and that recorded in the experiment was approximately 9%. The comparison of the experimental and numerical results for the force–time history and deflection–time history are given in Figure 10 and Figure 11, respectively. Figure 12 shows the numerical results for the maximum deflection at the center of the plate. Post-test observations of the impacted plate indicated no local indentations (see Figure 13), which is consistent with the predictions provided by the numerical model, showing zero residual deflection (see Figure 11).

4. Parametric Sensitivity Analysis

Using the validated base model with a timber projectile, a parametric sensitivity study was conducted to (1) find the influence of various structure and load-related parameters on the impact performance of solid aluminum panels, and (2) find the key parameters. Table 12 shows the various structure- and load-related parameters that were considered for the parametric and sensitivity studies. The response of the structure was noted in terms of the impact force–time history and deflection force–time history. The velocity was systematically increased to determine the threshold at which penetration occurs for different locations and alloys. Additionally, this section explores the correlation between dent production and the response of the plate, with a specific emphasis on the initial peak force (see Figure 14).

4.1. Influence of the Structural-Related Parameters on the Response of the Claddings

The sensitivity analysis of solid aluminum panels during impact encompassed three critical structural-related parameters (see Figure 15, Figure 16 and Figure 17). First, the unsupported length, while having a modest impact on the impact force, played a substantial role in determining the maximum and residual deflection. Second, the plate thickness emerged as a significant factor, influencing the impact force and deflection, with thicker plates resulting in greater force and less deflection. Third, the choice of alloys had minimal effects on the impact force but significantly influenced the deflection due to differences in the yield strength: alloys with lower yield strengths led to increased deflection during impact.

4.1.1. Unsupported Length

The sensitivity analysis showed that when the unsupported length was increased by 100%, there was only around a 1% reduction in the impact force and vice versa (refer to Figure 15). Furthermore, it was observed that when a dent was produced in the impact plate, there was a reduction in the value of the impact force. This hypothesis is also proved by the findings of Dale et al. (2012) and supported by Equations (7) and (8) [34].
F t = K e α n
where F(t) is the magnitude of the contact force, ke is the contact stiffness, and n is the exponent (power), which according to the original Hertzian analysis is n = 3/2 for a sphere contacting a flat infinite material (half-space).
α = D 1 D 2 ( a 2 , b 2 , t )
where D1 represents the global deflection, and D 2 a 2 , b 2 , t represents the local deflection/ dent in the plate (see Figure 14). Thus, it can be concluded that the intensity of the impact force is dependent on the contact stiffness and the deflection of the impacted plate. The value of ke depends not only on the kind of elastic material under consideration but also on its dimensions, shape, and boundary conditions. When there is an increase in the unsupported length of the solid aluminum plate, there is a decrease in the value of the contact stiffness (Ke) that causes a reduction in the impact force. Here, it is worth mentioning that this change in the impact force due to a change in the unsupported length is very small.
The influence of the unsupported length on the deflection was more than the impact force. There was around a 43% increase in the maximum deflection (refer to Figure 16) and a 90% increase in the residual deflection when the unsupported length of the plate was doubled. The increase in the residual deflection with an increase in the unsupported length is valid up to 1000 mm, after which the increase in the unsupported length reduces the residual deflection due to excessive elastic vibrations (see Figure 17). Similarly, the reduction in the unsupported length to half resulted in around a 19% and 14% reduction in the maximum and residual deflection, respectively, for the base model. The transfer of energy between the moving impact head and the solid aluminum panels occurs through physical contact between the two bodies. This impact results in local deformation (indentation) at the impact location and global bending deformation of the panel (refer to Figure 14) [35]. According to the plate bending theory, the load–displacement relationship of the square plate is given by Equation (9) [36].
ω 0 = p 0 a 4 47 D
Here, ω0 is the deflection at the center of the plate, p0 is the concentrated load, a is the unsupported length of the plate and D is the bending constant. It is obvious from Equation (9) that an increase in the unsupported length exponentially increases the central deflection of the impacted plate.

4.1.2. The Thickness of the Plate

It was found that a 50% increase in the thickness led to an approximately 49% increase in the impact force, while a 25% decrease in the plate thickness resulted in a roughly 24% reduction in the impact force (see Figure 15). Furthermore, the sensitivity analysis, conducted across various thickness values detailed in Table 12, demonstrated a nearly 15% rise in both the maximum and residual deflection when the thickness was decreased by 25%. Conversely, increasing the plate thickness by 50% led to a reduction of approximately 20% in the maximum deflection and about 24% in the residual deflection (see Figure 16 and Figure 17). This influence of the thickness is mainly due to the change in the stiffness of the plate. For uniformly loaded clamped plates, the stiffness (K) is given by Equation (10) [36].
K = C h 3 L 2
Here, C is the constant, h is the thickness of the plate and L is the distance from the support. The thickness of the plate favors the stiffness of the plate, which eventually increases the contact stiffness of the test and thus the impact force, reducing the maximum and residual deflection.

4.1.3. Type of the Alloys

The analysis revealed that different alloys had a minimal impact on the impact force, with variations of less than 1% observed (refer to Figure 15). The alloys having higher moduli of elasticity will have more contact stiffness and relatively a higher impact will be experienced (refer to Equation (11)). The plate bending theory has defined the relation of the contact stiffness (Ke) with the modulus of elasticity as given in Equation (11) [34,36], where E1 is the modulus of elasticity of the impacted plate and R is the radius of the projectile.
K e = 4 3 E 1 R
However, for the alloys considered in this study, the moduli of elasticity are almost the same, i.e., 70 MPa except for 5005-O, which has the value of E as 68.2 MPa but is still very close to it, which is why no considerable influence was noted from the perspective of different alloys on the impact force. Noteworthily, these different alloys possess distinct values for the yield strength, fracture initiation strain, and rupture strain, which significantly affect the maximum deflection and residual deflection. Taking the yield strength of 5052-H32 as a benchmark at 269 MPa, a sensitivity analysis revealed noteworthy findings. When using 3003-H32 with a lower yield strength (of around 165 MPa), both the maximum deflection and residual deflection increased by 28%. Furthermore, reducing the yield strength to 42 MPa by using 5005-O resulted in a significant increase of 29% in the maximum deflection and an increase of 79% in the residual deflection (refer to Figure 16 and Figure 17).

4.2. Influence of the Load-Related Parameters on the Response of the Claddings

4.2.1. Velocity of Impact

A series of velocities from 4 m/s to 40 m/s were used with a reference velocity of 22.8 m/s. When the impact velocity was reduced by 82.5% (to 4 m/s), the impact force was decreased by 85%. Similarly, increasing the velocity of impact by 80% (to 40 m/s) caused around a 75% increase in the impact force (see Figure 15). Thus, it was concluded that when the velocity of impact increases, so does the impact force. These results of the impact force (Fi) are also supported by Newton’s 2nd law, as given in Equation (12) [37].
F i = m ( u v ) t
where m is the mass of the projectile, u is the velocity of the projectile before impact, v is the velocity of the projectile after impact and t is the time for velocity to change from u to v. At the velocity of 4 m/s compared with the reference velocity of 22.8 m/s, the maximum deflection decreased approximately 85% and the residual deflection decreased 90%, while at 40 m/s, the maximum deflection increased 70% and the residual deflection increased 80% (refer to Figure 16 and Figure 17).

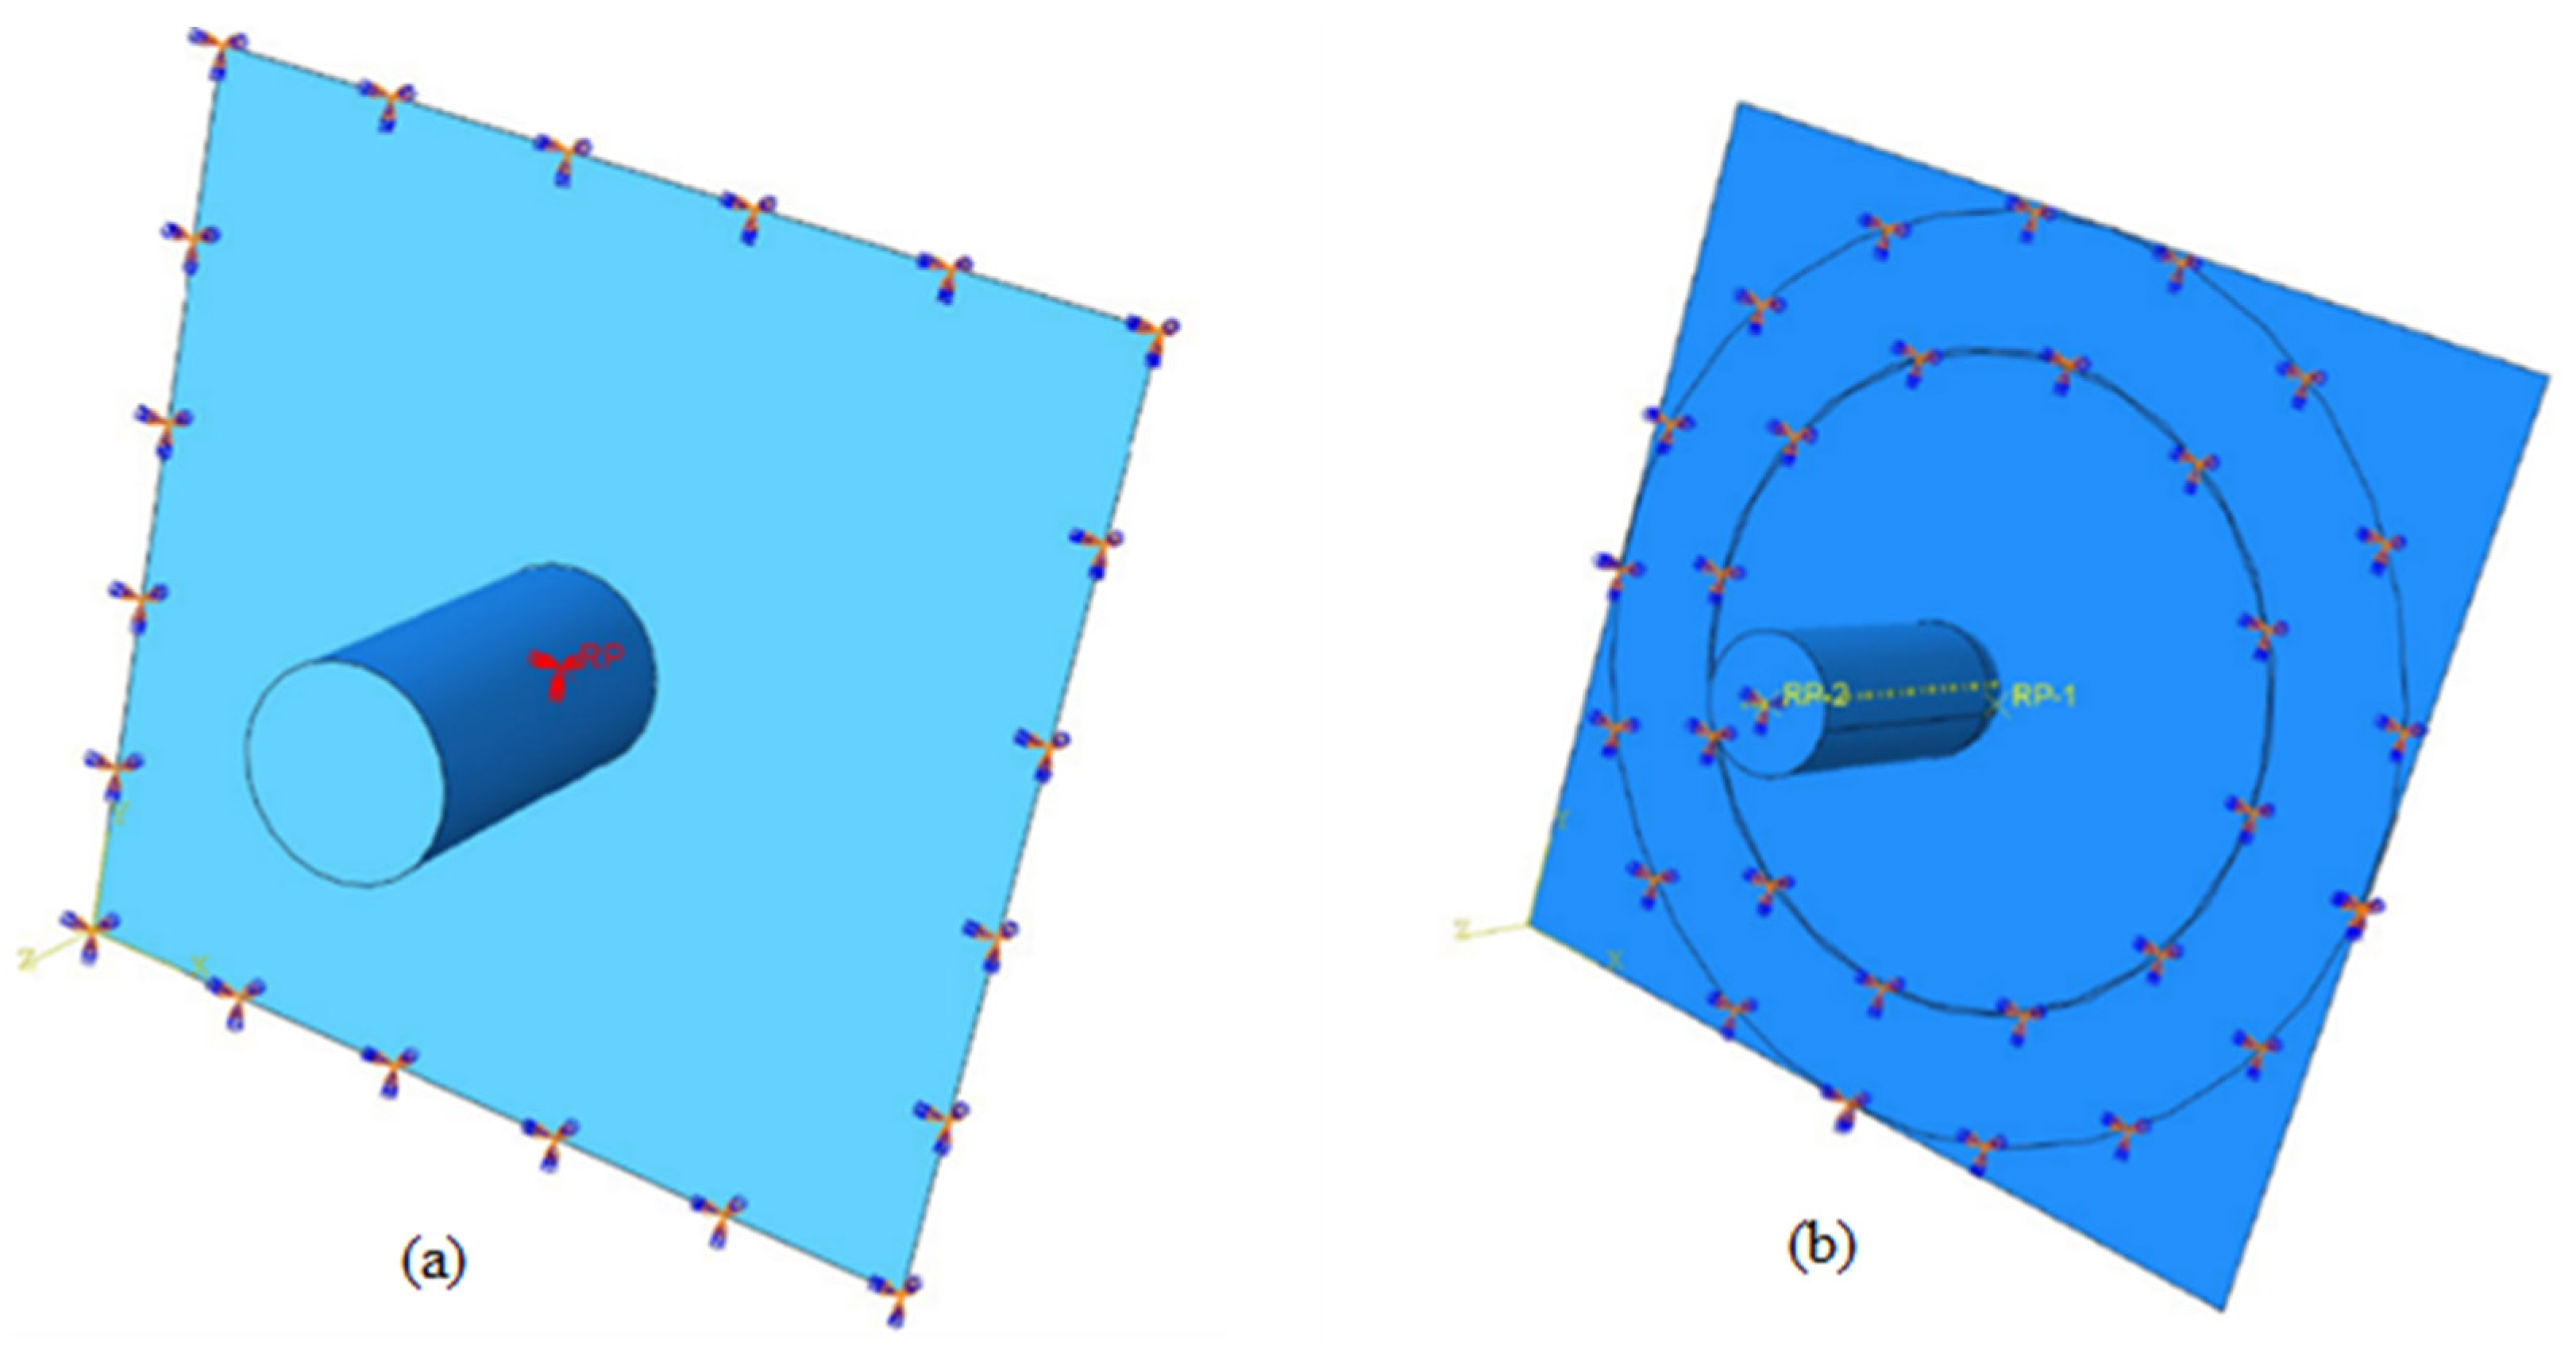
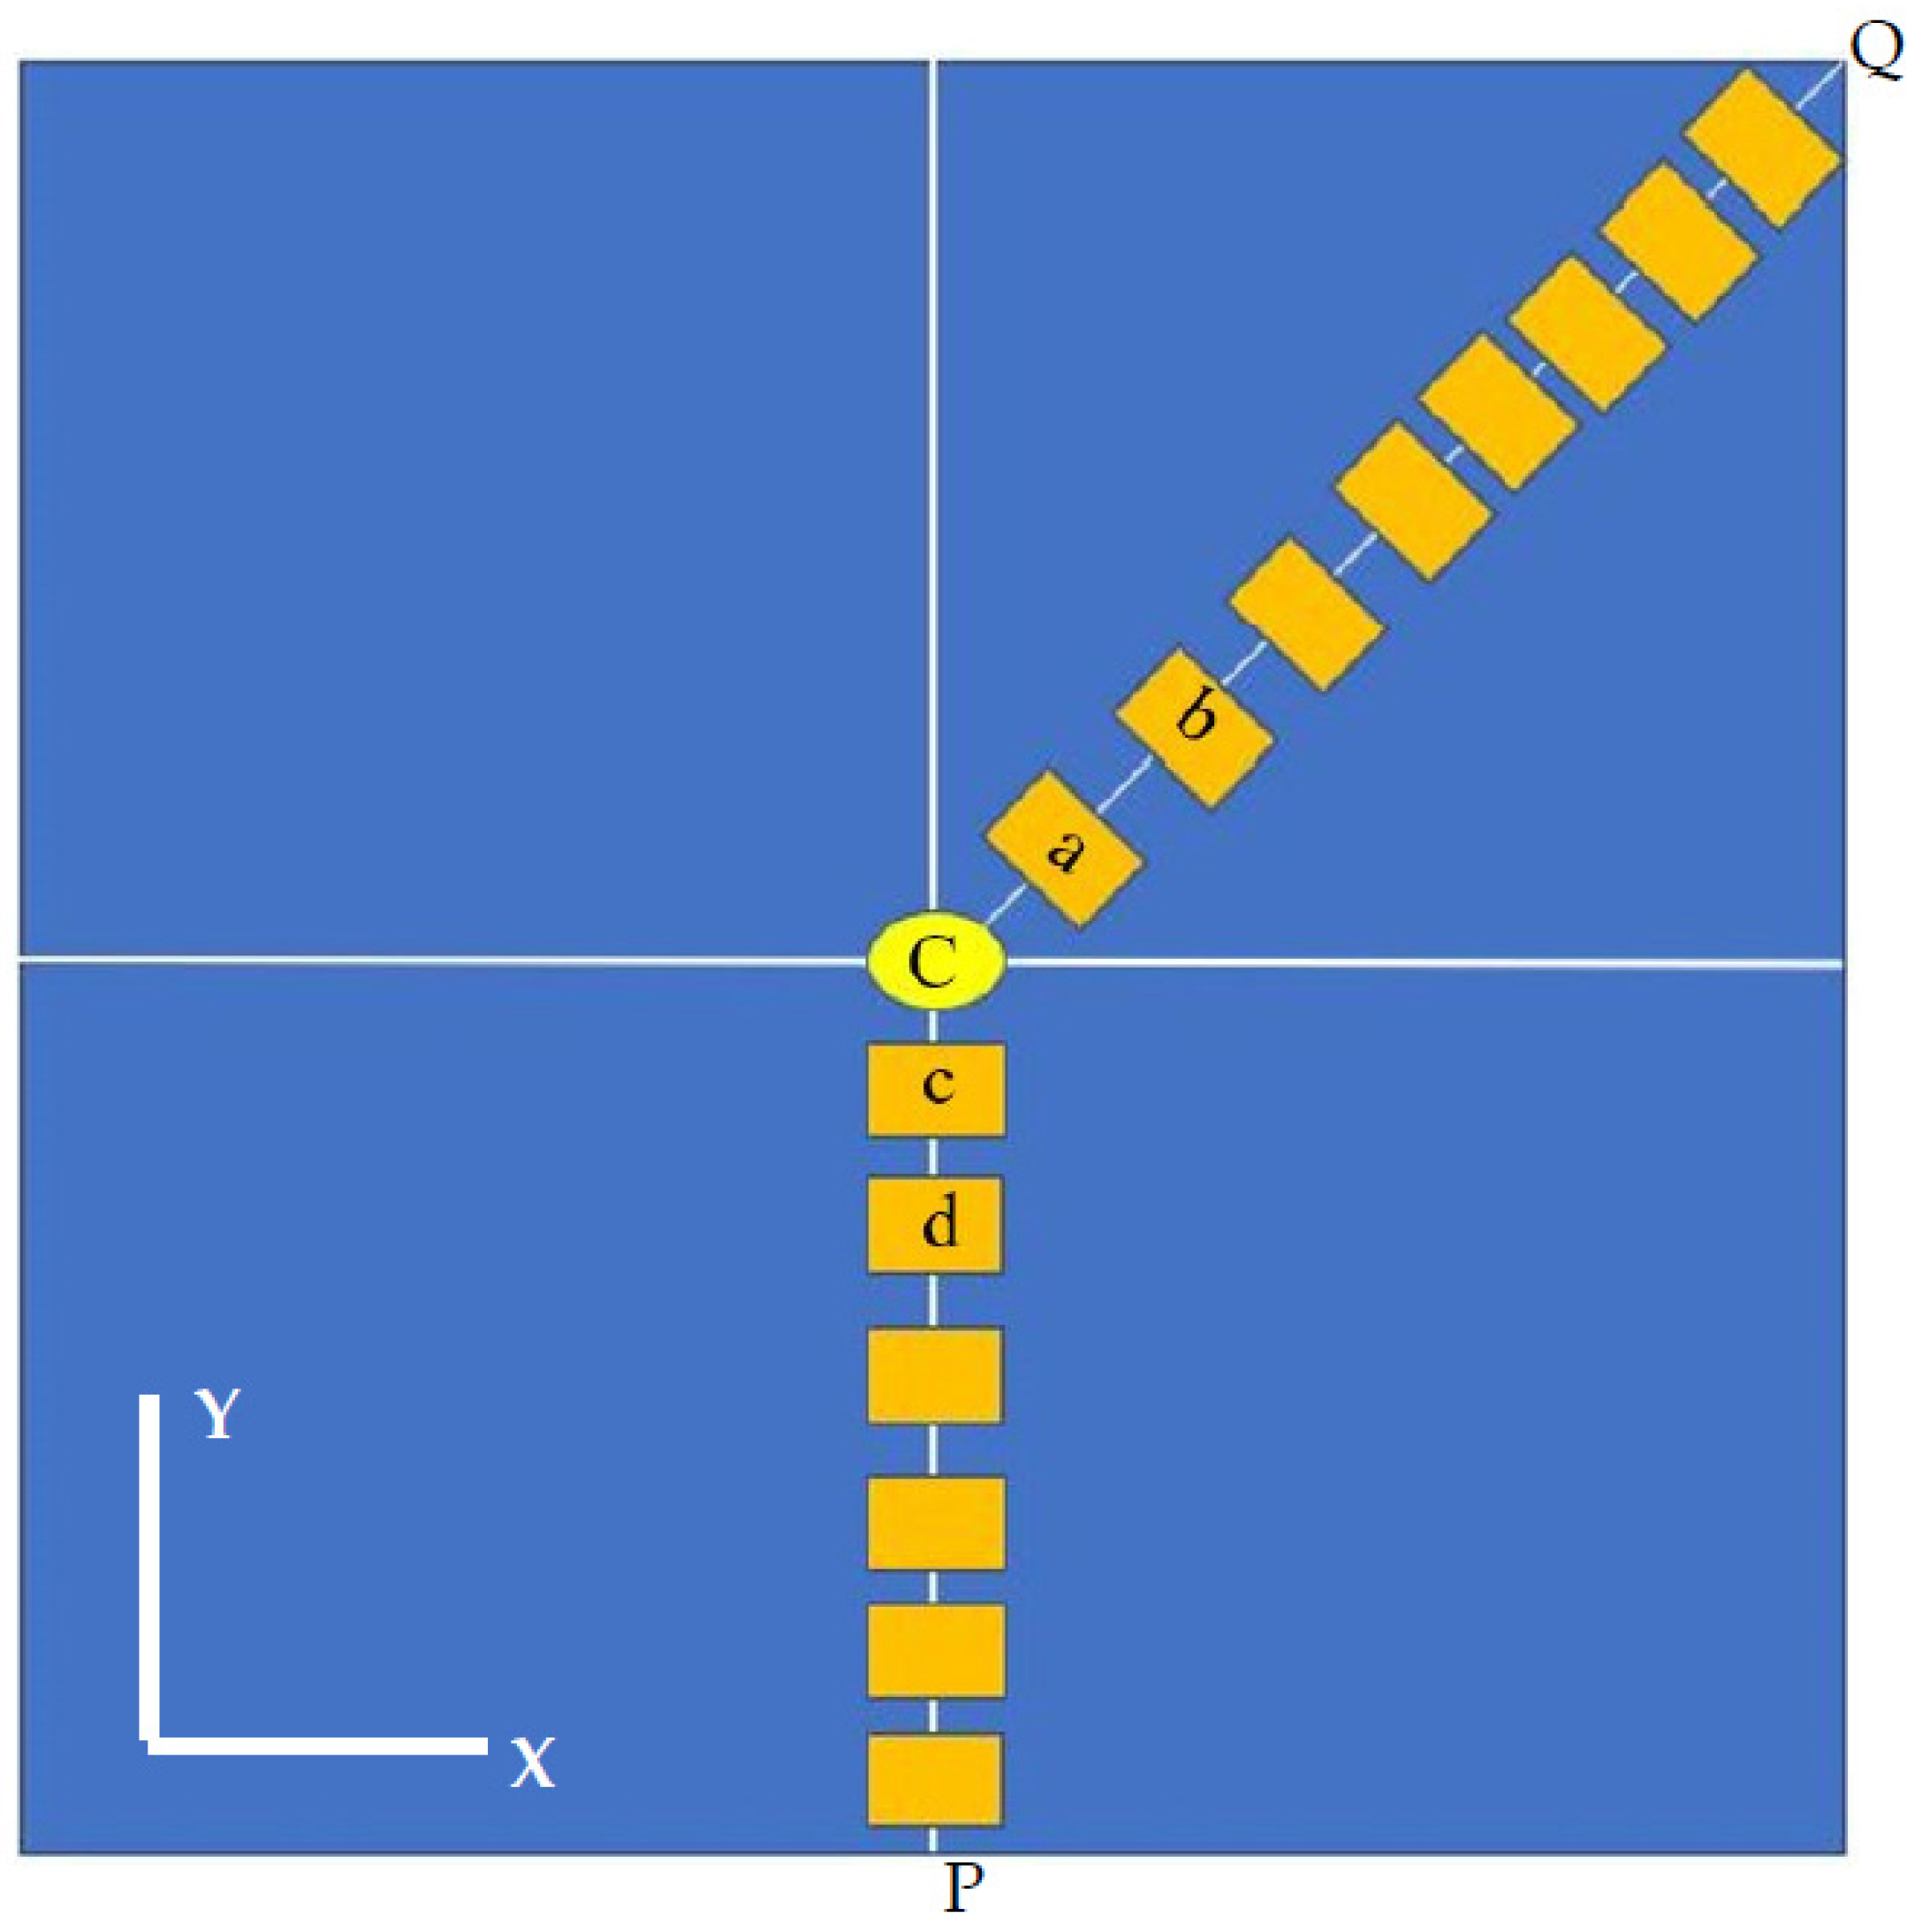
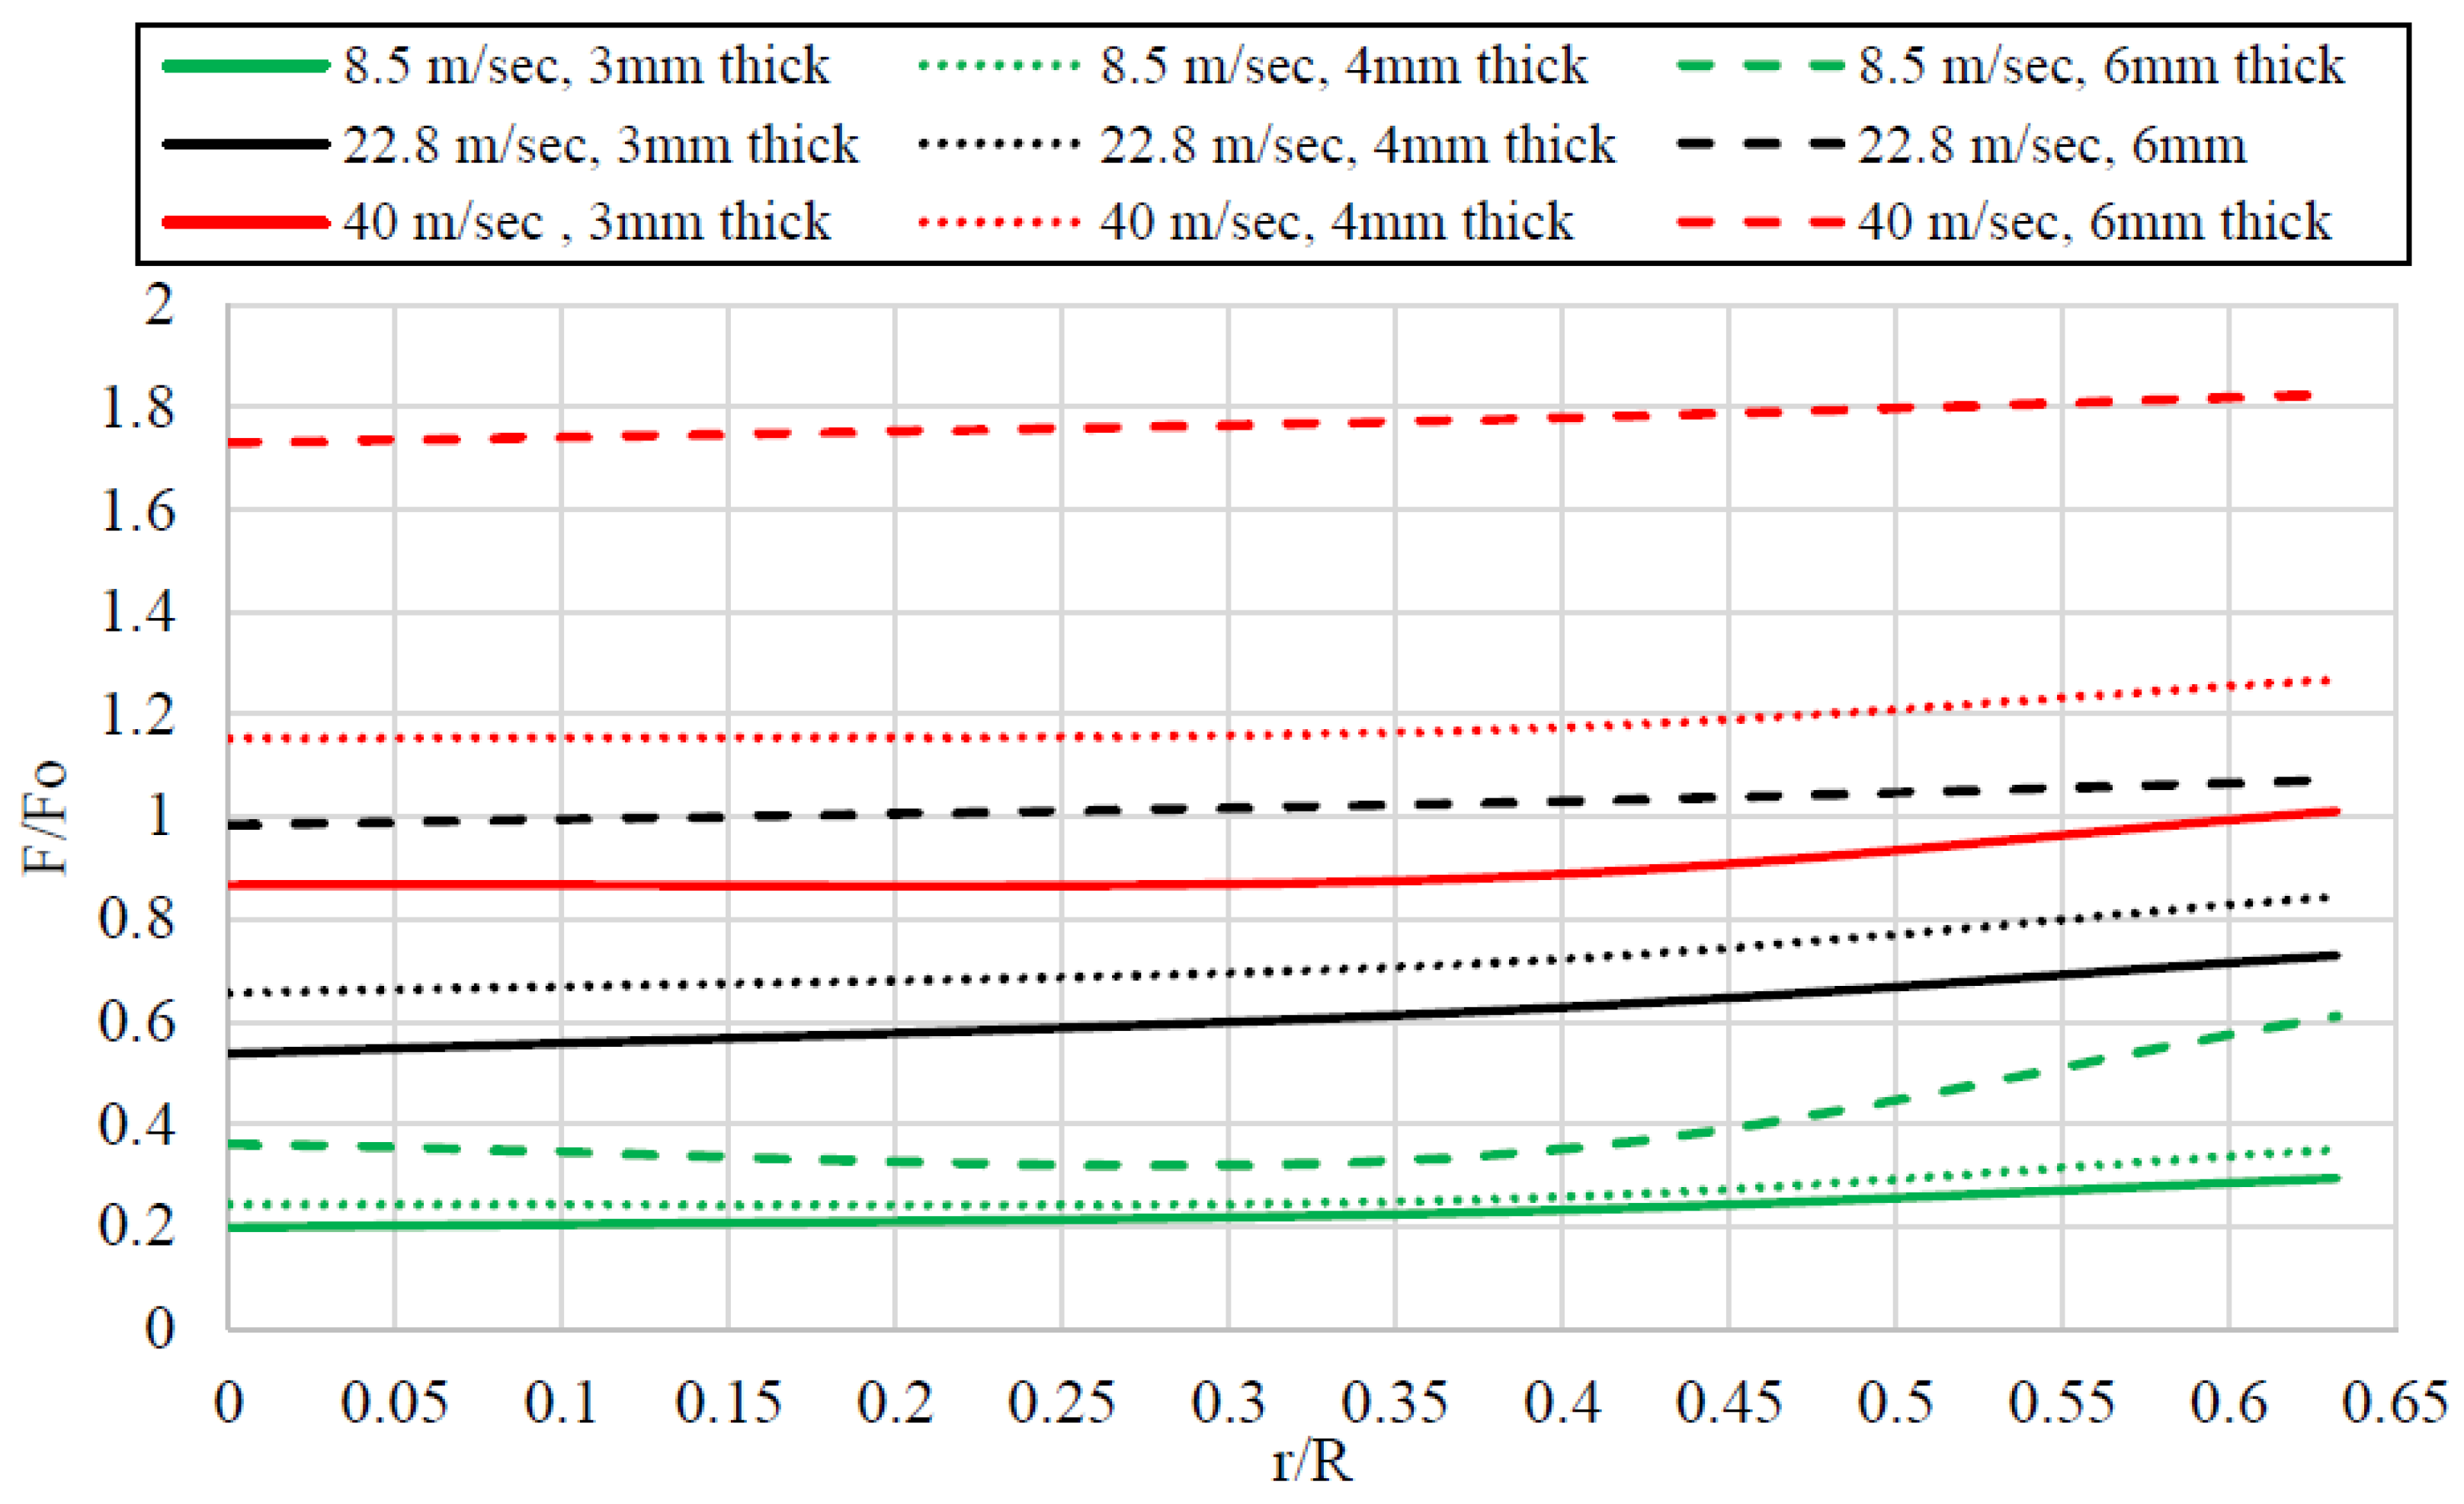
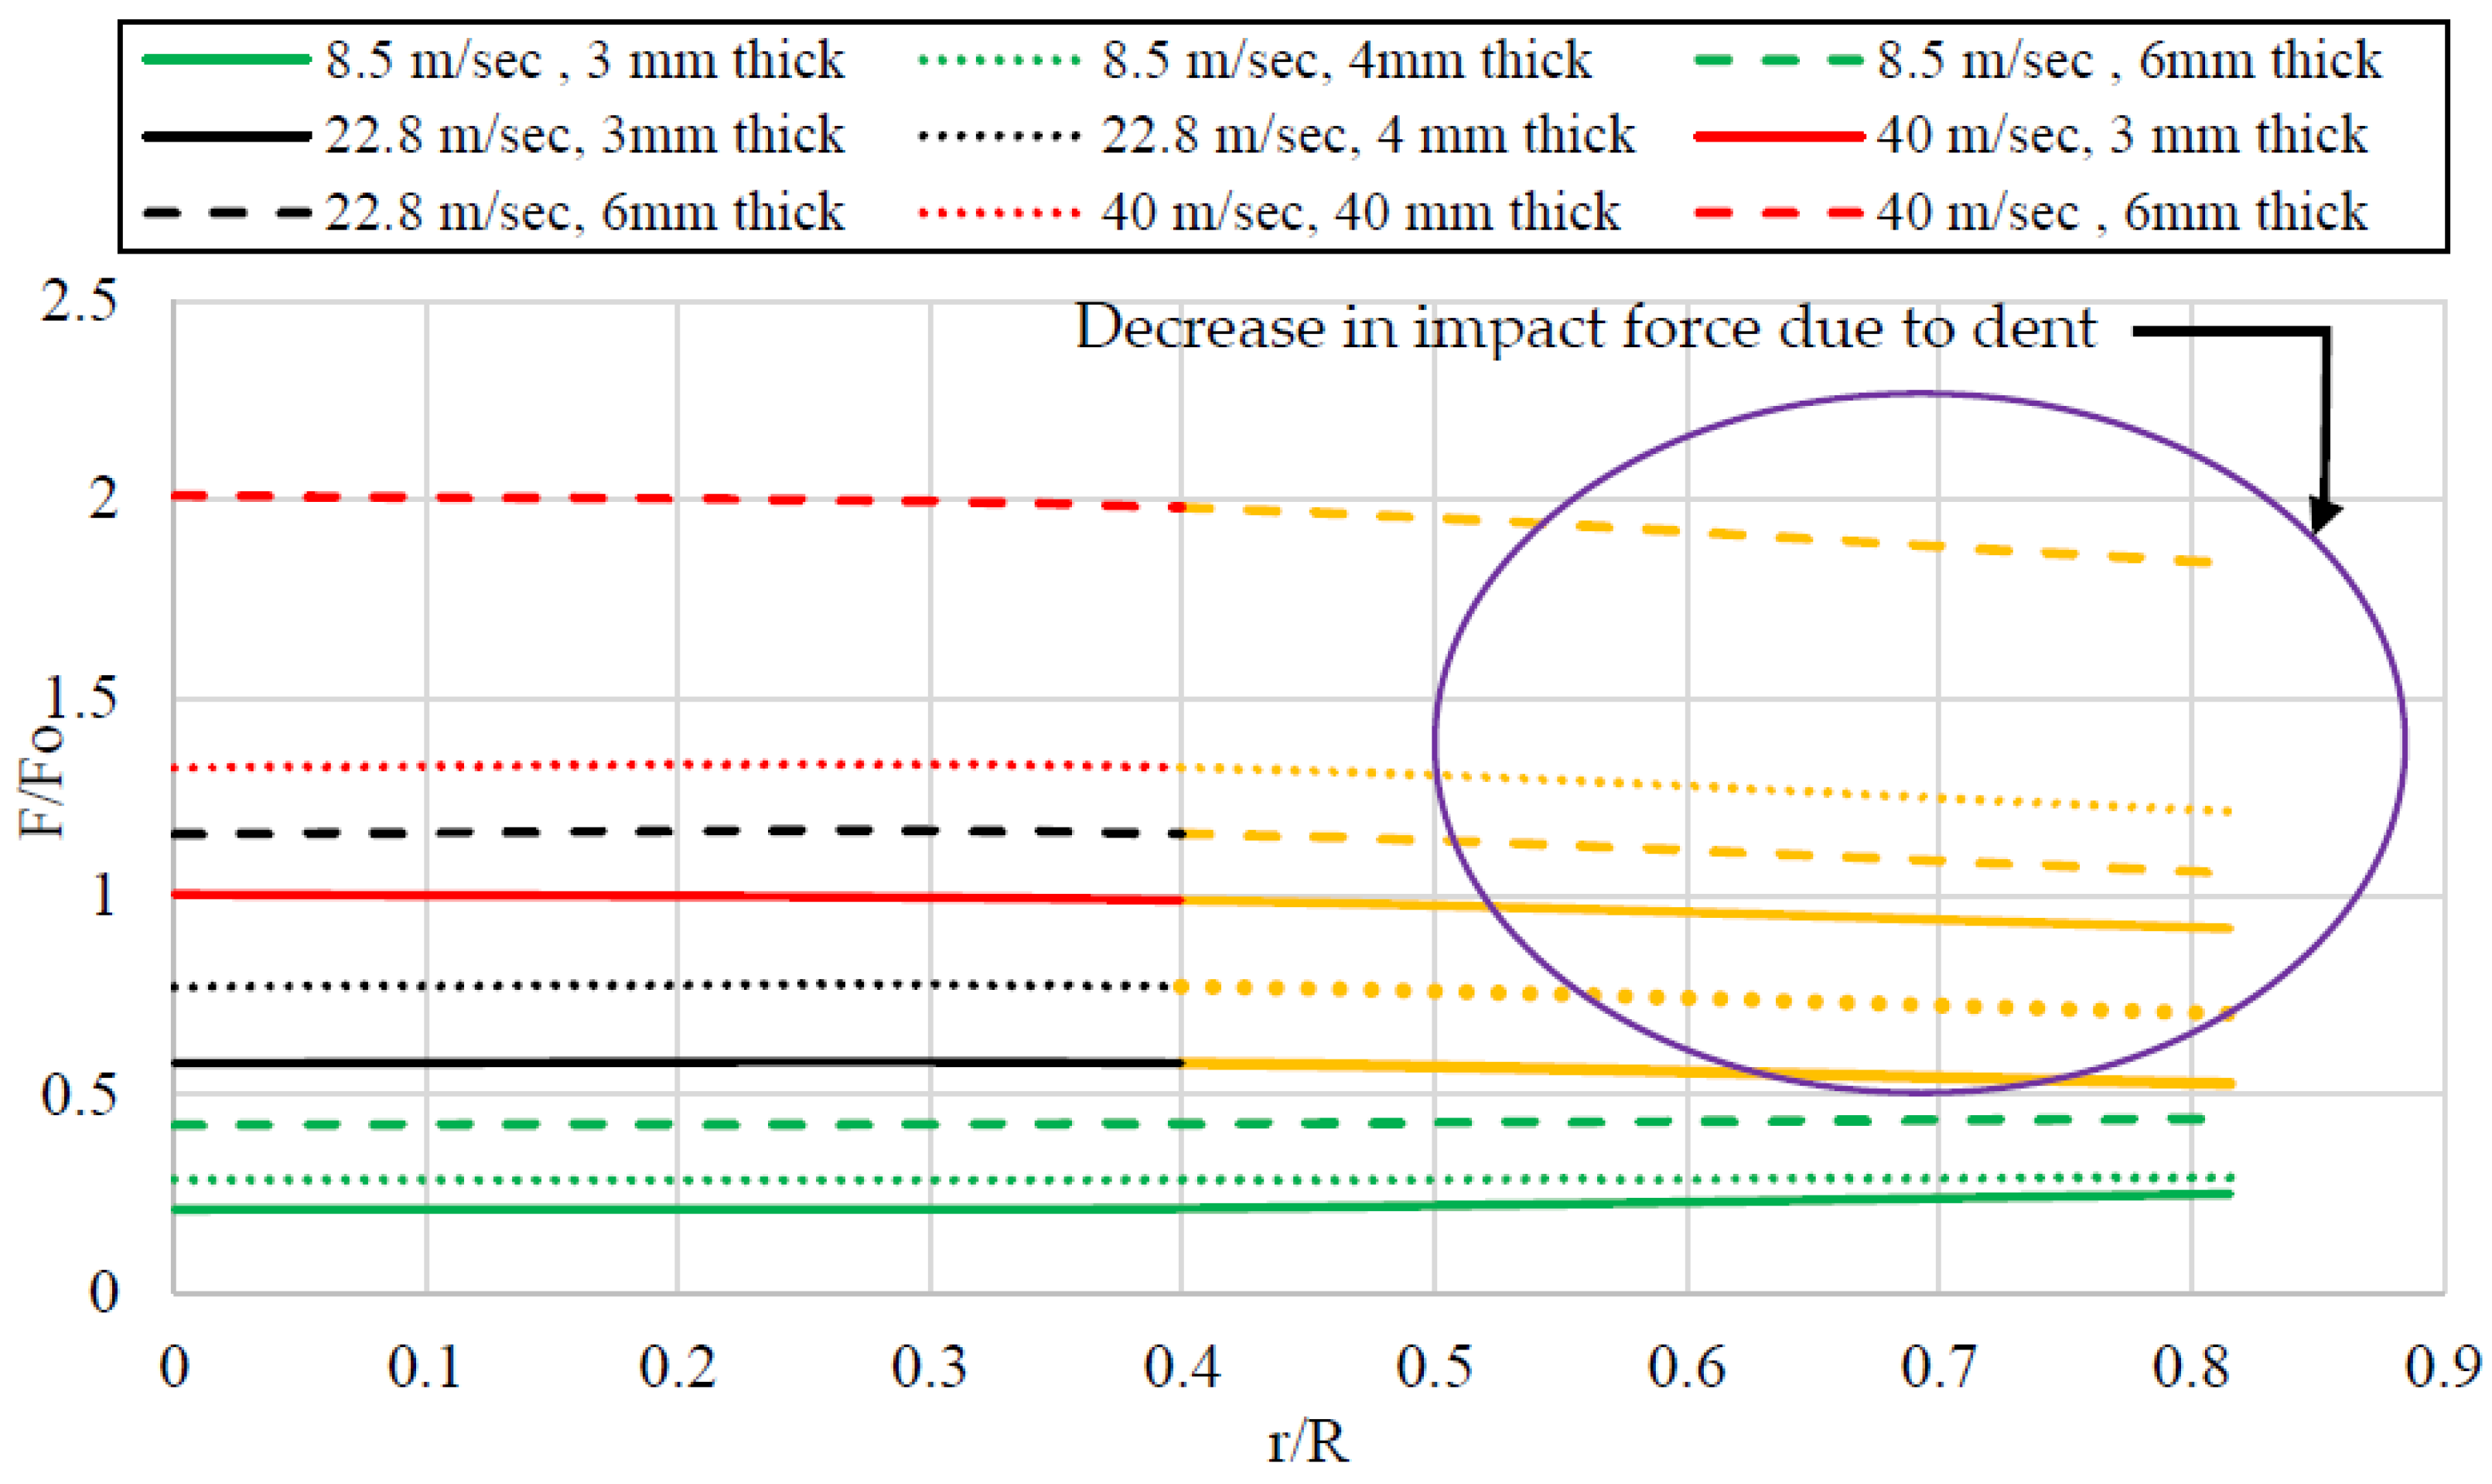
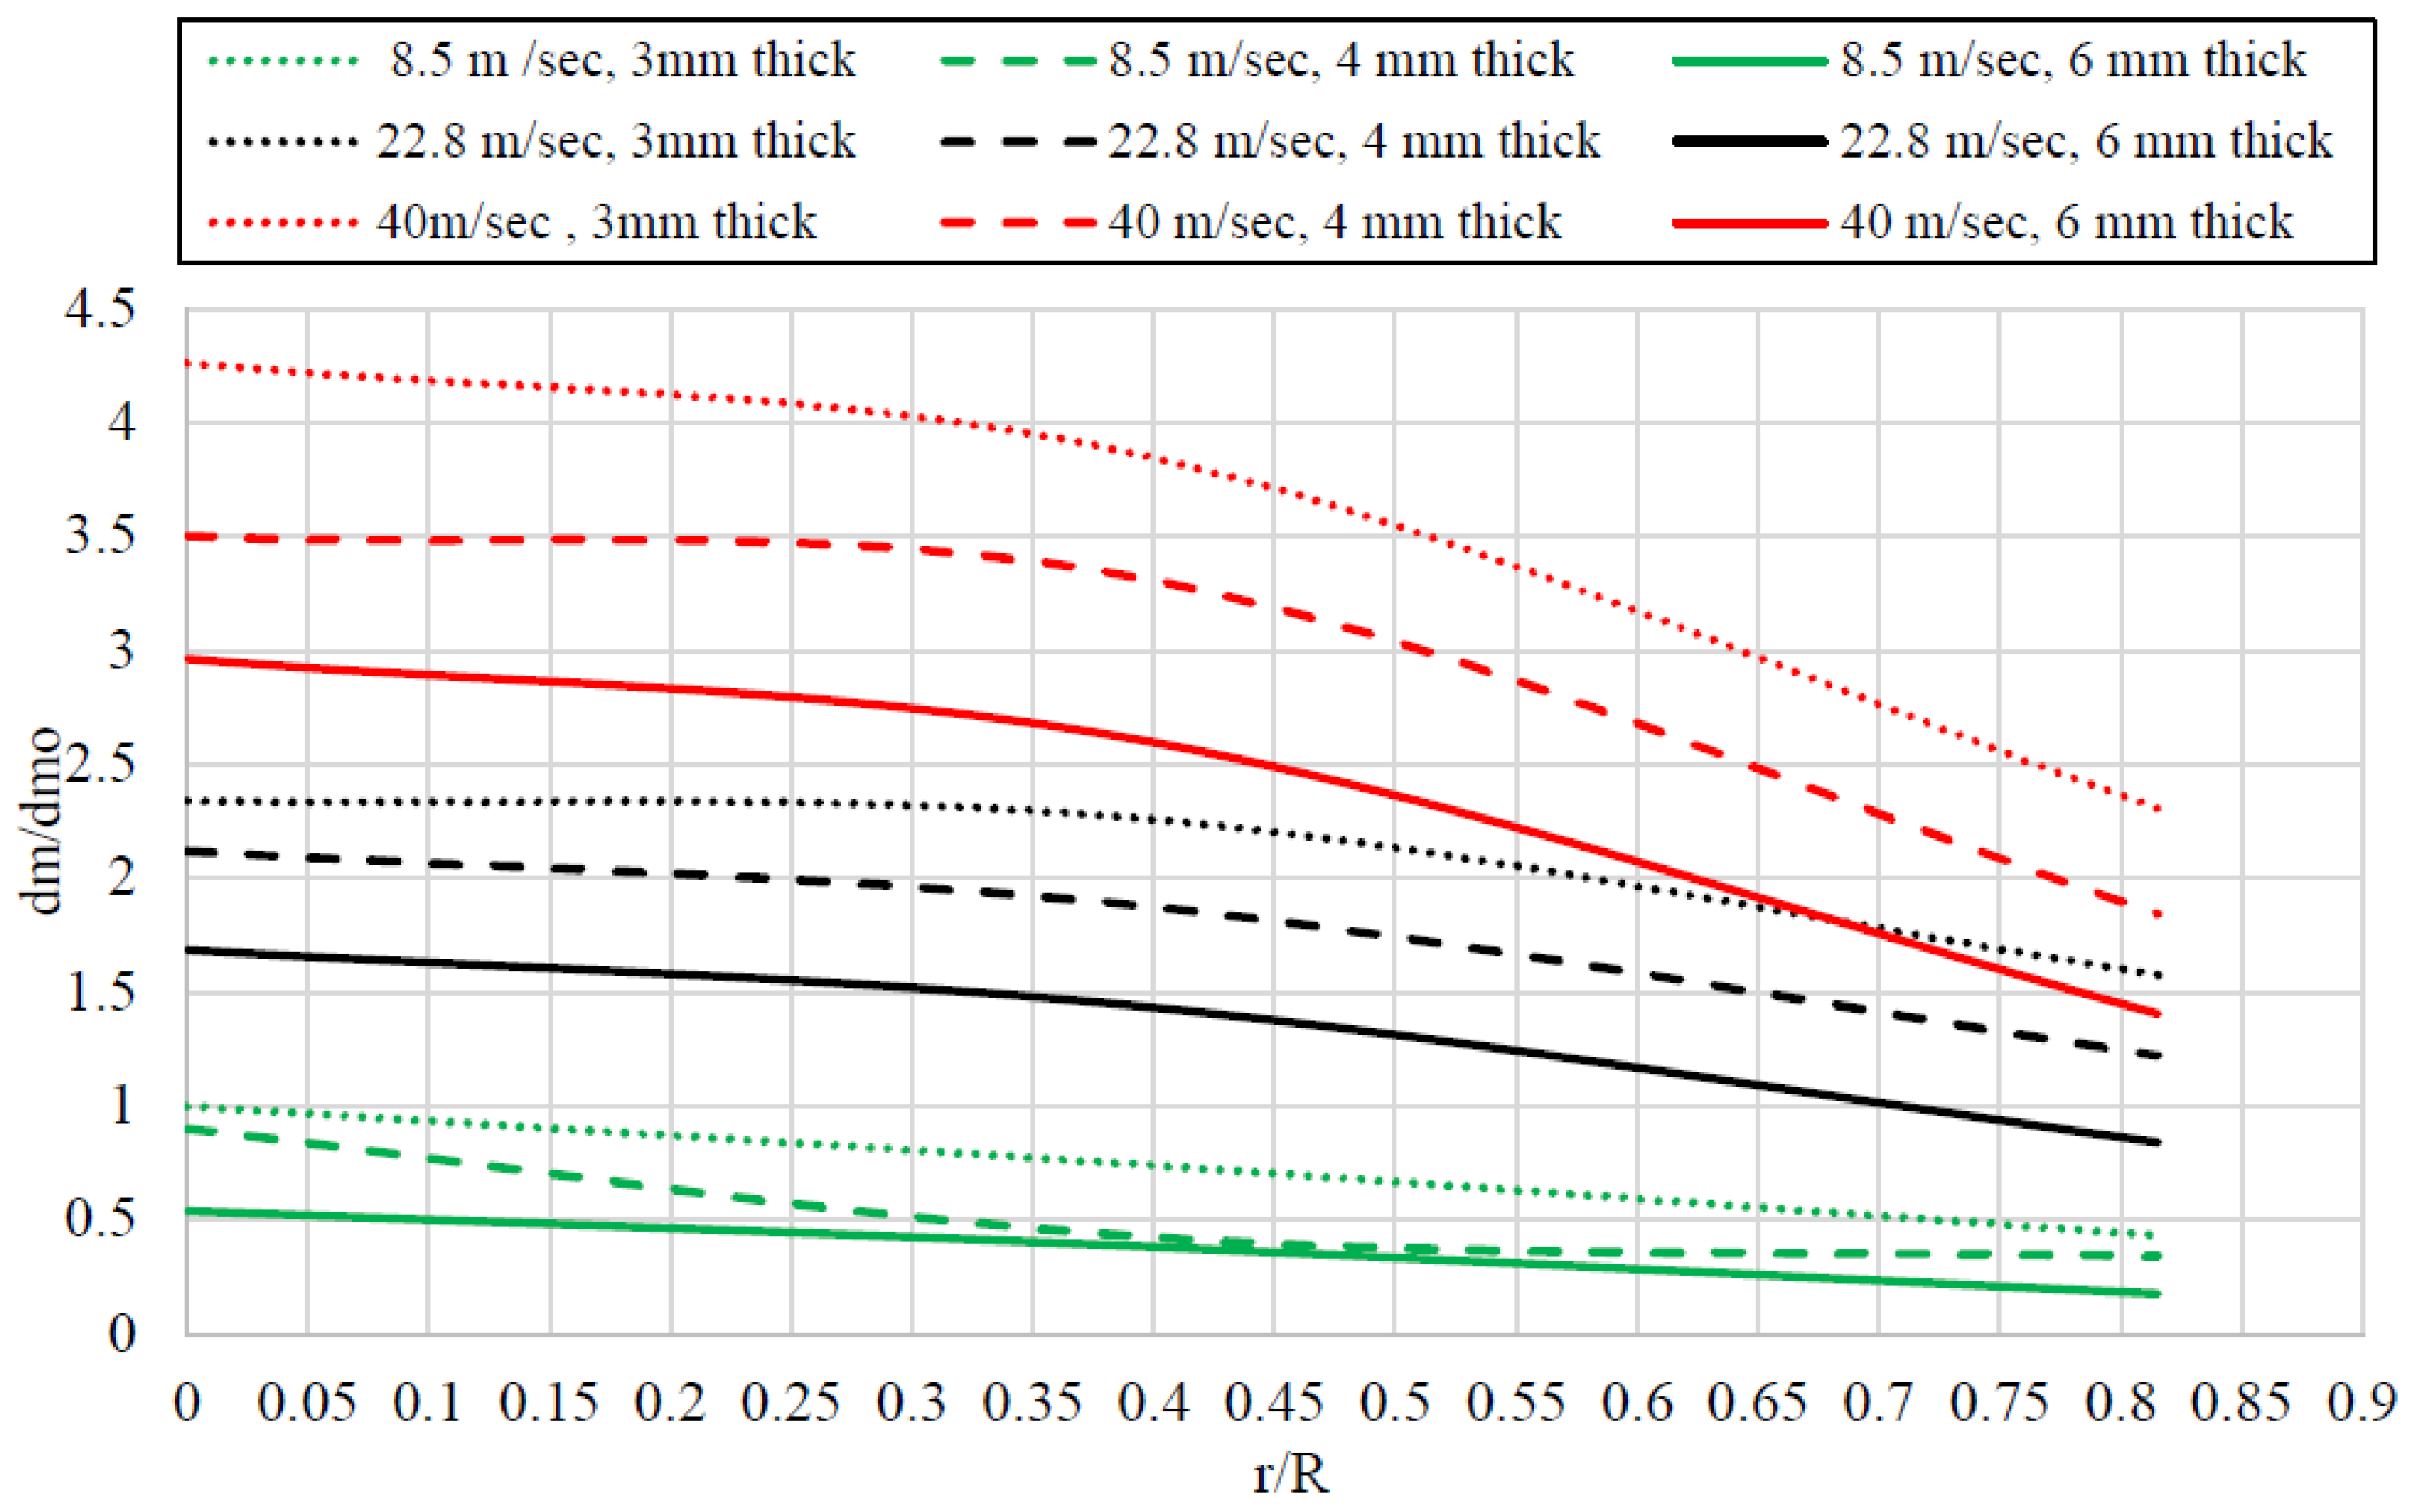
4.2.2. Location of Impact

The sensitivity analysis showed around a 4% increase in the impact force for location P and a 10% increase in the impact force for location Q when compared with the impact at the center of the plate, confirming position Q as the critical location of impact. Random locations of impact were selected in the transverse direction and longitudinal direction, ranging from center to corner in such a way that they cover various points. The location of impact at the center of the plate was chosen as a reference. Locations P and Q are shown in Figure 18. R represents the total distance from the center (C) to the support (Q) for the inclined part of the plate and from the center (C) to support (P) for the middle part. r is used for the distance of every location (a, b, c, etc.) of impact from the center in such a way that at points P and Q, r is equal to R. In Table 12, the variable X represents the horizontal distance, while Y represents the vertical distance of the impact location from the center of the plate. These values were utilized in the application of the Pythagorean theorem (refer to Figure 18) to precisely calculate the impact location. As the impact point moves away from the center of the plate toward the support, the stiffness of the targeted plate increases, which in turn increases the contact stiffness (Ke) between the impactor and the impacting plate. This increase in Ke favors the peak impact force (see Figure 15). It is important to know that this hypothesis will not be followed if the increased velocity produces a dent or perforation in the plate. In that case, the value of α will be reduced (refer to Equation (8)), and thus, the impact force will be decreased even if it is near the support. Figure 19 and Figure 20 present the variations in the plate’s response corresponding to different impact locations. It shows that at velocity of 8.5 m/s, when the location of the projectile went closer to the support, there was an increase in the impact force; however, a reduction in force was noted at the same location when the velocities of 22.8 m/s and 40 m/s were used because of the production of the dent (see Figure 20). In Figure 19 and Figure 20, Fo represents the referenced peak impact force when the impact is at the center of the plate.
When the results of the maximum and residual deflection for a base model were analyzed, around a 55% reduction in the maximum deflection (see Figure 16 and Figure 21) and a 51% reduction in the residual deflection (see Figure 17) were noted at location Q when compared with the respective values at the center of the plate. It is worth mentioning that the plate perforated at location Q at higher velocities. As shown in Figure 22, when the ratio of r/R increased, a decrease in the residual deflection was recorded at 8.5 m/s and 22.8 m/s; however, a perforation was noted at the velocity of 40 m/s where the value of the residual deflection was noted as zero and the curve went down to touch the zero line. In Figure 21, dmo represents the referenced maximum deflection of the plate where the impact is at the center of the plate, whereas the dm shows the maximum deflection when the location of impact is other than the center. Similarly, in Figure 22, dro represents the referenced residual deflection of the plate where the impact is at the center of the plate, whereas the dr shows the residual deflection when the location of impact is other than the center.

4.2.3. Angle of Impact

The projectile’s incident angle significantly influences the impact force and the maximum and residual deflection in the targeted plate [38]. The sensitivity analysis showed that the maximum impact force results when the projectile hits the target normally at 90°. When the angle of impact was reduced by 50%, i.e., from 90° to 45°, the impact force was reduced by approximately 84.5% (see Figure 15). This is because when the impact is at an angle, the force is resolved into horizontal and vertical components, causing a reduction in the impact force (see Figure 23). As Equation (11) suggested, the geometry (dimensions) of the projectile hitting the plate has a significant influence on the contact stiffness Ke, which ultimately affects the impact force. When the impact is at an angle, the area of contact stiffness between the projectile and the target plate is reduced, which results in reducing the impact force.
Contrary to the impact force, the value of the maximum and residual deflection increases as the angle of impact between the plate and the projectile decreases from 90°. This can be attributed to the intensified load concentration on a smaller contact area. For instance, reducing the angle to 85° led to a 4% rise in the maximum deflection (refer to Figure 16) and a 1% increase in the residual deflection (refer to Figure 17); however, as the angle was reduced to 45°, both the maximum and residual deflections decreased. This decrease was primarily due to the considerable reduction in the vertical component of the impacting force. At an angle of 45°, the analysis showed a 3.8% decrease in the maximum deflection and a significant 7% decrease in the residual deflection. It is important to note that even with the reduced deflection at lower angles, dent formation persisted due to the substantial force concentration on a smaller contact area.

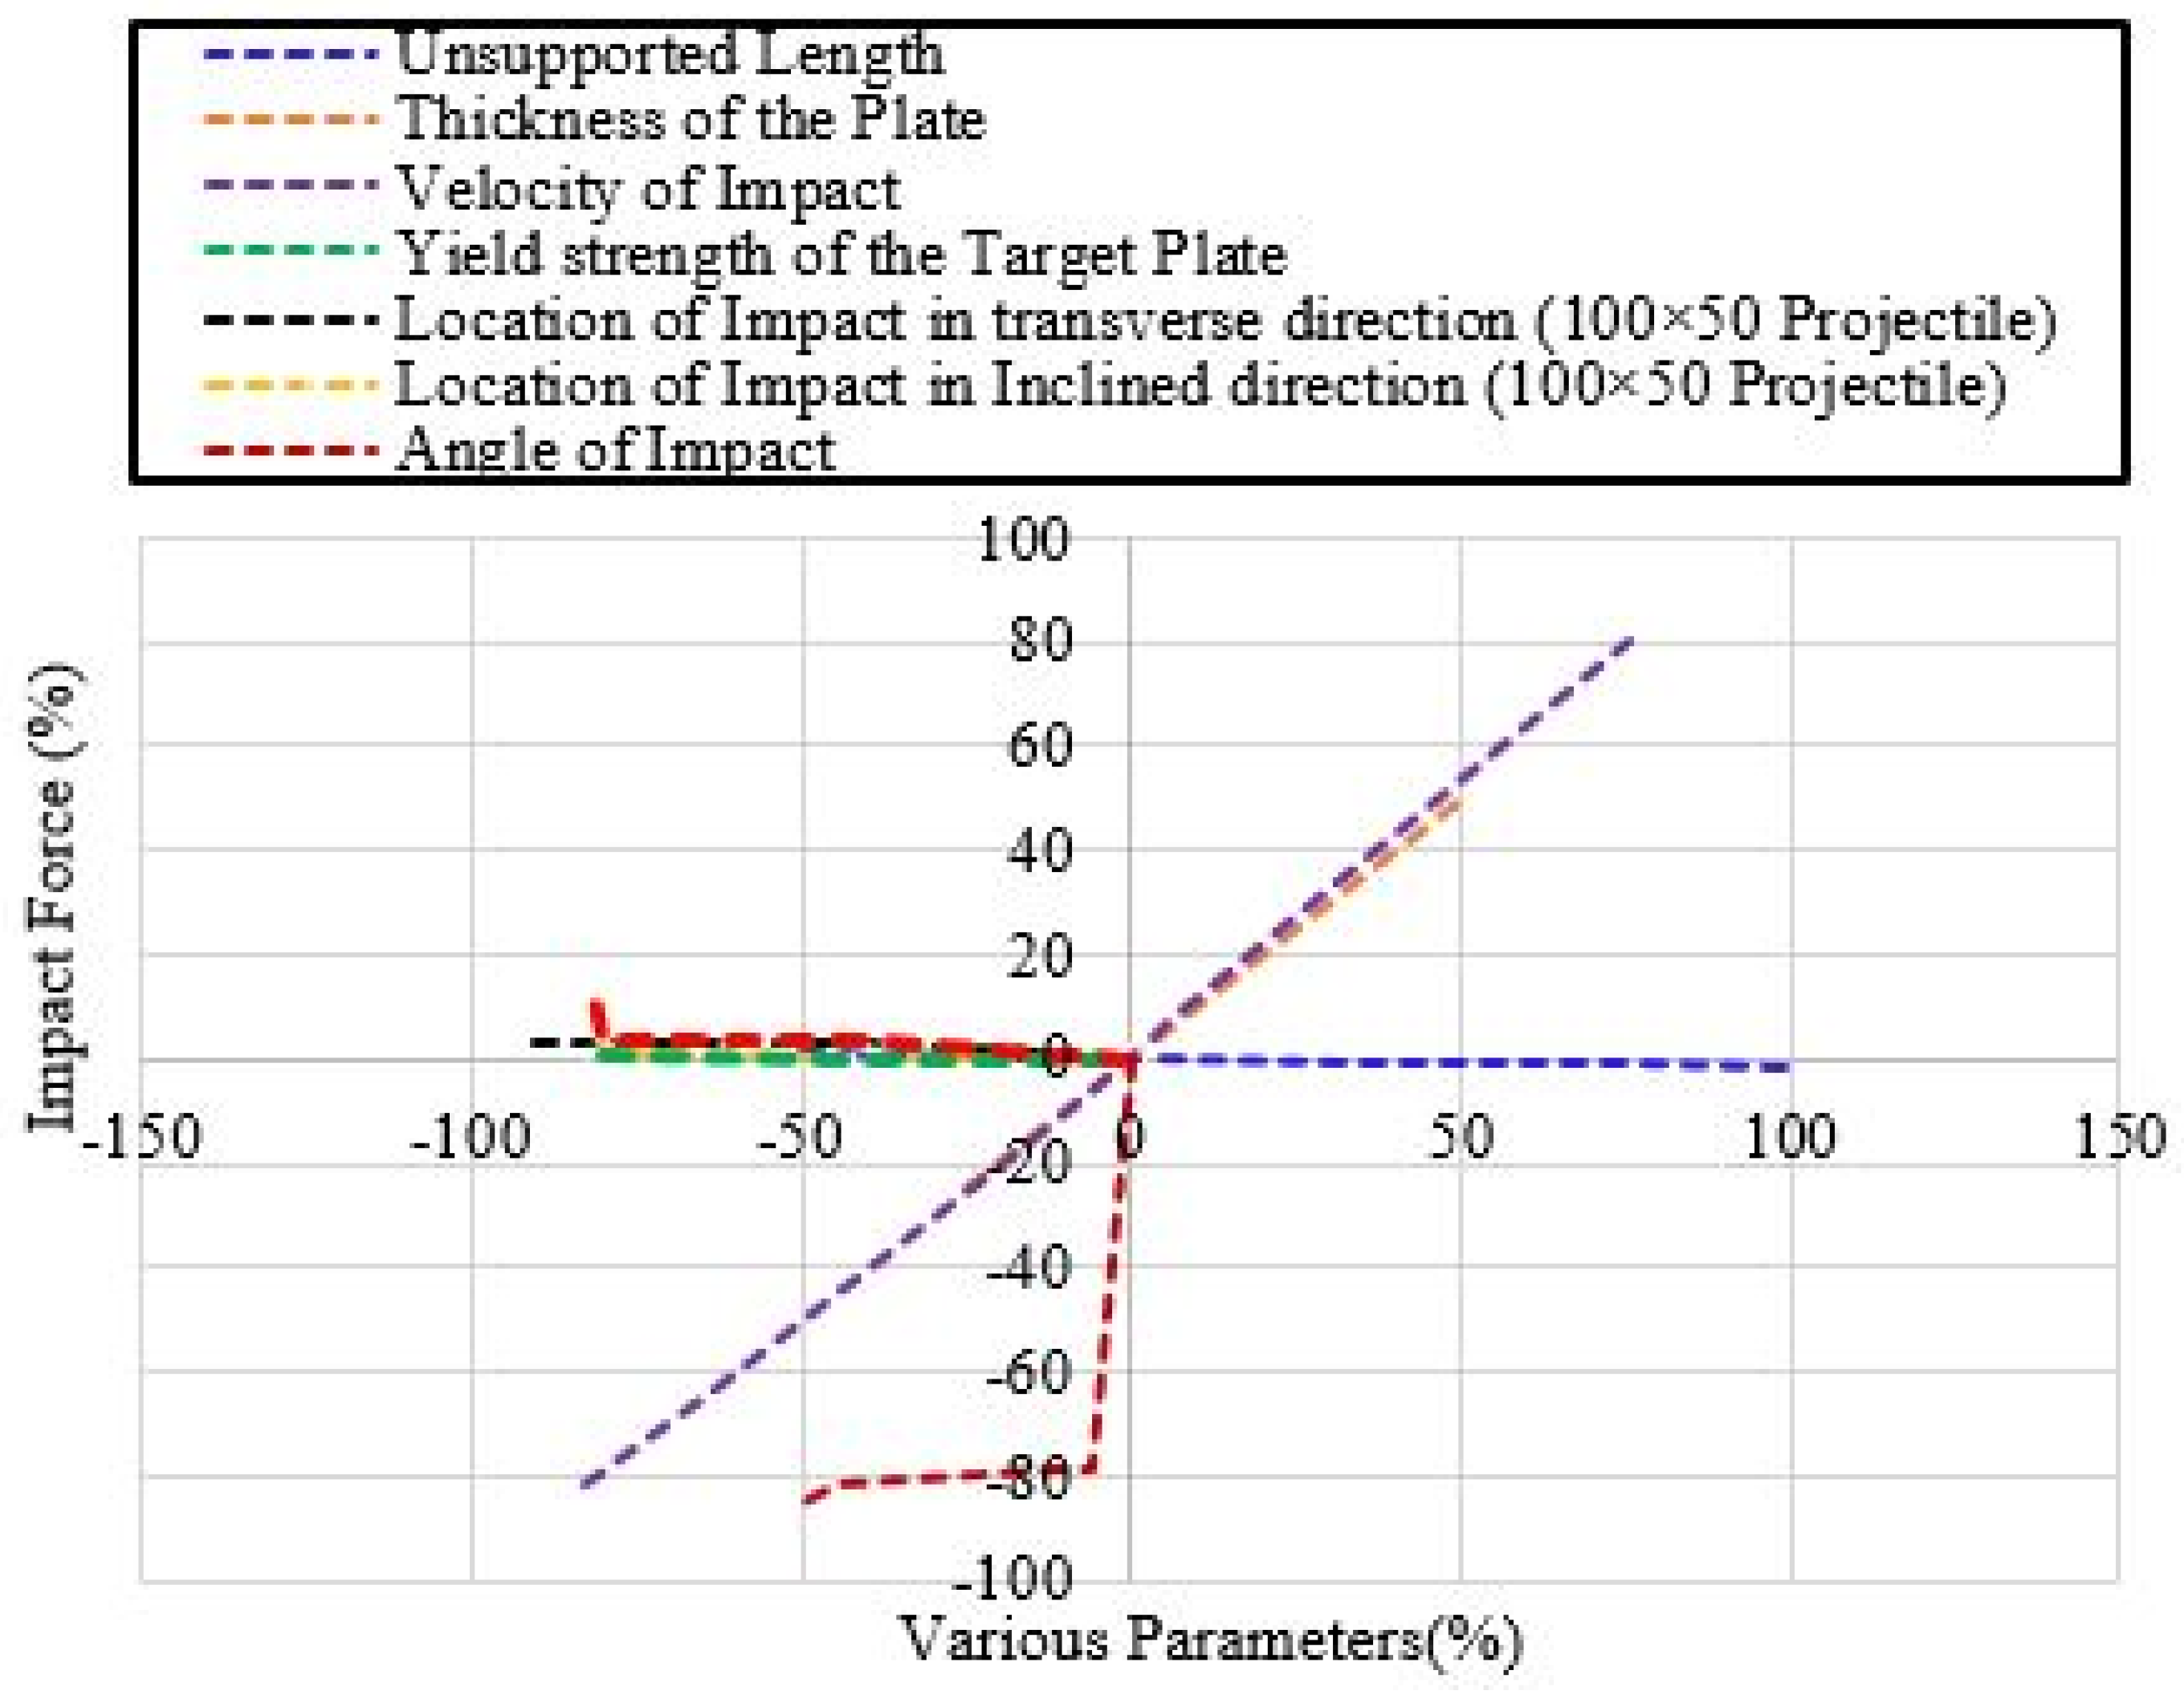
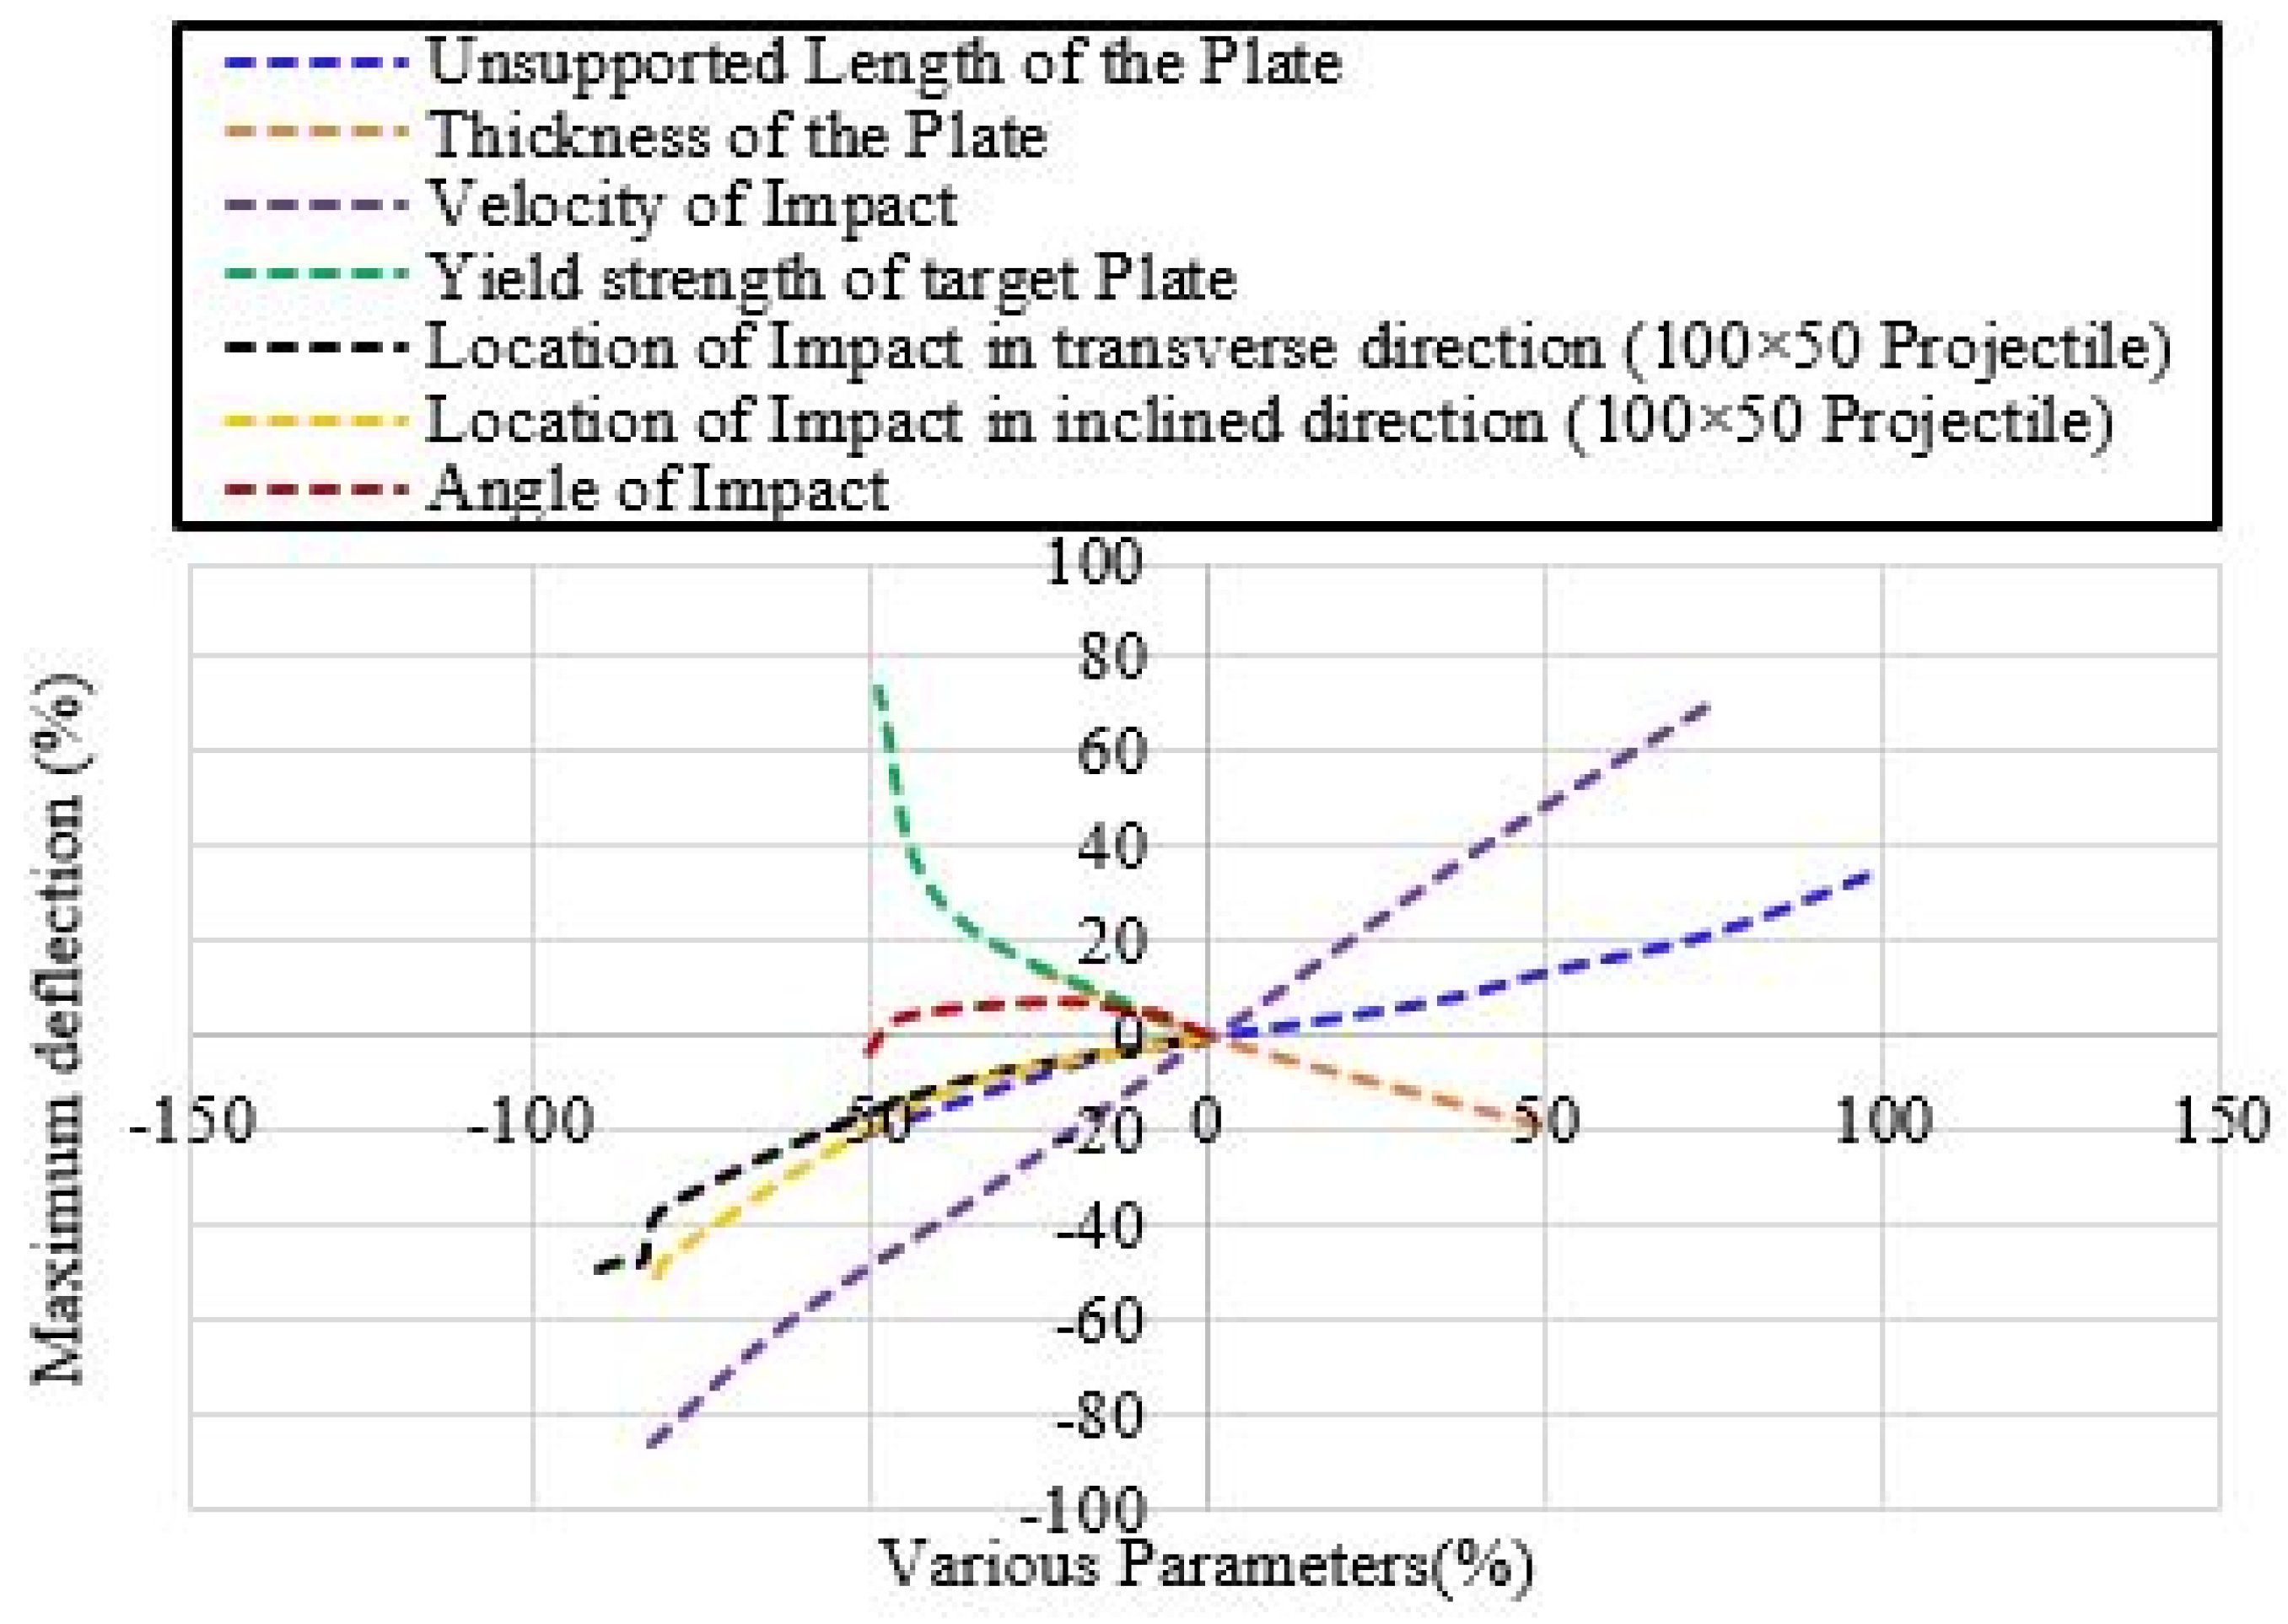
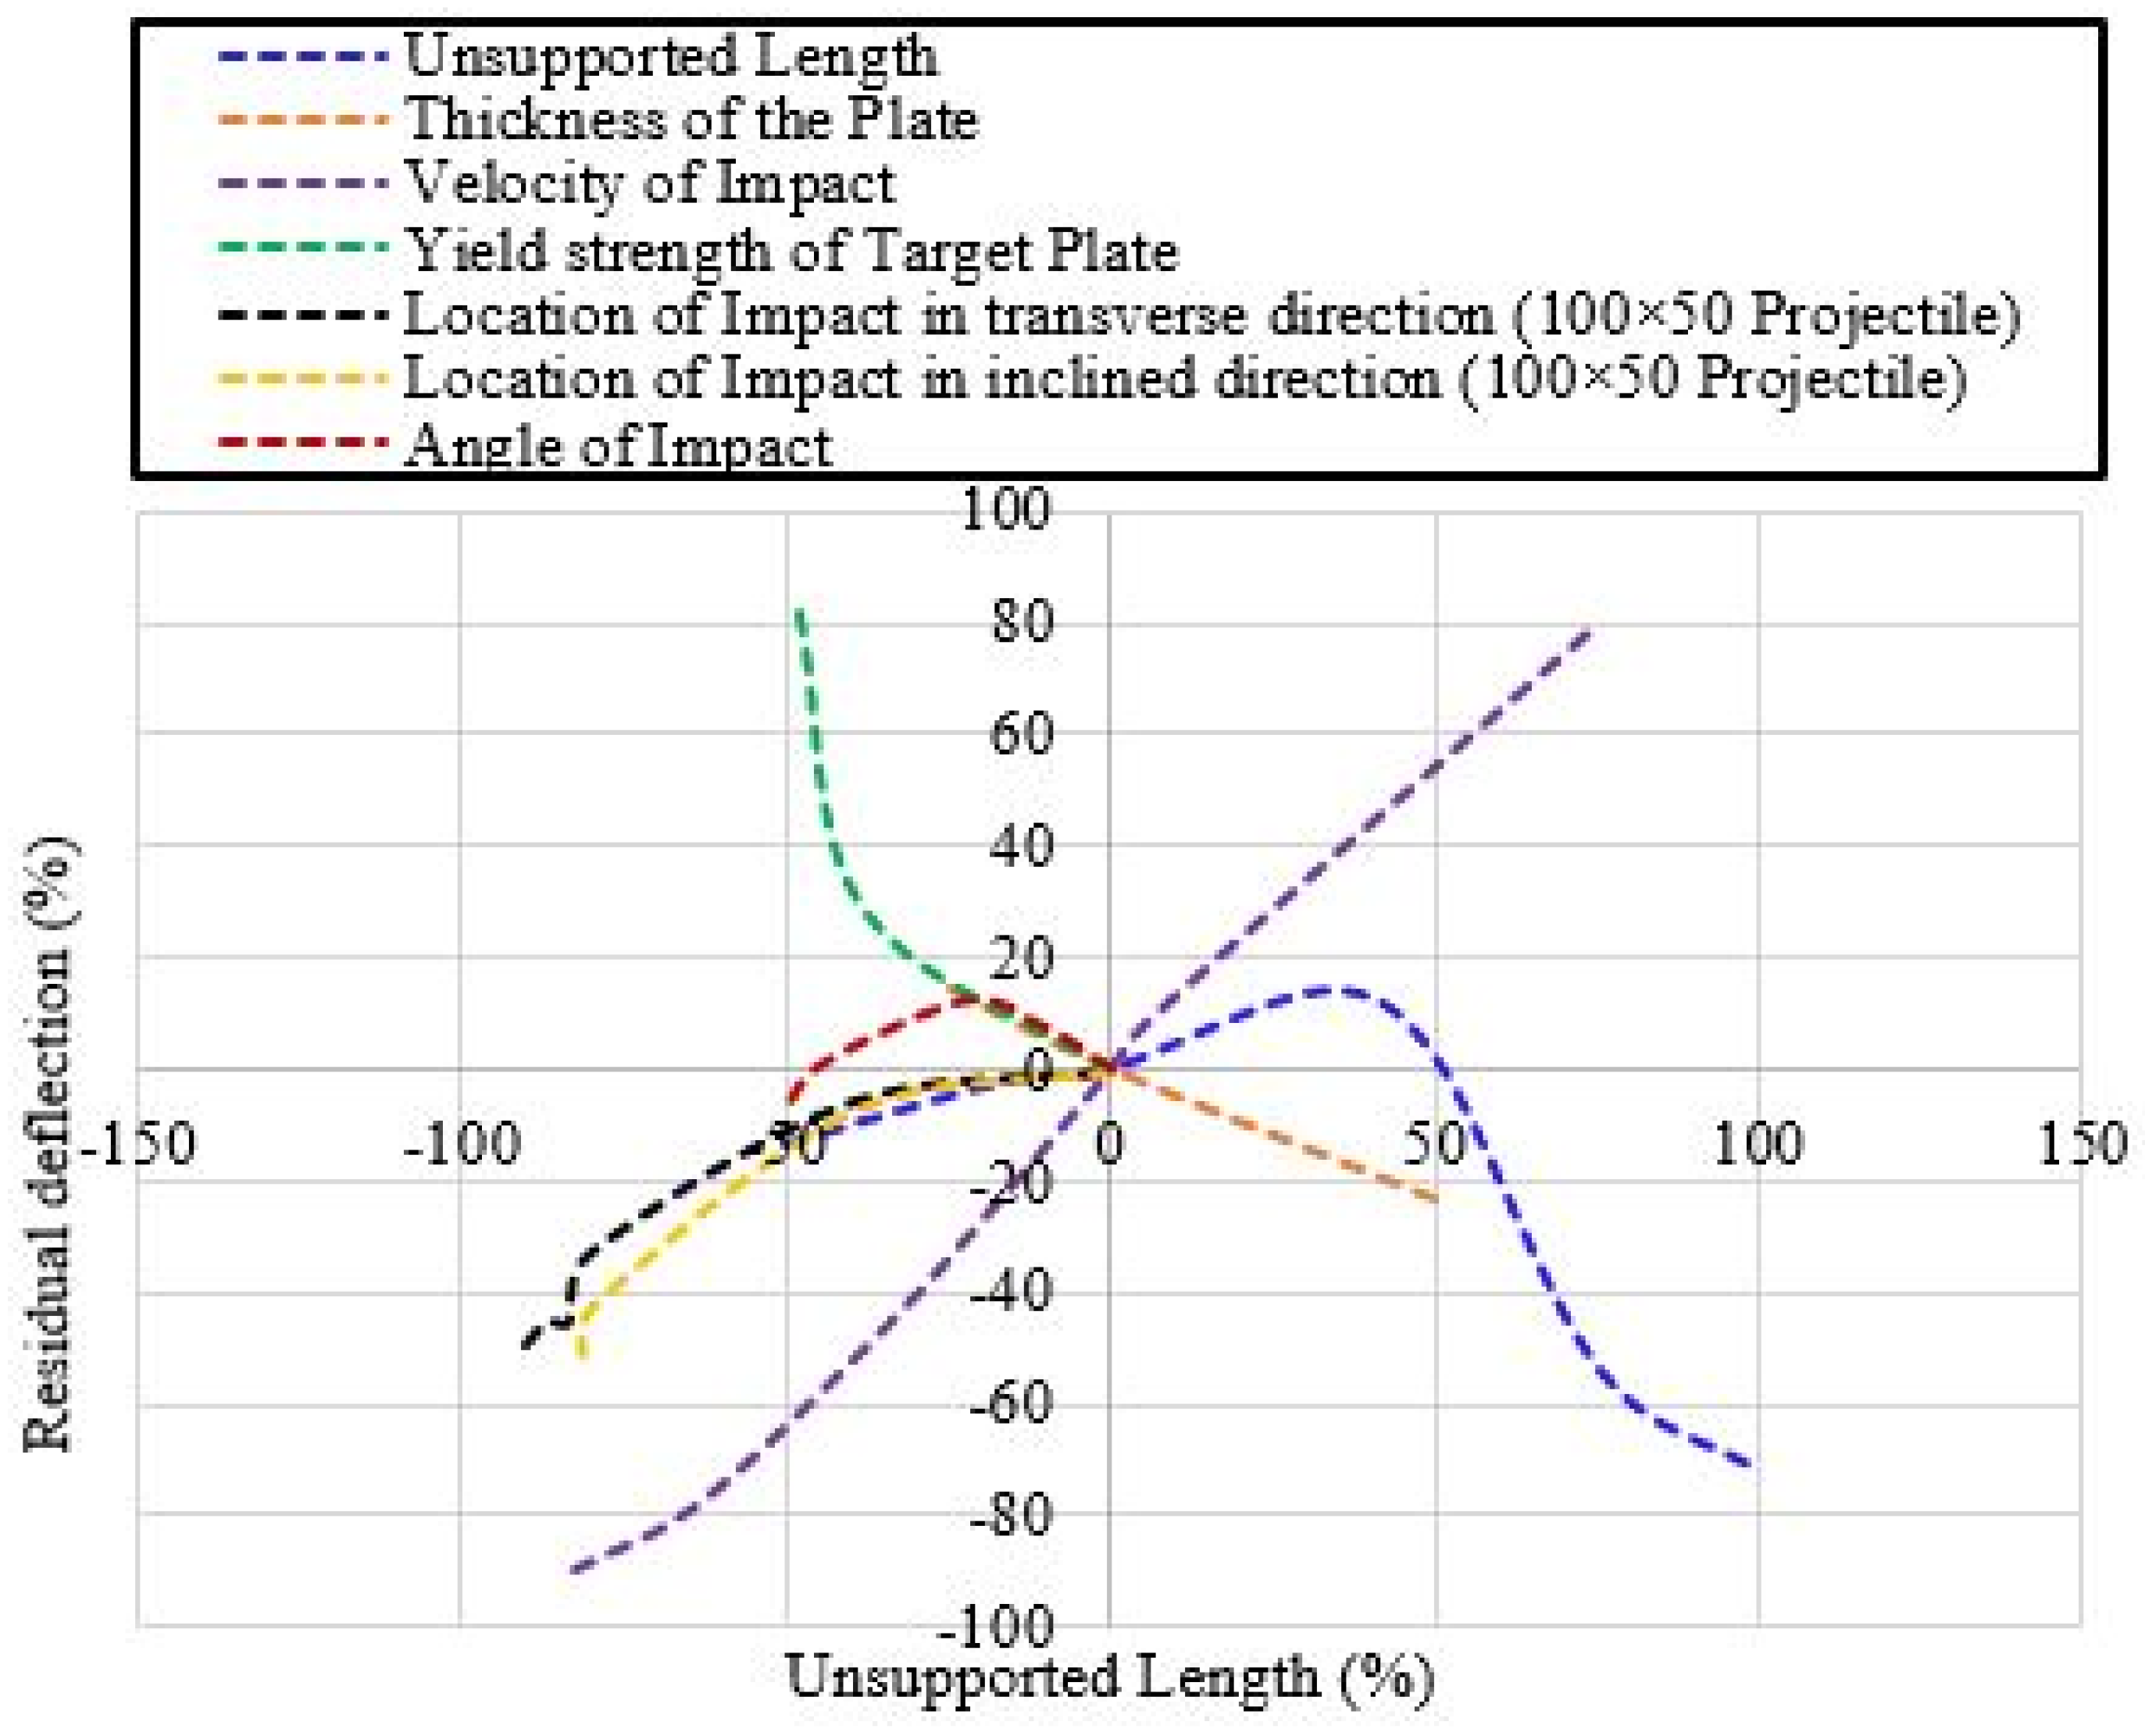
4.3. Summary of Parametric and Sensitivity Study

The slopes of the sensitivity curves calculated for the graphs given in Figure 15, Figure 16 and Figure 17 showed that the angle of impact is the parameter that highly influenced the peak impact force, followed by the velocity of impact and thickness of the plate, respectively. The location of impact and unsupported length were the next parameters in the queue, respectively. There was no significant impact of the type of alloy on the impact force. The rankings varied when considering the maximum and residual deflections. In the case of the maximum deflection, the primary influencing factor was the type of alloy, followed by the velocity of impact, plate thickness, location of impact, unsupported length, and the angle of impact, in that order; however, when examining the parameters’ effect on the residual deflection, the sequence exhibited slight variations. The type of alloy held the most significant position, followed by the velocity of impact, unsupported length, location of impact, plate thickness, and angle of impact, in that respective order. Table 13 offers a summary of the penetration at different velocities at the normal angle of impact for 3 mm thick panels.

5. Development of the Design Guidelines

The parametric sensitivity study enabled us to generate a data bank and determine the key structure- and load-related parameters that are affecting the dynamic impact performance of the solid aluminum claddings. Table 14 outlines these key parameters, forming the basis for the regression analysis. Using data from 216 numerical models, regression equations were formulated, achieving high R2 values (97%, 94%, and 95%) for predicting the peak impact forces at different angles (α, β, and γ). These equations considered parameters such as the plate thickness, impact velocity, impact location, yield strength of the alloy, and unsupported length. A similar regression analysis led to equations (92.5%, 93.2%, and 93.1% R2) predicting the maximum deflection and residual deflection of the plates [39,40]. Table 15 presents the reference parameters utilized in formulating the proposed equations.

5.1. Proposed Equations

5.1.1. Peak Impact Force

Equations were developed for different ranges of parameters, keeping in mind achieving the highest value of R2. Separate equations were developed considering the impact at different angles. The regression equations for the prediction of the impact force at various angles are given in Equation (13) to Equation (15). The values of R2 obtained for Equation (13), Equation (14), and Equation (15) were 97%, 94%, and 95%, respectively.
l n F i F α 0 = ( 0.39 t t 0 + 0.40 v v 0 + 0.134 r R + 0.0353 F b y F b y 0 0.11 L L 0 0.56 )   θ i = 90 °
l n F i F β 0 = ( 0.634 t t 0 + 0.414 v v 0 + 0.276 r R + 0.0828 F b y F b y 0 0.0971 L L 0 0.898 ) 45 ° < θ i < 90 °
l n F i F γ 0 = ( 0.505 t t 0 + 0.406 v v 0 + 0.193 r R + 0.036 F b y F b y 0 0.003 L L 0 0.803 )   35 ° < θ i 45 °
where Fi is the value of the impact force to be predicted, Fα0 (64.74 kN), Fβ0 (14.04 kN), and Fγ0 (11.80 kN) are the impact forces recorded when the projectile hits the center of the plate at an angle of 90°, 85°, and 45°, respectively, at reference parametric values (refer to Table 15). Furthermore, t represents the thickness of the plate, v stands for velocity of impact, r is the distance of impact from the center of the plate, Fby is the yield strength of the alloy used in the manufacturing of the plate and L is the unsupported length.

5.1.2. Maximum Deflection

Similar to the impact force, equations were also developed to predict the maximum deflection of the plate at the location of impact. The maximum deflection of the plate when it was impacted at the center was considered as a reference. The values of R2 were 92.5%, 93.2%, and 93.1% for Equation (16), Equation (17) and Equation (18), respectively.
l n Δ m i Δ m α 0 = ( 0.50 t t 0 + 0.42 v v 0 0.83 r R 0.8 F b y F b y 0 + 0.28 L L 0 + 0.68 )   θ i = 90 °
l n Δ m i Δ m β 0 = ( 0.46 t t 0 + 0.416 v v 0 0.74 r R 0.76 F b y F b y 0 + 0.28 L L 0 + 0.62 )   45 ° < θ i < 90 °
l n Δ m i Δ m γ 0 = ( 0.43 t t 0 + 0.40 v v 0 0.60 r R 0.56 F b y F b y 0 + 0.50 L L 0 + 0.091 ) 35 ° < θ i 45 °
where Δmi is the maximum deflection that is to be predicted, Δmα0 (11.72 mm), Δmβ0 (11.73 mm), and Δmγ0 (10.89 mm) are the maximum deflections recorded when the projectile hits the center of the plate at an angle of 90°, 85°, and 45°, respectively, at the reference parametric values (refer to Table 15).

5.1.3. Residual Deflection

Equations were also proposed to predict the residual deflection of the solid aluminum cladding system. The residual deflection of the plate when it was impacted at the center was considered as a reference. The coefficient of determination calculated for the proposed equations, Equation (19), Equation (20), and Equation (21), was more than 90% for all the sets of values.
l n Δ R i Δ R α 0 = ( 0.55 t t 0 + 0.46 v v 0 0.72 r R 0.94 F b y F b y 0 + 0.1 L L 0 + 1.2 )   θ i = 90 °
l n Δ R i Δ R β 0 = ( 0.48 t t 0 + 0.45 v v 0 0.56 r R 0.9 F b y F b y 0 + 0.1 L L 0 + 1.1 )   45 ° < θ i < 90 °
l n Δ R i Δ R γ 0 = ( 0.56 t t 0 + 0.44 v v 0 0.66 r R 0.77 F b y F b y 0 + 0.19 L L 0 + 0.93 ) 35 ° < θ i 45 °
where ΔRi is the residual deflection that is to be predicted, ΔRα0 (7.4 mm), ΔRβ0 (7.74 mm) and ΔRγ0 (5.05 mm) are the residual deflections recorded when the projectile hits the center of the plate at an angle of 90°, 85°, and 45°, respectively, at the reference parametric values (refer to Table 15).

5.2. Verification of the Proposed Equations

The validity of the proposed equations was confirmed by incorporating values into the equations and then comparing the results with numerical models. Random values were picked for different parameters and the predicted values of the structure- and load-related parameters were calculated from the proposed equations. These values were compared with data collected from the numerical models. The percentage difference between the predicted values using the regression equations and those of the numerical model was less than 10% for the peak impact force and maximum deflection and around 12% for the residual deflection for all the sets of random values, which proves the validity of the equations (see Table 16, Table 17 and Table 18).

6. Conclusions

This study provides manufacturers and engineers with the design equations and velocity ranges required to optimize the impact loading testing process for panels, ensuring efficiency and cost-effectiveness in compliance with construction regulations. It involves the development and validation of the proposed model for analyzing the impact response of solid aluminum panels. The key parameters influencing the panel’s impact response were identified through a parametric sensitivity study. Regression equations were then developed to accurately predict the panel’s performance when subjected to the impact of timber projectiles.
The findings of this study can be summarized as follows:
  • A robust numerical model can be developed for the simulation of the dynamic response of solid aluminum panels by defining the target as shell elements and the projectile as the solid deformable body. The material model and Cowper–Symonds constants were the key factors that enabled the robustness of the proposed model. The numerical results obtained by employing a piecewise linear plasticity model were in close agreement with those of the experimental, confirming the robustness of the material model.
  • It was found that the angle of impact is the most influential parameter, resulting in an 80% reduction in the peak impact force with a 50% decrease in angle. Increasing the velocity of impact by 75% led to an 82% increase in the peak impact force. The plate thickness also had a significant effect, with a 50% increase resulting in a 49.5% increase in the impact force. The location of impact influenced the response by 13%, while the unsupported length contributed to a 1.5% variation. The type of alloy was the dominant parameter, with an increase in the maximum and residual deflection of 29% and 79% when using 5005-O instead of 5052-H32. The velocity of the impact also favored the maximum and residual deflections, with a 75% increase in the projectile velocity increasing the maximum and residual deflection by 70% and 80%, respectively. The increase in the plate thickness reduced the maximum and residual deflection by 50%.
  • The proposed prediction equations offered a better alternative to experimental testing. The validation test verified that the difference between the predicted values using the regression equations and those of the numerical model was less than 10% for the peak impact force and maximum deflection and less than 12% for the residual deflection, confirming the accuracy. Thus, it was concluded that the prediction formulae agree to a considerable degree with the numerical results and can be used as alternatives for the prediction of the dynamic impact performance of plain solid aluminum panels. They enable the identification of the maximum peak impact force panels can withstand, as well as the maximum and residual deflection anticipated during an impact event. By implementing control measures, manufacturers can develop resilient and efficient designs, ensuring the structural integrity of the panels under various impact conditions.

Author Contributions

I.H.: Conceptualization, methodology, software, validation, formal analysis, investigation, and writing. S.A.: Methodology, supervision, review. S.G.: Methodology, supervision, review. All authors have read and agreed to the published version of the manuscript.

Funding

This research received no external funding.

Data Availability Statement

The data substantiating the findings presented will be accessible through the corresponding author’s Google Scholar profile in the form of their upcoming thesis.

Acknowledgments

The authors are thankful to Joe Barletta and Michael O’Grady (Valmond and Gibson PTY Ltd.), Balesh Baleshan (Queensland Façade Engineering Lead, Arup), and Zvonimir Kurtovic (Toomark Group Australia) for their input and guidance in deciding the various lengths, thicknesses, and alloys of the solid aluminum plates that were used in this study. They are also thankful to Chuen Yiu LO (Senior Technical Officer at Griffith University) for providing technical support for establishing the test setup.

Conflicts of Interest

The authors declare no conflicts of interest.

References

  1. Jiao, S.; Gunalan, S.; Gilbert, B.; Baleshan, B.; Bailleres, H. Experimental investigation of an innovative composite mullion made of aluminium and timber. J. Build. Eng. 2021, 38, 101907. [Google Scholar] [CrossRef]
  2. Gibson, V. Element 13. Available online: https://valmondgibson.com/element13 (accessed on 5 July 2023).
  3. World Bank Group. Sustaining Resilience—East Asia and Pacific Economic Update; World Bank Group: Washington, DC, USA, 2017. [Google Scholar]
  4. Spectrum News Staff. Widespread Panhandle Damage from Michael. Spectrum News. 2018. Available online: https://www.baynews9.com/fl/tampa/news/2018/10/11/images--widespread-panhandle-damage-from-michael (accessed on 10 October 2023).
  5. Huang, C. Hong Kong’s Losses from Typhoon Mangkhut To Be Bigger than Typhoon Hato. The Straits Times. 2018. Available online: https://www.straitstimes.com/asia/east-asia/hong-kongs-losses-from-typhoon-mangkhut-to-be-bigger-than-typhoon-hato (accessed on 10 October 2023).
  6. Hussain, I.; Aghdamy, S.; Gunalan, S. A robust numerical model to investigate the response of aluminum cladding systems subjected to impact loading. In Proceedings of the ACAM10: 10th Australasian Congress on Applied Mechanics, Online, 1–3 December 2021; pp. 405–419. [Google Scholar]
  7. Li, Z.; Feng, R.; Wang, Y.; Wang, L. Experimental study on the effect of dents induced by impact on the fatigue life of 2024-T3 aluminum alloy plate. Eng. Struct. 2017, 137, 236–244. [Google Scholar] [CrossRef]
  8. Li, Z.-g.; Zhang, M.-y.; Fu, L.; Zhang, J.-h.; Hu, Z.-m.; Zhang, J.-z.; Zhao, Y.-n. Influence of dent on residual ultimate strength of 2024-T3 aluminum alloy plate under axial compression. Trans. Nonferrous Met. Soc. China 2014, 24, 3084–3094. [Google Scholar] [CrossRef]
  9. Mohotti, D.; Ali, M.; Ngo, T.; Lu, J.; Mendis, P.; Ruan, D. Out-of-plane impact resistance of aluminium plates subjected to low velocity impacts. Mater. Des. 2013, 50, 413–426. [Google Scholar] [CrossRef]
  10. Pathirana, M. Modelling Damage to Glazing and Aluminium Facades by Flying Objects. Ph.D. Thesis, University of Melbourne, Melbourne, Australia, 2018. [Google Scholar]
  11. Perera, S. Modelling Impact Actions of Flying and Falling Objects. Ph.D. Thesis, University of Melbourne, Melbourne, Australia, 2017. [Google Scholar]
  12. Gupta, N.; Iqbal, M.; Sekhon, G. Effect of projectile nose shape, impact velocity and target thickness on deformation behavior of aluminum plates. Int. J. Solids Struct. 2007, 44, 3411–3439. [Google Scholar] [CrossRef]
  13. Gupta, N.; Iqbal, M.; Sekhon, G. Effect of projectile nose shape, impact velocity and target thickness on the deformation behavior of layered plates. Int. J. Impact Eng. 2008, 35, 37–60. [Google Scholar] [CrossRef]
  14. Villavicencio, R.; Sutherland, L.; Soares, C.G. Numerical simulation of transversely impacted, clamped circular aluminium plates. Ships Offshore Struct. 2012, 7, 31–45. [Google Scholar] [CrossRef]
  15. Shen, W.Q. Dynamic plastic response of thin circular plates struck transversely by nonblunt masses. Int. J. Solids Struct. 1995, 32, 2009–2021. [Google Scholar] [CrossRef]
  16. Sutherland, L.; Soares, C.G. Impact behaviour of GRP, aluminium and steel plates. In Analysis and Design of Marine Structures; CRC Press: Boca Raton, FL, USA, 2009; pp. 317–324. [Google Scholar]
  17. Christiansen, E.L.; Cykowski, E.; Ortega, J. Highy oblique impacts into thick and thin targets. Int. J. Impact Eng. 1993, 14, 157–168. [Google Scholar] [CrossRef]
  18. Fagerholt, E.; Grytten, F.; Gihleengen, B.E.; Langseth, M.; Børvik, T. Continuous out-of-plane deformation measurements of AA5083-H116 plates subjected to low-velocity impact loading. Int. J. Mech. Sci. 2010, 52, 689–705. [Google Scholar] [CrossRef]
  19. Grytten, F.; Børvik, T.; Hopperstad, O.S.; Langseth, M. Low velocity perforation of AA5083-H116 aluminium plates. Int. J. Impact Eng. 2009, 36, 597–610. [Google Scholar] [CrossRef]
  20. Mocian, O.A.; Constantinescu, D.M.; Sandu, M.; Sorohan, Ş. Low velocity impact of 6082-T6 aluminum plates. In Proceedings of the AIP Conference Proceedings, Bucharest, Romania, 19–22 September 2017. [Google Scholar]
  21. 6.14-5. Manual, Abaqus Scripting User’s. Available online: http://130.149.89.49:2080/v6.14/books/stm/default.htm/ (accessed on 20 October 2021).
  22. Zhang, D.-N.; Shangguan, Q.-Q.; Xie, C.-J.; Liu, F. A modified Johnson–Cook model of dynamic tensile behaviors for 7075-T6 aluminum alloy. J. Alloys Compd. 2015, 619, 186–194. [Google Scholar] [CrossRef]
  23. Uz, M.E. Modelling the impact of hailstones on flat steel roofing membranes for residential buildings. Sci. Rep. 2022, 12, 19836. [Google Scholar] [CrossRef] [PubMed]
  24. Reese, S. A large deformation solid-shell concept based on reduced integration with hourglass stabilization. Int. J. Numer. Methods Eng. 2007, 69, 1671–1716. [Google Scholar] [CrossRef]
  25. Mohammadi, M.R.; Jamal Omidi, M. A numerical study on aluminum plate response under low velocity impact. Int. J. Eng. 2017, 30, 439–447. [Google Scholar]
  26. Wood Solutions. Oak, Tasmanian. 2023. Available online: https://www.woodsolutions.com.au/wood-species/hardwood/oak-tasmanian (accessed on 10 October 2023).
  27. Iqbal, M.A.; Gupta, N.; Sekhon, G. Behaviour of thin aluminium plates subjected to impact by ogive-nosed projectiles. Def. Sci. J. 2006, 56, 841. [Google Scholar] [CrossRef]
  28. Gokce, H. Prediction of Nonlinear Dynamic Impact Force History by Finite Element Method. J. Eng. Sci. Technol. Rev. 2018, 11, 32–37. [Google Scholar] [CrossRef]
  29. Aghdamy, S. Concrete-Filled Double Skin tube Columns Subjected to Lateral Impact Loading: Experimental and Numerical Study. Ph.D. Thesis, Queensland University of Technology, Brisbane, QLD, Australia, 2016. [Google Scholar]
  30. AS/NZS 1170.2:2021; Structural Design Actions, Wind Actions. Standards Australia: Canberra, Australia, 2021.
  31. Tomark Group Australia. Aluminium Composite Specialists. 2023. Available online: https://www.tomark.com.au/ (accessed on 10 October 2023).
  32. Facades, H. HVG Facades. 2023. Available online: https://hvgfacades.com.au/ (accessed on 30 October 2023).
  33. Park, J.-W.; Kim, J.; Kang, B.-S. Development on a Prediction Model for Experimental Condition of Flexibly Reconfigurable Roll Forming Process. Metals 2019, 9, 896. [Google Scholar] [CrossRef]
  34. Dale, M.; Carlsson, L.A.; Acha, B.A. Impact force analysis during low-velocity impact of woven carbon/vinylester. J. Compos. Mater. 2012, 46, 3163–3172. [Google Scholar] [CrossRef]
  35. Jones, N. Impact loading of ductile rectangular plates. Thin-Walled Struct. 2012, 50, 68–75. [Google Scholar] [CrossRef]
  36. Wierzbicki, T. Bending Response of the Plates and Optimum Design. Available online: https://eng.libretexts.org/Bookshelves/Mechanical_Engineering/Structural_Mechanics_(Wierzbicki)/06%3A_Bending_Response_of_Plates_and_Optimum_Design (accessed on 30 October 2023).
  37. Britannica, E. Newton’s Three Laws of Motion. 2023. Available online: https://www.britannica.com/science/Newtons-laws-of-motion (accessed on 30 October 2023).
  38. Cheon, J.-M.; Choi, Y. Effect of projectile incident angle on penetration of steel plates. Int. J. Precis. Eng. Manuf. 2016, 17, 1721–1727. [Google Scholar] [CrossRef]
  39. James, G.; Witten, D.; Hastie, T.; Tibshirani, R. An Introduction to Statistical Learning; Springer: New York, NY, USA, 2013; Volume 112. [Google Scholar]
  40. Fox, J. Applied Regression Analysis and Generalized Linear Models; Sage Publications: Los Angeles, CA, USA, 2015. [Google Scholar]
Figure 1. Applications of aluminum cladding systems (Belconnen Health Reclad) [2].
Buildings 14 00135 g001
Figure 2. Element types and boundary conditions investigated in this study.
Buildings 14 00135 g002
Figure 3. Comparison of the peak impact force using different mesh sizes.
Buildings 14 00135 g003
Figure 4. Stress–strain curve with progressive damage degradation, own elaboration based on data from [28].
Buildings 14 00135 g004
Figure 5. Assemblies of the proposed model, own elaboration based on data from (a) AA5083-H116 and (b) 6082-T6 [6].
Buildings 14 00135 g005
Figure 6. Proposed base model.
Buildings 14 00135 g006
Figure 7. Connection details of solid aluminum panels (Element 13) [2].
Buildings 14 00135 g007
Figure 8. Test setup for the drop test.
Buildings 14 00135 g008
Figure 9. Connection of the accelerometer to the projectile.
Buildings 14 00135 g009
Figure 10. Force–time history for a 5052-H32 plate subjected to the impact at the center.
Buildings 14 00135 g010
Figure 11. Deflection–time history for a 5052-H32 plate impacted at the center.
Buildings 14 00135 g011
Figure 12. Maximum deflection at the location of impact.
Buildings 14 00135 g012
Figure 13. Post-test observations of the impacted plate indicated no local indentations.
Buildings 14 00135 g013
Figure 14. Schematic diagram of the indentation at the velocity of 40 m/s.
Buildings 14 00135 g014
Figure 15. Influence of the key parameters on the peak impact force.
Buildings 14 00135 g015
Figure 16. Influence of the key parameters on the maximum deflection.
Buildings 14 00135 g016
Figure 17. Influence of the key parameters on the residual deflection.
Buildings 14 00135 g017
Figure 18. Different locations of impact selected for the sensitivity study.
Buildings 14 00135 g018
Figure 19. Impact force w.r.t location of impact (angle of impact was 45°, 5052-H32).
Buildings 14 00135 g019
Figure 20. Impact force with respect to the location of impact (600 mm span, 5005-O).
Buildings 14 00135 g020
Figure 21. Maximum deflection with respect to the location of impact (5052-H32).
Buildings 14 00135 g021
Figure 22. Residual deflection with respect to the location of impact (5005-O).
Buildings 14 00135 g022
Figure 23. Impact of a projectile at an angle.
Buildings 14 00135 g023
Table 1. Parameters used as input in the plasticity model.
PartsParametersValuesUnits
Aluminum plate [25]Modulus of elasticity70,000MPa
Poison ratio0.33
Density2.66 × 10−9tons/mm3
Steel projectile [25]Density7.85 × 10−9tons/mm3
Modulus of elasticity210,000MPa
Poisson’s ratio0.3
Timber projectile [26]Density7.80 × 10−10tons/mm3
Modulus of elasticity15,000MPa
Poisson’s ratio0.40
Table 2. Difference between the proposed model and the previous models.
ParametersProposedMohotti et al. [9]Mocian et al. [20] Fagerholt et al. [18]Grytten et al. [19]
Aluminum plateShell elementsSolid elementsShell elementsSolid elementsSolid elements
Material modelPiecewise linear plasticity model Johnson–Cook material modelMat Plastic Kinematic ModelJohnson–Cook material modelJohnson–Cook material model
Damage to the ductile metalsUsed fracture strain Studied non-perforated platesEmployed fracture strainJohnson–Cook damage modelJohnson–Cook damage model
Friction ConsideredNeglectedNeglectedNeglectedNeglected
ProjectileDeformable body Rigid bodyRigid bodyRigid bodyRigid body
Effect of strain rate (DIF)ConsideredNeglectedConsideredNeglectedNeglected
Table 3. Experimental studies selected from the literature to validate the proposed model.
S. No.ResearcherDescription
1Mohotti et al. (2013) [9]Out-of-plane impact resistance of aluminum plates (AA5083-H116) subjected to low-velocity impacts was investigated. A 37 mm projectile was launched on an aluminum plate of 300 × 300 mm through a gas gun. The weight of the projectile was 5 kg. The exposed surface of the plate was 250 × 250 mm. Different velocities of impact ranging from 5 m/s to 15 m/s were used.
2Mocian et al. (2018) [20]The low-velocity impact of 6082-T6 aluminum plates was studied. An aluminum plate of 140 × 140 mm with a thickness of 1.5 mm was used as the target plate. The mass and the velocity of the hemispherical projectile were 13.15 kg, and a velocity of 0.77 m/s, respectively, and the head diameter of the projectile was 20 mm.
3Fagerholt et al. (2010) [18]A blunt projectile of 30 mm diameter was used to target square-shaped (AA5083-H116) plates with dimensions 600 × 600 × 5 mm at the center with a velocity ranging from 7 to 11 m/s. The total weight of the projectile used was 19 kg.
4Grytten et al. (2009) [19]A blunt nose projectile with a diameter of 20 mm was used to target a square plate (AA5083-H116) of 600 × 600 mm mounted on a circular frame. A range of velocities from 3.5 to 15 m/s was employed. The thicknesses of the plates were 3 mm, 5 mm, and 10 mm. The total weight of the projectile was 19 kg.
5Pathirana et al. (2018) [10]The study focused on assessing the damage incurred by aluminum panels when subjected to the high-velocity impact of windborne debris. Spherical projectiles made of wood and concrete, both with a diameter of 62.5 mm, were employed in the study. Moreover, 300 × 300 mm aluminum plates (made of 5052-H34) with a thickness of 2 mm and 4 mm were targeted at the center with a velocity of 21 and 40 m/s.
Table 4. Comparing the peak impact force results with those of Mocian et al. (2018) [20].
S. No.Velocity
(m/s)
Peak Impact Force (kN) E X P . F E A E X P . × 100
Mocian et al. [20]Proposed FEA (%)
FEAEXP. ProposedMocian et al. [20]
10.77N/P *2.352.292.55N/A **
21.5N/P5.545.294.51N/A
33.512.0711.1511.190.358.25
* N/P stands for not published. ** N/A stands for not applicable.
Table 5. Comparing the peak impact force results with those of Grytten et al. (2009) [19].
S. No.Velocity
(m/s)
Peak Impact Force (kN) E X P . F E A E X P . × 100
Grytten et al. [19]Proposed FEA (%)
EXP.FEA Proposed Grytten et al. [19]
14.1621.725.2919.798.8016.54
25.0624.9926.0222.709.164.12
35.9939.1444.4636.247.4013.59
47.541.1251.6937.798.1025.70
512.3197N/A94.872.20N/A
613.539911195.873.1612.12
Table 6. Comparing the peak impact force results with those of Fagerholt et al. (2010) [18].
S. No.Velocity
(m/s)
Peak Impact Force (kN) E X P . F E A E X P . × 100
Fagerholt et al. [18]Proposed FEA (%)
EXP.FEA Proposed Fagerholt et al. [18]
17.3152.8469.9150.025.3332.3
27.9255.7465.2852.785.3117.11
310.6962.9672.560.563.8115.15
Table 7. Comparing the peak impact force results with those of Pathirana et al. (2018) [10].
S. No.Velocity
(m/s)
ProjectilePeak Impact Force (kN) E X P . F E A E X P . × 100
Pathirana et al. [10]Proposed FEA (%)
EXP.FEA Proposed Pathirana et al. [10]
124.5Concrete 202018.985.100
236Wood28N/P30.759.82N/A
Table 8. Comparing the maximum deflection results with those of Mohotti et al. (2013) [9].
S. No.Velocity (m/s)t
(mm)
Maximum Deflection
(mm)
E X P . F E A E X P . × 100
Mohotti et al. [9]Proposed FEA (%)
EXP.FEA Proposed Mohotti et al. [9]
19.02317.9418.1817.43.011.33
212.31517.518.4717.670.975.54
313.53616.9117.717.131.304.67
Table 9. Comparing the residual deflection results with those of Mohotti et al. (2013) [9].
S. No.Velocity (m/s)Thickness
(mm)
Residual Deflection
(mm)
E X P . F E A E X P . × 100
Mohotti et al. [9]Proposed FEA (%)
EXP.FEA Proposed Mohotti et al. [9]
19.02312.8812.6813.907.921.55
212.31513.4713.4914.457.280.15
313.53613.0211.9813.957.147.99
Table 10. Comparing the maximum deflection results with those of Fagerholt et al. (2010) [18].
S. No.Velocity
(m/s)
Maximum Deflection
(mm)
E X P . F E A E X P . × 100
Fagerholt et al. [18]Proposed FEA (%)
EXP.FEA Proposed Fagerholt et al. [18]
17.3123.6723.5022.863.420.71
27.9225.525.0924.842.581.60
310.6929.225.2126.499.2813.66
Table 11. Comparing the maximum deflection results with those of Pathirana et al. (2018) [10].
S. No.Velocity
(m/s)
ProjectileMaximum Deflection
(mm)
E X P . F E A E X P . × 100
Pathirana et al. [10]Proposed FEA (%)
EXP.FEA Proposed Pathirana et al. [10]
124.5Concrete 12.513.9911.706.411.9
236Wood7.12N/P7.261.96N/A
Table 12. Parameters and their ranges used for the sensitivity analysis.
ParameterRanges
Structure-relatedUnsupported length of the plate (mm × mm) 300 × 300, 500 × 500, 600 × 600, 900 × 900, 1050 × 1050, and 1200 × 1200
The thickness of the plate (mm)3, 4 and 6
Type of alloys5052-H32, 3003-H14 and 5005-O
Load-relatedThe velocity of impact (m/s)4, 8.5, 14.8, 18.8, 22.8, 24, 32, and 40
Location of impact in the longitudinal direction
(X2 + Y2)1/2 (mm)
275, 270, 260, 250, 240, 120, and 0
Location of impact in the transverse direction (X2 + Y2)1/2 (mm)169.7, 339.4, 346.4, 353.5, 381.8, and 388.9
The angle of impact with respect to the surface of the target plate (in degrees)90, 85, 80, 75, 65, 45, and 35
Table 13. Penetration for different velocities at the normal angle of impact, 3 mm thick panel.
Alloy Velocity
(m/s)
Dimensions
(mm × mm)
Penetration
CentreNear the Support
5052-H3240600 × 600NoNo
5052-H3250600 × 600NoYes
5052-H3265600 × 600YesYes
5052-H3260300 × 300NoYes
5052-H3270300 × 300YesYes
3003-H1440600 × 600NoNo
3003-H1450600 × 600NoYes
5005-O40600 × 600NoYes
5005-O40300 × 300NoYes
Table 14. Models used to develop the regression equations.
ParametersRangeNo of Models
Unsupported length300, 600 mm2
The thickness of the plate3, 6 mm2
Velocity of impact8.5, 22.8, and 40 m/s3
Angle of impact45°, 85°, 90°3
Location of impactCentre, 40% and 80% away from the center (in X direction as well as Y direction)3
Alloys5052-H32, 5005-O2
Total no of models 216
Table 15. Range of parameters used as a reference in the prediction equations.
SymbolDetailsRange
t0The thickness of the most commonly used cladding panels3 mm
V0Reference velocity recommended by 1170.2_2021 [30] 8.5 m/s
RInclined distance of support from the center of the plate
425 mm for 600 × 600 mm plate, and 212.5 mm for 300 × 300 mm plate
425 mm and 212.5 mm
F b y 0 Yield strength of most commonly used alloy 5052-H32269 MPa
L0Most commonly used unsupported length of cladding panels600 mm
Table 16. Comparison of the peak impact force predicted using the proposed equations and FEA.
S. No.tVelocityAnglerfbyLImpact Force (kN)Diff %
(mm)(m/s)(Degrees)(mm)(MPa)(mm)RegressionFEM
164090°0269600450.5456.941.42
248.590°026960084.1685.841.99
334090°0269600330.42368.2211.43
438.560°04160024.7423.455.21
564085°0269600137.26131.004.56
634060°212.1326960091.9592.700.81
764060°70.71269600155.23145.96.01
838.545°70.7126930013.1712.127.97
964045°04160097.3102.335.16
1034045°026960060.8355.878.15
Average 5.27
Table 17. Comparison of the maximum deflection predicted using the proposed equations and FEA.
S. No.tVelocityAngle rfbyLMaximum Deflection (mm)Diff %
(mm)(m/s)(Degrees)(mm)(MPa)(mm)RegressionFEM
3438.590°0269600−12.70−11.728.36
3568.590°0269600−7.70−6.9111.43
36322.885°0269600−26.00−28.709.40
37622.885°0269600−22.24−24.9110.71
38422.885°0269600−16.41−18.139.48
39422.890°169.7269600−15.60−16.55.45
4064090°346.4841600−36.60−33.210.24
4138.545°0269600−12.43−12.470.32
42422.845°0269600−15.42−17.2510.6
4364045°134.35269600−24.49−22.568.55
Average 8.45
Table 18. Comparison of the residual deflection predicted using the proposed equations and FEA.
S. NotVelocityAngle RfbyLResidual Deflection (mm)Diff %
(mm)(m/s)(Degrees)(mm)(MPa)(mm)RegressionFEM
4438.590°0269600−8.2−7.3411.72
4538.590°0269300−7.8−8.336.36
4648.590°346.48269600−3.8−4.015.24
4748.590°0269600−6.8−6.29.68
48322.885°0269600−21.46−24.6012.76
49422.885°0269600−19.29−21.4610.11
5064085°0269600−32.99−34.343.93
51622.845°0269600−7.60−8.5210.80
5264045°0269600−18.52−19.916.98
5338.590°77.7841300−13.3Penetration
Average 8.62
Disclaimer/Publisher’s Note: The statements, opinions and data contained in all publications are solely those of the individual author(s) and contributor(s) and not of MDPI and/or the editor(s). MDPI and/or the editor(s) disclaim responsibility for any injury to people or property resulting from any ideas, methods, instructions or products referred to in the content.

