Article

Experimental and Numerical Study on the Seismic Performances of Reinforcement-Embedded RC Column-to-Precast Cap Beams with Socket Connections

1
School of Civil Engineering, Beijing Jiaotong University, Beijing 100044, China
2
Beijing Municipal Administration Professional Design Institute Co., Ltd., Beijing 100097, China
*
Authors to whom correspondence should be addressed.
Buildings 2023, 13(9), 2367; https://doi.org/10.3390/buildings13092367
Submission received: 26 August 2023 / Revised: 13 September 2023 / Accepted: 14 September 2023 / Published: 17 September 2023
(This article belongs to the Collection Advanced Concrete Structures in Civil Engineering)

Abstract

:
Accelerated bridge construction (ABC) has attracted much attention in China as a new and efficient construction method. However, the seismic performance of the connections between precast piers and other structures limits the application of ABC in medium and high seismic zones. In this paper, a quasi-static test was conducted to investigate the seismic performance differences between a cap–column socket connection (PSC) specimen, which reinforced an embedded RC column-to-precast cap beam with a socket connection, and a cast-in-place (CIP) cap–column specimen. A fiber-based finite element model that considers bond slippage between the connection reinforcement and wet joint concrete is proposed. The numerical simulation results compared with the experimental results show an error of about 12% in peak bearing capacity and about 2% in initial stiffness. The experimental and numerical results show that the PSC specimen demonstrates comparable seismic performance to the CIP specimen. Experimental results verified that the finite element model in this paper is adequate to predict the seismic responses of a precast column with a reinforcement-embedded socket connection. A reinforcement-embedded RC column-to-precast cap beam with socket connection can be an effective solution for construction in medium and high seismic areas.

1. Introduction

Accelerated bridge construction (ABC), which incorporates innovative connection details and construction technologies, is regarded as the future trend in bridge engineering because it effectively addresses the issue of traffic disruption caused by construction activities on existing roadways while achieving economic, social, and environmental benefits [1].
The commonly used connection methods for prefabricated bridges include post-tensioned tendon connections, grouted duct connections, grouted corrugated pipe connections, and socket connections [2]. Post-tensioned tendon connections are often used in segmented precast piers, which are often connected with unbonded tendons and equipped with energy dissipation devices to enhance the seismic performances of the columns, but columns with this connection method produce large lateral displacements of the superstructure when subjected to large earthquakes, making the original structures difficult to recover [3,4,5]. Grouted duct connections are made by embedding the longitudinal reinforcement in a prefabricated column into the cap beam or footing and then filling the duct with grout. However, the use of grouted duct connections requires a sufficiently long anchorage length and protection of the anchored reinforcement during transportation and installation. Studies have shown that the seismic performances of precast columns with grouted ducts are comparable to those of CIP structures [6,7,8,9,10,11]. In addition, the degree of filling of the grout in the duct is difficult to detect when grouting is complete, which limits the use of grouted duct connections in high seismic areas. Grouted corrugated pipe connections are made by embedding the longitudinal reinforcement in precast columns into cap beams or footings and then filling the corrugated pipe with grout [12,13]. Corrugated pipes can provide efficient restraint, but embedded corrugated pipes may exacerbate reinforcement skeleton congestion, which can negatively impact the response to concrete vibrations. Socket connection is a connection method in which the socket section of a precast bridge pier is inserted into the socket set in the cap beam or foundation and injected with concrete or grout to enhance the connection effect [14,15]. Compared with other connection methods, socket connection offers the advantages of low construction accuracy requirements, a simple construction process, less wet work on site and fast construction speed. When the embedment depth is sufficient, the seismic performances of socketed piers are comparable to those of cast-in-place piers [16,17].
To promote the application of socketed piers in medium and high seismic zones, many studies have been conducted on the seismic performances of socketed piers. Zhang et al. [18] investigated the seismic performances of precast concrete-filled steel tube (CFST) columns with socketed connections to cap beams. Yu et al. [19] studied the seismic performances of post-tensioned concrete-filled steel tube (PCFT) columns. Wang et al. [15] investigated and verified the seismic performances of socketed and slotted connections. Jones et al. [20] evaluated the seismic performances of two types of connections for reinforced concrete two-way rebar hinges. Zhang et al. [21] evaluated the seismic performances of three ultra-high-performance concrete (UHPC)-filled socketed steel concrete (RC) column–foundation connection specimens. Xu et al. [22] assessed the seismic behavior of sleeve piers with different embedment lengths and explored the minimum embedment length for designing pier–pile sleeve connections. Cheng et al. [23] presented structural characteristics and appropriate design recommendations for socketed connections. Zou et al. [24] proposed a precast hollow concrete bridge double-column shallow socketed (PHCBDCSS) connection. Although socketed connections have been proven to be a reasonable connection method for ABCs in seismic zones [25,26], more experimental studies on seismic performances and connection strengthening methods are needed for realizing the engineering applications of socketed connections in high-intensity seismic regions.
In summary, the current research mainly focuses on the reinforcement of socket piers using steel tubes and UHPC; these methods can effectively enhance the seismic performance of socketed piers, but require high construction accuracy and high cost. In this paper, an urban expressway in Beijing with an intensity of eight degrees is used as a background project [27], and a cap–column socket connection (PSC) method with lower construction accuracy requirements and lower cost is proposed. Precast cap–column socket connection (PSC) specimens and cast-in-place (CIP) specimens were designed and fabricated, and the seismic performance difference between the PSC column and CIP column was investigated through quasi-static testing and finite element simulation.

2. Experimental Program

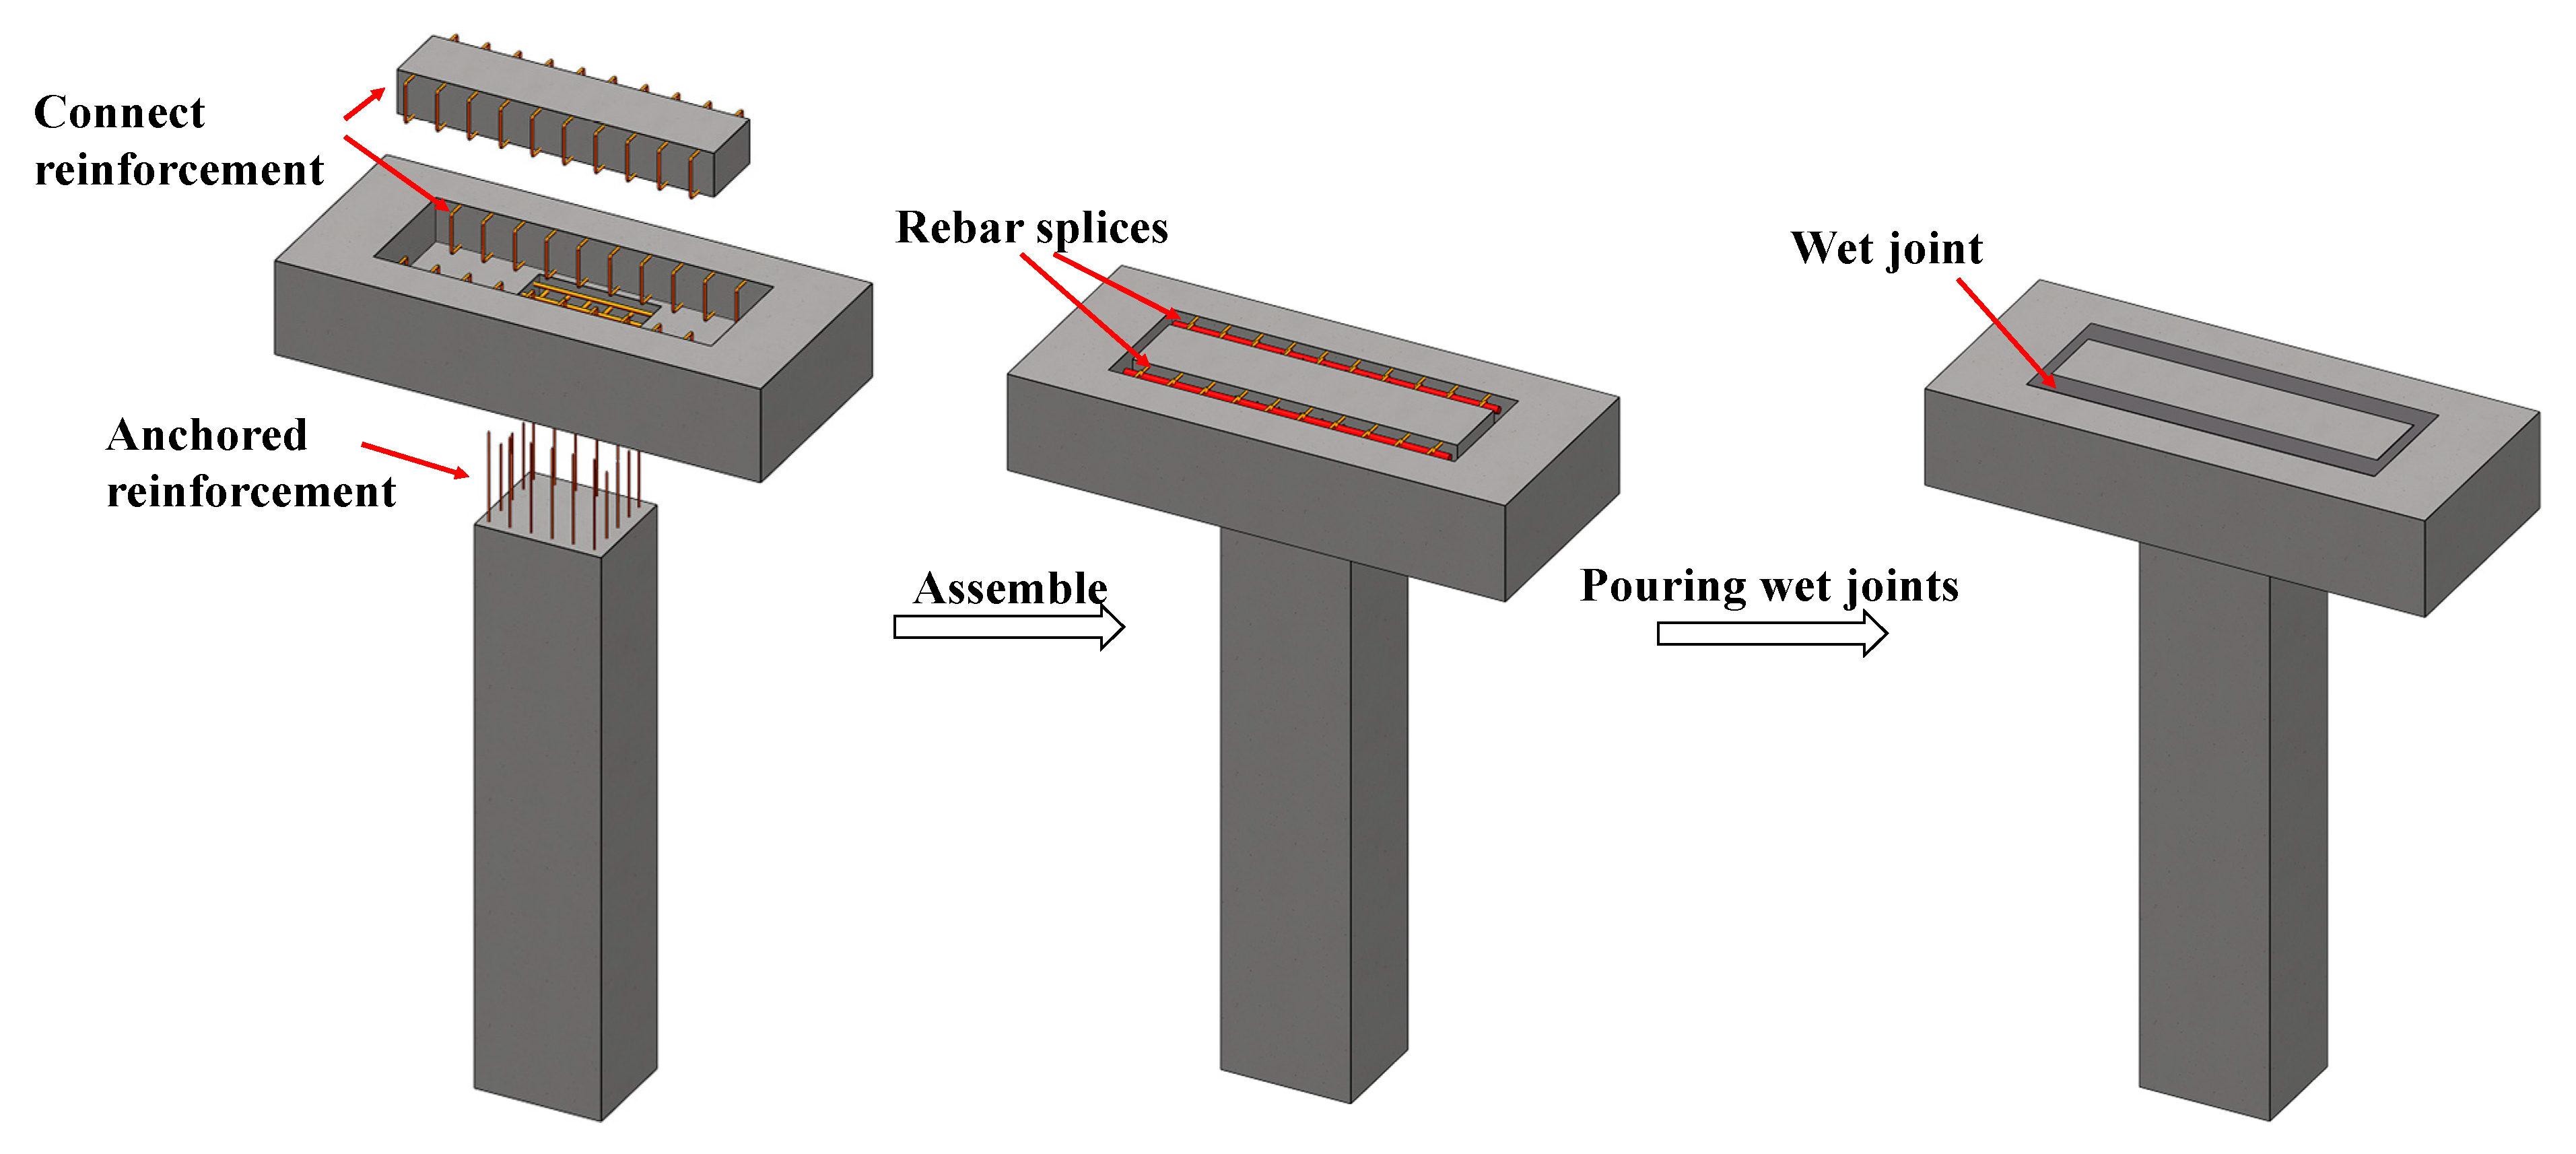
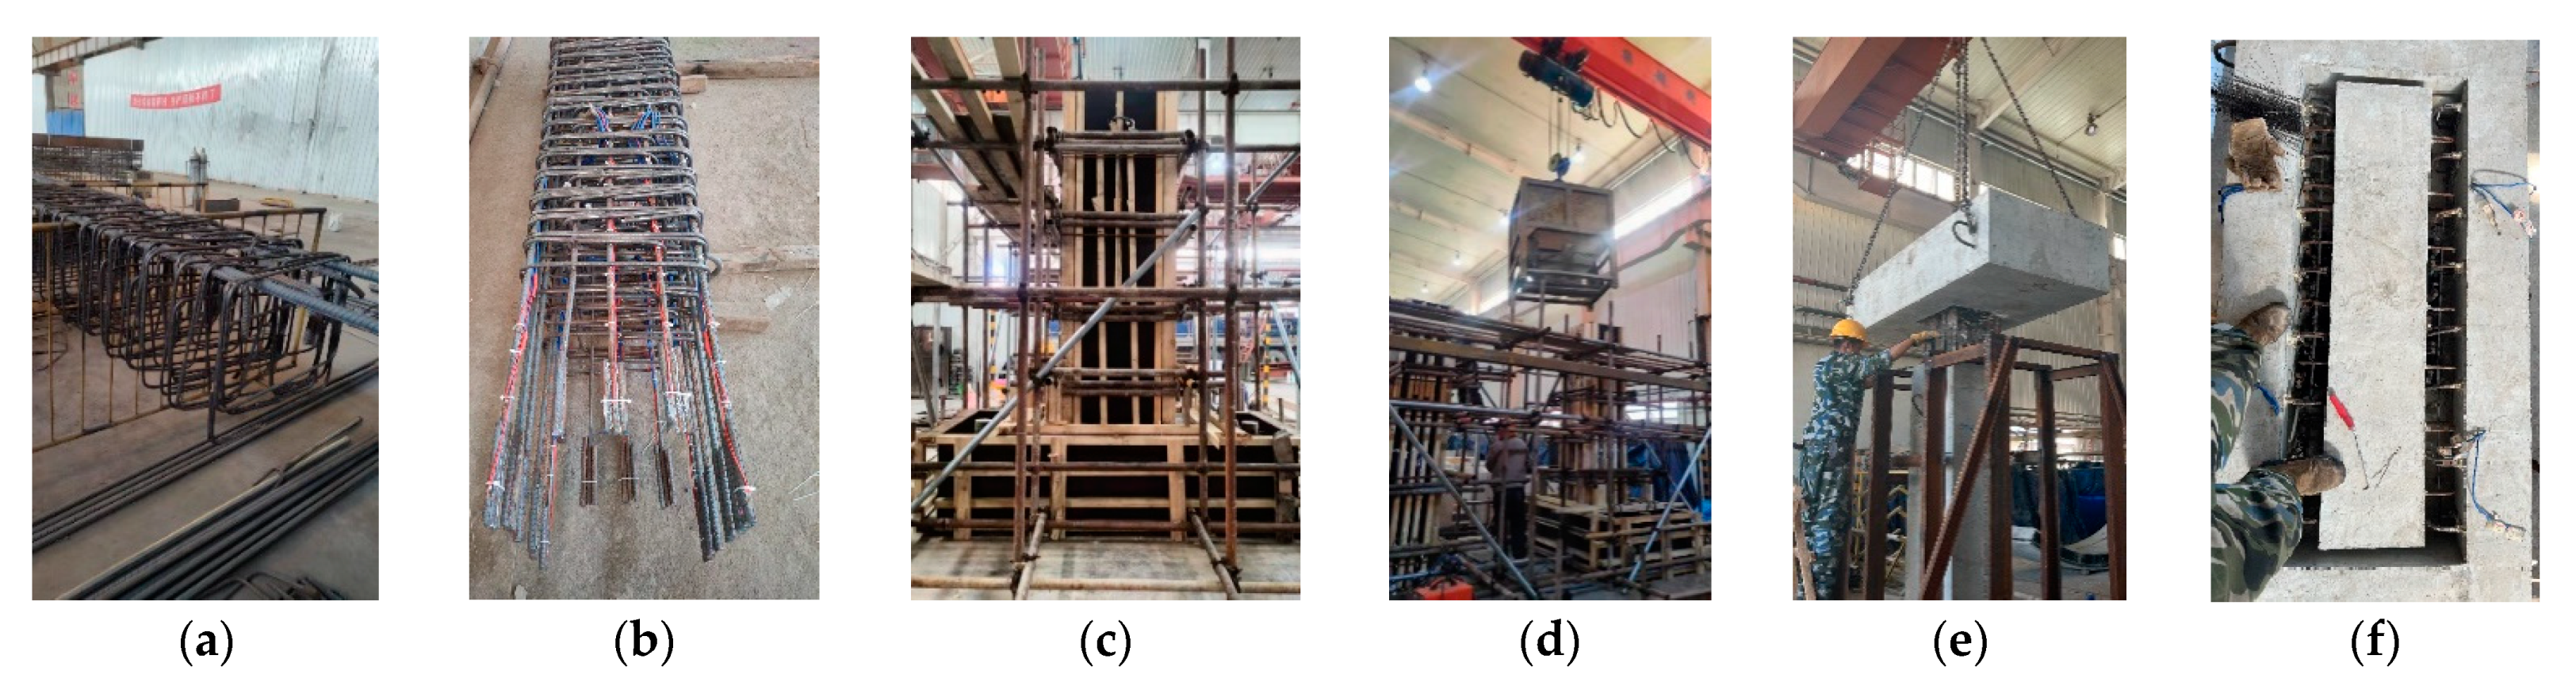
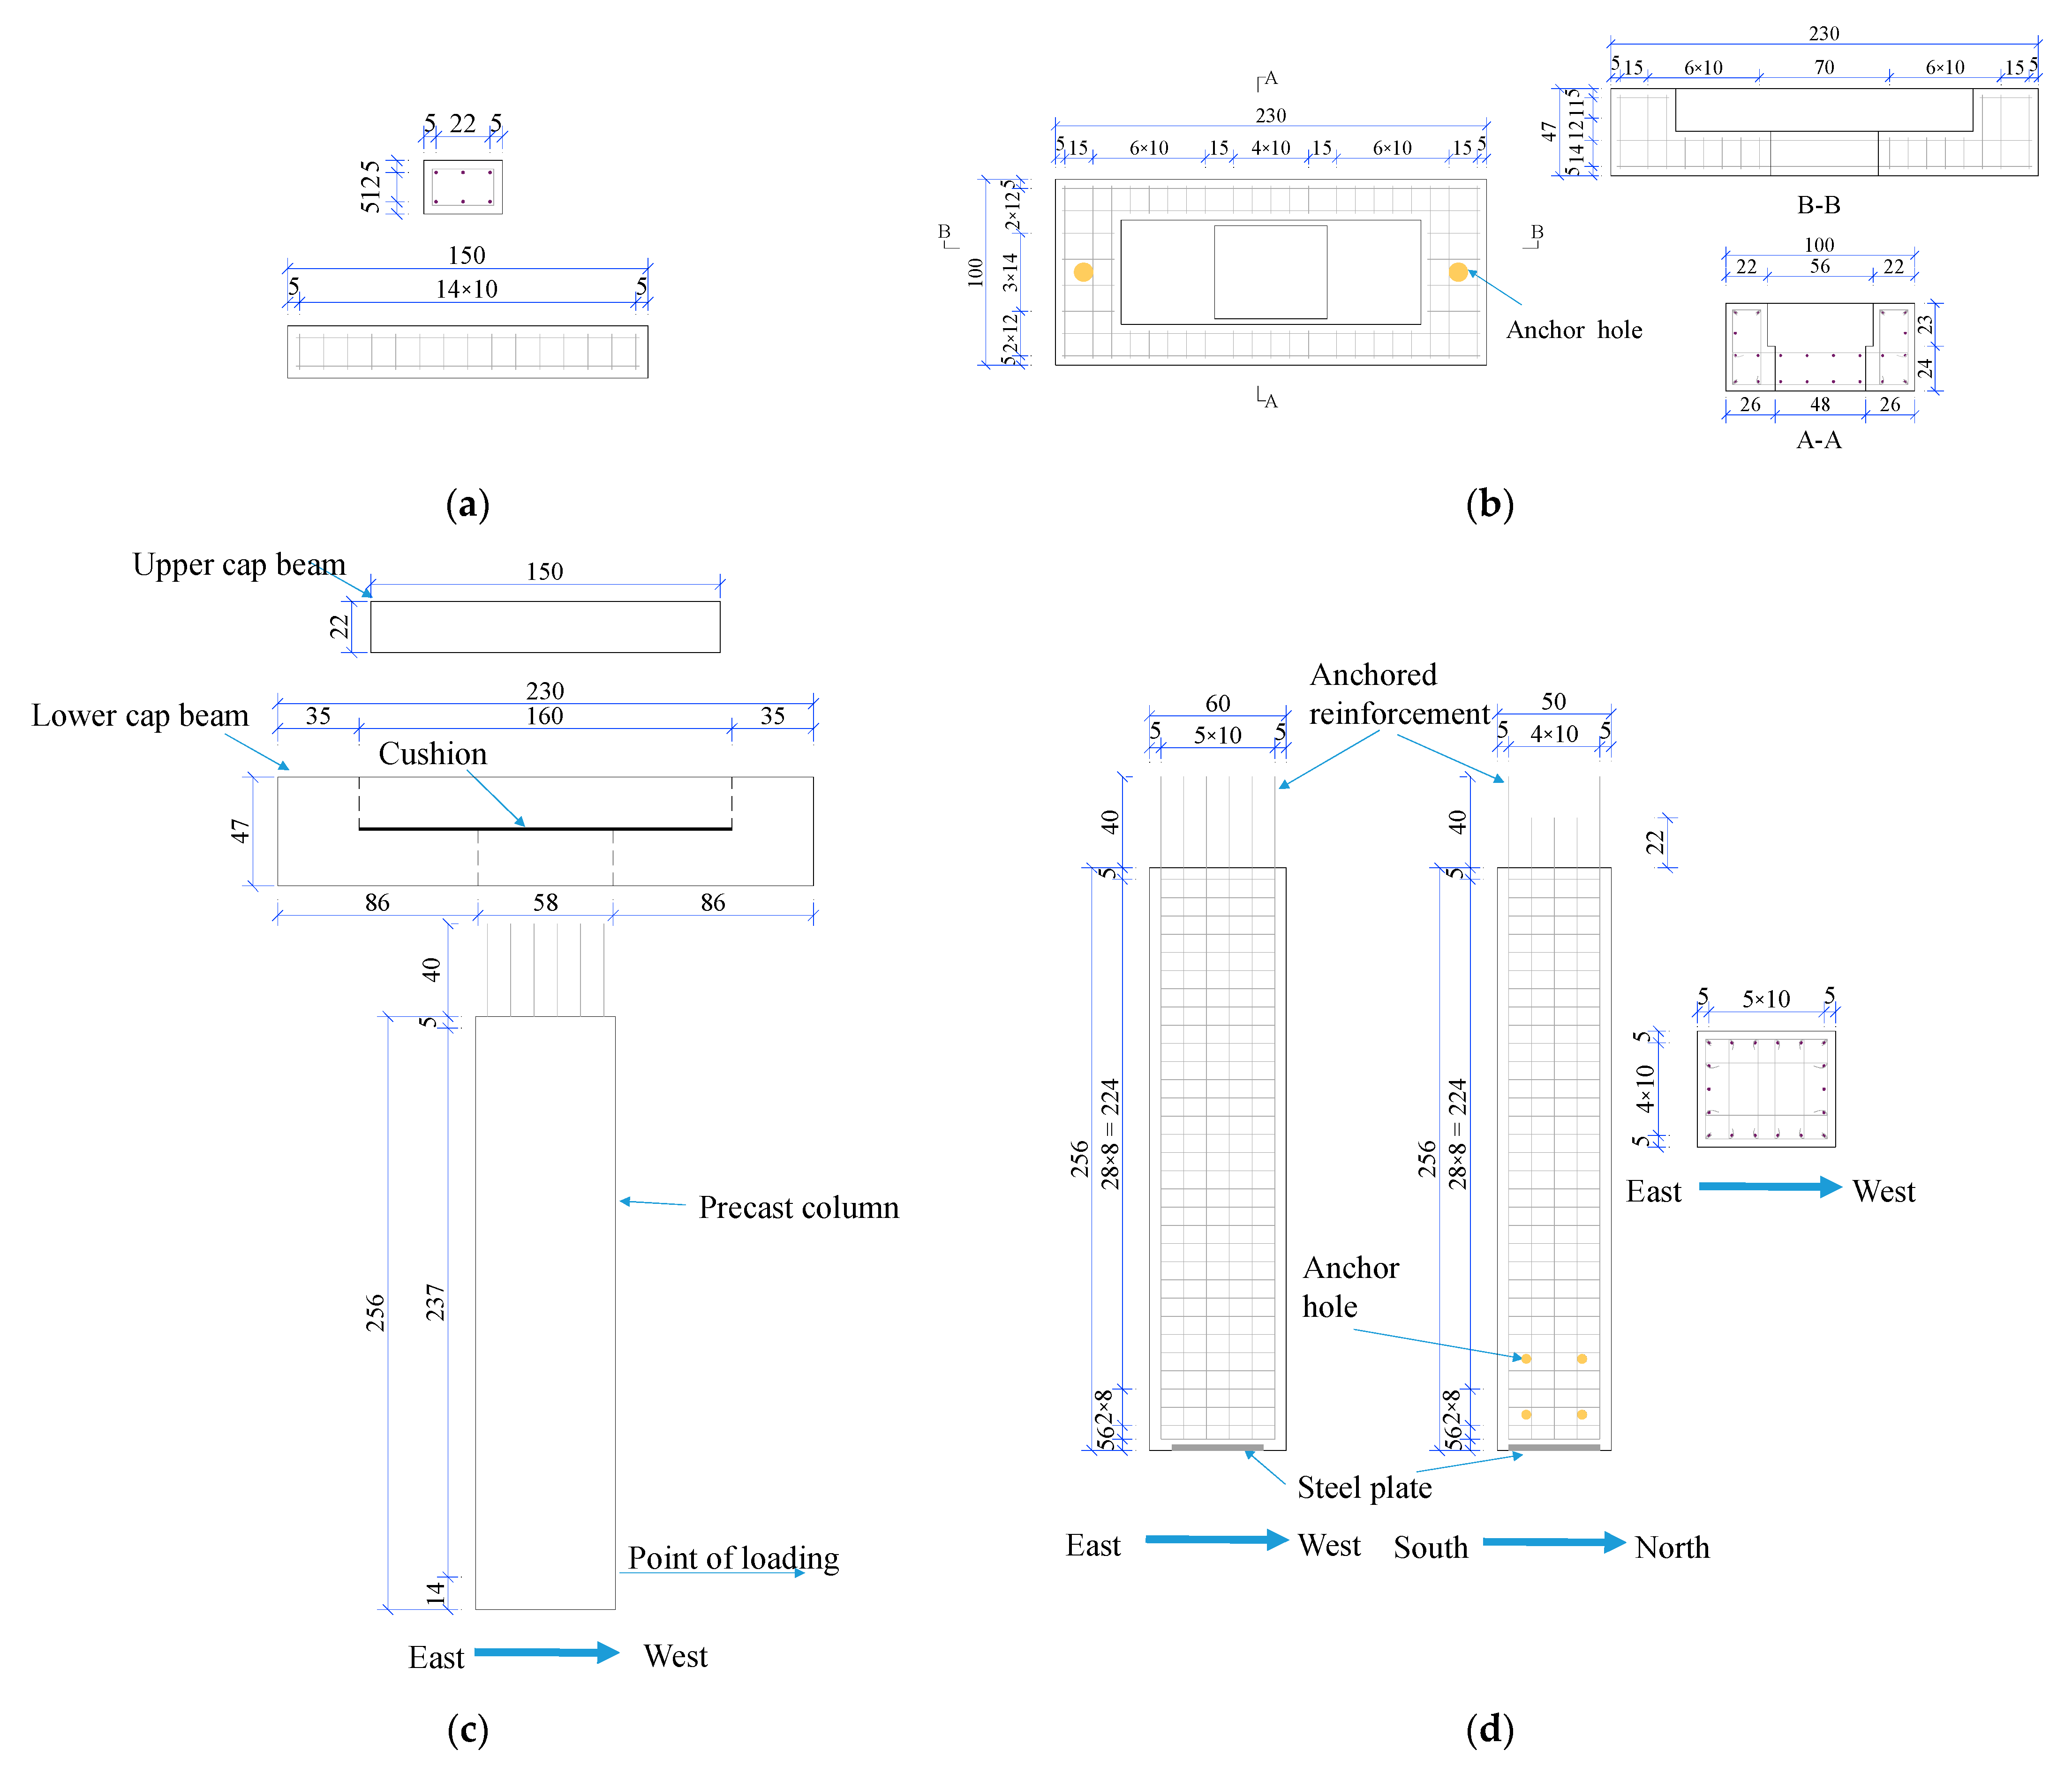
2.1. Description of Specimens

The PSC specimen column height was 256 cm, and its rectangular cross-sectional dimensions were 60 cm × 50 cm, with extended reinforcement on the top of the column. The precast upper cap beams were 22 cm in height and had rectangular cross-sectional dimensions of 150 cm × 32 cm. The precast lower cap beams were 47 cm in height and had rectangular cross-sectional dimensions of 58 cm × 100 cm. The cast-in-place (CIP) cap–column specimen had the same size as the socket precast cap–column connection specimen after assembly. The bottom of the column was precast with steel plates and horizontal anchor holes were reserved for connection with the actuator. Two anchor holes were also reserved on the cap beam to connect the specimens to the floor. The construction process for the PSC specimen is shown in Figure 1 and Figure 2.
The longitudinal reinforcements of the columns for both specimens were eighteen 16 mm diameter reinforcements with a spacing of 100 mm. The stirrups of the columns for both specimens were 10 mm diameter reinforcements, which were spaced at 80 mm. The precast cap–column socket connection specimen size and reinforcement arrangement are shown in Figure 3. Table 1 shows the details of the test cap–column specimens. In addition, in order to ensure that the connection between the abutment and the cover girder had sufficient anchorage length, the anchored reinforcements were stick-welded to increase their contact area with the concrete, as shown in Figure 2b.

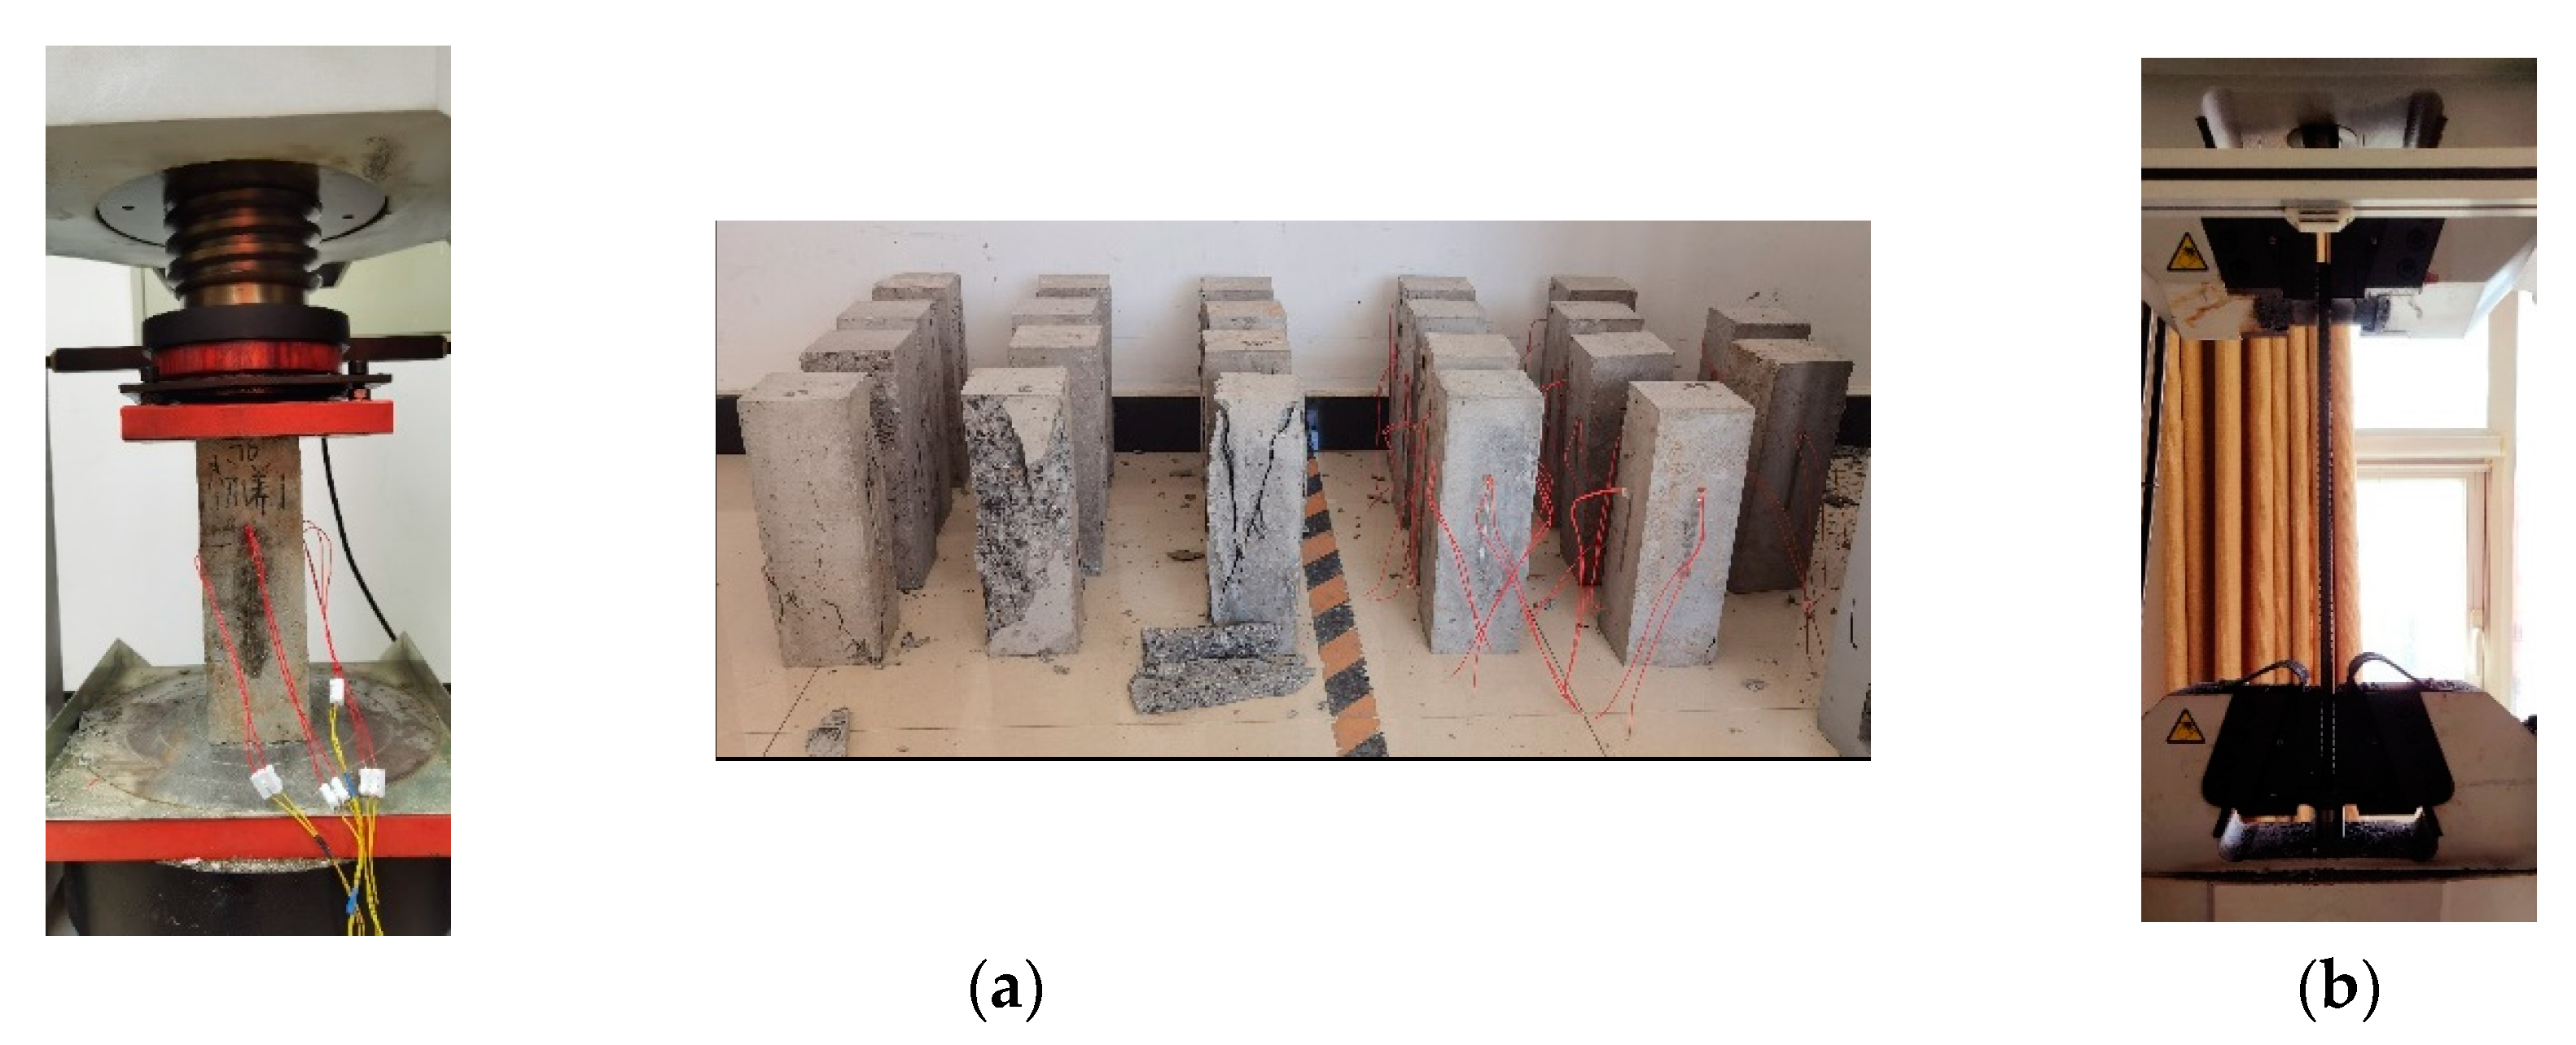
2.2. Material Properties

The same rebars were used for material property tests when the reinforcement cages were fabricated. The reinforcement testing method followed that of ASTM code A370 [28]. The material properties of the reinforcement are shown in Table 2. The specimens and wet joints were cast with C40 concrete; the concrete mix is shown in Table 3 [29]. Twelve prisms of 150 mm × 150 mm × 300 mm and twelve 100 mm cubes were reserved and maintained until the test day for the material property tests [30], and the material test setup is shown in Figure 4. The material properties of the concrete are shown in Table 4.

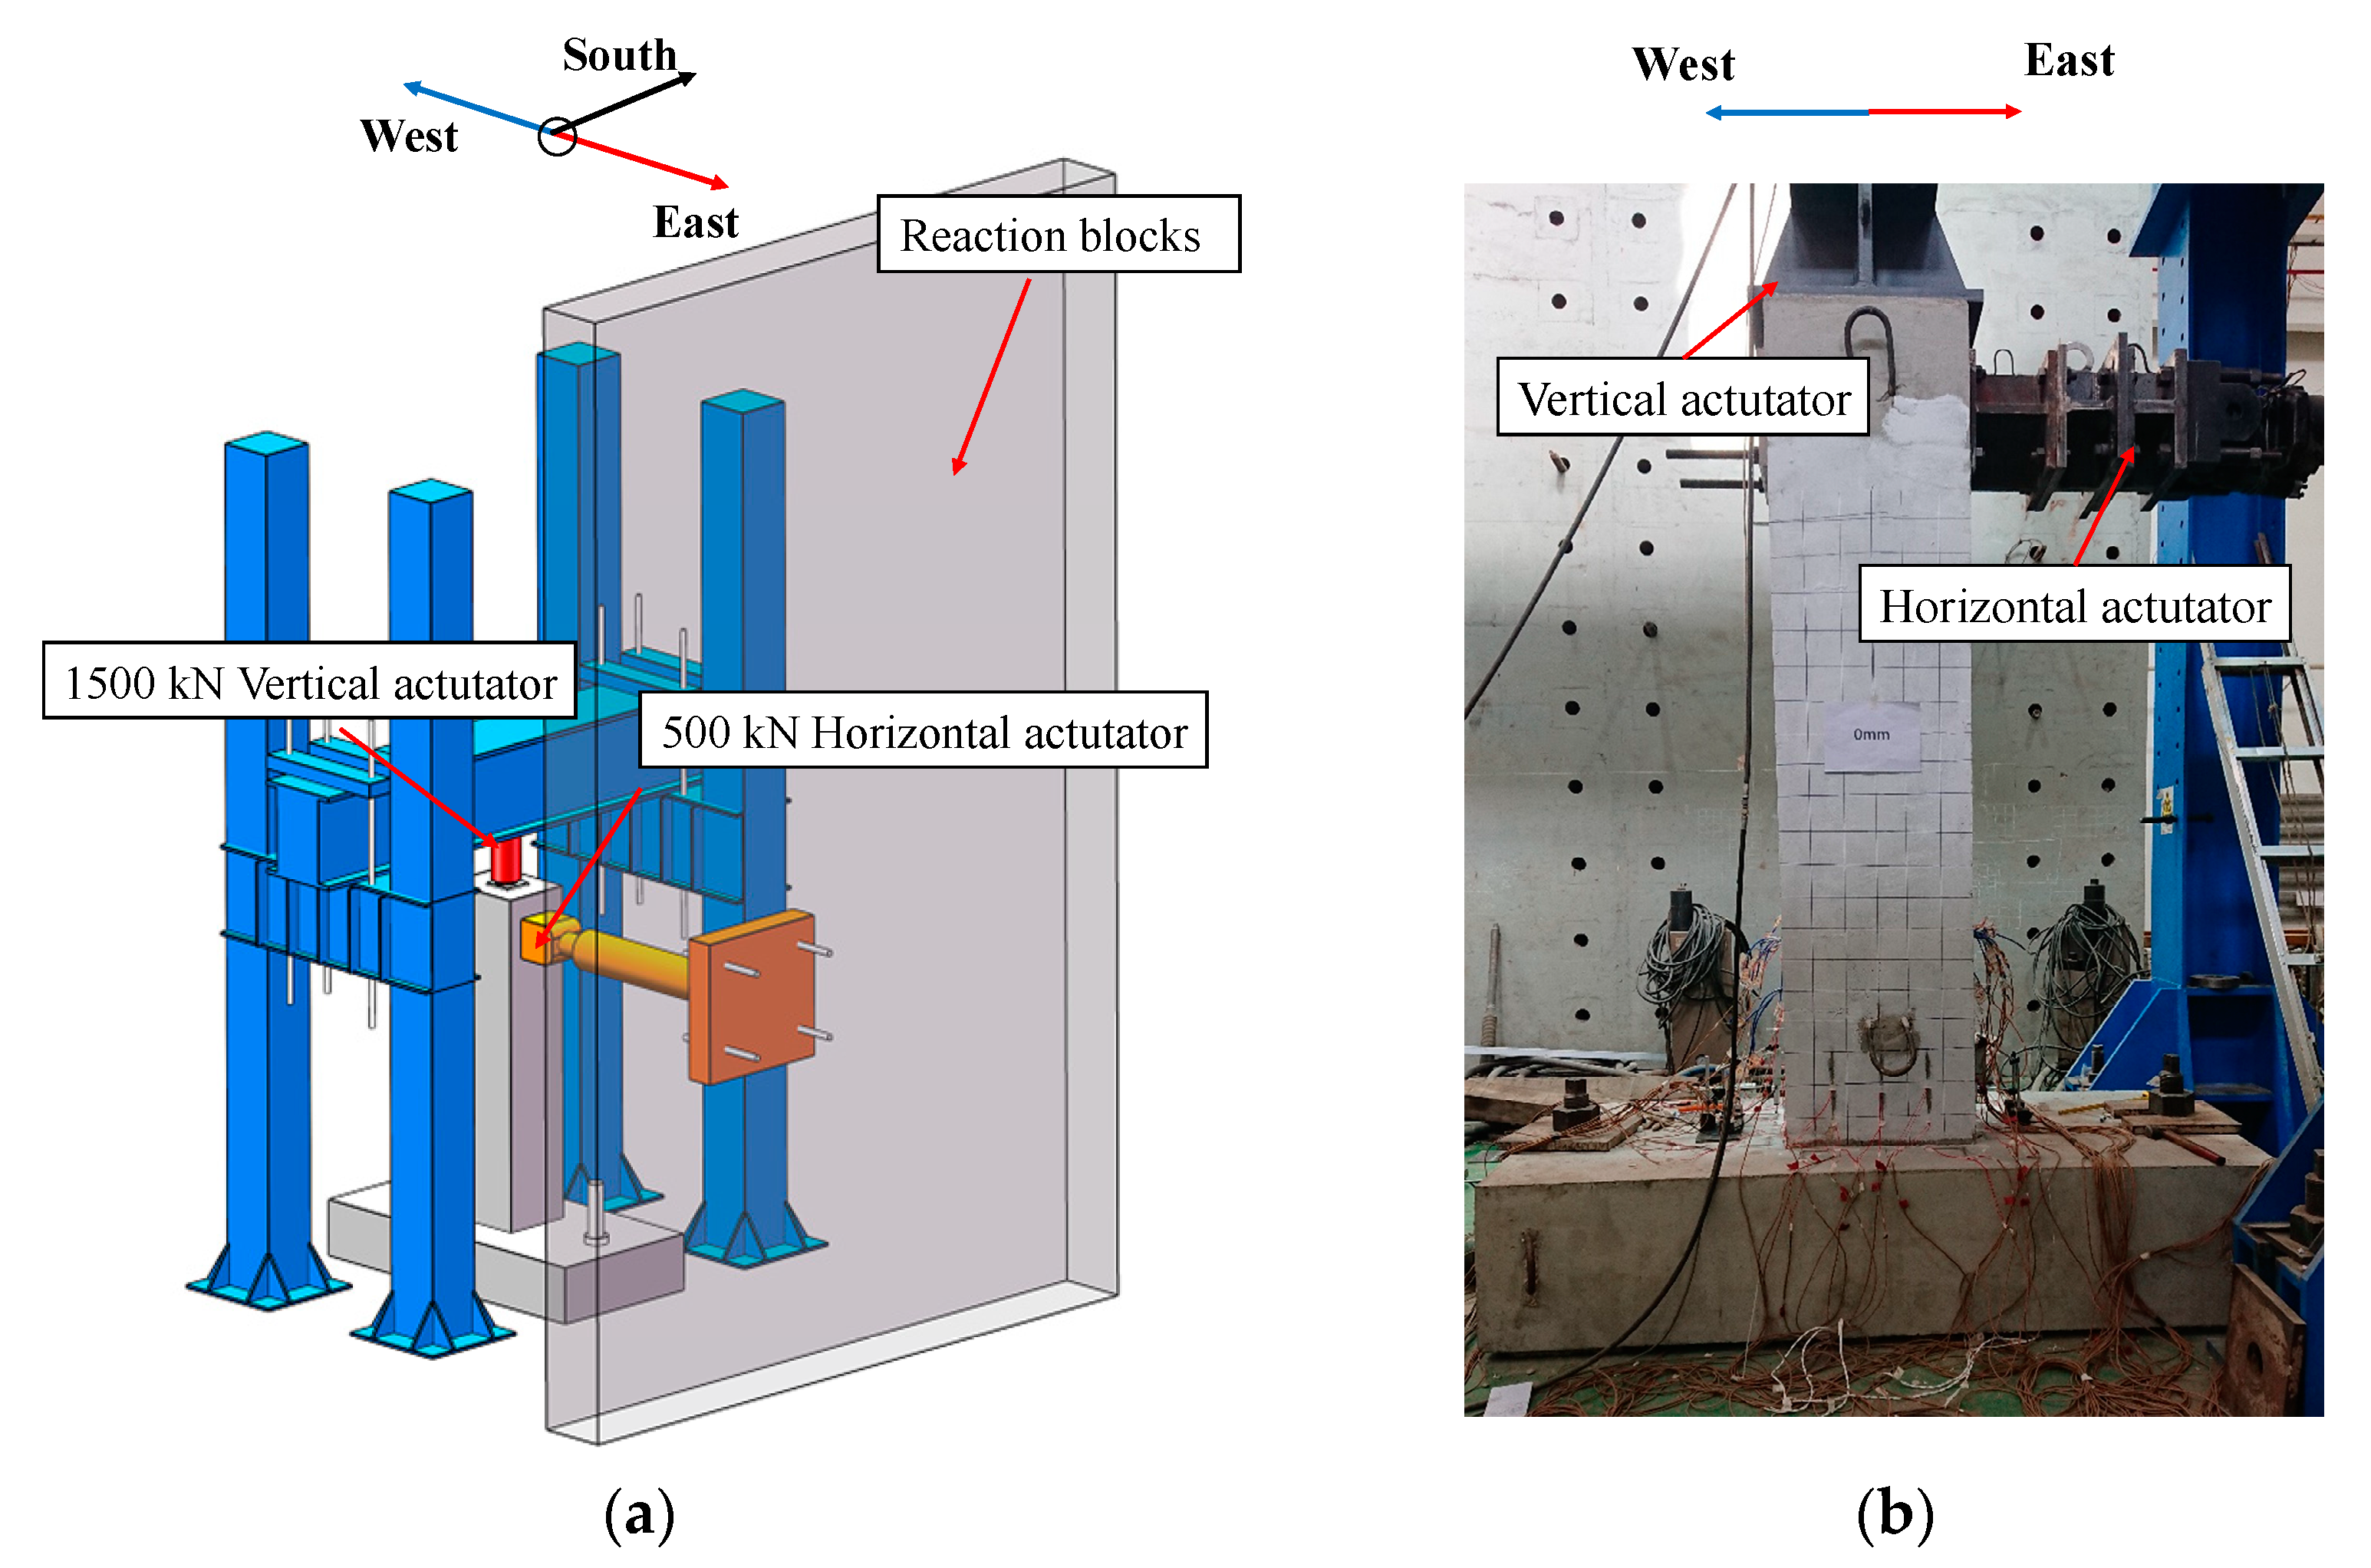
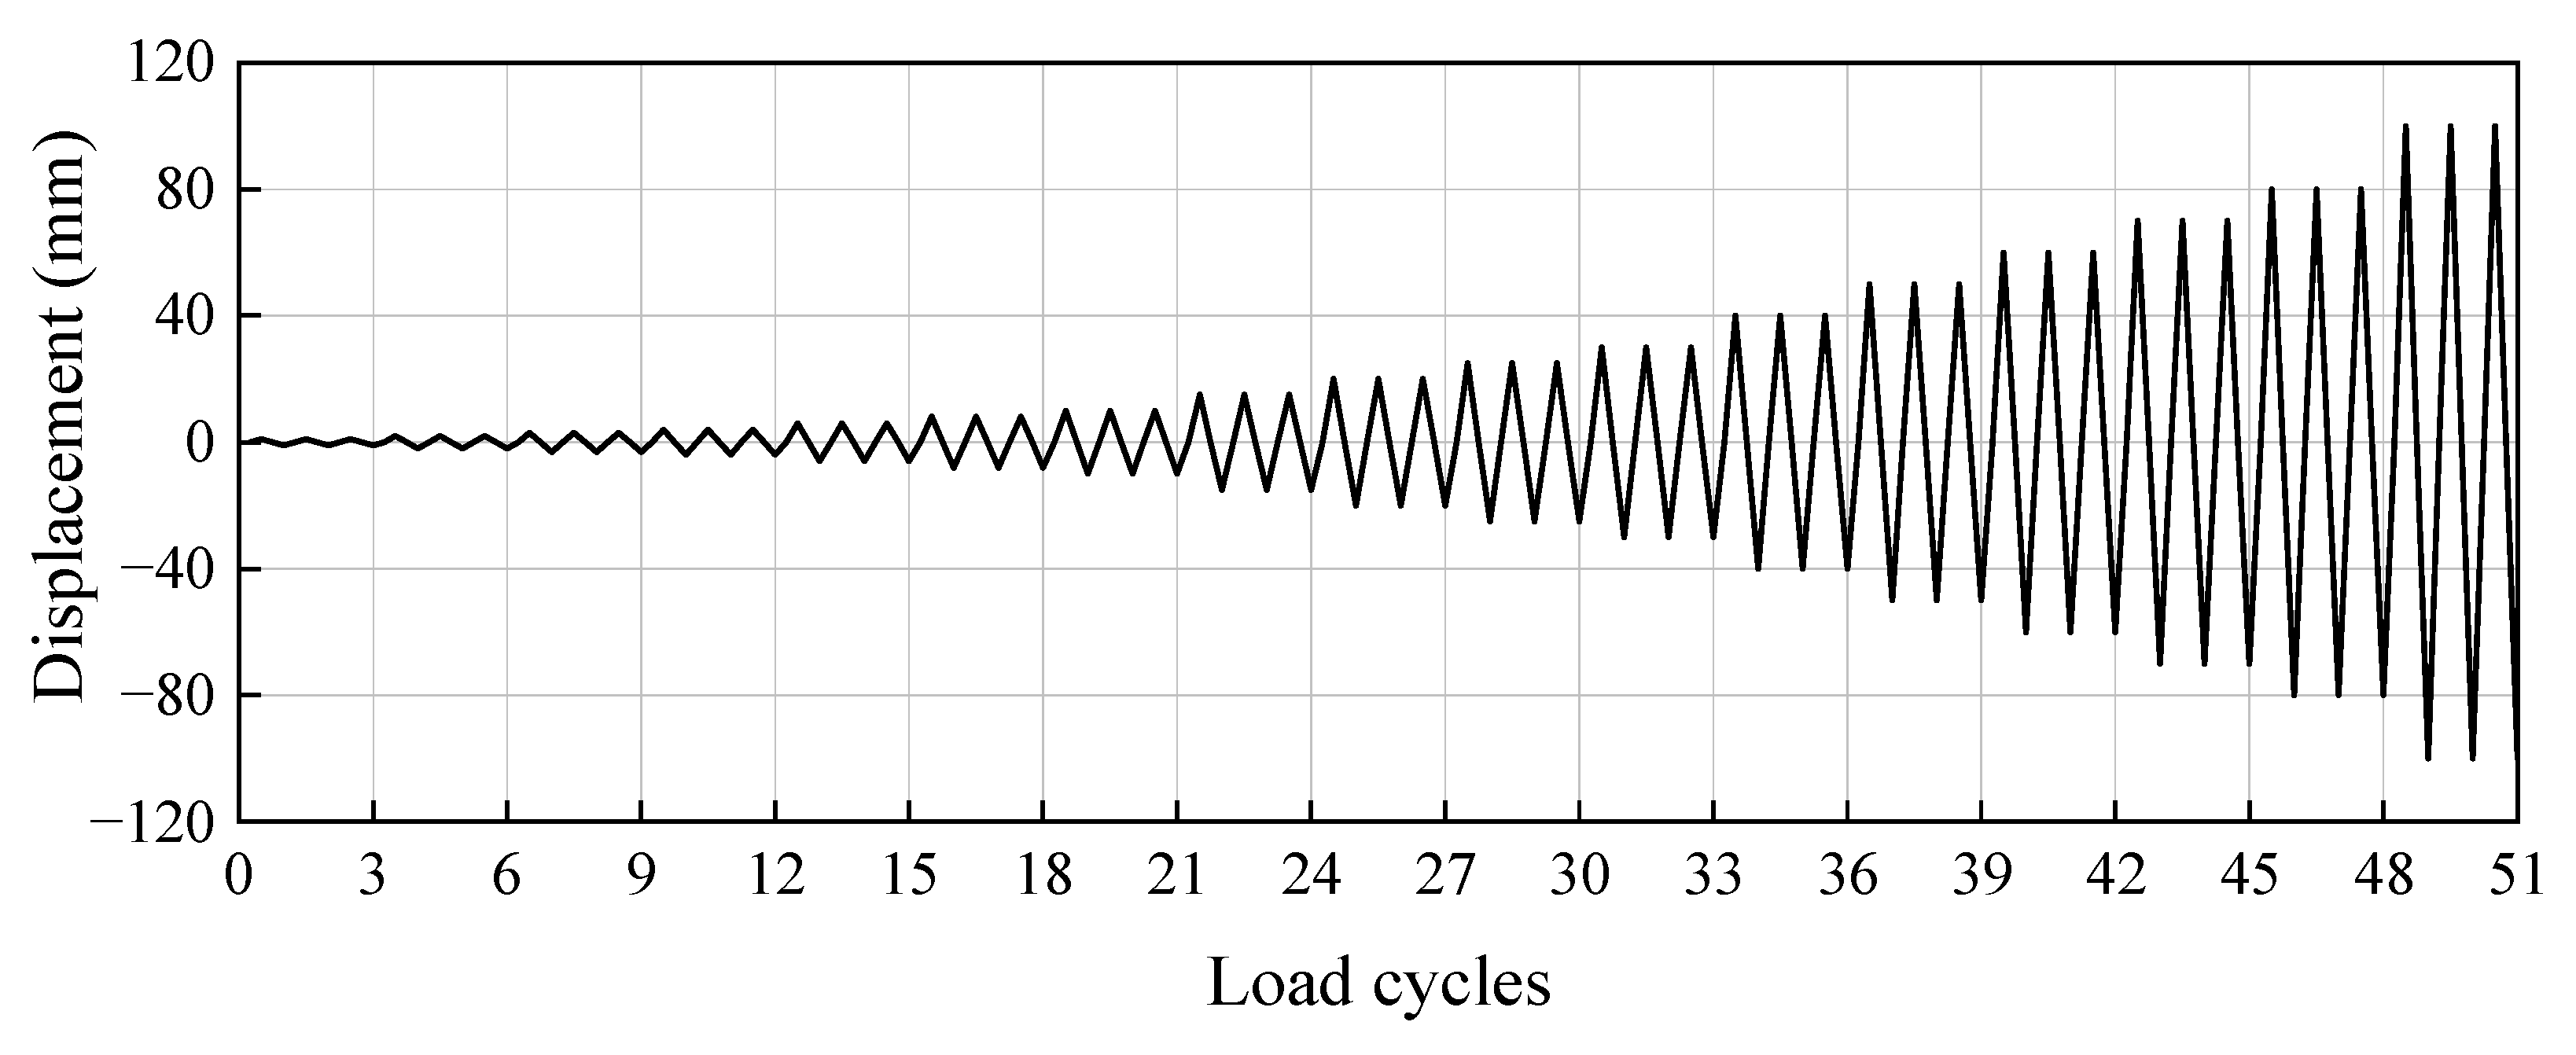
2.3. Test Setup and Loading Protocol

The focus of this test was to assess the reliability of the column–cap beam joint, so the test was conducted on specimens inverted such that the joint was subjected to the most unfavorable bending moment [18]. The test setup is shown in Figure 5. The cap beam was anchored to the floor using anchor rods. The column was subjected to a lateral reciprocal cyclic load and a constant axial load. The vertical load simulated the self-weight of the superstructure borne by the cap beam, which was calculated based on the principle of similarity to obtain a vertical load of 1170 kN. Lateral reciprocating loads of the column were applied by the horizontal actuators, and continuous loads of 1170 kN were applied by the vertical actuators. The lateral cycle loading process for the specimen was controlled by displacement, and each loading level was cycled three times, as shown in Figure 6.
To accurately capture the generation and development of the plastic hinge of each specimen, strain gauges were placed on the longitudinal rebar of the column at five levels [31], as shown in Figure 7. In the precast cap–column socket connection specimen, moreover, additional strain gauges were arranged on the anchorage reinforcement of the precast column and on the horizontal and vertical reinforcements of the precast cap beam to monitor the changes in strain of the socket connection.

3. Interpretation of the Test Results

3.1. Test Observations and Hysteretic Performances

The damage process, crack distribution and final damage state of the CIP and PSC specimens are shown in Figure 8, Figure 9 and Figure 10.
For the CIP specimen, the first horizontal crack appeared at a height of 50–100 mm above the interface between the column and the cap beam when loaded to 2 mm, and the maximum crack width was 0.01 mm. When the displacement level reached 10 mm, the crack penetrated through the section, and the maximum crack width reached 0.3 mm. When the specimens were loaded to a displacement level of 20 mm for the first cycle, the strain gauges located on the top of the column monitored the yielding of the longitudinal reinforcement. When the displacement level reached 40 mm, the concrete in the corner started to spall. When the displacement level reached 50 mm, the concrete in the pressurized area spalled across a large area. When the displacement level reached 70 mm, the stirrups were exposed. When the displacement level reached 80 mm, the stirrups and longitudinal rebar flexed, the core area of concrete spalling and the specimen bearing capacity were significantly reduced, and the test was then concluded. The damage process of the specimen during the test is shown in Figure 8a, and the crack distribution and failure state are shown in Figure 9a and Figure 10a, respectively.
For the PSC specimen, the first horizontal crack appeared at a height of 80–120 mm above the interface between the column and the cap beam when loaded to 2 mm, and the maximum crack width was 0.01 mm. When the displacement level reached 15 mm, the crack penetrated through the section, and the maximum crack width was 0.5 mm. When the specimens were loaded to a displacement level of 20 mm for the first cycle, the strain gauges located on the top of the column monitored the yielding of the longitudinal reinforcement. When the displacement level reached 25 mm, an oblique crack appeared at the corner of the column bottom. When the displacement level reached 60 mm, the corner concrete spalled. When the displacement level reached 70 mm, the stirrup and longitudinal reinforcements were exposed, and part of the concrete spalled from the surface of the cap beam at the joint. When the displacement level reached 100 mm, the longitudinal reinforcement on the bottom of the column was exposed and flexed obviously, the core area of concrete spalling and specimen bearing capacity were significantly reduced, and the test was concluded. The damage process of the specimen during the test is shown in Figure 8b, and the crack distribution and failure state are shown in Figure 9b and Figure 10b, respectively.
The damage process of the PSC specimen was similar to that of the CIP specimen, although the PSC specimen was locally crushed in its wet joints during the loading process, which had less effect on its load carrying capacity.
The mechanical hysteresis curves are shown in Figure 11. These curves are divided into five key stages: (1) column cracking, (2) rebar yielding, (3) concrete spalling, (4) stirrup exposure, and (5) rebar local buckling. As shown in Figure 9, the hysteretic behaviors of the CIP and PSC specimens were similar. When the lateral displacement was larger, the hysteresis loop pinching effect in the PSC specimen was more obvious than that in the CIP specimen, and there was no clear extension of reinforcement slippage at the interface between the cap beam and the column of the PSC specimen.

3.2. Load—Displacement Relationships, Strength, Stiffness and Ductility

The backbone curves are shown in Figure 12, which shows that each specimen was trilinear with an elastic section, a yielding section and a falling section. Among these sections, the peak lateral load Fp of the CIP specimen was 366.5 kN, and the corresponding peak lateral displacement Δp was 40 mm. The peak lateral load Fp of the PSC specimen was 354.78 kN, and the corresponding peak lateral displacement Δp was 40 mm. The initial stiffness E0 is defined as the average stiffness corresponding to the strength range between 40% Fp and 70% Fp. The initial stiffnesses E0 were 25.37 kN/mm and 21.76 kN/mm for the CIP and PSC specimens, respectively. The ratio of the stiffness K0 to the initial stiffness Ki is shown in Figure 13.
The Fp values of the PSC specimen and CIP specimen were similar, and the stiffness degradation patterns were the same, but the initial stiffness of the PSC specimen was smaller than that of the CIP specimen. The results show that the cap–column socket connection method was reliable, but the construction quality of the wet joint could affect its initial stiffness.
Ductility performance is an important seismic performance index. The greater the ductility, the better the deformation capacity and energy dissipation performance of the structure [32,33]. The R. Park [34] method is used to calculate the yield point, over 0.75 times the peak bearing capacity of the point to form a y-axis vertical line, based on where the curve would intersect with point A. Then, over points O and A for a straight line and over the curve peak point C(Δp, Fp), a horizontal line intersects at point B. Then, an x-axis vertical line is made through point B, and the intersection of the line and the curve is the yield point D(Δy, Fy), and its displacement and load are the yield displacement and yield load, which are determined using the R. Park method, as shown in Figure 14. The ultimate point is defined as the lateral force on the backbone curves dropping to 85% of the peak force. The calculated yield force, yield displacement, ultimate load, ultimate displacement and ductility coefficient are shown in Table 5. The displacement ductility coefficient is the ratio of the ultimate displacement Δu to the yield displacement Δy. The calculated results reveal that PSC specimen ductility was lower than that of the CIP specimens, with the ductility factors of 3.04 and 3.63, respectively.
The ductility of the PSC specimen was significantly lower than that of the CIP specimen, which is due to the fact that the yield load Fy values of the PSC and CIP specimens were similar, but the initial stiffness of the PSC specimen was lower, which led to a larger yield displacement Δy, which in turn resulted in a smaller ductility coefficient.

3.3. Energy Dissipation

Structural energy dissipation is a key factor in resisting earthquakes. Therefore, ensuring structural non-collapse is of significant importance [35]. The energy dissipation in each cycle at each displacement location is defined by the area enclosed by the hysteresis loop. All calculation results are presented in Figure 15. Before the displacement level reached 30 mm, the cumulative hysteresis loop areas of the CIP and PSC specimens were basically equal. When the displacement level reached 40 mm, the CIP and PSC specimens both reached peak loads, but the hysteresis curve pinching phenomenon in the PSC specimen was more distinct, and its cumulative hysteresis loop area was smaller than that in the CIP specimen. When the displacement level reached 80–100 mm, because the load capacity of the CIP casting specimen decreased faster, its cumulative hysteresis loop area was smaller than that of the PSC specimen.
In addition, the equivalent viscous damping ratio ξhys can also be used to assess hysteretic energy dissipation in a RC structure. The calculated equivalent viscous damping ratios ξhys of the specimens are shown in Figure 16. The equivalent viscous damping ratio ξhys was calculated using Equation (1) [36]:
ξ h y s = 1 2 π E h y s E e l s
where Ehys is the total energy dissipated in the complete hysteresis cycle and Eels is the maximum elastic strain energy during the hysteresis cycle.
The calculated equivalent viscous damping ratio ξhys values of the specimens are shown in Figure 16. Before the displacement level reached 30 mm, the equivalent viscous damping coefficient curves of both specimens essentially overlapped and demonstrated values less than 0.075. The equivalent viscous damping coefficient of the PSC specimen was lower than that of the CIP specimen when loading continued because the hysteresis curve of the PSC specimen was less full, resulting in the ratio of total energy dissipated in the complete hysteresis cycle to maximum elastic strain energy in the hysteresis cycle being less than that of the CIP specimen. When loaded to 100 mm, the equivalent viscous damping coefficients of the cast-in-place specimens and the slot-connected specimens reached maximum values of 0.272 and 0.248, respectively.
In summary, the energy dissipation capacity of the PSC specimen was not much different from that of the CIP specimen, but the viscous damping ratio ξhys was lower, which indicates that the pinching of the hysteresis curve significantly affected the equivalent viscous damping ratio ξhys of the specimen.

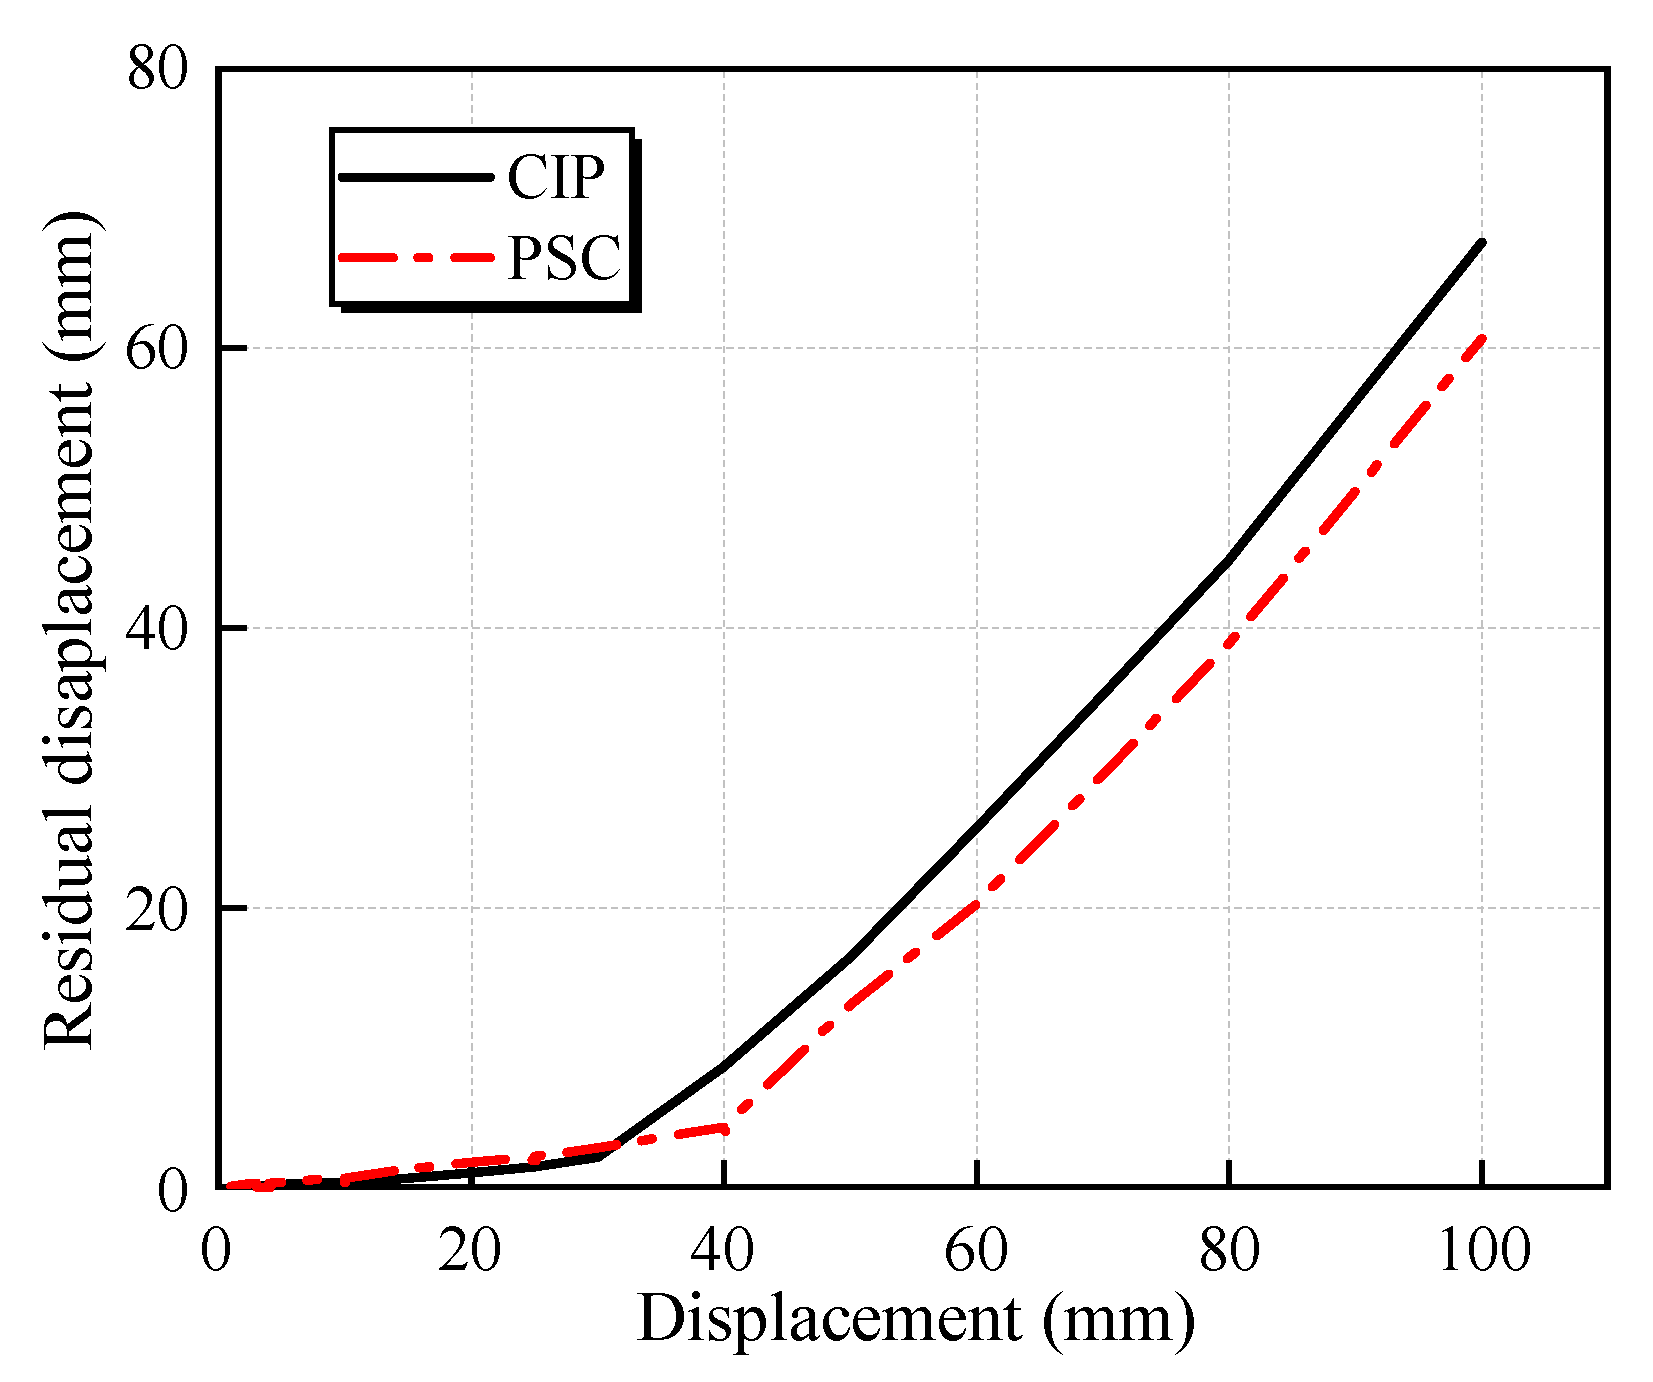
3.4. Residual Displacement

When subjected to severe earthquakes, an RC column may undergo irreversible plastic displacement, which is called residual displacement. To ensure normal use of the bridge after the earthquake, it is necessary to control the residual displacement of the bridge pier within a range that does not affect the operation capacity. In this paper, the residual displacement is calculated using Equation (2):
Δ r = Δ r + + Δ r _ 2
where Δ r + is the residual displacement at positive loading, and Δ r _ is the residual displacement at negative loading.
The residual displacement curves of each specimen are shown in Figure 17, which shows that the residual displacement curves of the CIP and PSC specimens basically coincided and tended to be close to 0 before the displacement level reached 30 mm. Continuing to load, the residual displacement of the PSC specimen under each loading level is smaller than that of the CIP specimen. When the loading displacement was greater than 30 mm, the residual displacement of the PSC specimen was smaller than that of the CIP specimen, which is also due to the more obvious pinching of the hysteresis curve in the PSC specimen.

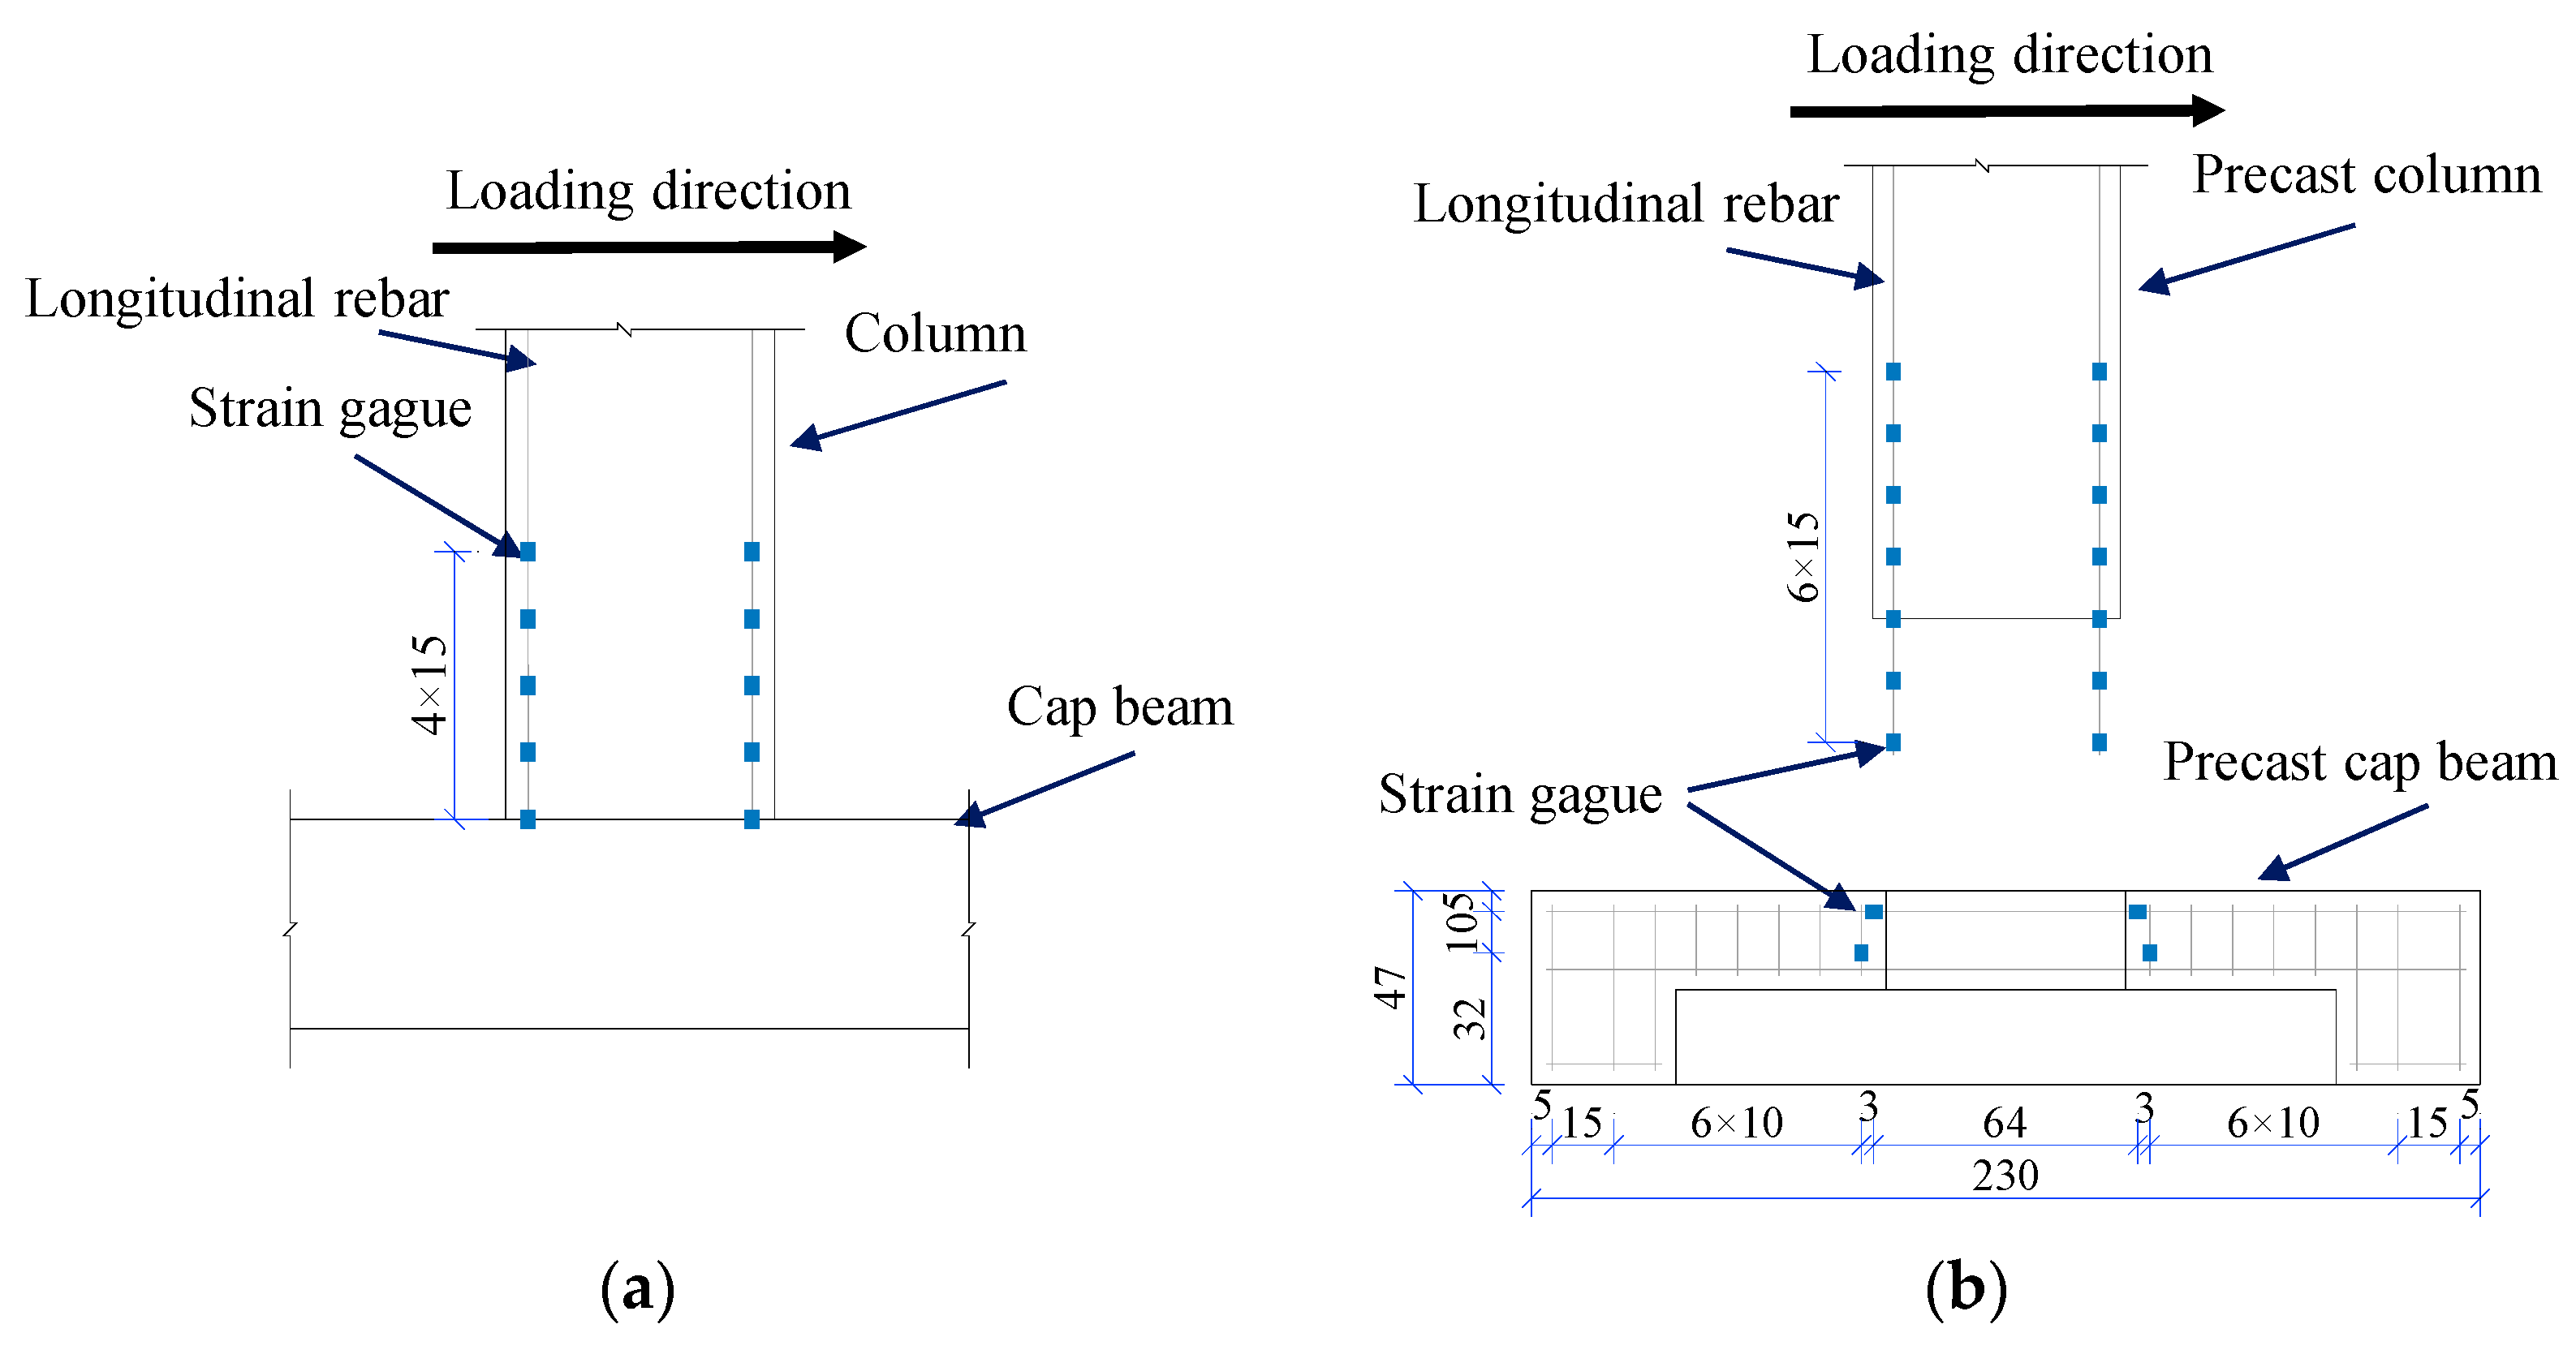
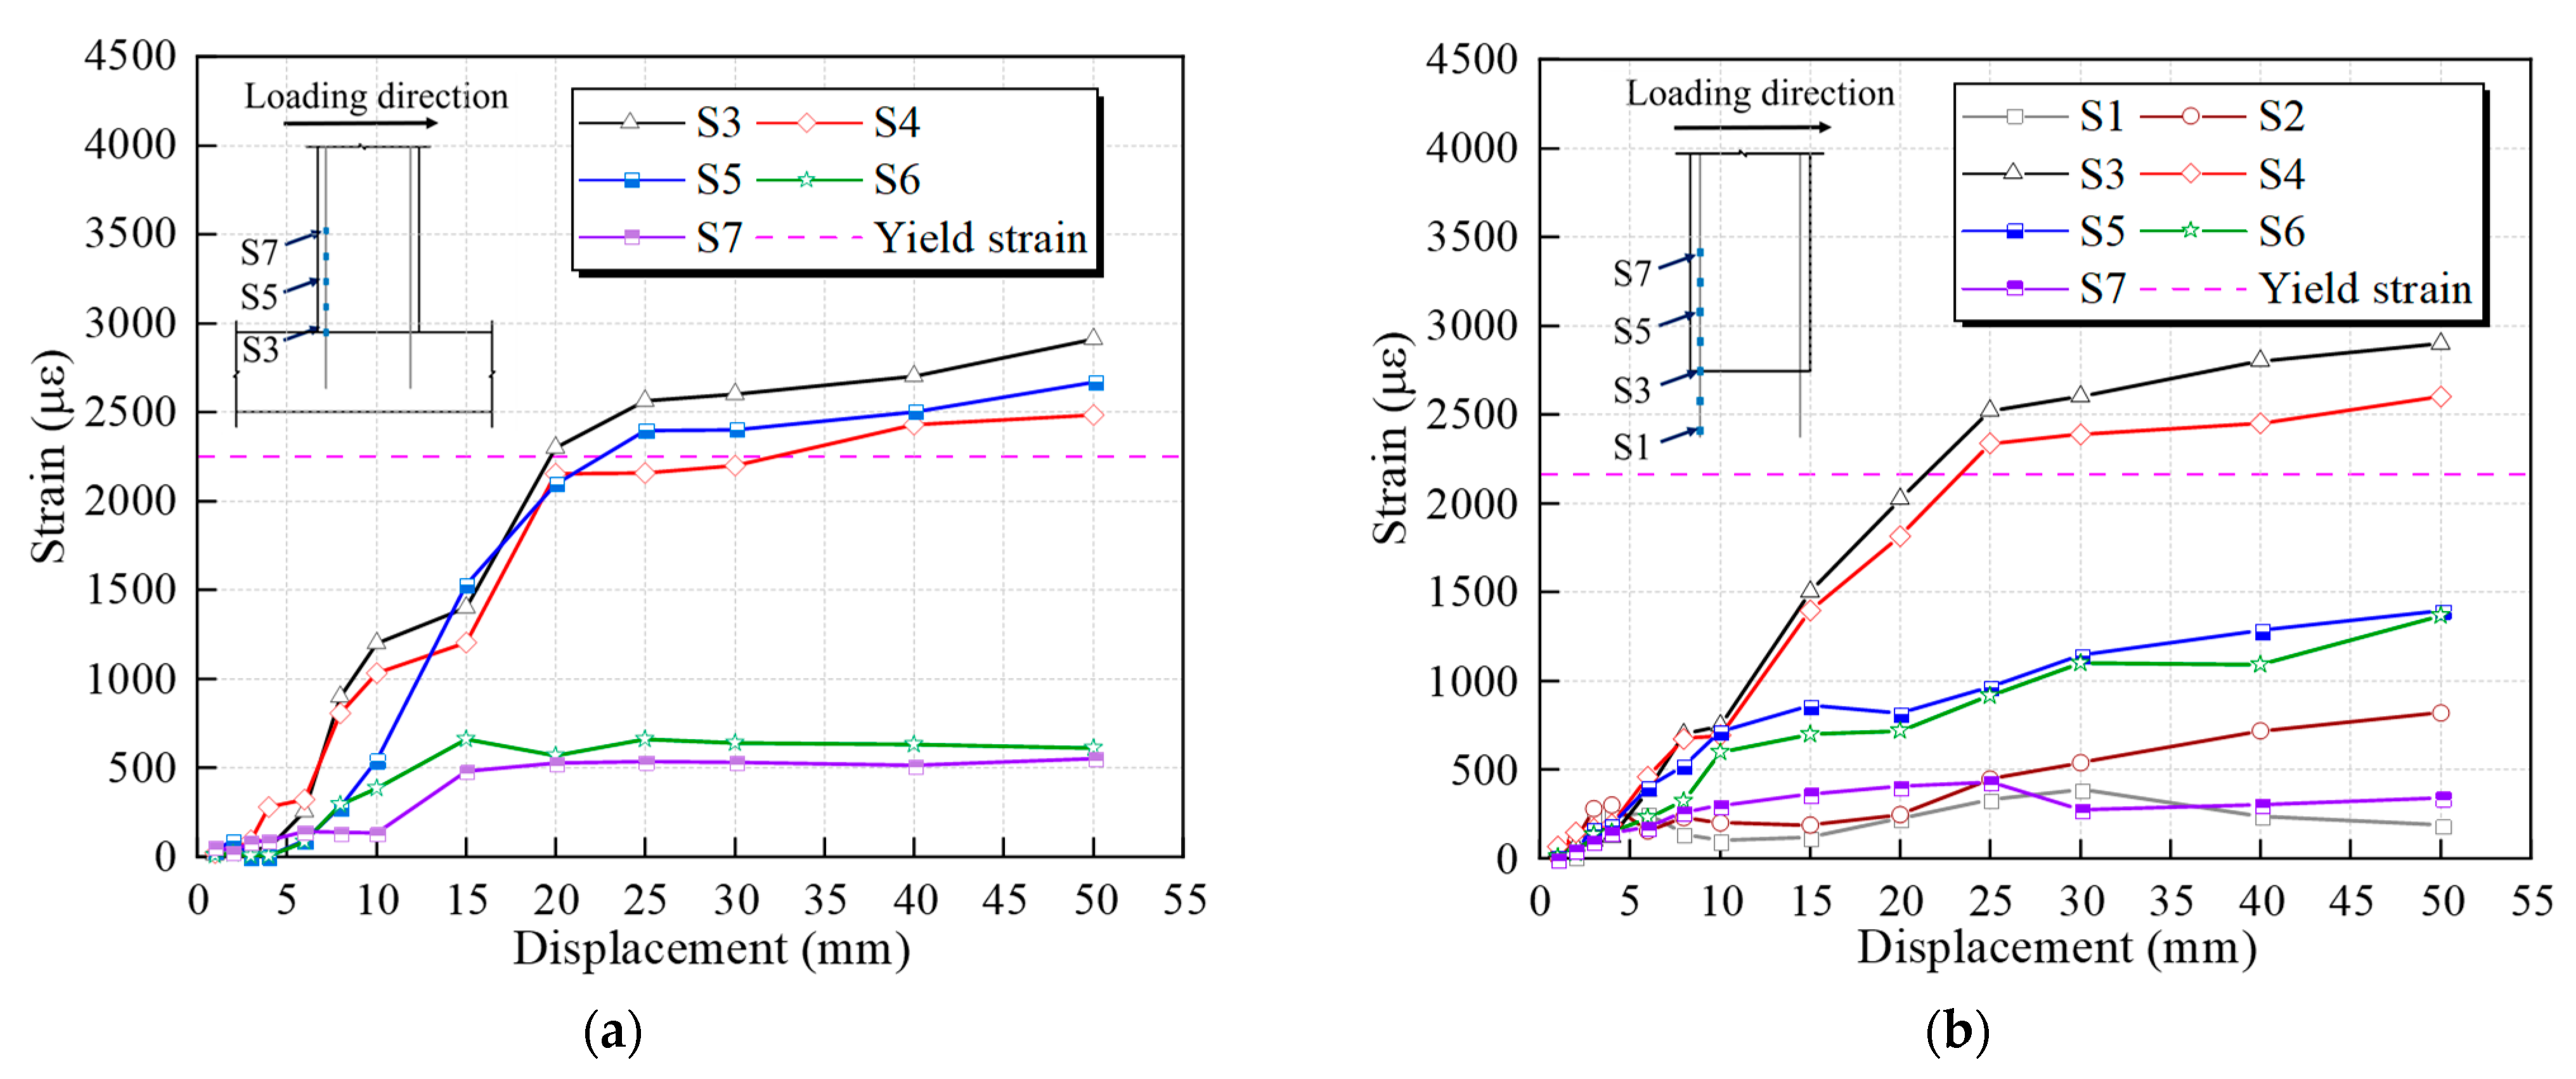
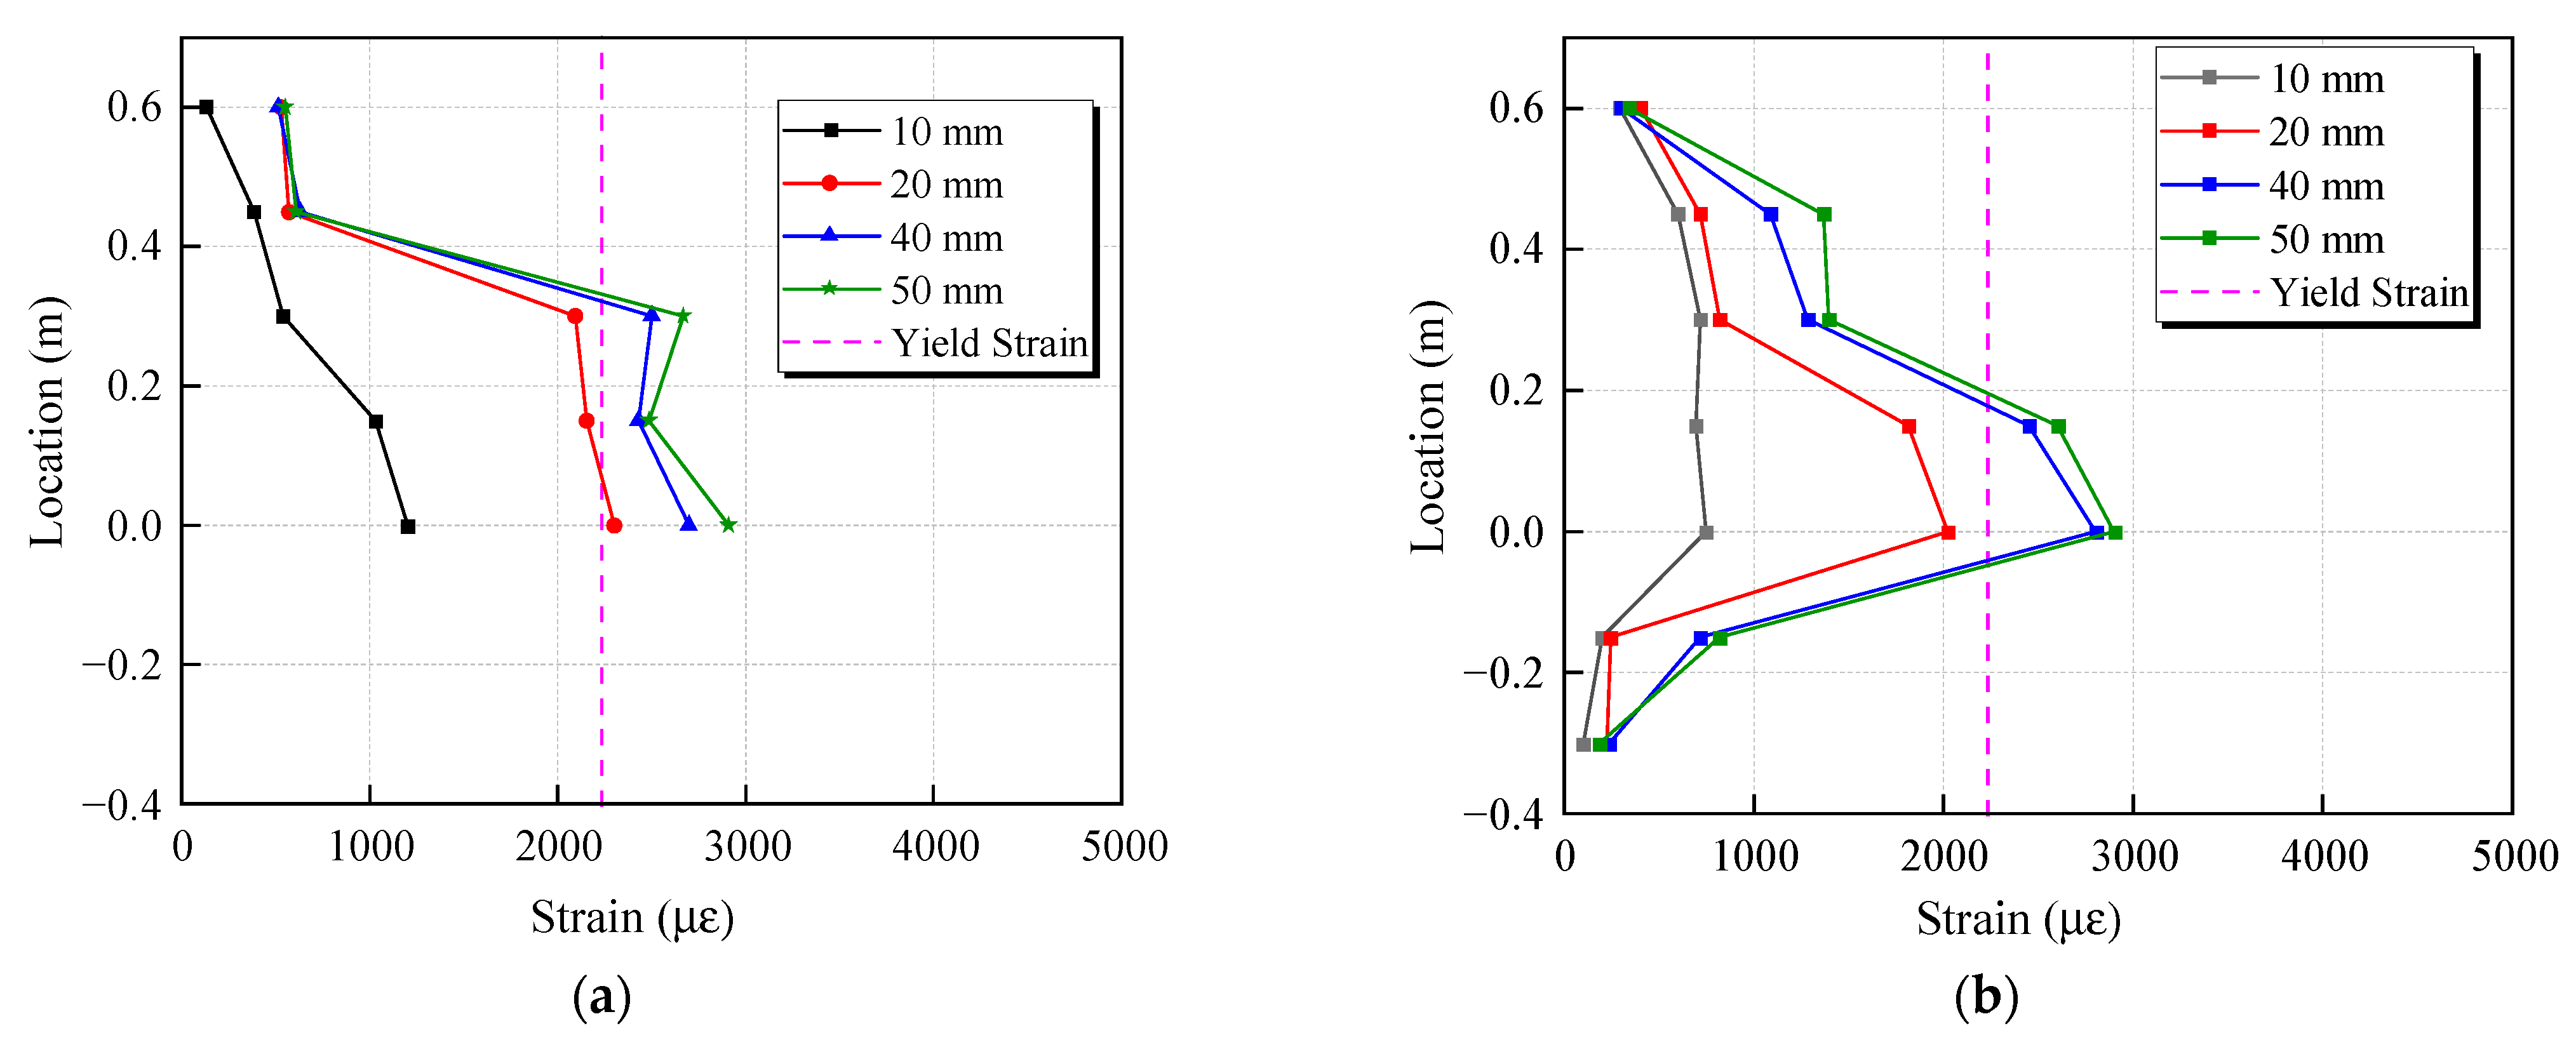
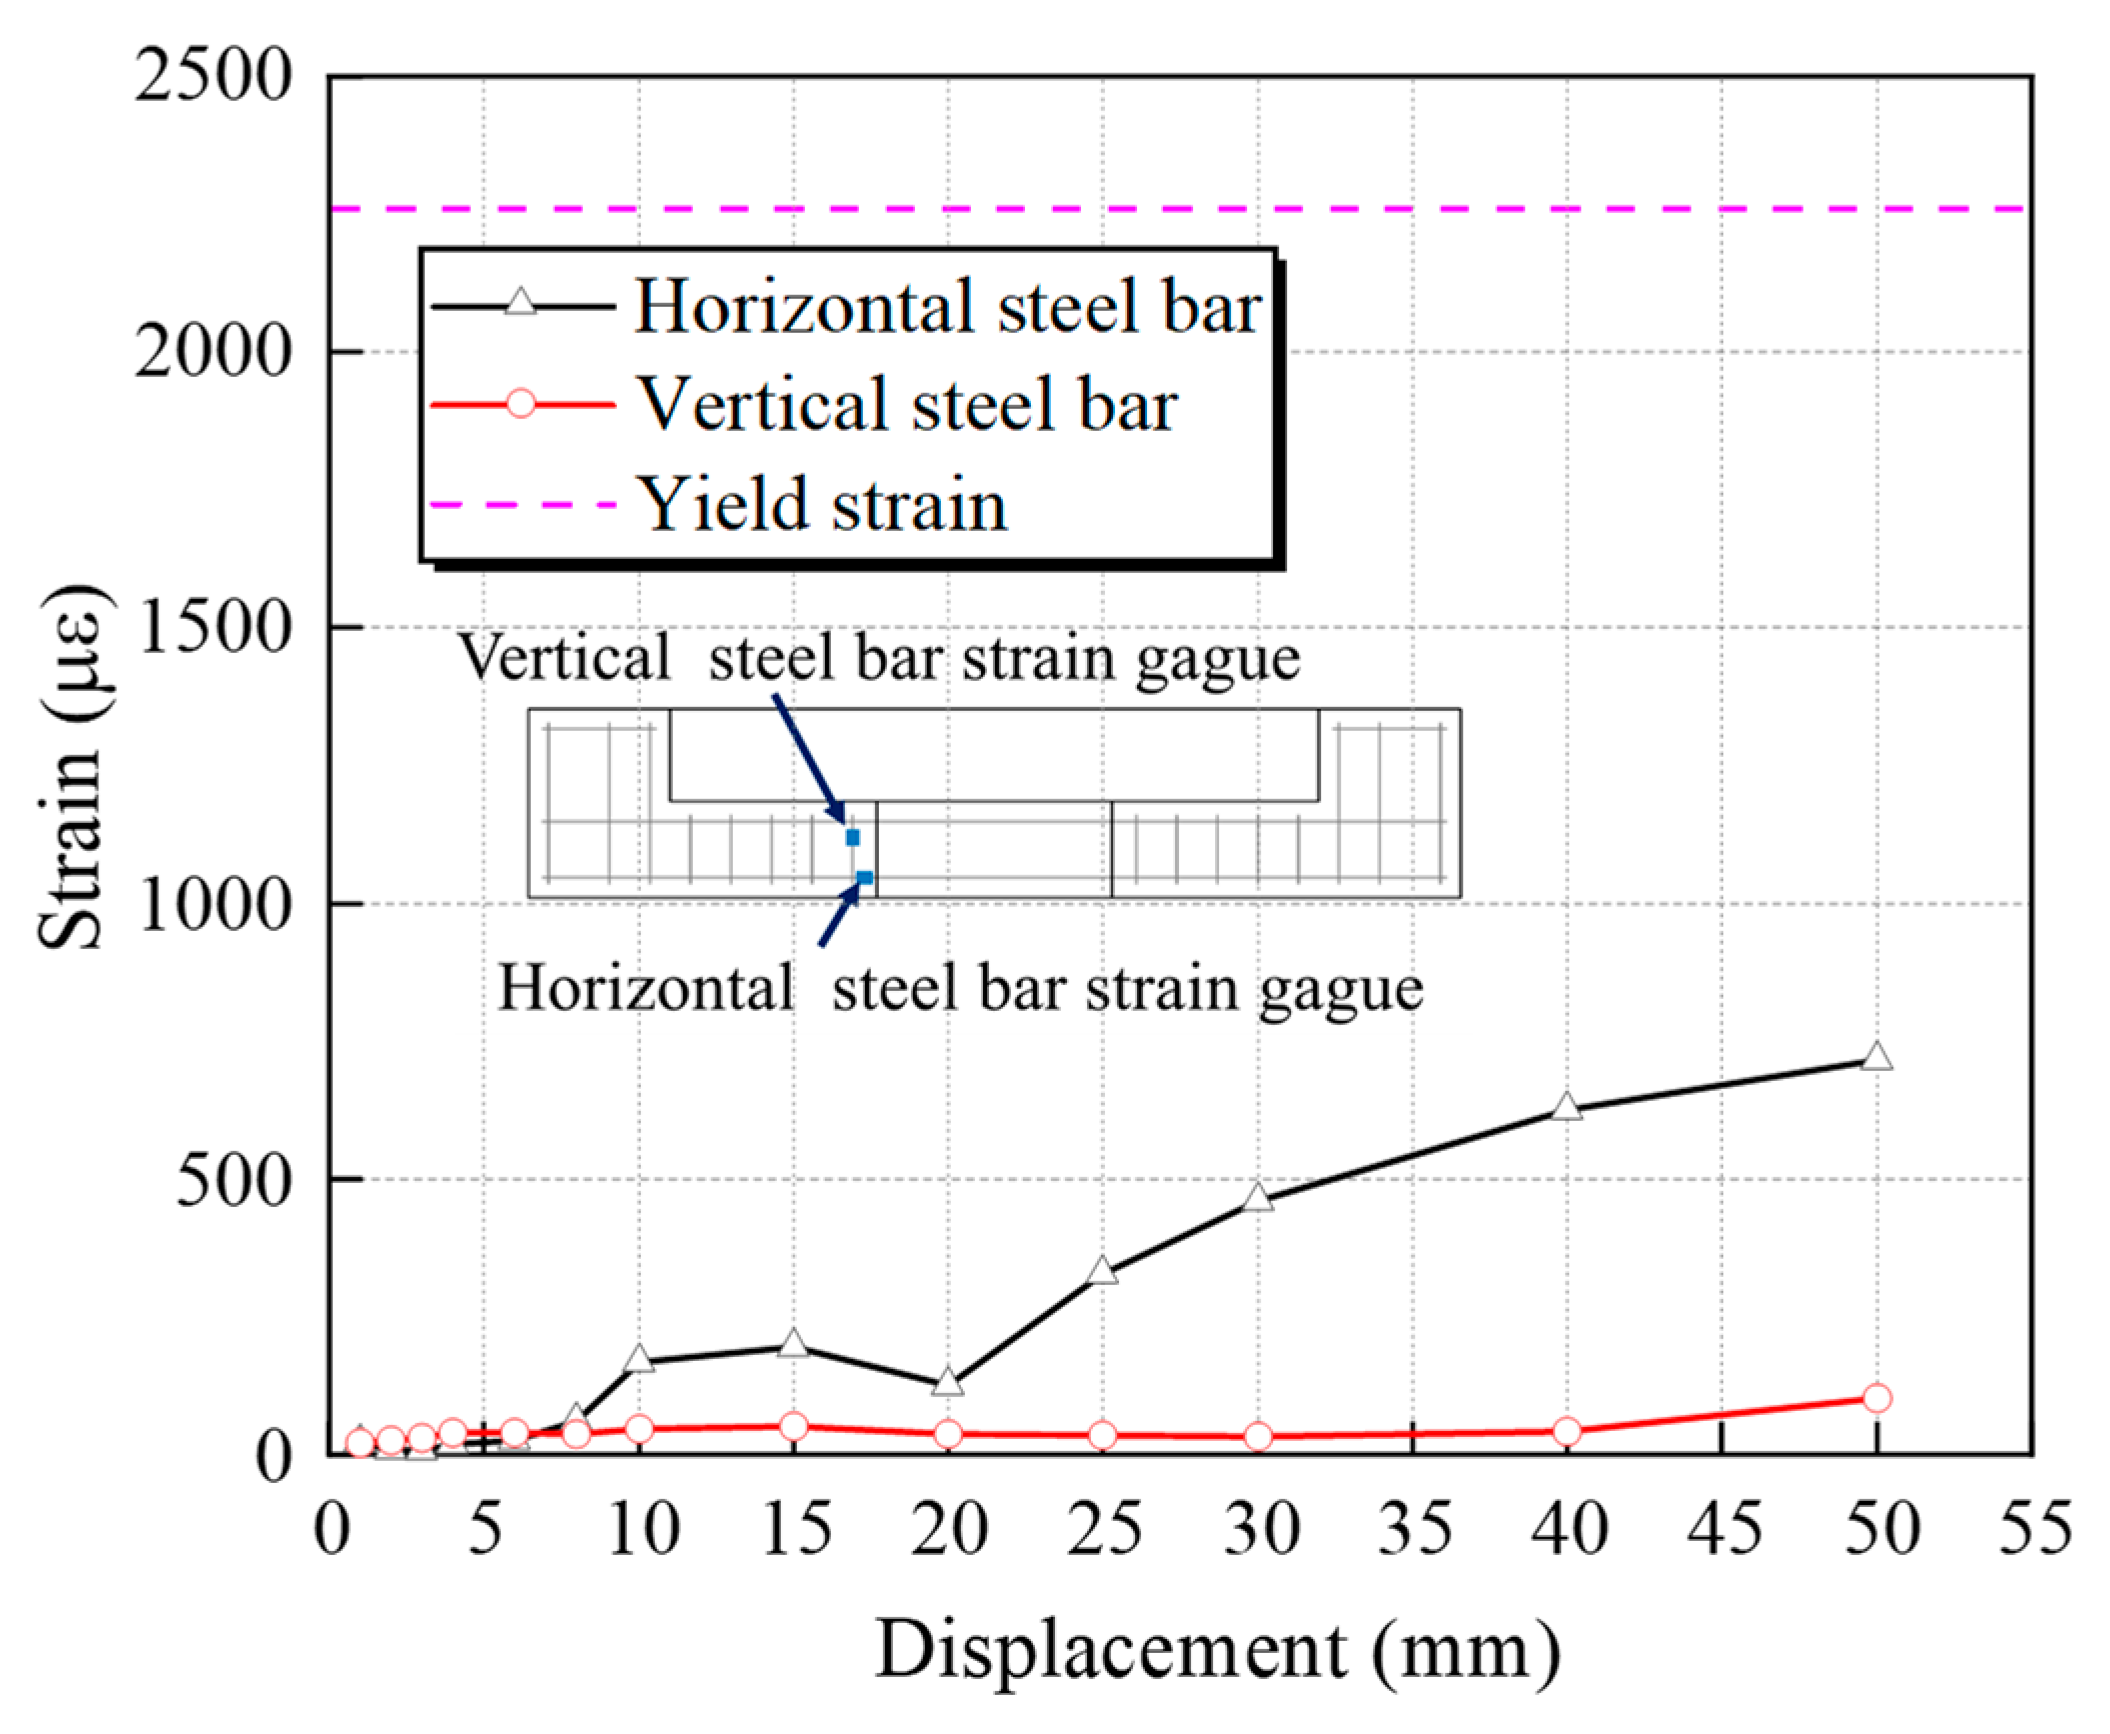
3.5. Strain Behavior

In this study, the yield strain of the longitudinal rebar was 2262 με. The tensile strain development and strain distribution are shown in Figure 18 and Figure 19, respectively.
As shown in Figure 18 and Figure 19, when the CIP specimen was loaded to 18.5 mm, the longitudinal rebar at a height of 0–30 cm above the interface between the column and the cap beam reached yield strain. Continuing loading to 50 mm, apart from the longitudinal reinforcement at 0–30 cm, where strain continued to increase, the strain changes at the remaining measurement points were very small. When the PSC specimen was loaded to 21.8 mm, the longitudinal rebar at a height of 0–15 cm above the interface between the column and the cap beam reached yield strain. Continuing loading to 50 mm, apart from the longitudinal reinforcement at 0–15 cm, where strain continued to increase, the strain changes at the remaining measurement points were very small. The plastic hinge region of the PSC specimen was more concentrated than that of the CIP specimen. This occurred because the wet joint of the PSC specimen was peeled off, causing the yield of the longitudinal reinforcement to concentrate on the bottom of the column instead of extending upward.
For the PSC specimens, the strains of the horizontal and vertical reinforcements are shown in Figure 20. As shown, the peak strains of these steel bars during the test were less than 800 με, and the higher strain of the horizontal bars was due to the spalling of concrete on the surface of the cap beam that exposed the horizontal bars.
In summary, the plastic hinge area of the PSC specimen was more concentrated; the horizontal reinforcement strain of the cap beam had a tendency to increase, but it did not reach the yield strain, and the socket connection was safe and reliable.

4. Numerical Simulation and Evaluation

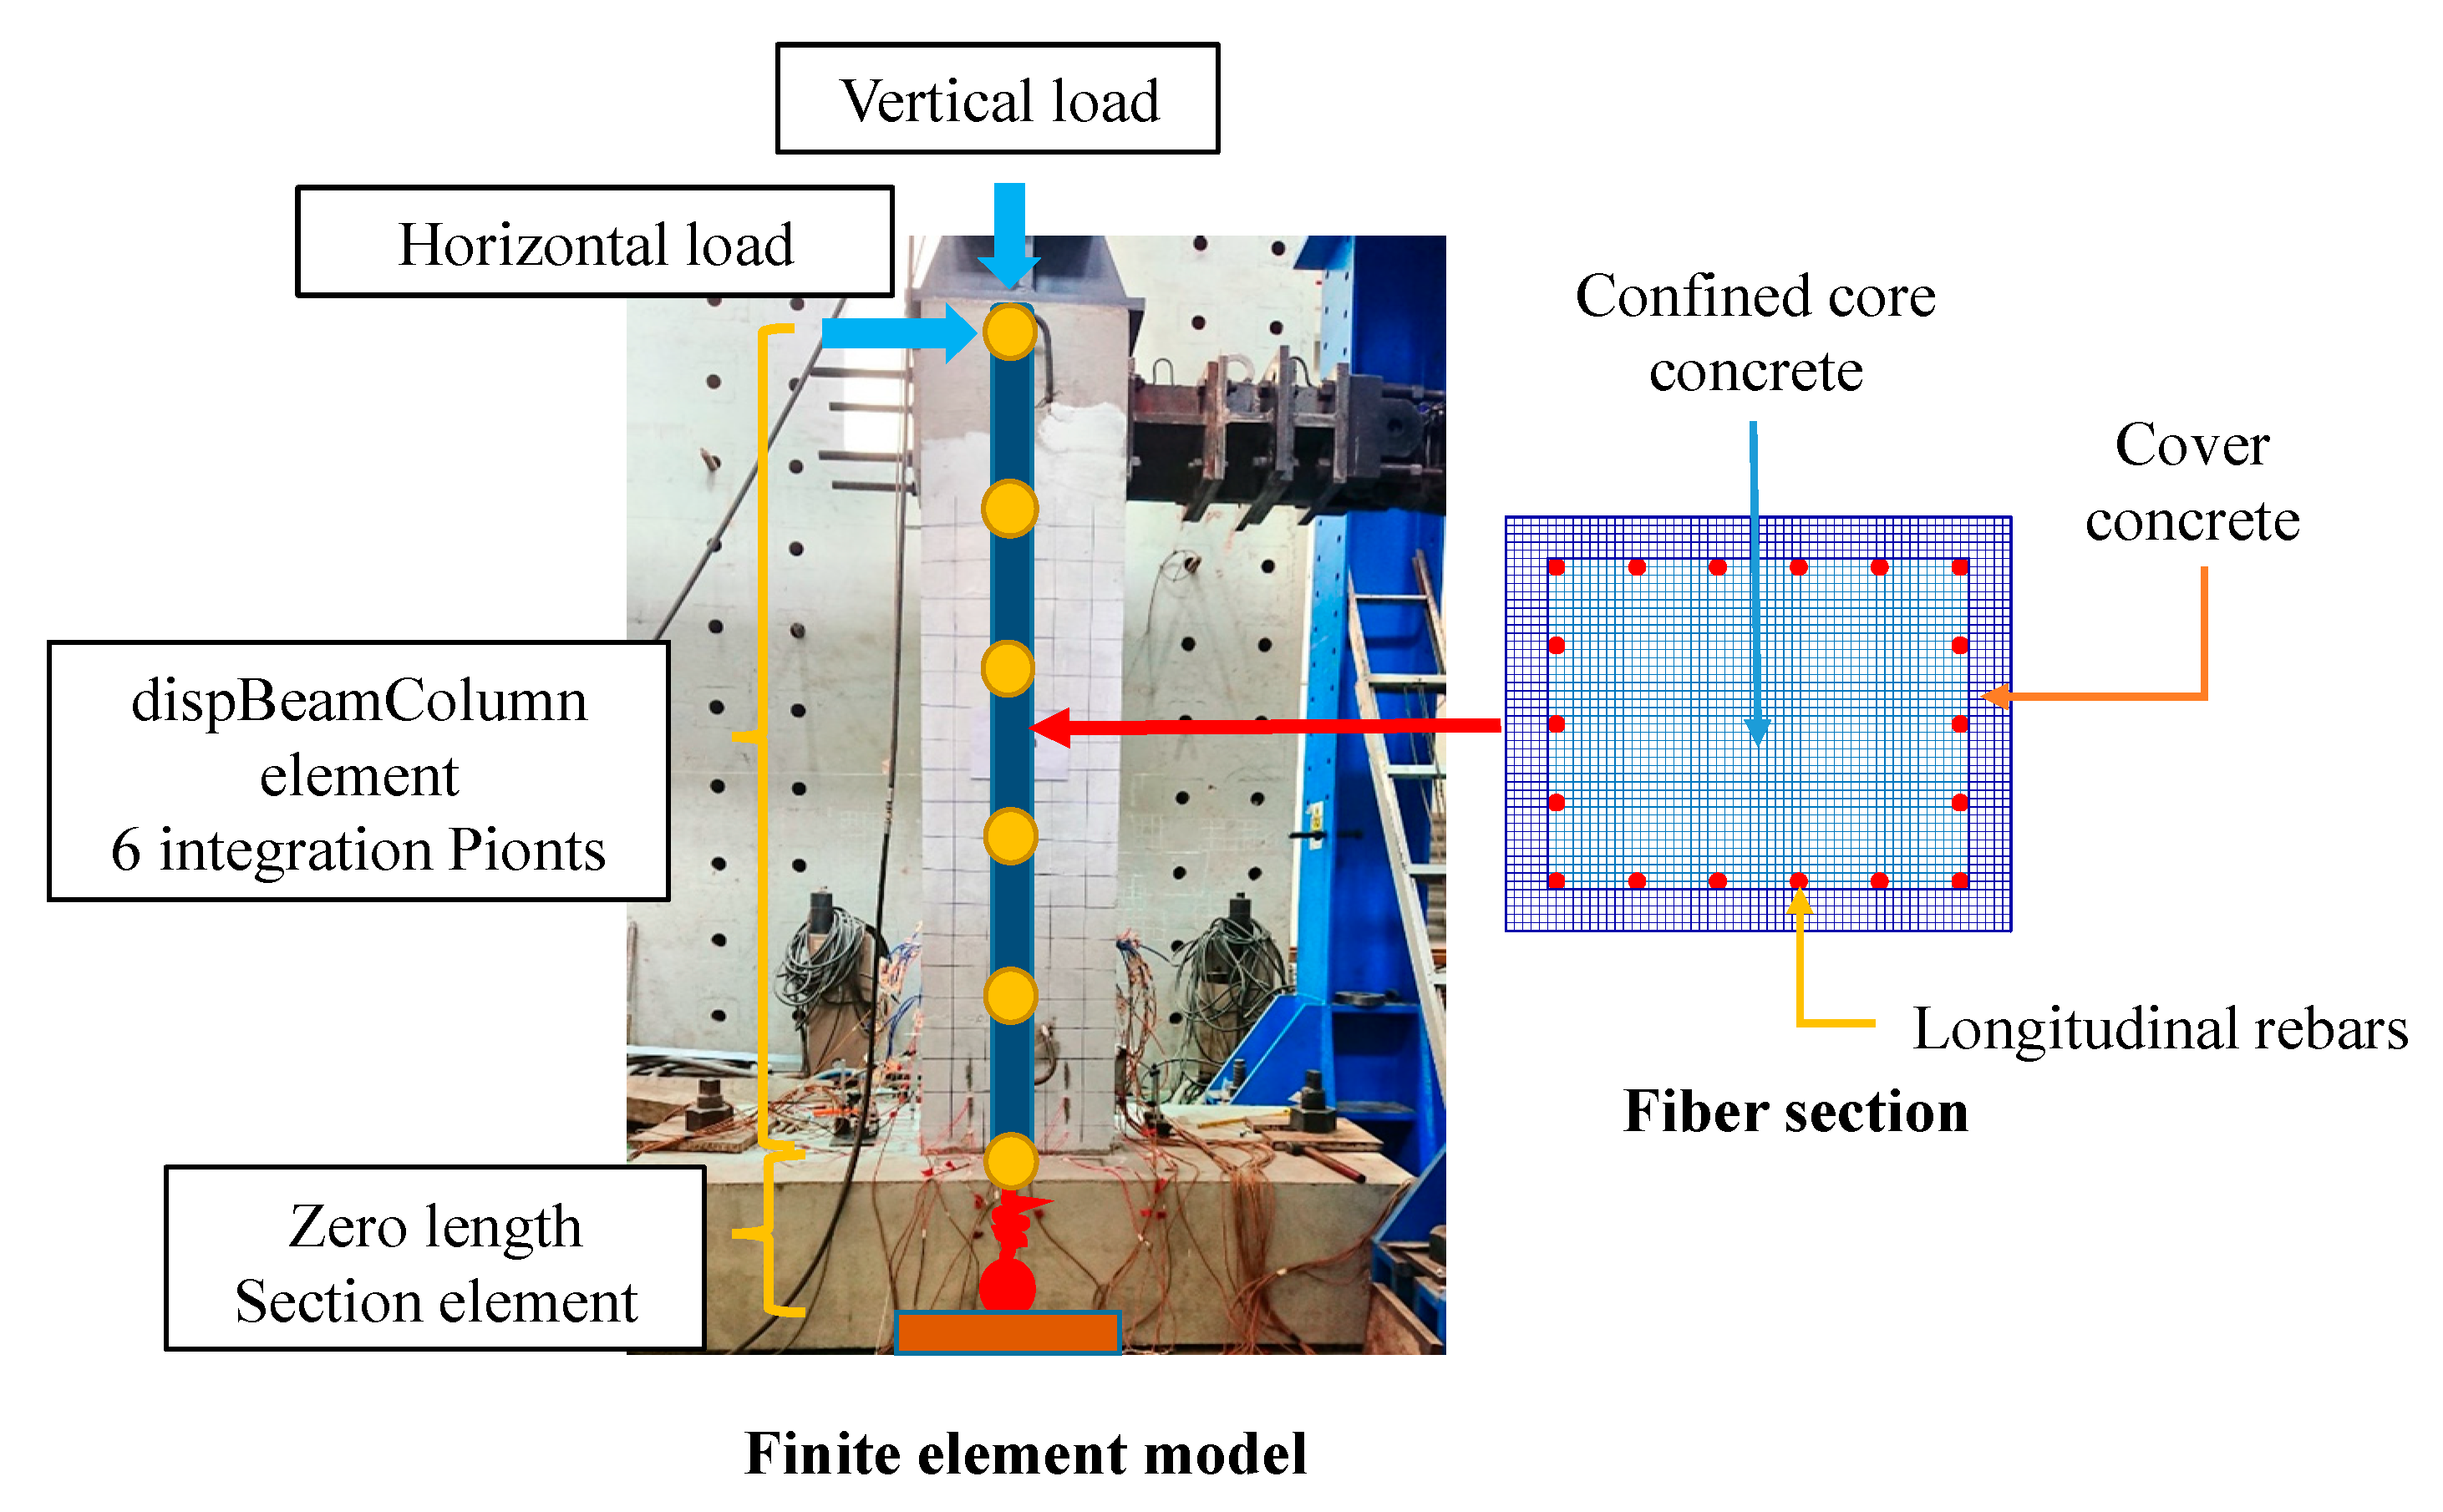
4.1. Finite Element Model of the Cap–Column System

The Open System for Earthquake Engineering Simulation (OpenSees) program was used to simulate RC cap–column connection specimens. In the OpenSees model, the fiber elements of the column section consisted of constrained concrete, unconstrained concrete, and steel reinforcement elements. Both CIP and PSC specimens were divided into 5 dispBeamColumn elements. These elements were displacement-based and modeled the plastic distribution along the element length. The column section was divided into a total of 3118 fiber elements, including 2000 confined concrete fiber elements, 1100 unconfined concrete elements, and 18 steel reinforcement fiber elements. The convergence test showed that the mesh division method can meet the calculation accuracy requirements.
In addition, the focus in modeling the PSC specimens was to simulate the bond slip between the embedded reinforcement and the wet joint concrete. In the paper, a zero-length section element was used to simulate the bond slip between the embedded reinforcement and the wet joint concrete, as shown in Figure 21. The zero-length section element in OpenSees is assumed to have a unit-length such that the element deformations are equal to the section deformations. This element, at the end of a beam-column element, can incorporate the fixed-end rotation caused by strain penetration into the beam-column element [37].

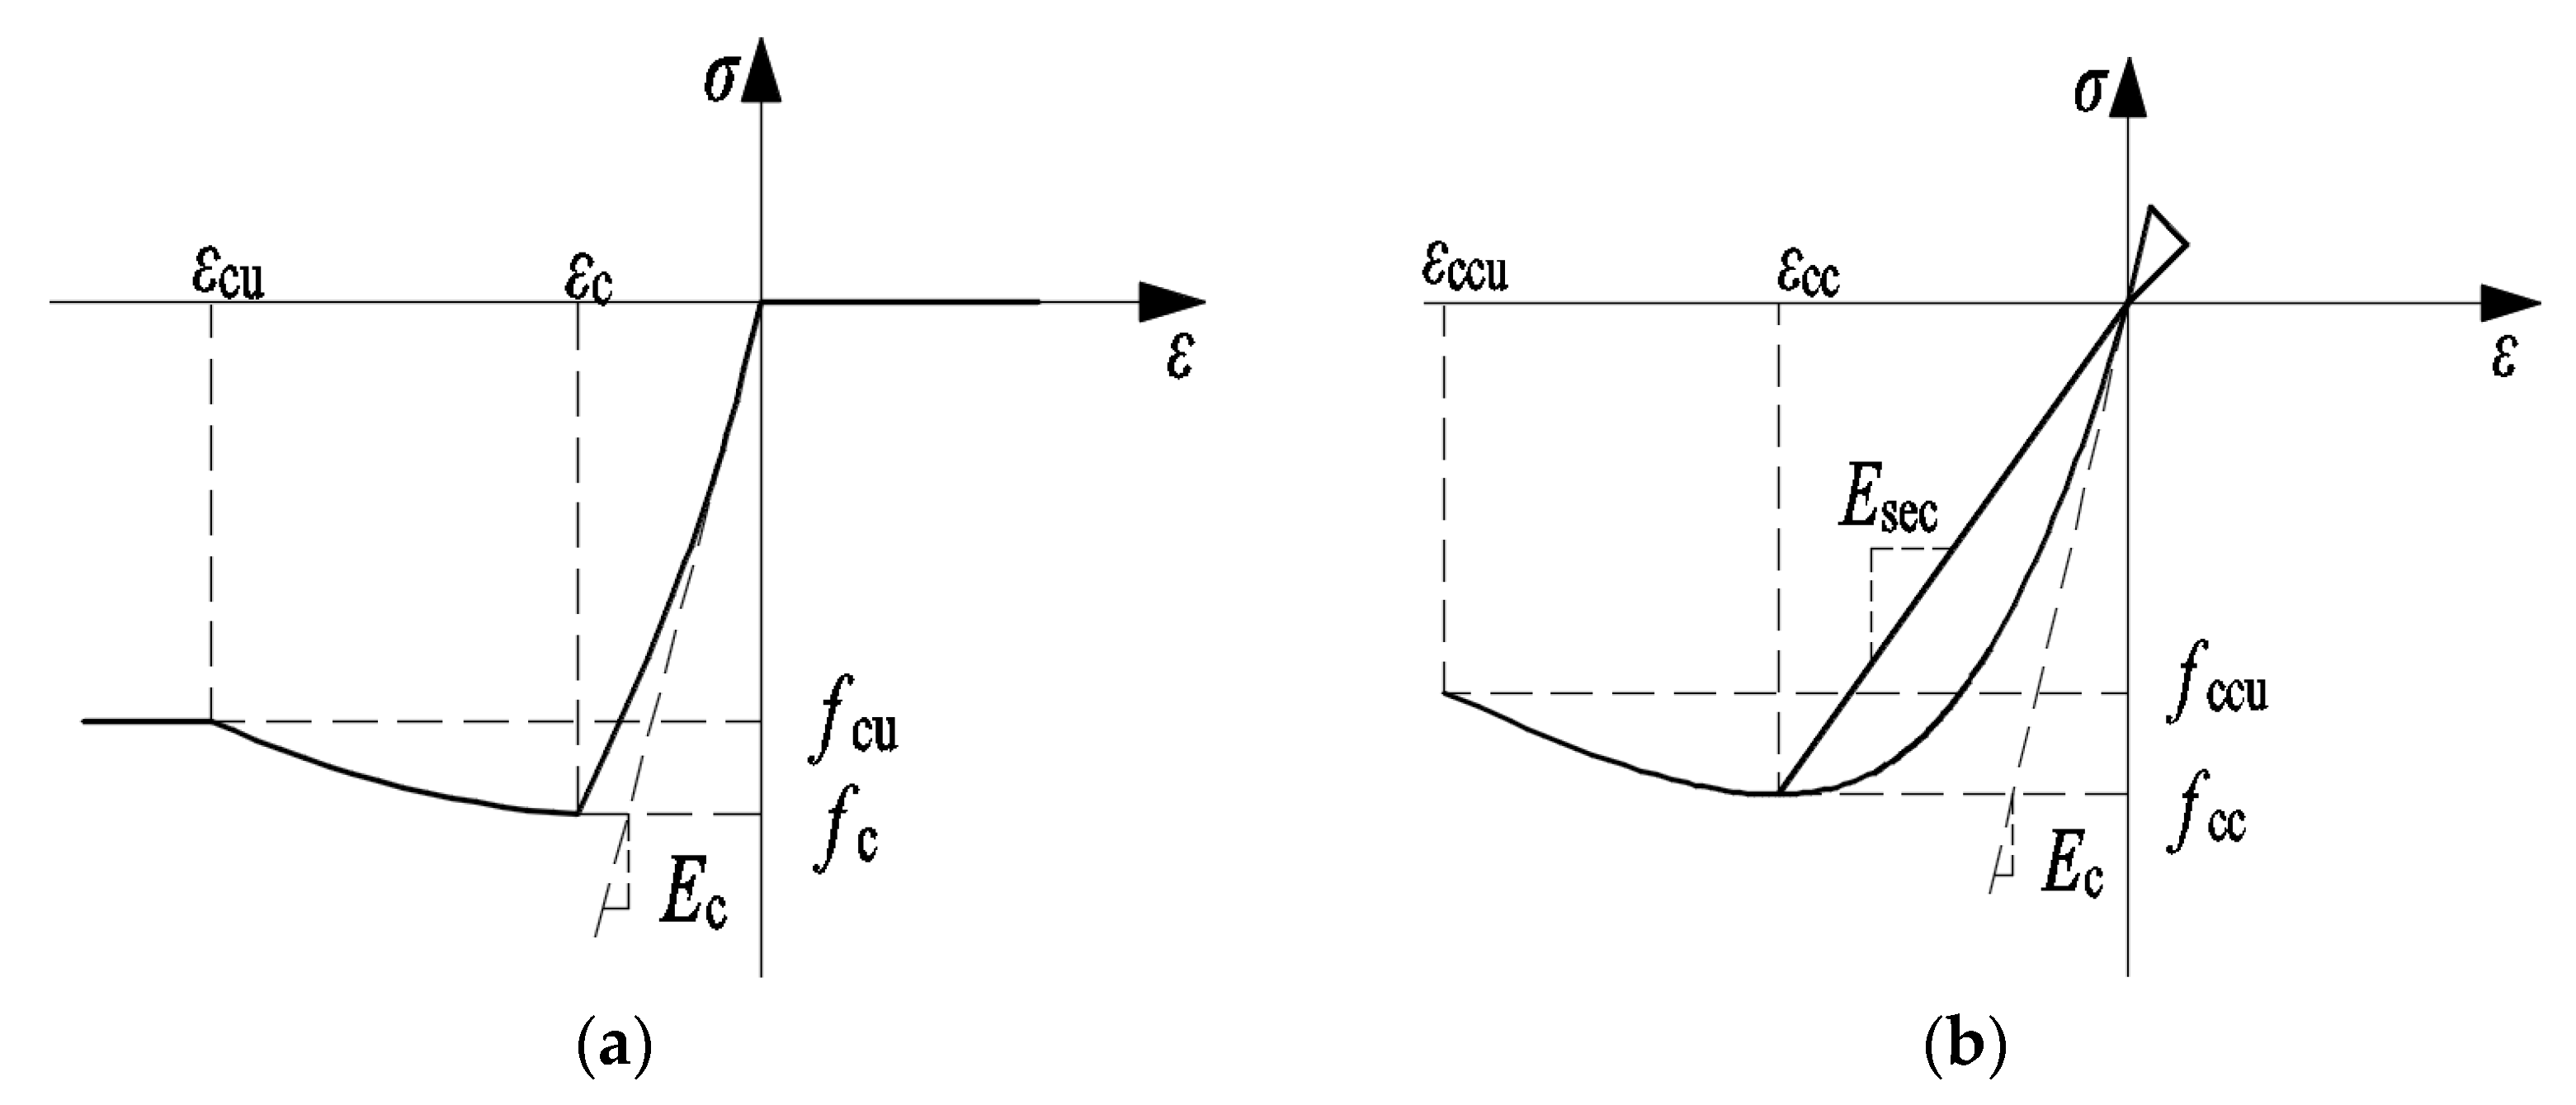
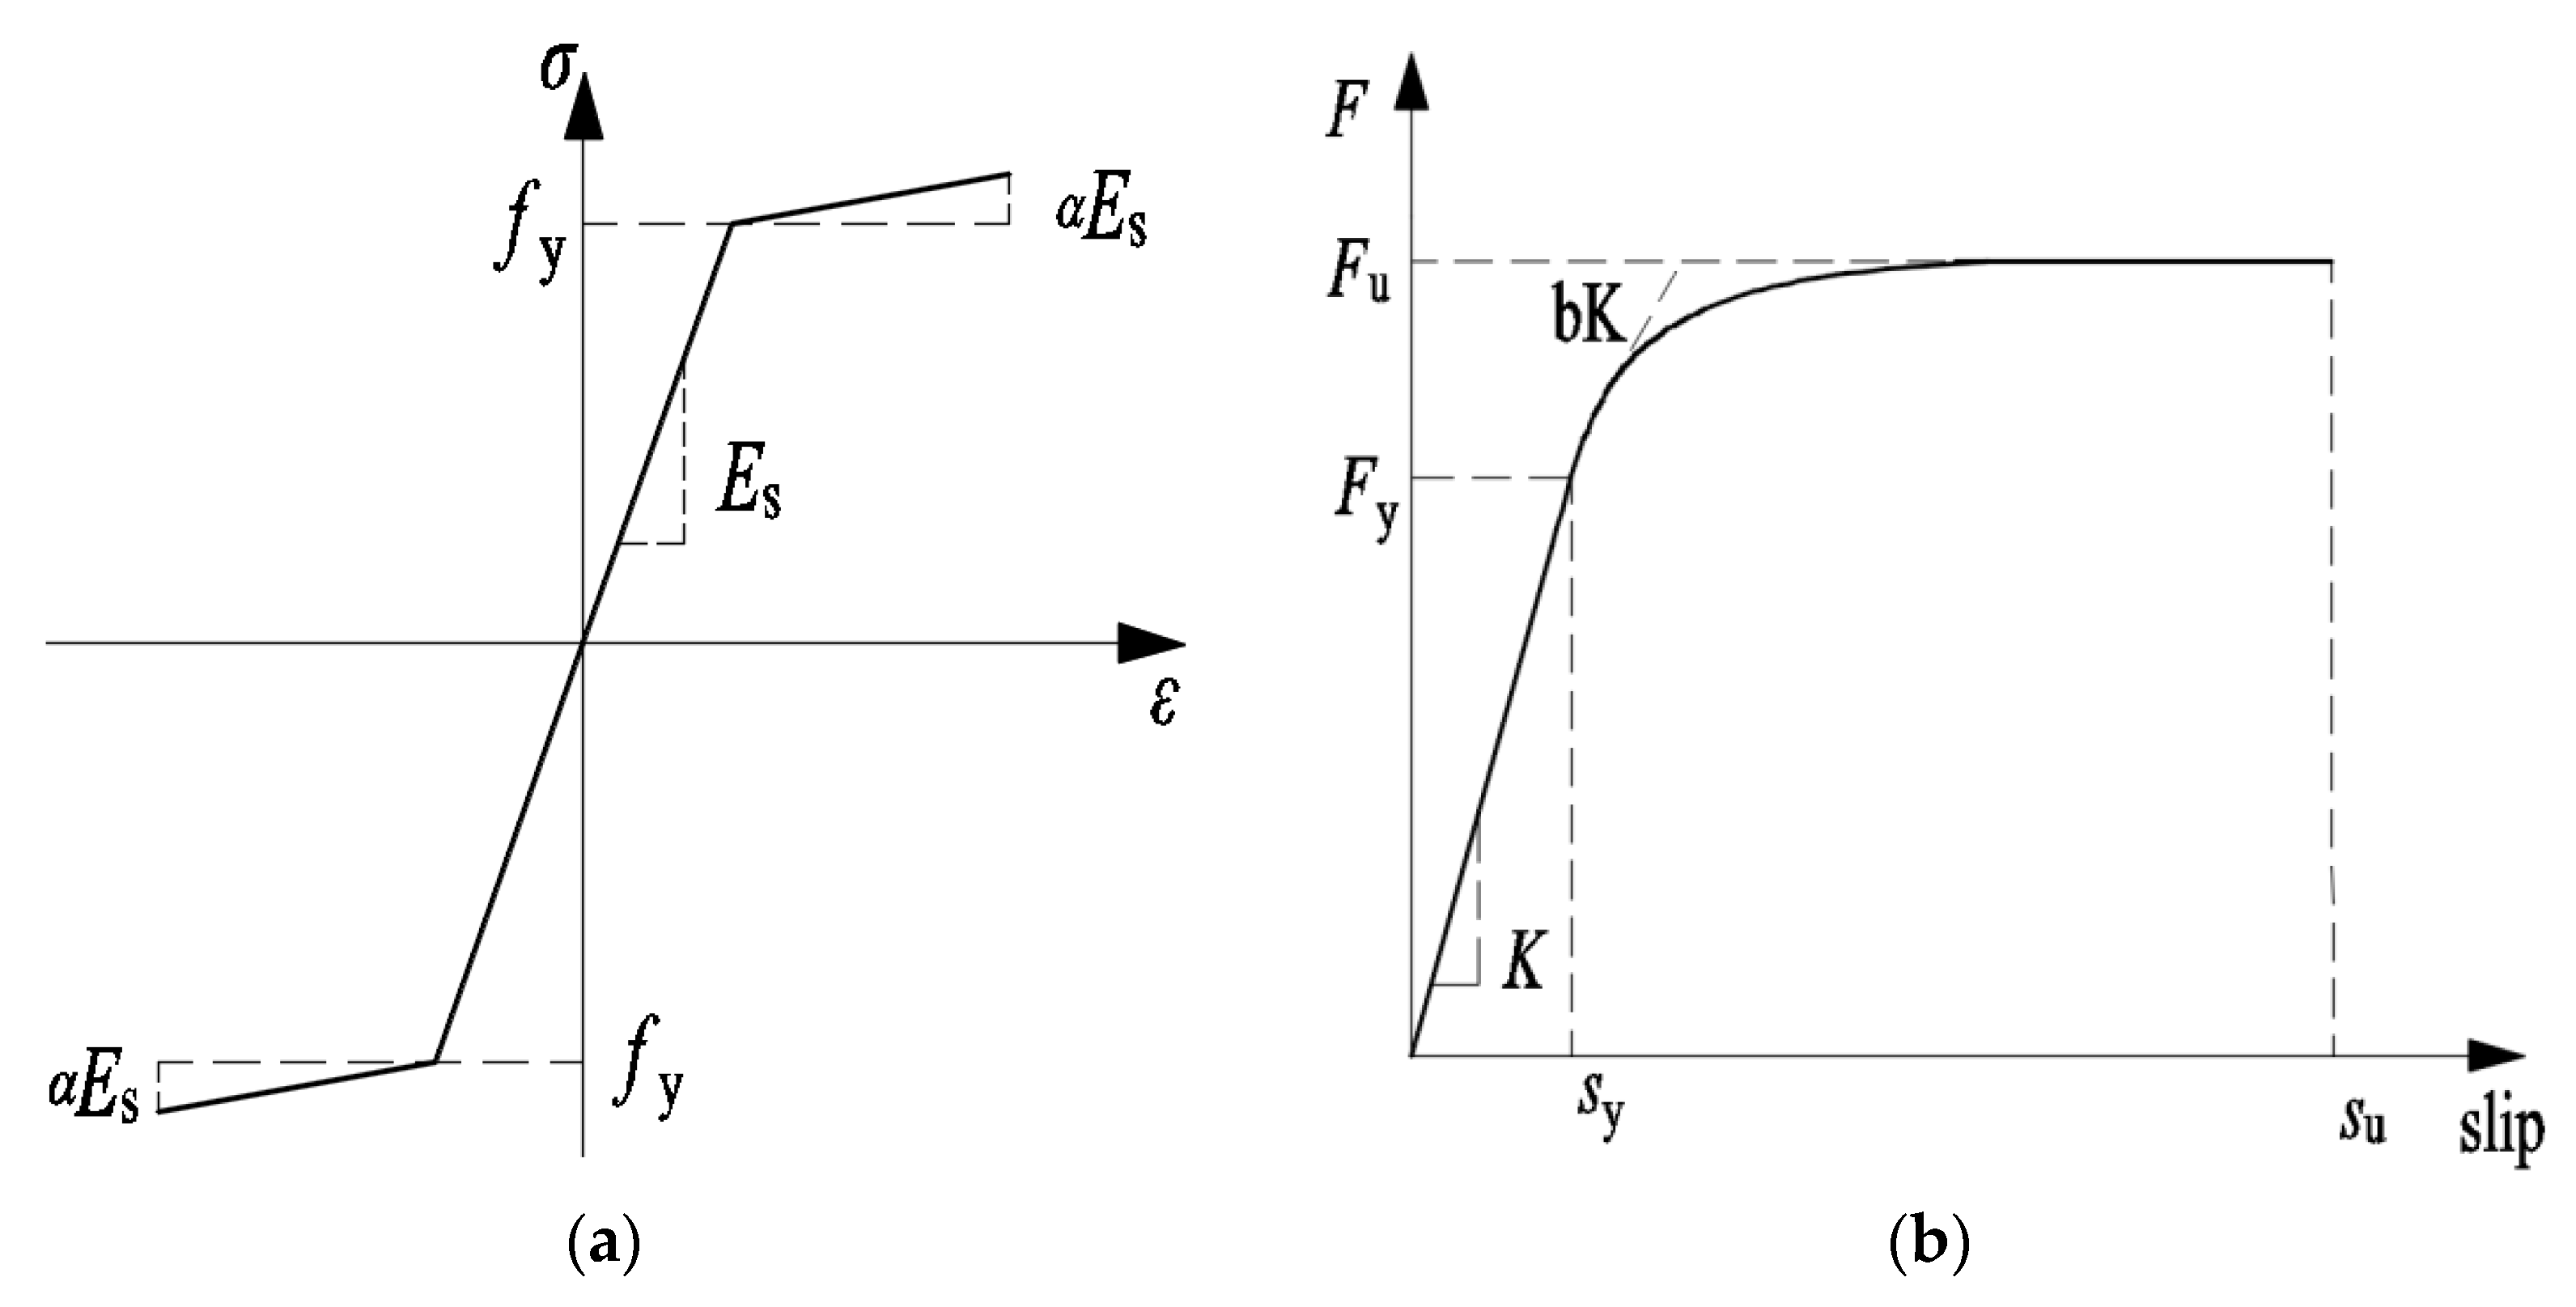
4.2. Material Constituent Model

The constitutive material relationships of the concrete are shown in Figure 22. The characteristic values of the steel and concrete materials were described in Section 2.2. Concrete 01 [38], a concrete material with linear degradation in stiffness and no tensile strength, was used to simulate unconfined concrete. The compressive strength of unconfined concrete is fcc, which is equal to fc. Confined concrete was simulated using Concrete 04 material with a tensile strength degradation index. The Mander model [39] was used for confined concrete to calculate the effects of the stirrup on the core concrete, and its parameters were calculated using Equations (3) and (4) [40]:
ε c cu = 0.004 + 1.4 ρ s f y h ε u h f c c
E sec = f c c ε c c
where ρs is the volumetric reinforcing ratio, fyh is the yield stress of the stirrup, and εuh is the ultimate tensile strain of the stirrup.
The constitutive material relationships of the steel are shown in Figure 23. The stress—strain relationship of the longitudinal reinforcement has an important effect on the numerical results of structures under cyclic loading [41]. Steel reinforcement was simulated using Steel 02 material, which included consideration of the isotropic strain hardening and the Bauschinger effect. The yield strength fy and the Young’s modulus Es were modified based on testing of the reinforcement material. The reinforcement in the zero-length section element of the PSC specimen was simulated using Bond_SP01 material, considering the stress—slip relationship [42]. In this model, the slip Sy on the cross-section at yield of the reinforcement was calculated using Equation (5). The value of the ultimate slip Su was 35 times Sy:
S y = 2.54 d b 8437 f y f c ( 2 α + 1 ) 1 α + 0.34
where db is the diameter of the steel bar, α is the bond slip parameter and is taken as 0.4 in accordance with CEB-FIP Model Code 90 [43], and fc is the concrete compressive strength of the cap beam concrete.

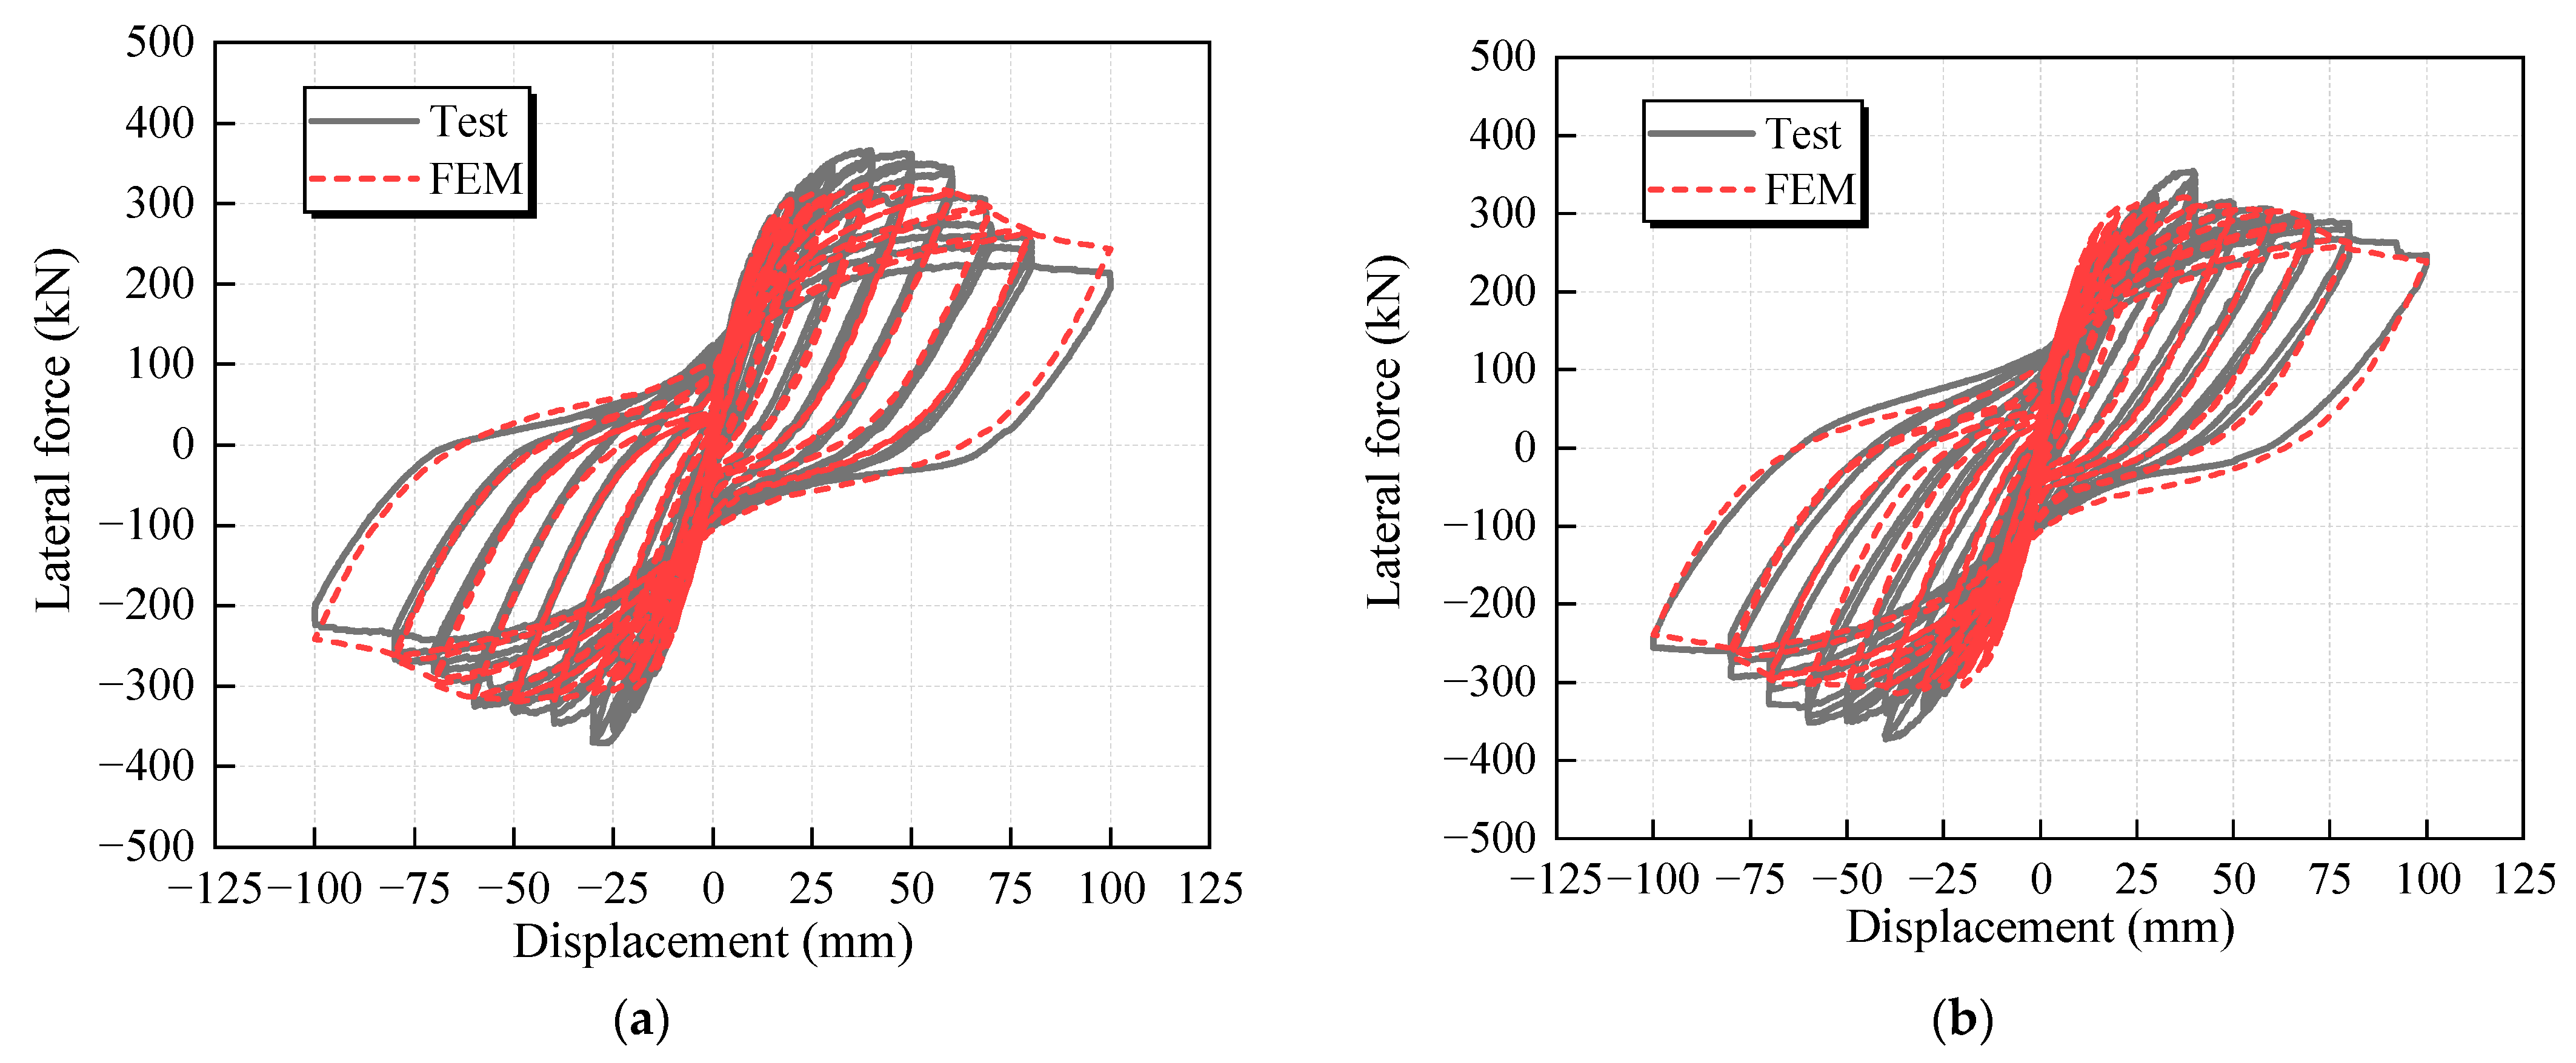
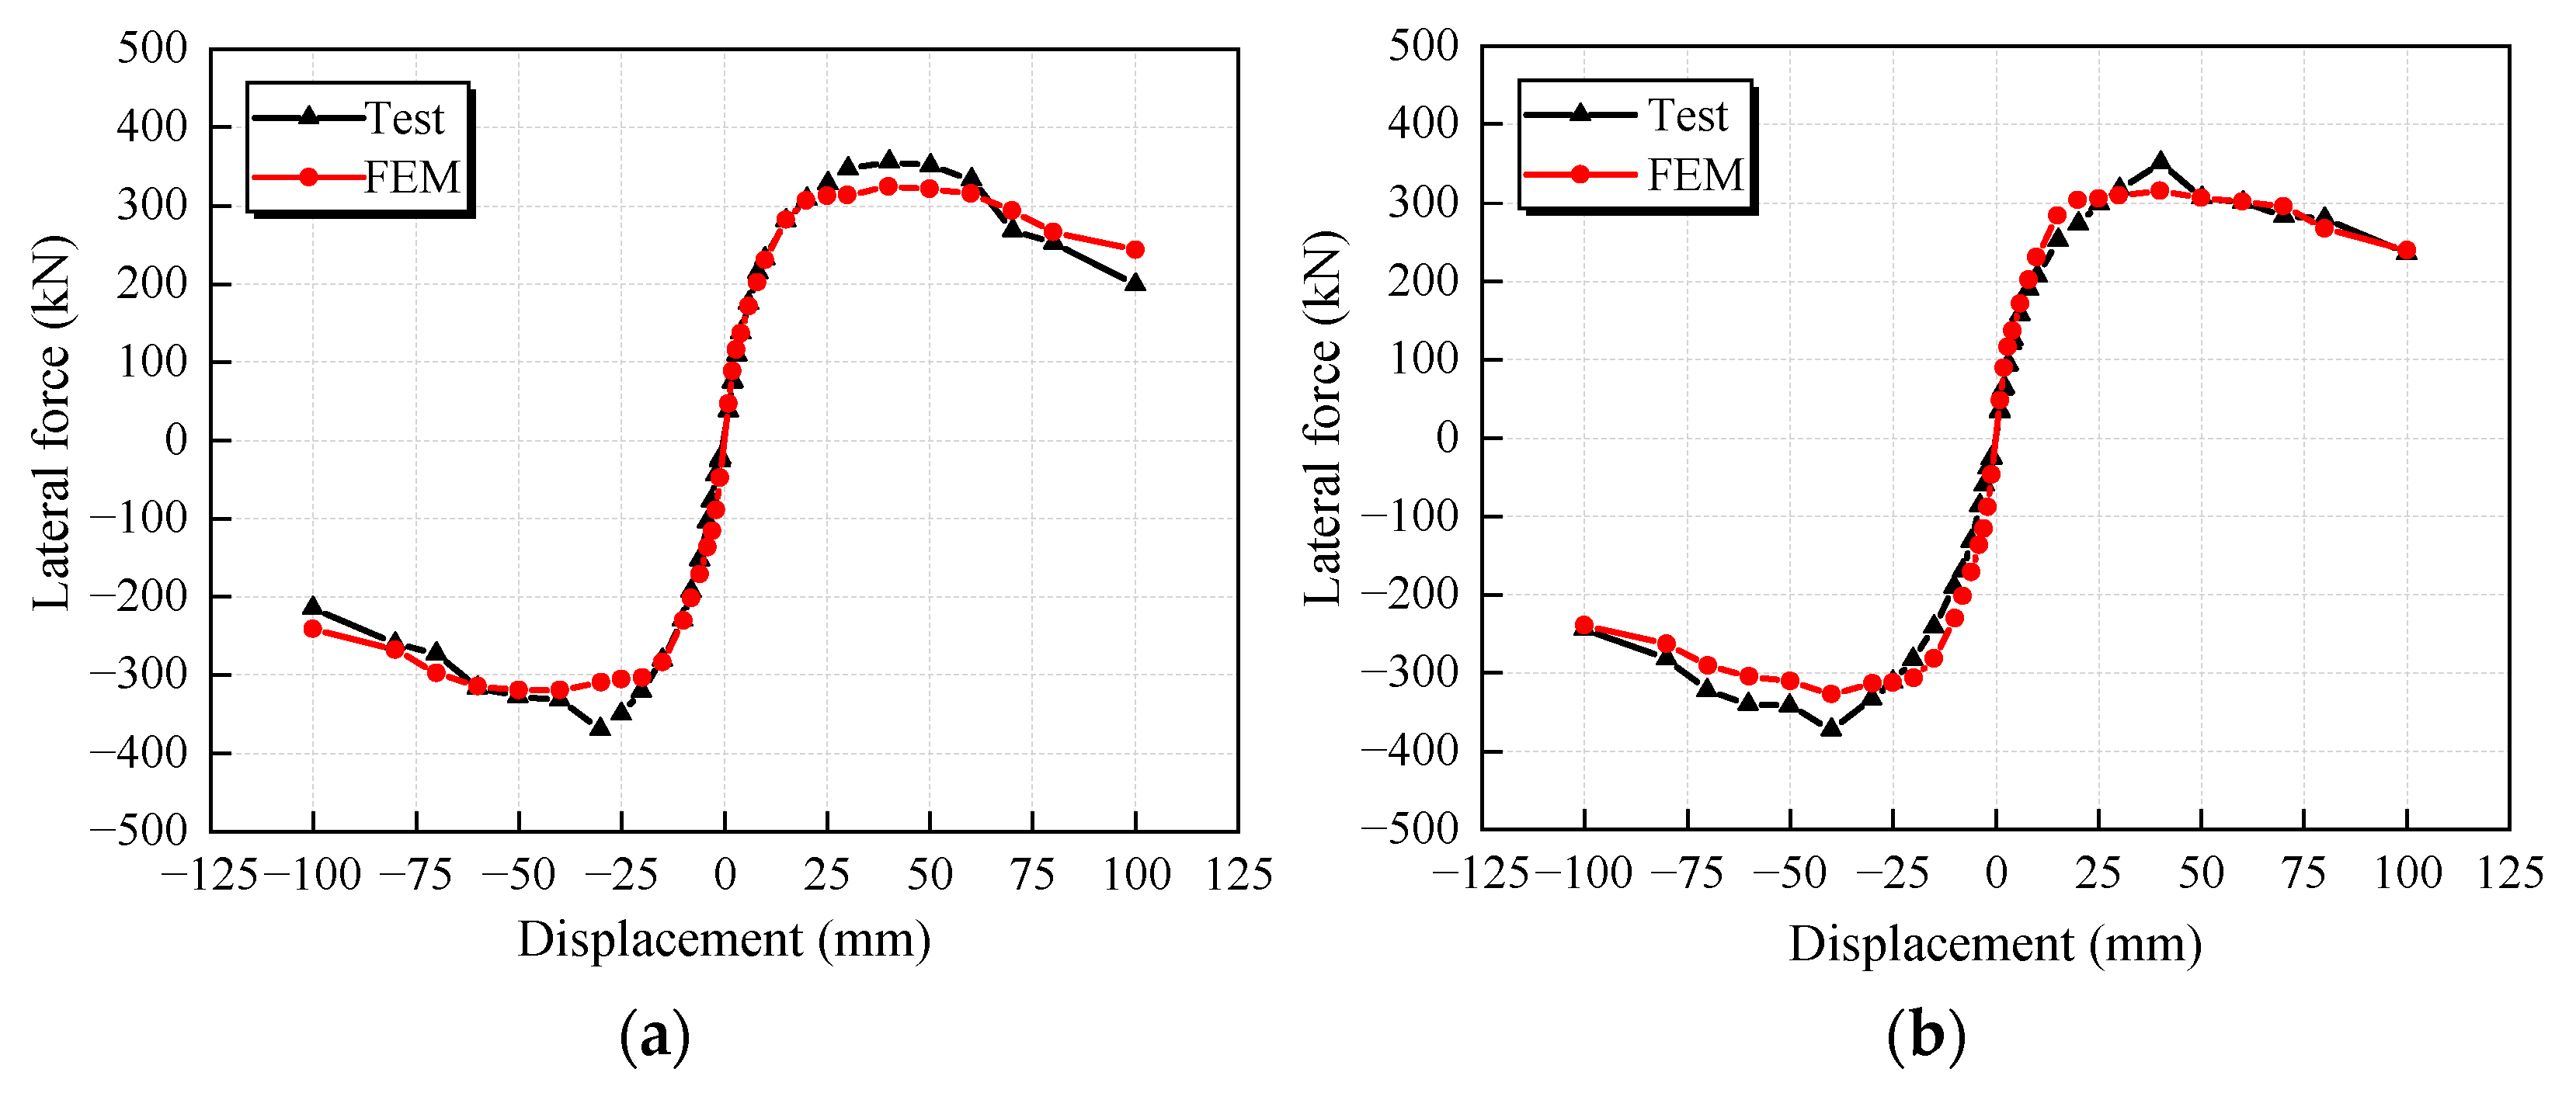
4.3. Comparison of the Test Results and Numerical Results

Comparisons of the hysteretic curve results between the numerical simulation and the experimental results are shown in Figure 24 and Figure 25. The experimental and numerical simulation results are similarly shown in Table 6. Comparative analysis shows that the numerical simulation results generally agreed with the test results, with some of the errors caused by asymmetric loading in the positive and negative directions during the test.
The overall differences between the test results and numerical simulation results for each specimen were small. Specifically, the average ratio between the peak bearing capacity in the test and the numerical simulation was 1.15, while the average ratio between the initial stiffness ratio in the test and the numerical simulation was 0.95. In summary, the established numerical model could effectively simulate the hysteresis characteristics of each specimen.

5. Conclusions

In this paper, the seismic performance differences between a precast cap–column socket connection (PSC) specimen and a cast-in-place cap–column (CIP) specimen were investigated through the demonstrated quasi-static tests and finite element simulations. The main conclusions can be drawn as follows.
(1)
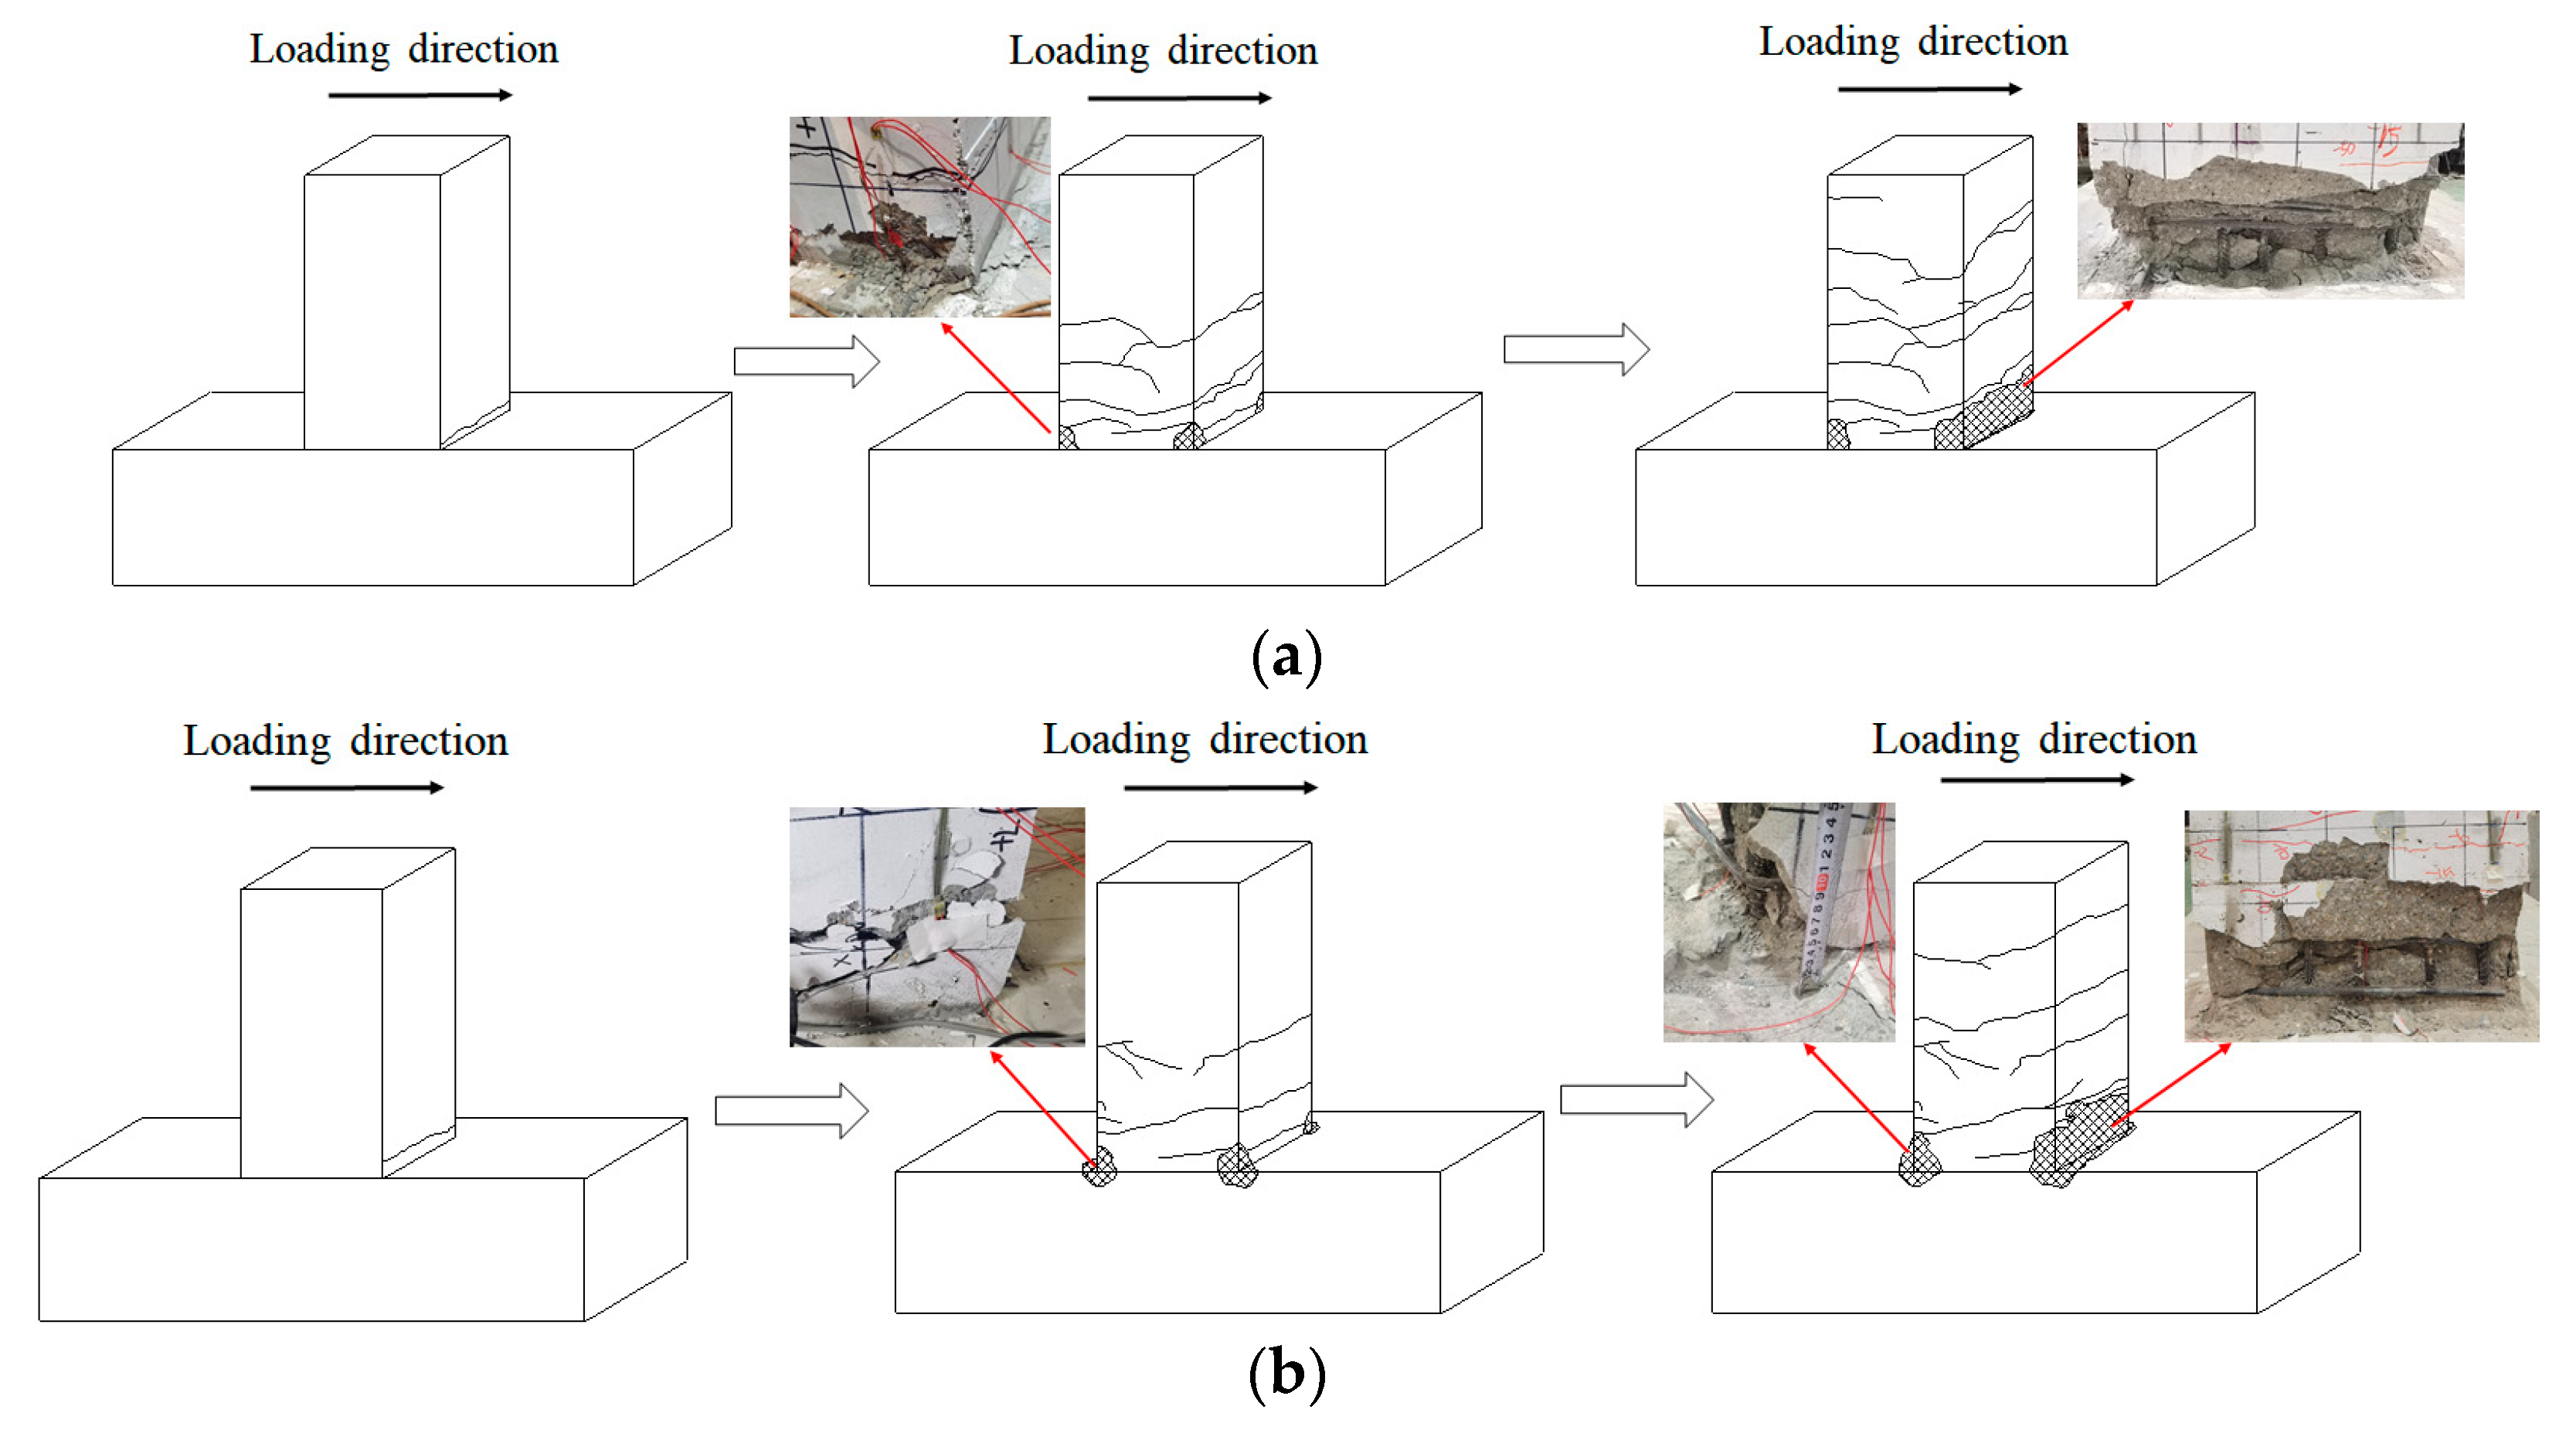
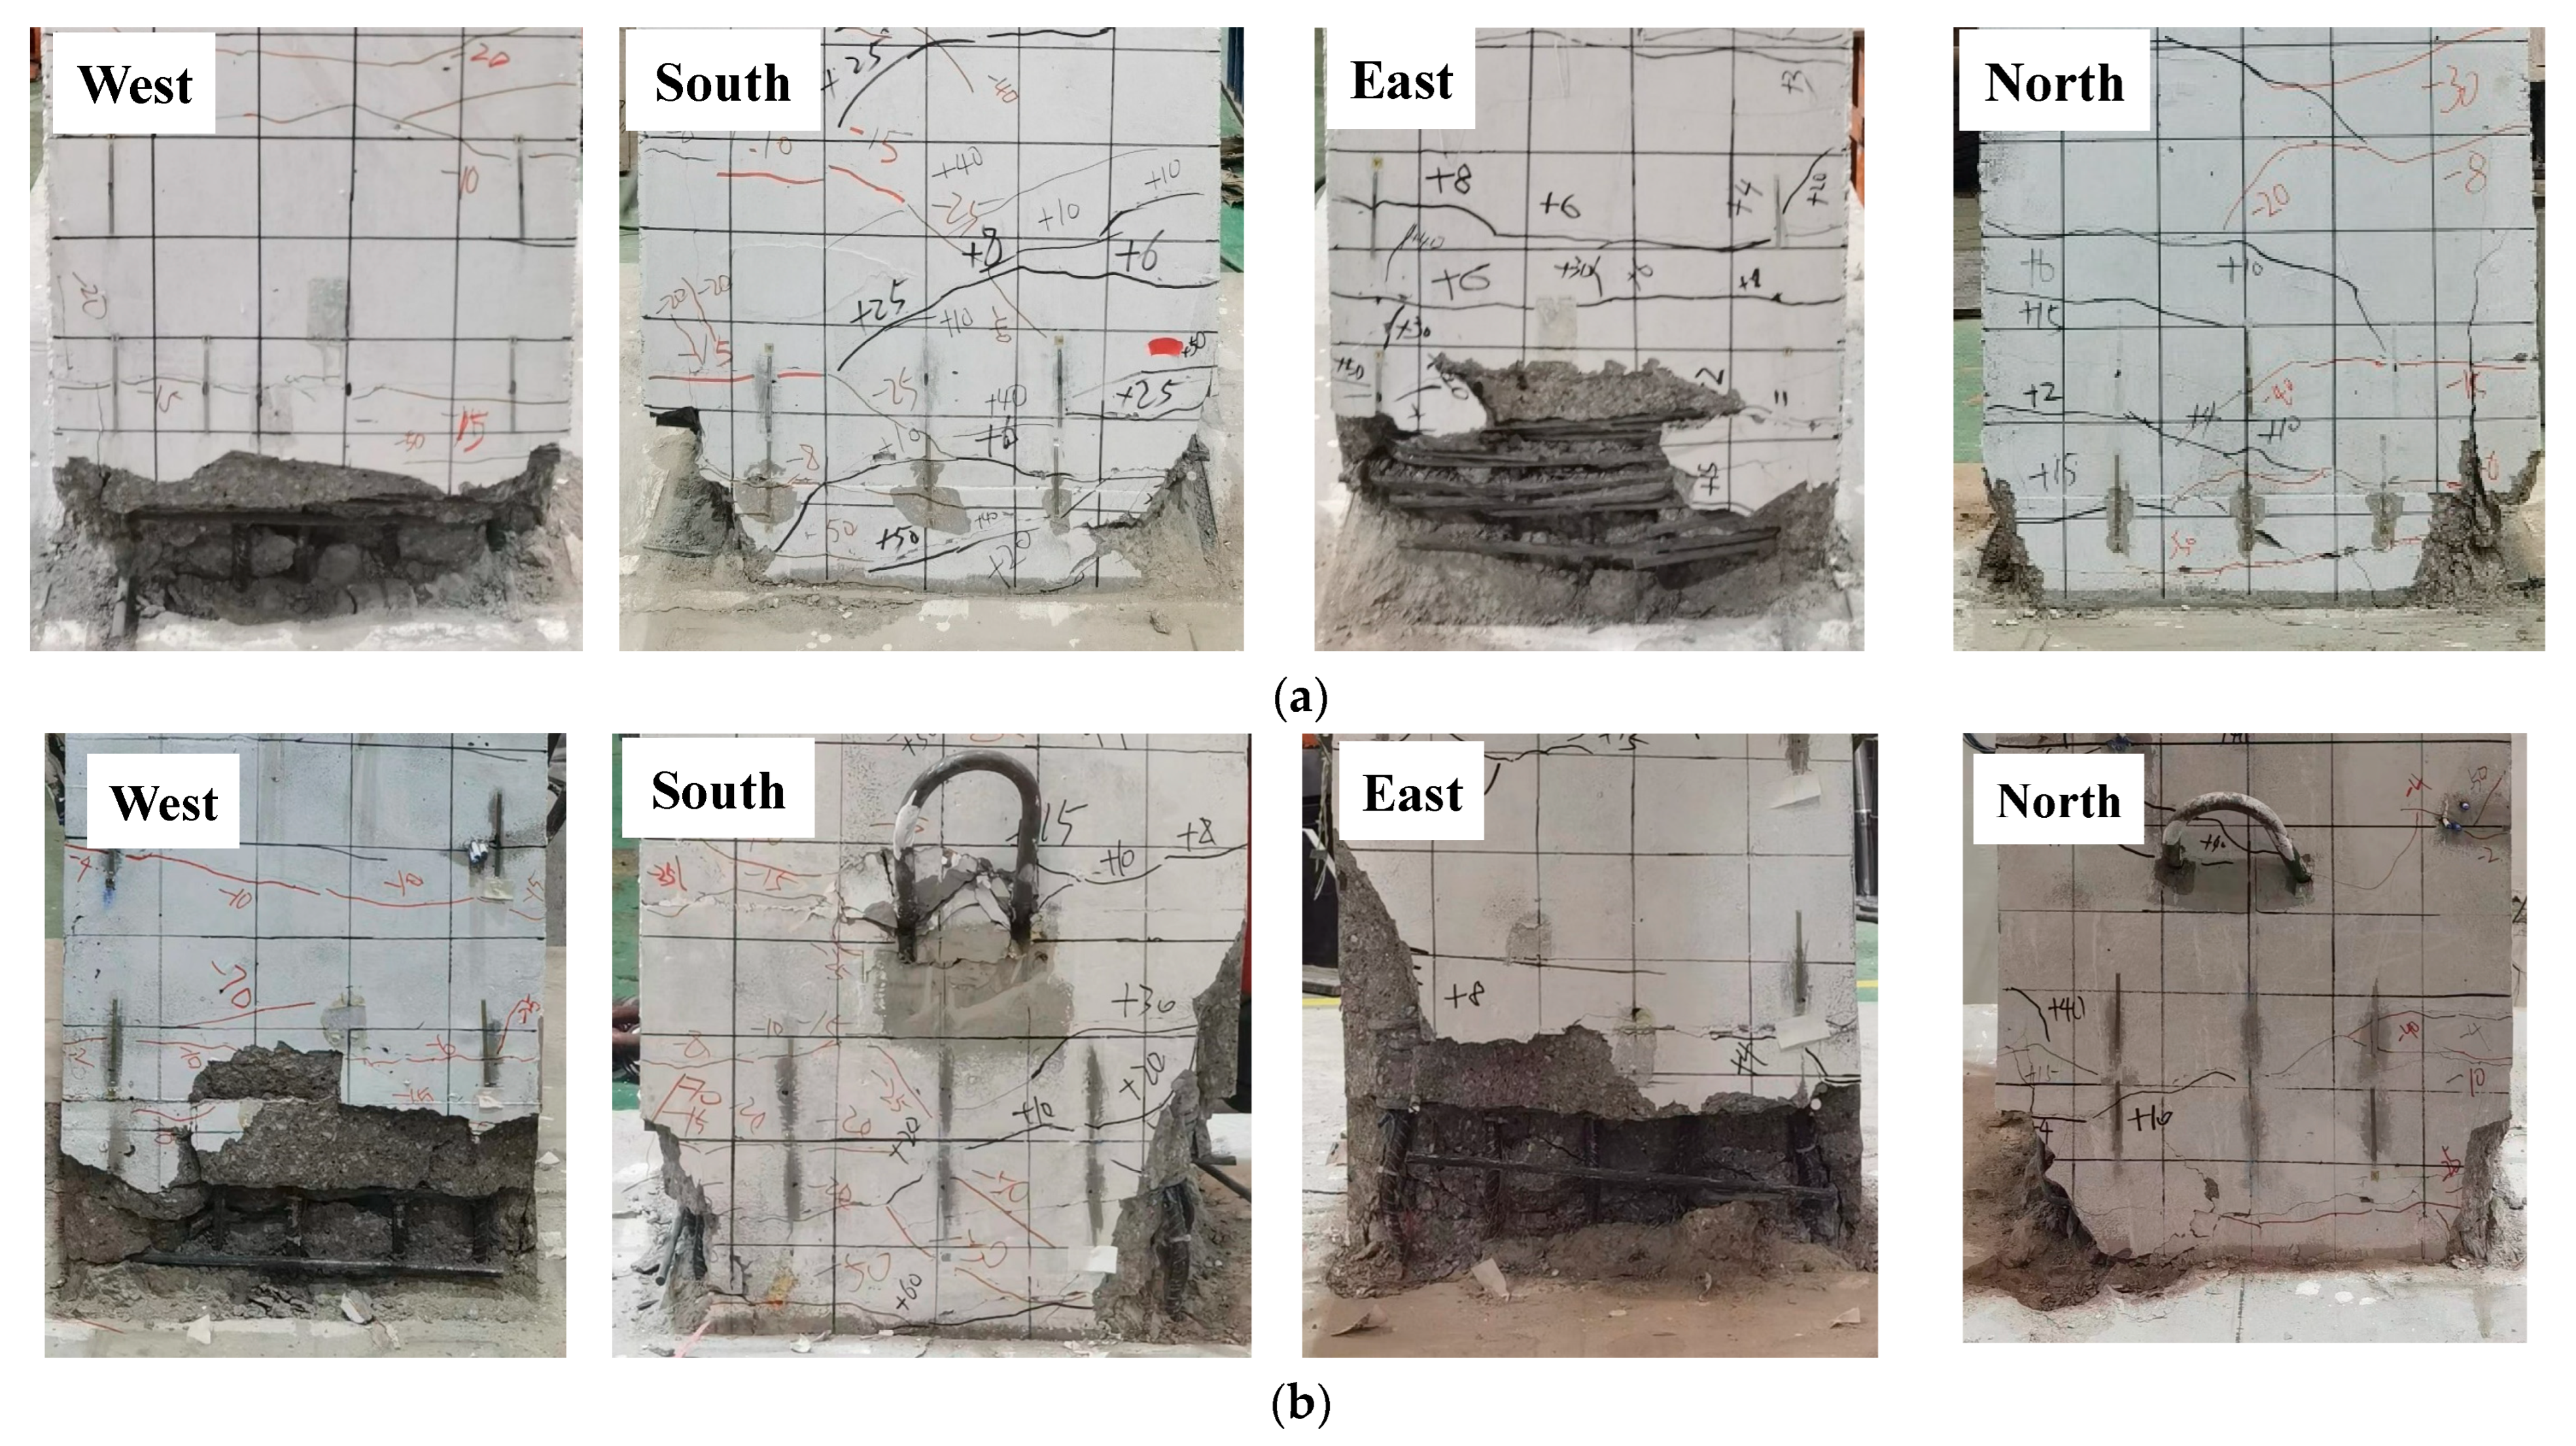
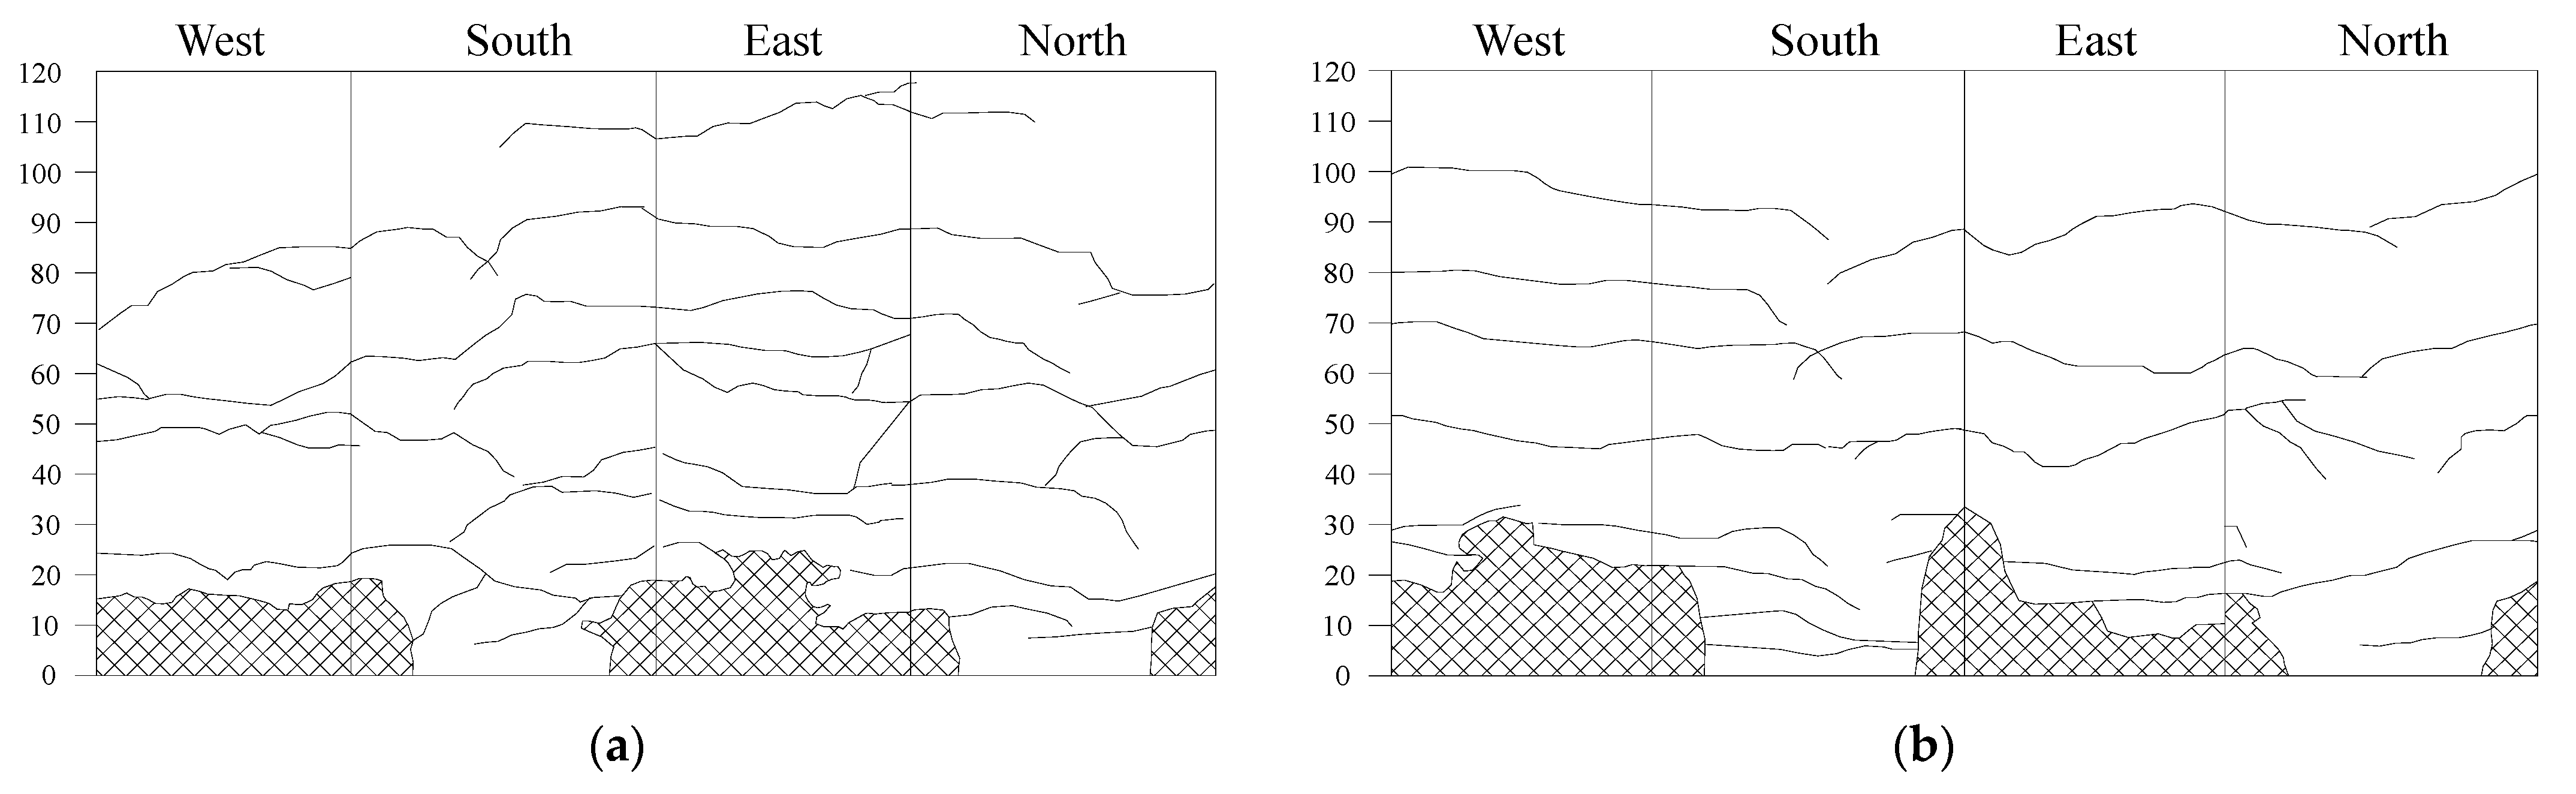
The first crack in the PSC specimen appeared on the top of the column, and the failure state showed widespread spalling of the concrete and exposure of the stirrup in the plastic hinge area. However, due to the existence of wet joints in the PSC specimen, wet joints were damaged or even spalled during the loading process.
(2)
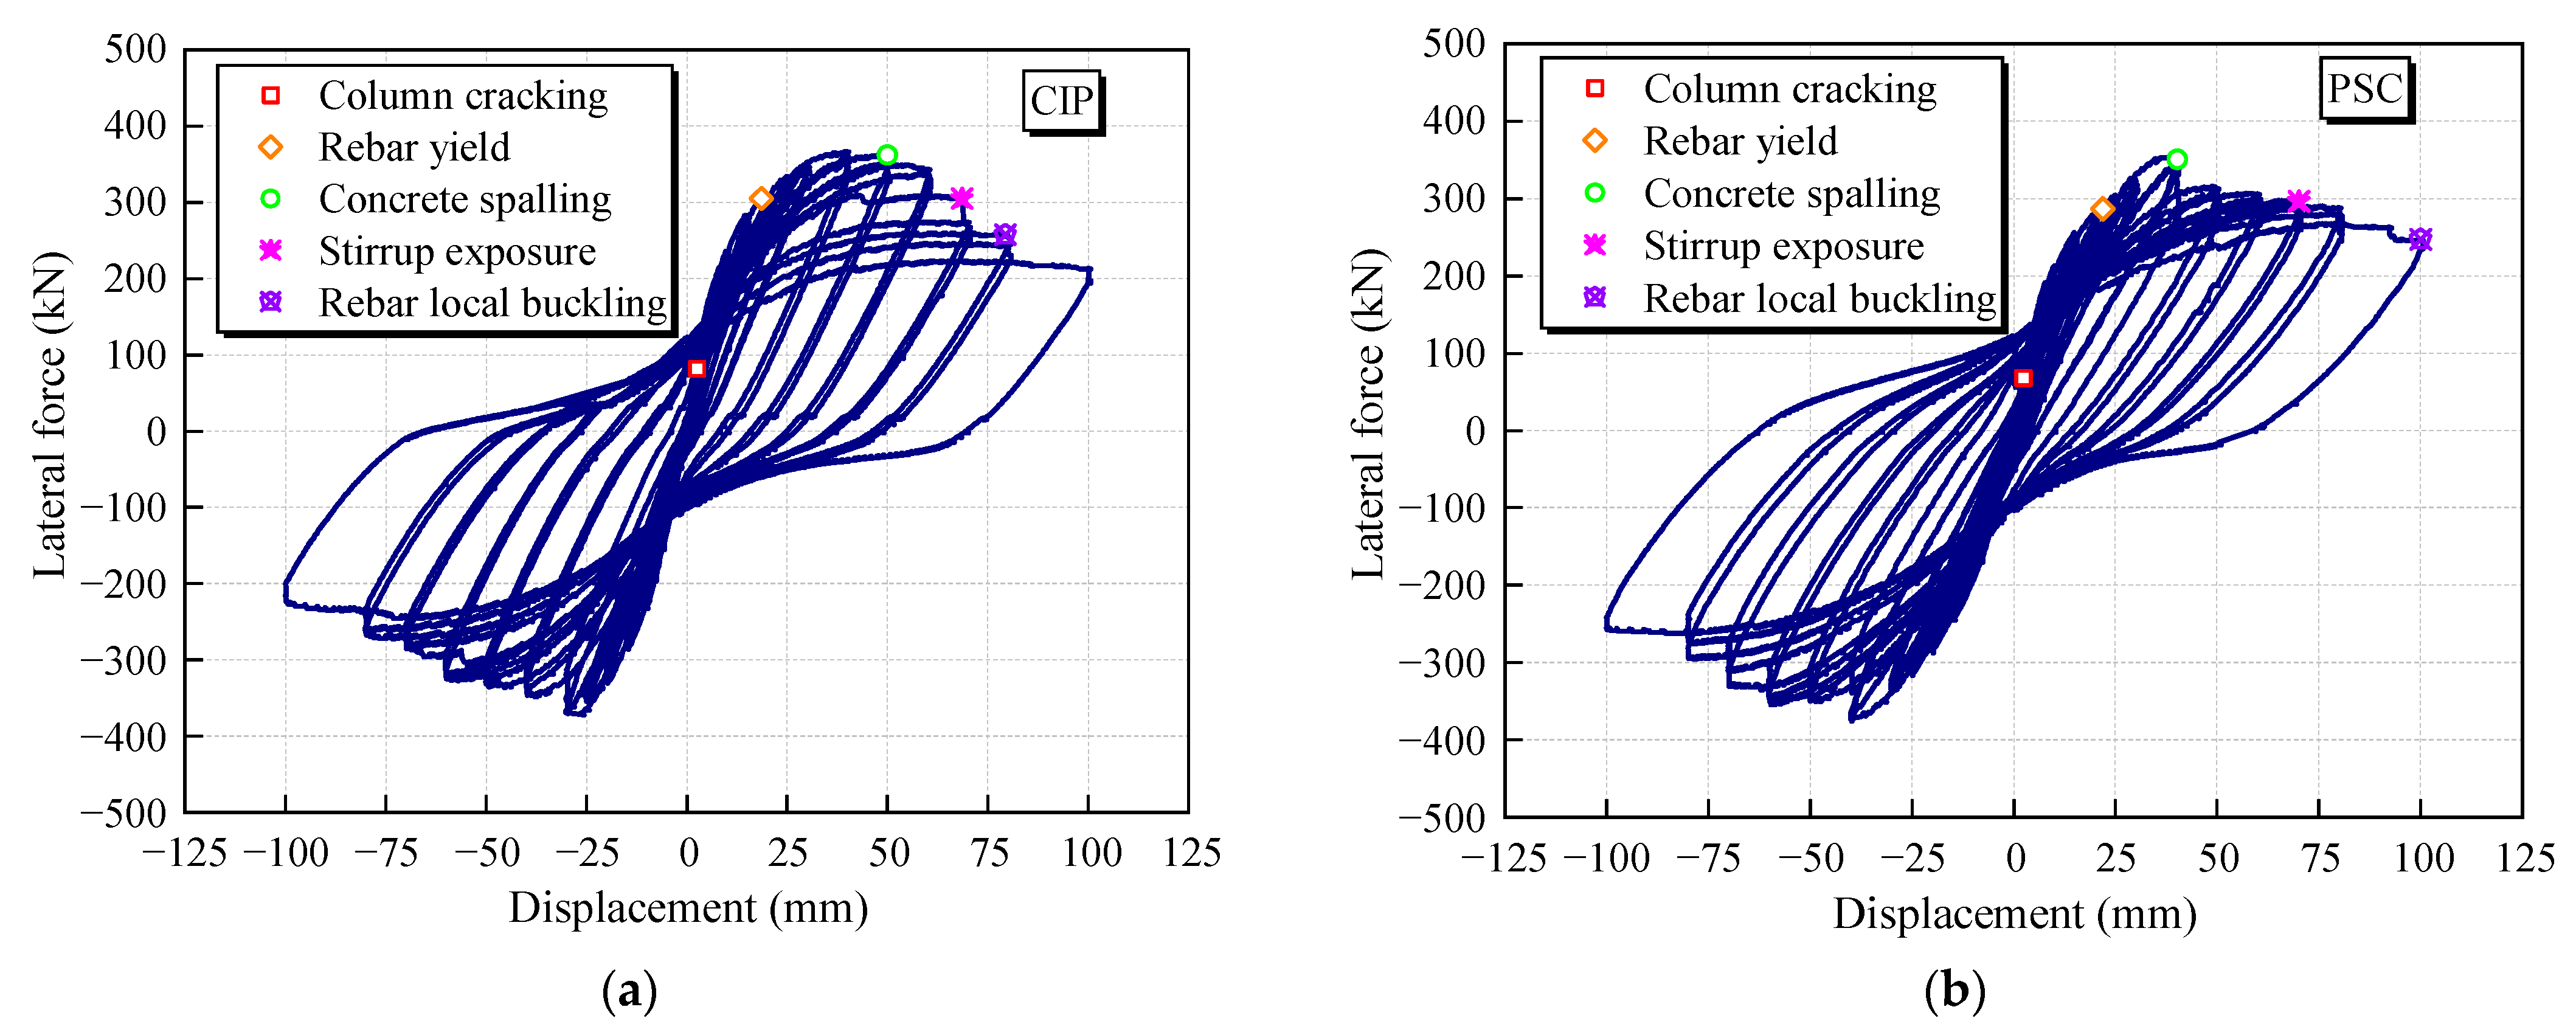
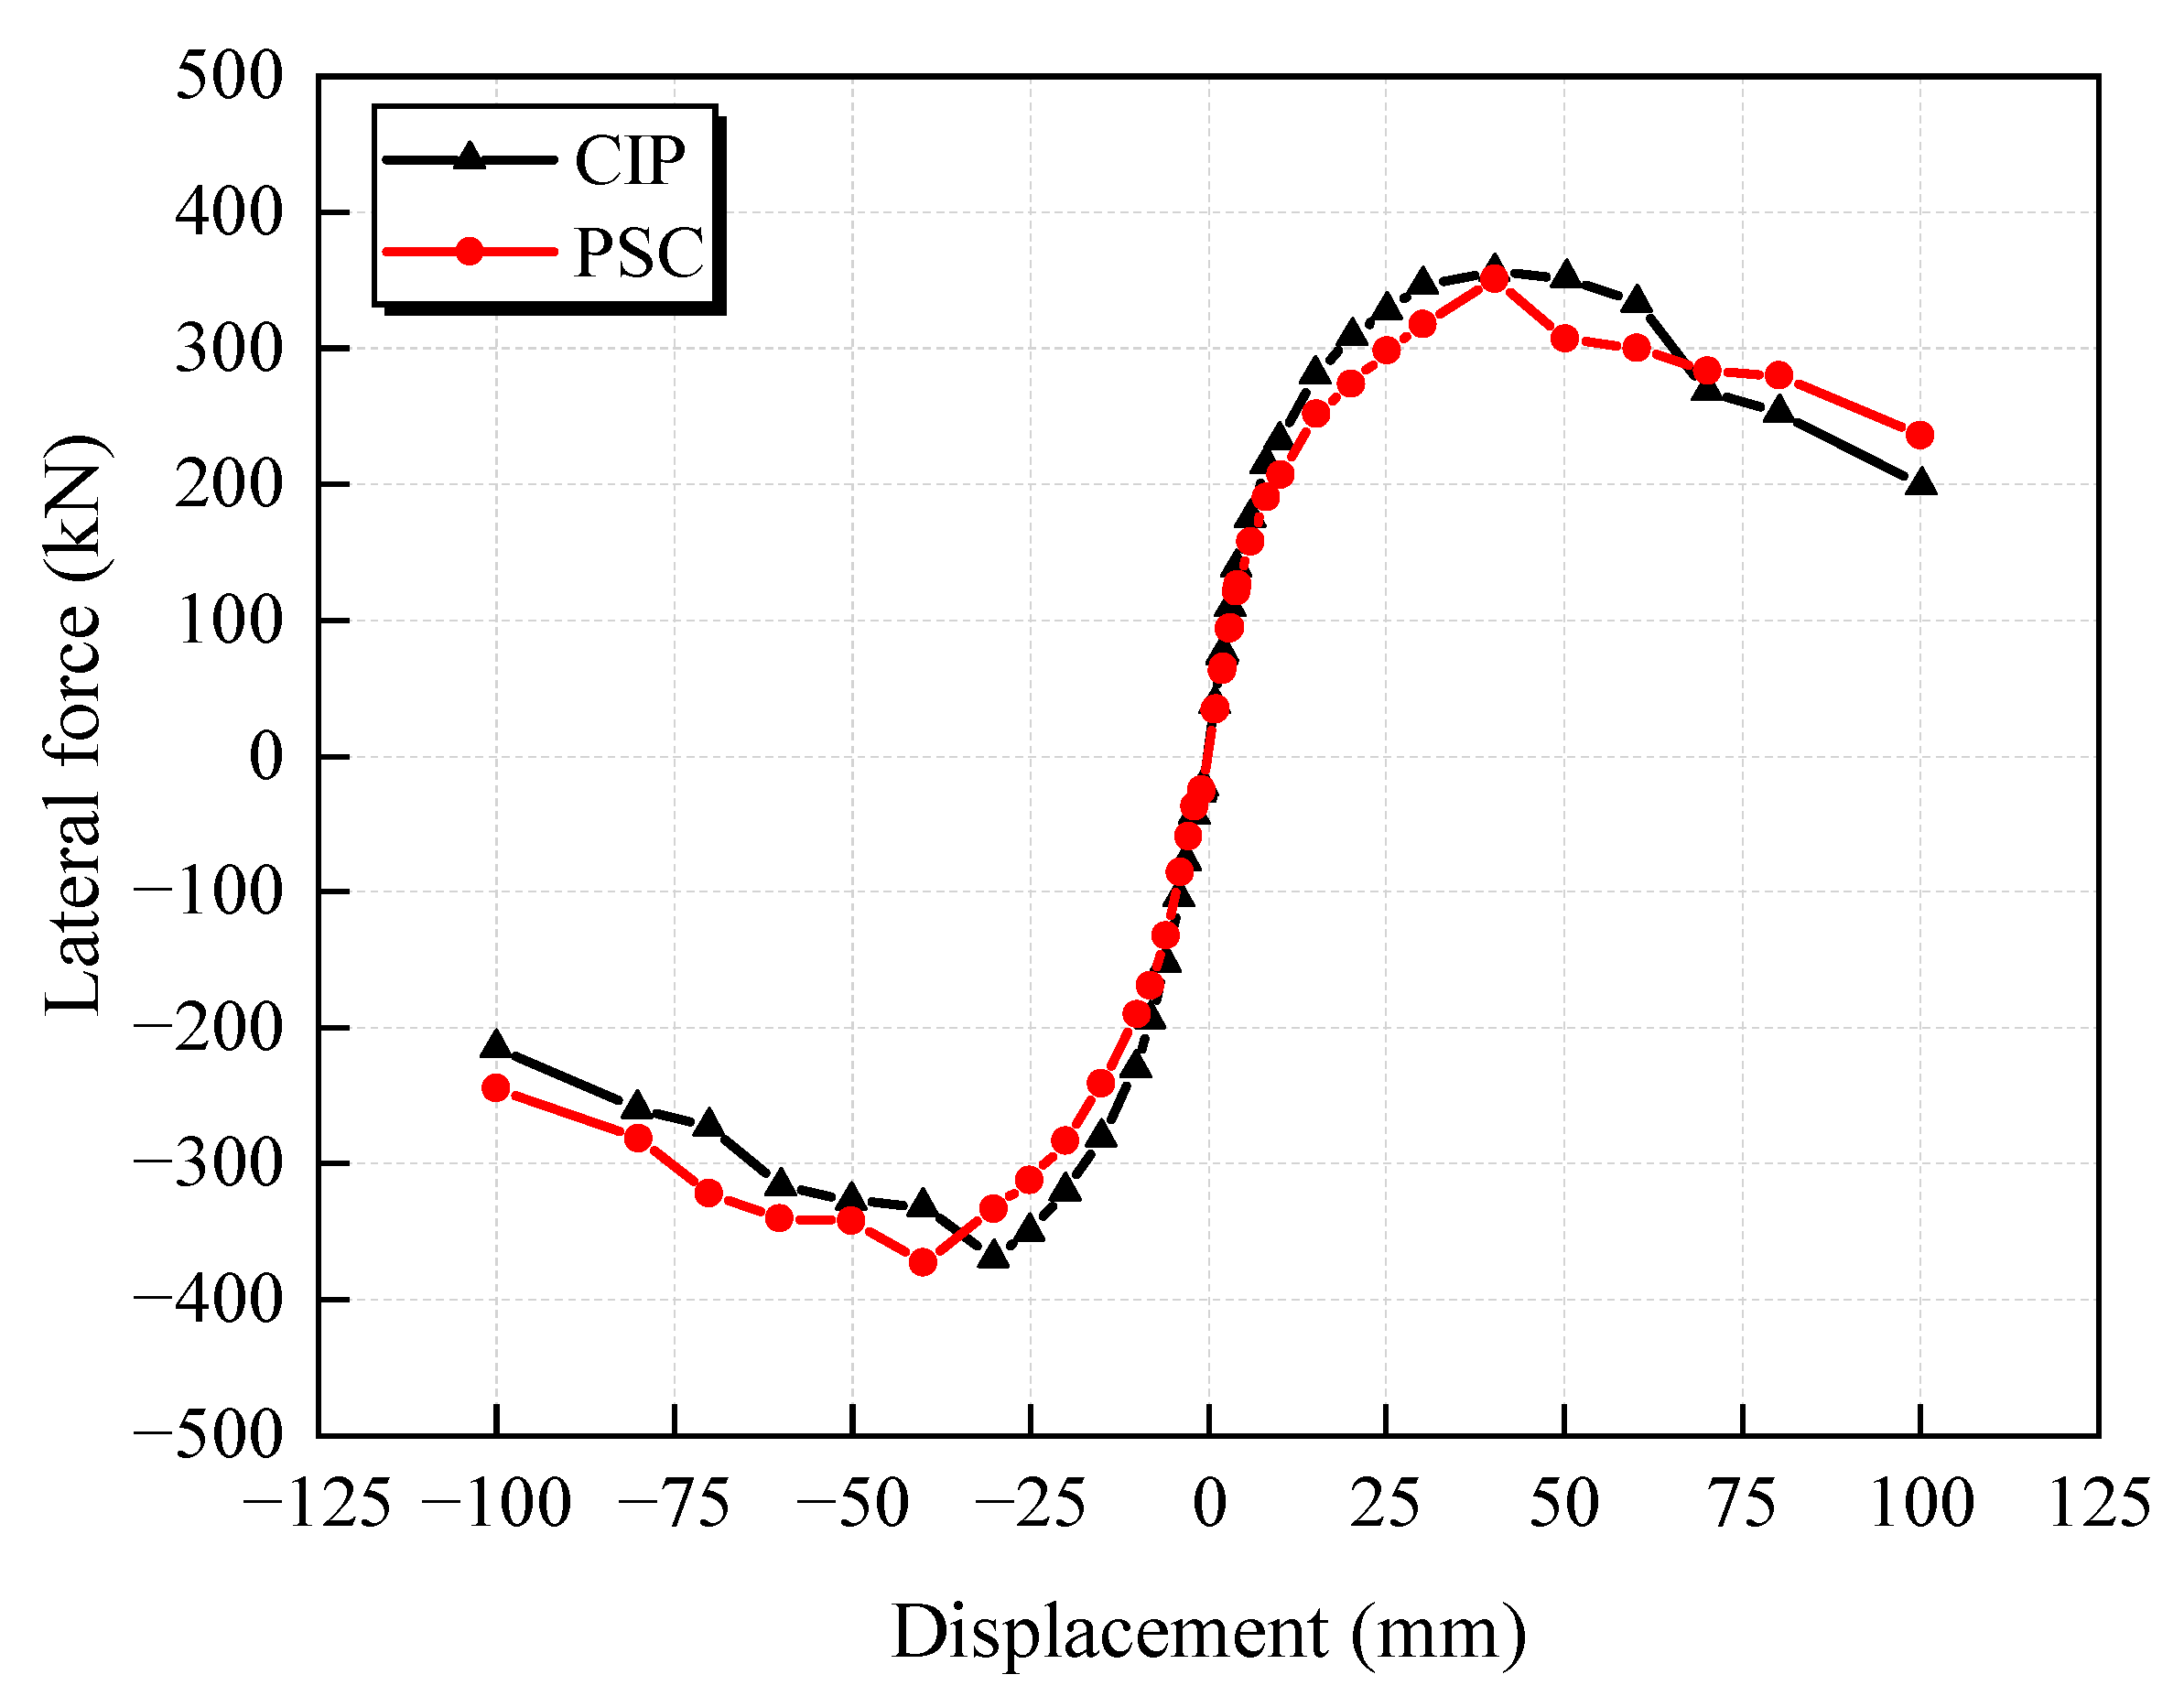
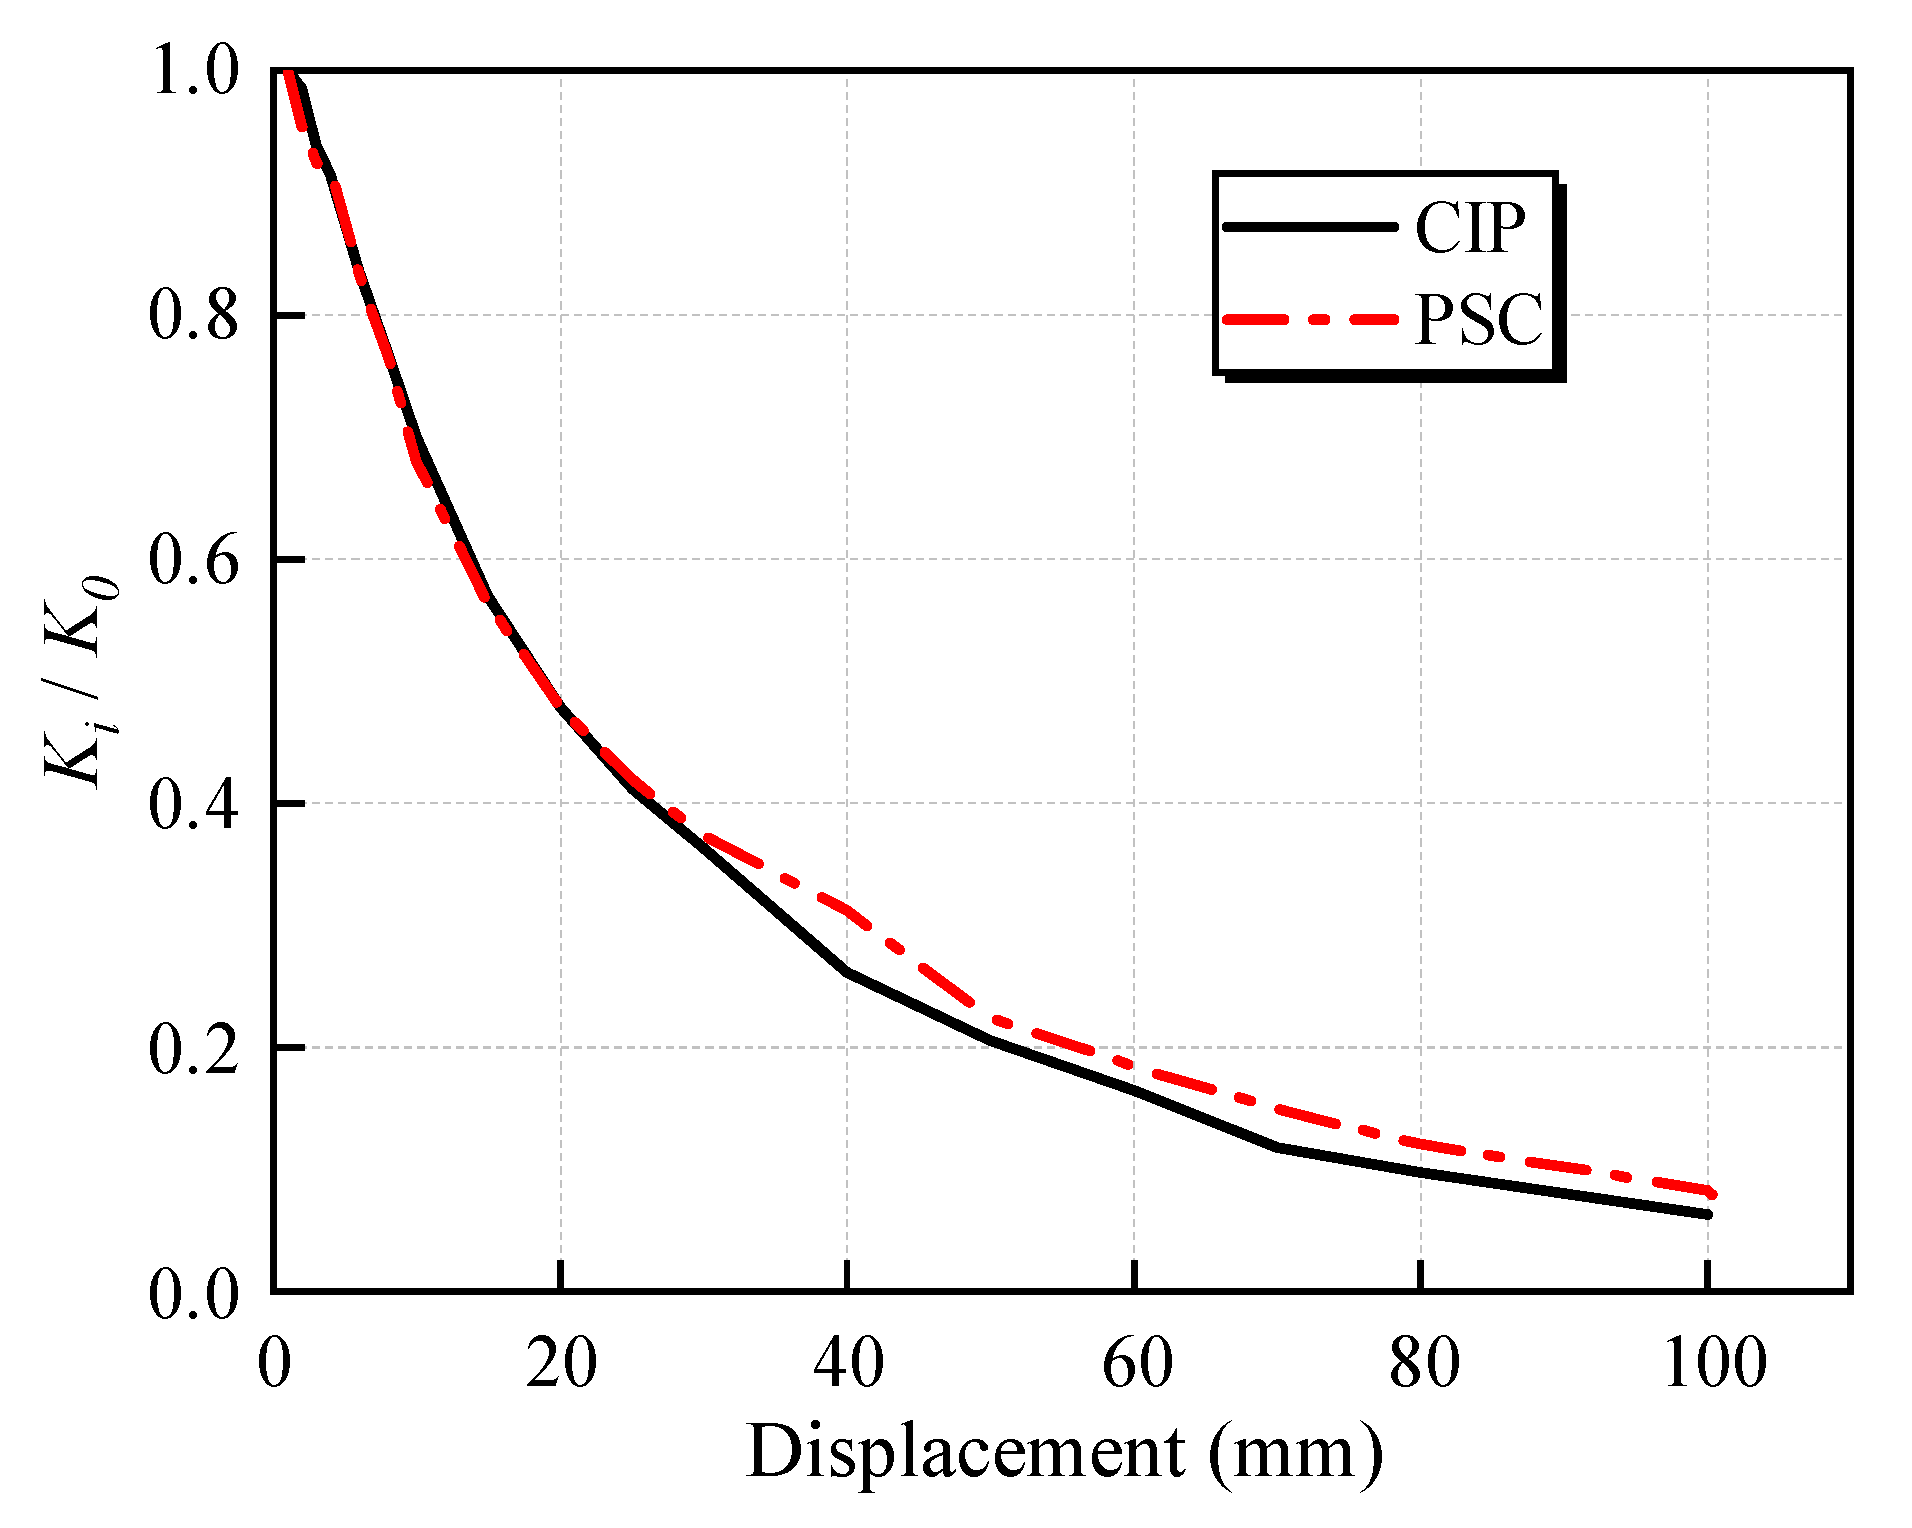
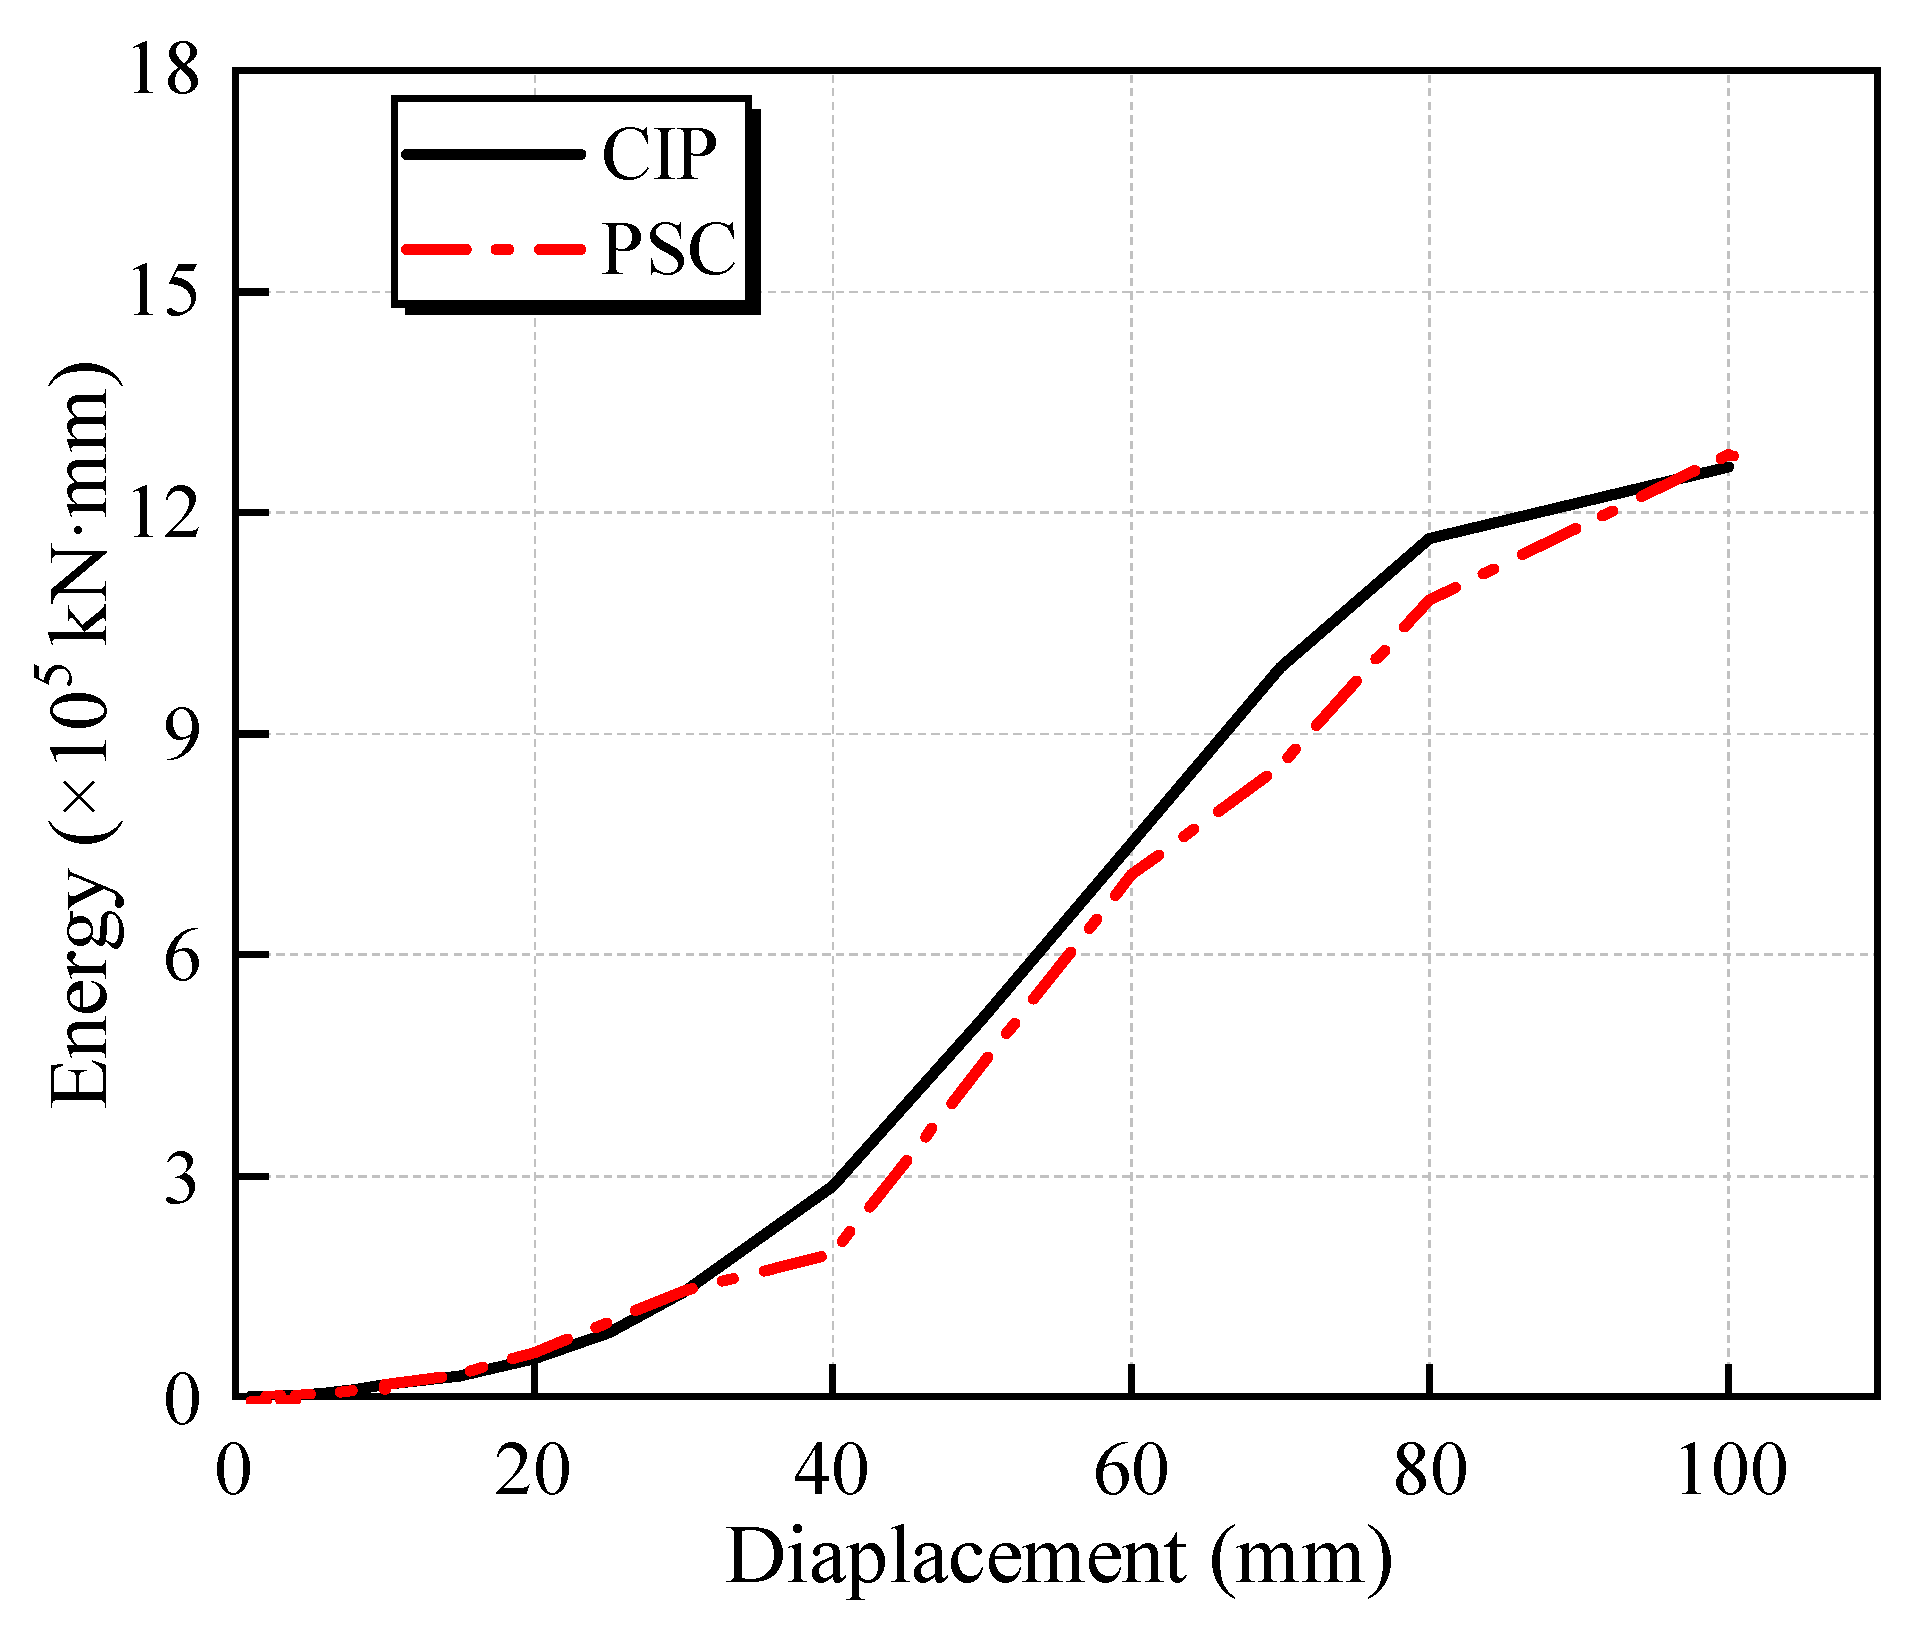
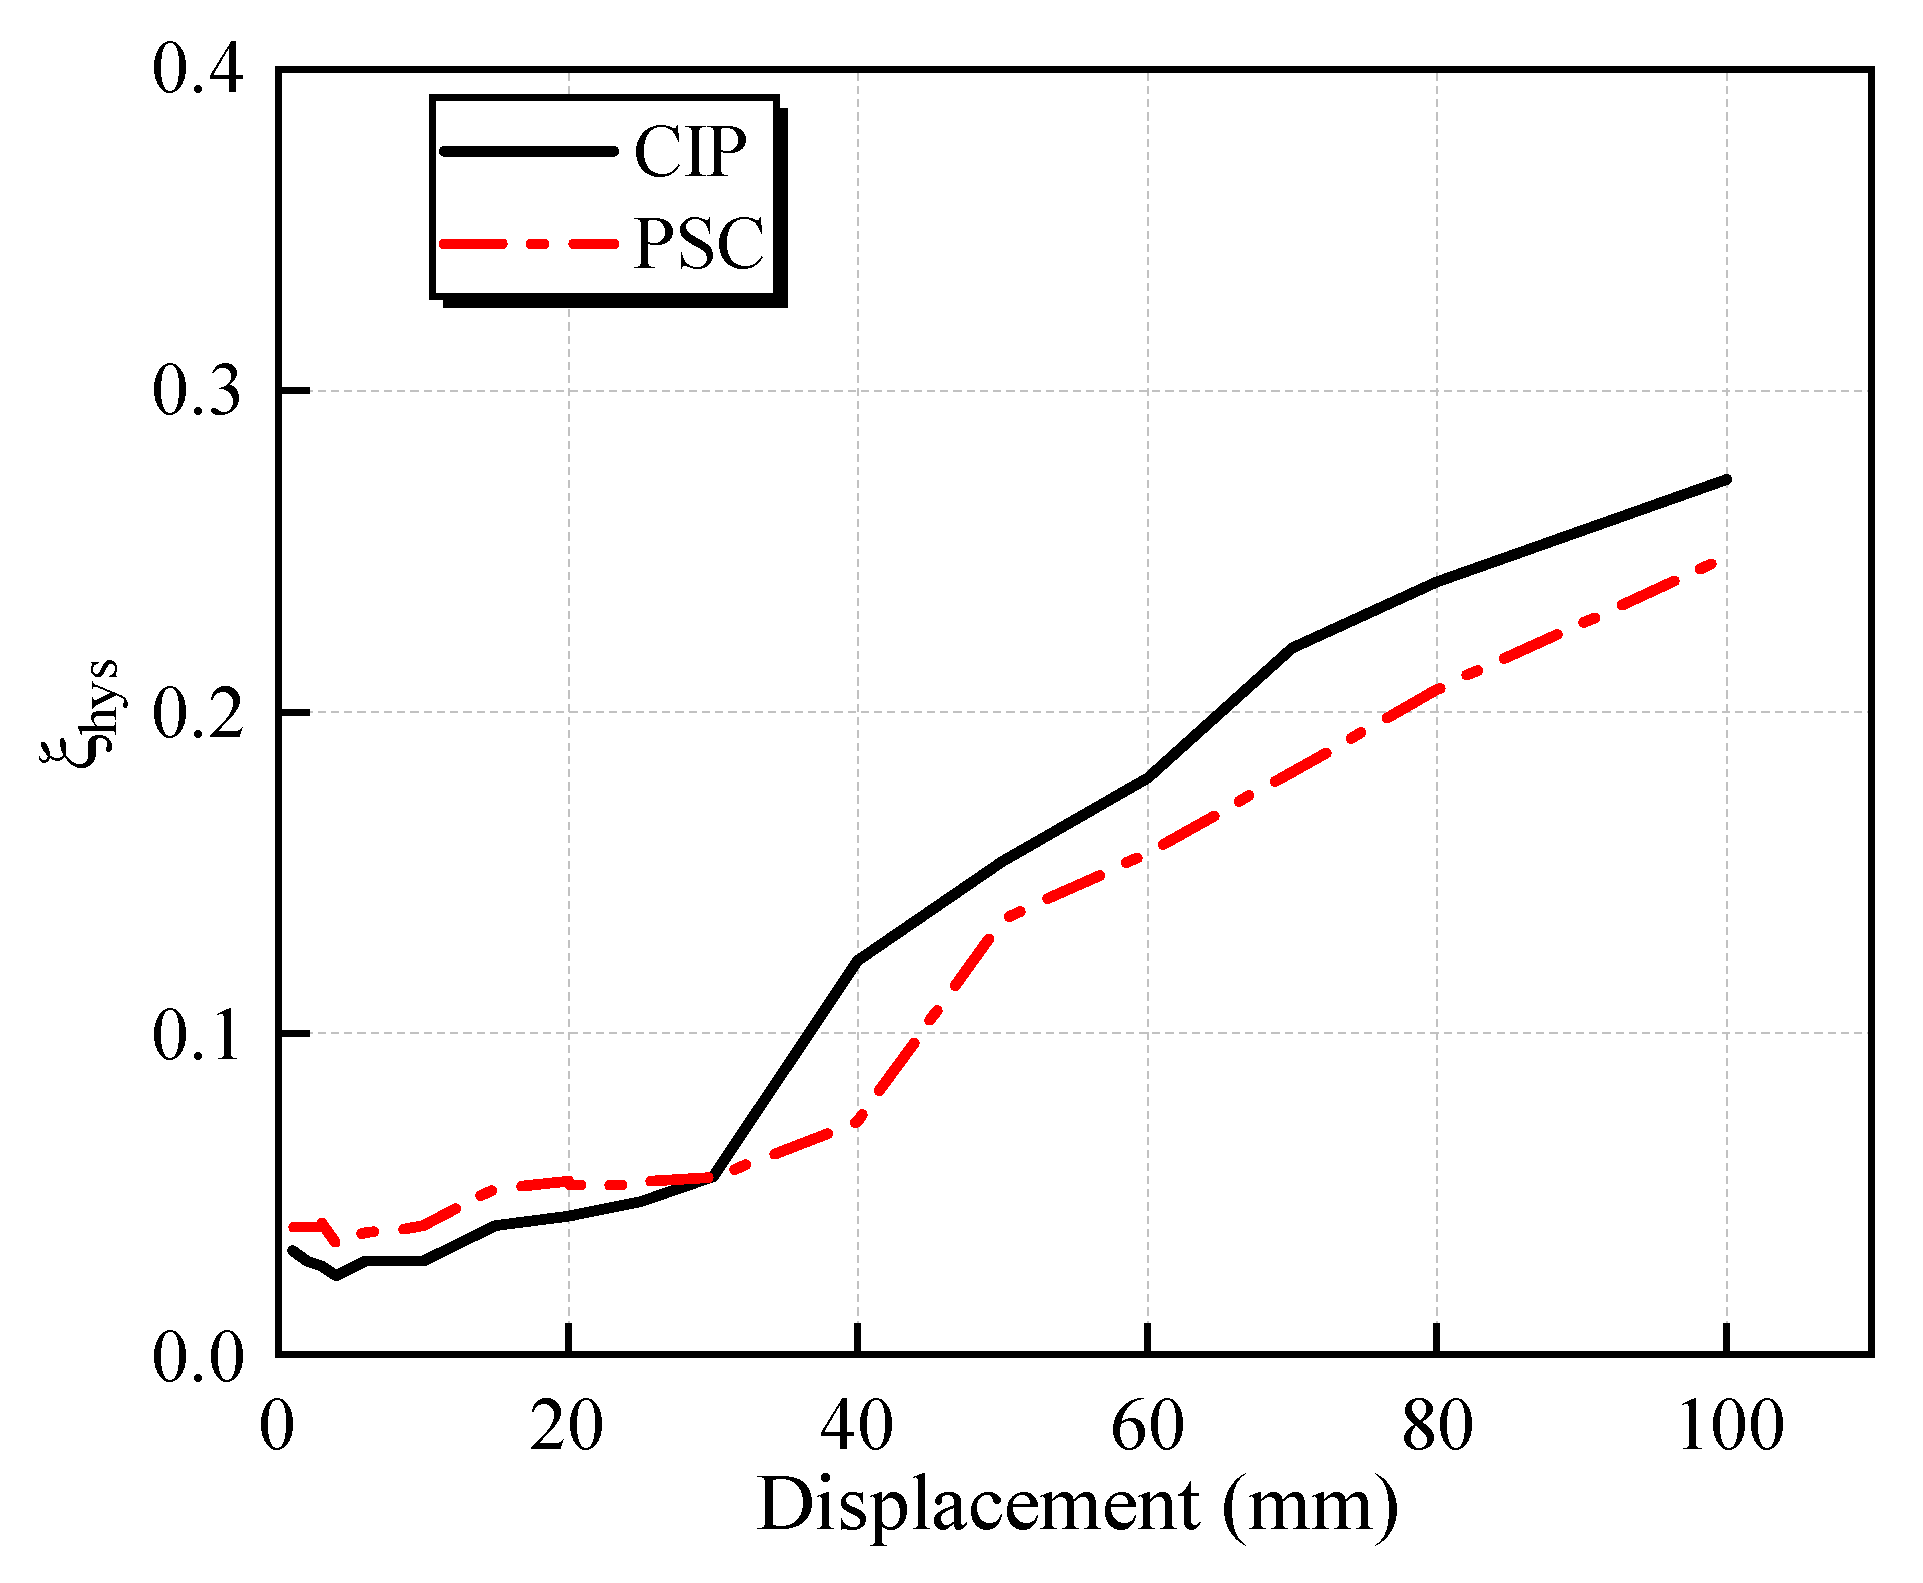
The PSC specimen peak load Fp was 354.78 kN, the residual displacement maximum was 59.2 mm, the maximum equivalent viscous damping coefficient ξhys was 0.248 and the ductility coefficient was 3.04. These parameters were slightly lower than those of the CIP specimen. The accumulated energy dissipation capacity and stiffness degradation pattern of the PSC and CIP specimens were basically the same.
(3)
The yielding section of the PSC specimen’s reinforcement was concentrated within the range of 0–15 cm from the top of the column. This occurred because the wet joint of the PSC specimen was peeled off, causing the yielding section of the longitudinal reinforcement to concentrate on the top of the column instead of extending downward, resulting in concentration of the plastic hinge region.
(4)
A fiber-based finite element model was proposed considering the bond slip between the connected reinforcement and wet joint concrete, which could predict global seismic responses in precast RC columns.
In summary, the PSC specimen had comparable seismic performance to the CIP specimen and could be effective in medium and high seismic areas. Additionally, to improve the performance of precast bridge pier connections, it is recommended to use self-compacting concrete with a higher grade than used in the precast elements for wet joints.

Author Contributions

Conceptualization, W.L.; methodology, W.L.; validation, W.P.; formal analysis, W.P. and F.L.; investigation, W.P. and F.L.; resources, W.L. and S.L.; data curation, W.P.; writing—original draft preparation, W.P.; writing—review and editing, W.P. and W.L.; visualization, W.P.; supervision, L.X. and Y.L.; project administration, L.X. All authors have read and agreed to the published version of the manuscript.

Funding

The research was funded by the financial support provided by the Key Project of Beijing Construction Engineering Group (Grant No. RGGA501020200001), and the Technology innovation project of Beijing Municipal Road & Bridge Group Co., Ltd.: 2020-08.

Data Availability Statement

The data provided in this study could be released upon reasonable request.

Acknowledgments

The authors gratefully acknowledge support from the Key Project of Beijing Construction Engineering Group (Grant No. RGGA501020200001) and the Technology innovation project of Beijing Municipal Road & Bridge Group Co., Ltd.: 2020-08.

Conflicts of Interest

The authors declare no conflict of interest.

References

  1. Khaleghi, B.; Schultz, E.; Seguirant, S.; Marsh, L.; Haraldsson, O.; Eberhard, M.; Stanton, J. Accelerated bridge construction in Washington state: From research to practice. PCI J. 2012, 57, 34–49. [Google Scholar] [CrossRef]
  2. Mehrsoroush, A.; Saiidi, M.S.; Ryan, K. Development of Earthquake-Resistant Precast Pier Systems for Accelerated Bridge Construction in Nevada; Department of Transportation: Carson City, NV, USA, 2017. [Google Scholar]
  3. Hewes, J.T. Seismic Design and Performance of Precast Concrete Segmental Bridge Columns; University of California: San Diego, CA, USA, 2002. [Google Scholar]
  4. Yamashita, R.; Sanders, D.H. Seismic performance of precast unbonded prestressed concrete columns. ACI Struct. J. 2009, 106, 821–830. [Google Scholar]
  5. Lu, W.; Peng, W.Q.; Zhu, L.; Gao, C.; Tang, Y.D.; Zhou, Y.W.; Su, W.; Zeng, B. Experimental and numerical study of static behavior of precast segmental hollow bridge piers. Materials 2022, 15, 6991. [Google Scholar] [CrossRef]
  6. Pang, J.B.; Steuck, K.P.; Cohagen, L.; Eberhard, M.O.; Stanton, J.F. Rapidly Constructible Large-Bar Precast Bridge-Bent Connection; Research Report Agreement T4118-05; Washington State Transportation Center (TRAC), University of Washington: Seattle, WA, USA, 2008. [Google Scholar]
  7. Steuck, K.P.; Pang, J.B.; Eberhard, M.O.; Stanton, J.F. Anchorage of Large-Diameter Reinforcing Bars Grouted into Ducts; Washington State Transportation Center (TRAC), University of Washington: Seattle, WA, USA, 2007. [Google Scholar]
  8. Haber, Z.B.; Saiidi, M.S.; Sanders, D.H. Seismic performance of precast columns with mechanically spliced column-footing connections. ACI Struct. J. 2014, 111, 639–650. [Google Scholar] [CrossRef]
  9. Ameli, M.J.; Parks, J.E.; Brown, D.N.; Pantelides, C.P. Seismic evaluation of grouted splice sleeve connections for reinforced precast concrete column-to-cap beam joints in accelerated bridge construction. PCI J. 2015, 60, 80–103. [Google Scholar] [CrossRef]
  10. Li, T.; Qu, H.; Wang, Z. Seismic performance of precast concrete bridge columns with 16 quasi-static cyclic shear test for high seismic zones. Eng. Struct. 2018, 166, 441–453. [Google Scholar] [CrossRef]
  11. Liu, Y.; Li, X.; Zheng, X.; Song, Z. Experimental study on seismic response of precast bridge piers with double-grouted sleeve connections. Eng. Struct. 2020, 221, 111023. [Google Scholar] [CrossRef]
  12. Wang, H.; Liang, R.; Li, J.; Liu, J.; Li, H.; Hu, X.; Zhu, K. Anchorage performance of grouted corrugated duct connection under monotonic loading: Experimental and numerical investigation. Constr. Build Mater. 2022, 329, 127096. [Google Scholar] [CrossRef]
  13. Xu, Y.; Wei, K.; Zhang, Z.; Wang, J.; Mao, H.; Fu, W. Seismic behavior of precast bridge column–cap beam joints with grouted corrugated duct connections: Experimental and numerical study. J. Bridge Eng. 2023, 28, 4022153. [Google Scholar] [CrossRef]
  14. Mantawy, I.M.; Sanders, D.H.; Eberhard, M.O.; Stanton, J.F. Modelling of debonded reinforcement in ABC connections designed for seismic zones. Eng. Struct. 2019, 198, 109351. [Google Scholar] [CrossRef]
  15. Wang, Z.; Li, T.; Qu, H.; Wei, H.; Li, Y. Seismic performance of precast bridge columns with socket and pocket connections based on quasi-static cyclic tests: Experimental and Numerical Study. J. Bridge Eng. 2019, 24, 4019105. [Google Scholar] [CrossRef]
  16. Ziehl, P.H.; Caicedo, J.M.; Rizos, D.C.; Mays, T.; Larosche, A.; ElBatanouny, M.K.; Mustain, B. Behavior of Pile to Bent Cap Connections Subjected to Seismic Forces; Deptartment of Civil & Environmental Engineering, University of South Carolina: Columbia, SC, USA, 2012. [Google Scholar]
  17. Larosche, A.; Ziehl, P.; ElBatanouny, M.K.; Caicedo, J. Plain pile embedment for exterior bent cap connections in seismic regions. J. Bridge Eng. 2014, 19, 4013016. [Google Scholar] [CrossRef]
  18. Zhang, G.; Han, Q.; Xu, K.; Du, X.; He, W. Quasi-static tests of CFST embedded RC column-to-precast cap beam with socket connection. Eng. Struct. 2021, 241, 112443. [Google Scholar] [CrossRef]
  19. Shen, Y.; Freddi, F.; Li, J. Experimental and numerical investigations of the seismic behavior of socket and hybrid connections for PCFT bridge columns. Eng. Struct. 2022, 253, 113833. [Google Scholar] [CrossRef]
  20. Jones, J.; Shoushtari, E.; Saiidi, M.S.; Itani, A. Comparison of seismic performance of socket and pocket connections for reinforced concrete bridge column base hinges. Transp. Res. Rec. 2020, 2674, 349–360. [Google Scholar] [CrossRef]
  21. Zhang, G.; Han, Q.; Xu, K.; Du, X.; He, W. Experimental investigation of seismic behavior of UHPC-filled socket precast bridge column-foundation connection with shear keys. Eng. Struct. 2021, 228, 111527. [Google Scholar] [CrossRef]
  22. Xu, Y.; Zeng, Z.; Wang, Z.; Ge, J. Experimental studies of embedment length of precast bridge pier with socket connection to pile cap. Eng. Struct. 2021, 233, 111906. [Google Scholar] [CrossRef]
  23. Cheng, Z.; Liu, D.; Li, S.; Wang, J.; Zhang, J. Performance characterization and design recommendations of socket connections for precast columns. Eng. Struct. 2021, 242, 112537. [Google Scholar] [CrossRef]
  24. Zou, S.; Zhang, C.B.; Wenliuhan, H.S.; Yang, Z.Y.; Liu, Y.H.; Zhai, Z.P.; Feng, H. Seismic performance of precast hollow concrete bridge double columns with shallow socket connection. Soil Dyn. Earthq. Eng. 2023, 171, 107957. [Google Scholar] [CrossRef]
  25. Canha, R.M.F.; Ebeling, E.B.; de Cresce, E.l.; Debs, A.L.H.; El Debs, M.K. Analysing the base of precast column in socket foundations with smooth interfaces. Mater. Struct. 2009, 42, 725–737. [Google Scholar] [CrossRef]
  26. Restrepo, J.I.; Tobolski, M.J.; Matsumoto, E.E. Development of a Precast Bent Cap System for Seismic Regions; NCHRP Report; Transportation Research Board: Washington, DC, USA, 2011. [Google Scholar]
  27. GB 50011-2010; Code for Seismic Design of Buildings. China Architecture and Building Press: Beijing, China, 2010.
  28. ASTM A370-22; American Society for Testing and Materials Committee A-01 on Steel, Stainless Steel and Related Alloys. Standard Test Methods and Definitions for Mechanical Testing of Steel Products; ASTM International: West Conshohocken, PA, USA, 2017.
  29. China Academy of Building Research. Specification for Mix Proportion Design of Ordinary Concrete; China Architecture & Building Press: Beijing, China, 2011. [Google Scholar]
  30. GB/T 50081-2002; Standard for Test Method of Mechanical Properties on Ordinary Concrete. Ministry of Construction of the People’s Republic of China: Beijing, China, 2002.
  31. Imbsen, R.A. Recommend LRFD Guidelines for the Seismic Design of Highway Brides; American Association of State Highway and Transportation Officials: Washington, DC, USA, 2006. [Google Scholar]
  32. Su, J.; Wang, J.; Li, Z.; Liang, X. Effect of reinforcement grade and concrete strength on seismic performance of reinforced concrete bridge piers. Eng. Struct. 2019, 198, 109512. [Google Scholar] [CrossRef]
  33. Ma, C.; Jiang, H.; Wang, Z. Experimental investigation of precast RC interior beam-column-slab joints with grouted spiral-confined lap connection. Eng. Struct. 2019, 196, 109317. [Google Scholar] [CrossRef]
  34. Park, R. Evaluation of ductility of structures and structural assemblages from laboratory testing. Bull. N. Z. Natl. Soc. Earthq. Eng. 1989, 22, 155–166. [Google Scholar] [CrossRef]
  35. Rodrigues, H.; Furtado, A.; Arêde, A. Experimental evaluation of energy dissipation and viscous damping of repaired and strengthened RC columns with CFRP jacketing under biaxial load. Eng. Struct. 2017, 145, 162–175. [Google Scholar] [CrossRef]
  36. Ou, Y.C.; Wang, P.H.; Tsai, M.S.; Chang, K.C.; Lee, G.C. Large-scale experimental study of precast segmental unbonded posttensioned concrete bridge columns for seismic regions. J. Struct. Eng. 2010, 136, 255–264. [Google Scholar] [CrossRef]
  37. Melo, J.; Fernandes, C.; Varum, H.; Rodrigues, H.; Costa, A.; Arêde, A. Numerical modelling of the cyclic behaviour of RC elements built with plain reinforcing bars. Eng. Struct. 2011, 33, 273–286. [Google Scholar] [CrossRef]
  38. Scott, B.D.; Park, R.; Priestley, M.J.N. Stress-strain behavior of concrete confined by overlapping hoops at low and high strain rates. J. Proc. 1982, 79, 13–27. [Google Scholar]
  39. Mander, J.B.; Priestley, M.J.N.; Park, R. Theoretical stress-strain model for confined concrete. Struct. Eng. 1988, 114, 1804–1826. [Google Scholar] [CrossRef]
  40. Paulay, T.; Priestley, M.J.N. Seismic Design of Reinforced Concrete and Masonry Buildings; Wiley: New York, NY, USA, 1992. [Google Scholar]
  41. Han, Q.; Zhou, Y.; Dum, X.; Huang, C.; Lee, G.C. Experimental and numerical studies on seismic performance of hollow RC bridge columns. Earthq. Struct. 2014, 7, 251–269. [Google Scholar] [CrossRef]
  42. Zhao, J.; Sritharan, S. Modeling of strain penetration effects in fiber-based analysis of reinforced concrete structures. ACI Struct. J. 2007, 104, 133. [Google Scholar]
  43. New Model Code Fib Special Activity Group; Taerwe, L.; Matthys, S. Fib Model Code for Concrete Structures 2010; Ernst & Sohn: Berlin, Germany, 2013. [Google Scholar]
Figure 1. Fabrication process for the PSC specimen.
Buildings 13 02367 g001
Figure 2. Construction process for the PSC specimen: (a) fabricating the reinforcement cage of the column; (b) installing strain gauges; (c) assembling framework; (d) casting concrete of the column and cap beam; (e) placing the column into the socket of the cap beam; (f) arranging the rebar splicing.
Buildings 13 02367 g002
Figure 3. Dimensional and structural details of the PSC specimen (unit: cm): (a) upper cap beam; (b) lower cap beam; (c) front view of the specimen; (d) precast column.
Buildings 13 02367 g003
Figure 4. Material properties test: (a) compression test of the concrete; (b) tensile test of the reinforcement.
Buildings 13 02367 g004
Figure 5. Test setup: (a) schematic drawing; (b) test photograph.
Buildings 13 02367 g005
Figure 6. Loading protocol (unit: mm).
Buildings 13 02367 g006
Figure 7. Strain gauge arrangement (unit: cm): (a) on the CIP; (b) on the PSC.
Buildings 13 02367 g007
Figure 8. Damage process in the specimens: (a) CIP specimen; (b) PSC specimen.
Buildings 13 02367 g008
Figure 9. Failure states: (a) CIP specimen; (b) PSC specimen.
Buildings 13 02367 g009
Figure 10. Crack distributions: (a) CIP specimen; (b) PSC specimen.
Buildings 13 02367 g010
Figure 11. Hysteresis curves: (a) CIP specimen; (b) PSC specimen.
Buildings 13 02367 g011
Figure 12. Backbone curve.
Buildings 13 02367 g012
Figure 13. Stiffness degradation.
Buildings 13 02367 g013
Figure 14. The R. Park method.
Buildings 13 02367 g014
Figure 15. Accumulated energy dissipation.
Buildings 13 02367 g015
Figure 16. Equivalent viscous damping ratio.
Buildings 13 02367 g016
Figure 17. Residual displacement.
Buildings 13 02367 g017
Figure 18. Longitudinal rebar strain development: (a) CIP specimen; (b) PSC specimen.
Buildings 13 02367 g018
Figure 19. Trends in longitudinal rebar strain development: (a) CIP specimen; (b) PSC specimen.
Buildings 13 02367 g019
Figure 20. Trends in strain development in horizontal and vertical steel bars.
Buildings 13 02367 g020
Figure 21. Numerical model.
Buildings 13 02367 g021
Figure 22. Constitutive material relationships of concrete: (a) Concrete 01; (b) Concrete 04.
Buildings 13 02367 g022
Figure 23. Constitutive material relationships of steel: (a) Steel 02; (b) Bond_SP01.
Buildings 13 02367 g023
Figure 24. Comparisons of hysteretic responses between FE numerical results and test results: (a) CIP specimen; (b) PSC specimen.
Buildings 13 02367 g024
Figure 25. Comparisons of backbone curves between FE numerical results and test results: (a) CIP specimen; (b) PSC specimen.
Buildings 13 02367 g025
Table 1. Details of the test specimens.
SpecimenConcreteReinforcementStirrupConnection Method
CIPC40HRB400HPB300Cast-in place
PSCC40HRB400HPB300Extended rebar socket
Table 2. Material properties of the reinforcement.
Materialsfy (MPa)fu (MPa)Es (GPa)
HRB400 (D = 16 mm)454.8638.8201
HPB300 (D = 10 mm)321.3435.6201
Note: fy is the yield strength, fu is the tensile strength, and Es is the Young’s modulus.
Table 3. Composition of C40 concrete.
MaterialWeight (kg/m3)
Cement371
Silica fume159
Fine sand877
Water158
Superplasticizer6.9
Coarse aggregate878
Table 4. Material properties of the concrete.
Sectionfc (MPa)fcu (MPa)Ec (GPa)
Cap beam and column45.652.333.8
Wet joint47.950.340.4
Note: fc is the axial compressive strength, fcu is the cube compressive strength, and Ec is the modulus of elasticity.
Table 5. Experimental results of the specimens.
SpecimenLoading
Direction
Δy
(mm)
Fy
(kN)
Δp
(mm)
Fp
(kN)
F p ¯
(kN)
Δu
(mm)
Fu
(kN)
μ μ ¯
CIPpositive18.130440366.5369.269.93311.53.863.63
negative18.5320.24037262.9316.23.4
PSCpositive22.4293.940354.8363.771.34301.53.183.04
negative25.6318.940372.674.6316.72.91
Notes: Δy is the yield displacement; Fy is the yield force; Fp is the peak force; F p ¯ is the average value of the positive and negative peak forces; Δu is the ultimate displacement; Fu is the ultimate force; μ = Δuy is the displacement ductility coefficient; μ ¯ is the average value of the positive and negative displacement ductility coefficients.
Table 6. Comparison of the peak load and initial stiffness.
SpecimenFtp (kN)Fnp (kN)Ftp/FnpKtin (mm)Knin (mm)Ktin/Knin
CIP366.5324.51.1325.3723.91.06
PSC354.8321.21.1021.7622.40.97
Average 1.12 1.02
Note: Ftp is the peak load obtained from the test; Fnp is the peak load obtained from the FE numerical simulation; Ktin is the initial stiffness obtained from the test; Knin is the initial stiffness obtained from the FE numerical simulation.
Disclaimer/Publisher’s Note: The statements, opinions and data contained in all publications are solely those of the individual author(s) and contributor(s) and not of MDPI and/or the editor(s). MDPI and/or the editor(s) disclaim responsibility for any injury to people or property resulting from any ideas, methods, instructions or products referred to in the content.

