1. Introduction
An excellent way to assess the quality of life (QoL) of families that have been displaced to make way for development projects, such as dams, mining, roads, and urban regeneration, who must subsequently live in resettlement communities is to look at how happy they are with their living situations. Residential satisfaction describes the degree to which residents are pleased with their residential neighborhood [
1]. Several studies show the link between residential satisfaction (RS) and QoL [
2,
3,
4,
5,
6,
7]. Fernández-Portero, Alarcón, and Barrios Padura [
5] found that the effect of the built environment on an individual’s QoL is directly related. The study further evaluates how a person’s subjective evaluations of their home, also called “residential satisfaction,” affect their QoL.
The effect of the RS of the affected families can be observed in both the quality of dwelling and the neighborhood of the resettlement. The quality of a living is determined by how well it serves a person’s basic needs [
8]. Similarly, Osman, Moustafa, and Fahmy [
9] opined that the quality of a housing’s surroundings begins with other factors, such as those that increase safety, regulate noise pollution, and provide sufficient daylight. When examining how RS influences the QoL of affected families, it is crucial to evaluate the inhabitants’ perceptions of the quality of the dwelling and its context [
10].
To establish a relationship between the quality of resettlement and the QoL of the affected families, it is essential to determine whether their residences match or exceed their requirements and goals. The findings of Xu Huang et al. [
11] confirmed that certain characteristics of residential architecture meet the demands and expectations of its occupants. Palimaru et al. [
12] asserted that housing quality is important in analyzing the factors that determine the QoL at the family level. However, they did not provide a comprehensive definition considering all indicators, such as health or leisure time. QoL depends, among other things, on the quality of the built environment and the daily activities of individuals that reflect the degree of dependence.
Overall, past research reveals the impact of built environment quality on RS and people’s perceptions of such characteristics in the context of meeting their cognitive and emotional requirements and expectations [
13,
14,
15,
16,
17]. Little research has been conducted on the relationship between these factors and mining-affected families’ QoL, which is affected by resettlement as a form of compensation for their displacement to make way for large-scale mining projects [
11,
18,
19,
20,
21]. It is no longer enough for the displaced, in this case, mining-affected families (MAFs), to have a high-quality resettlement (built environment); it is also necessary to analyze how these provisions affect their level of RS to provide a higher QoL to help them cope with the resettlement. This study, therefore, examines the mediation role of RS on the impact of resettlement on MAFs’ QoL in Ellembelle, Ghana.
2. Materials and Methods
2.1. Study Area
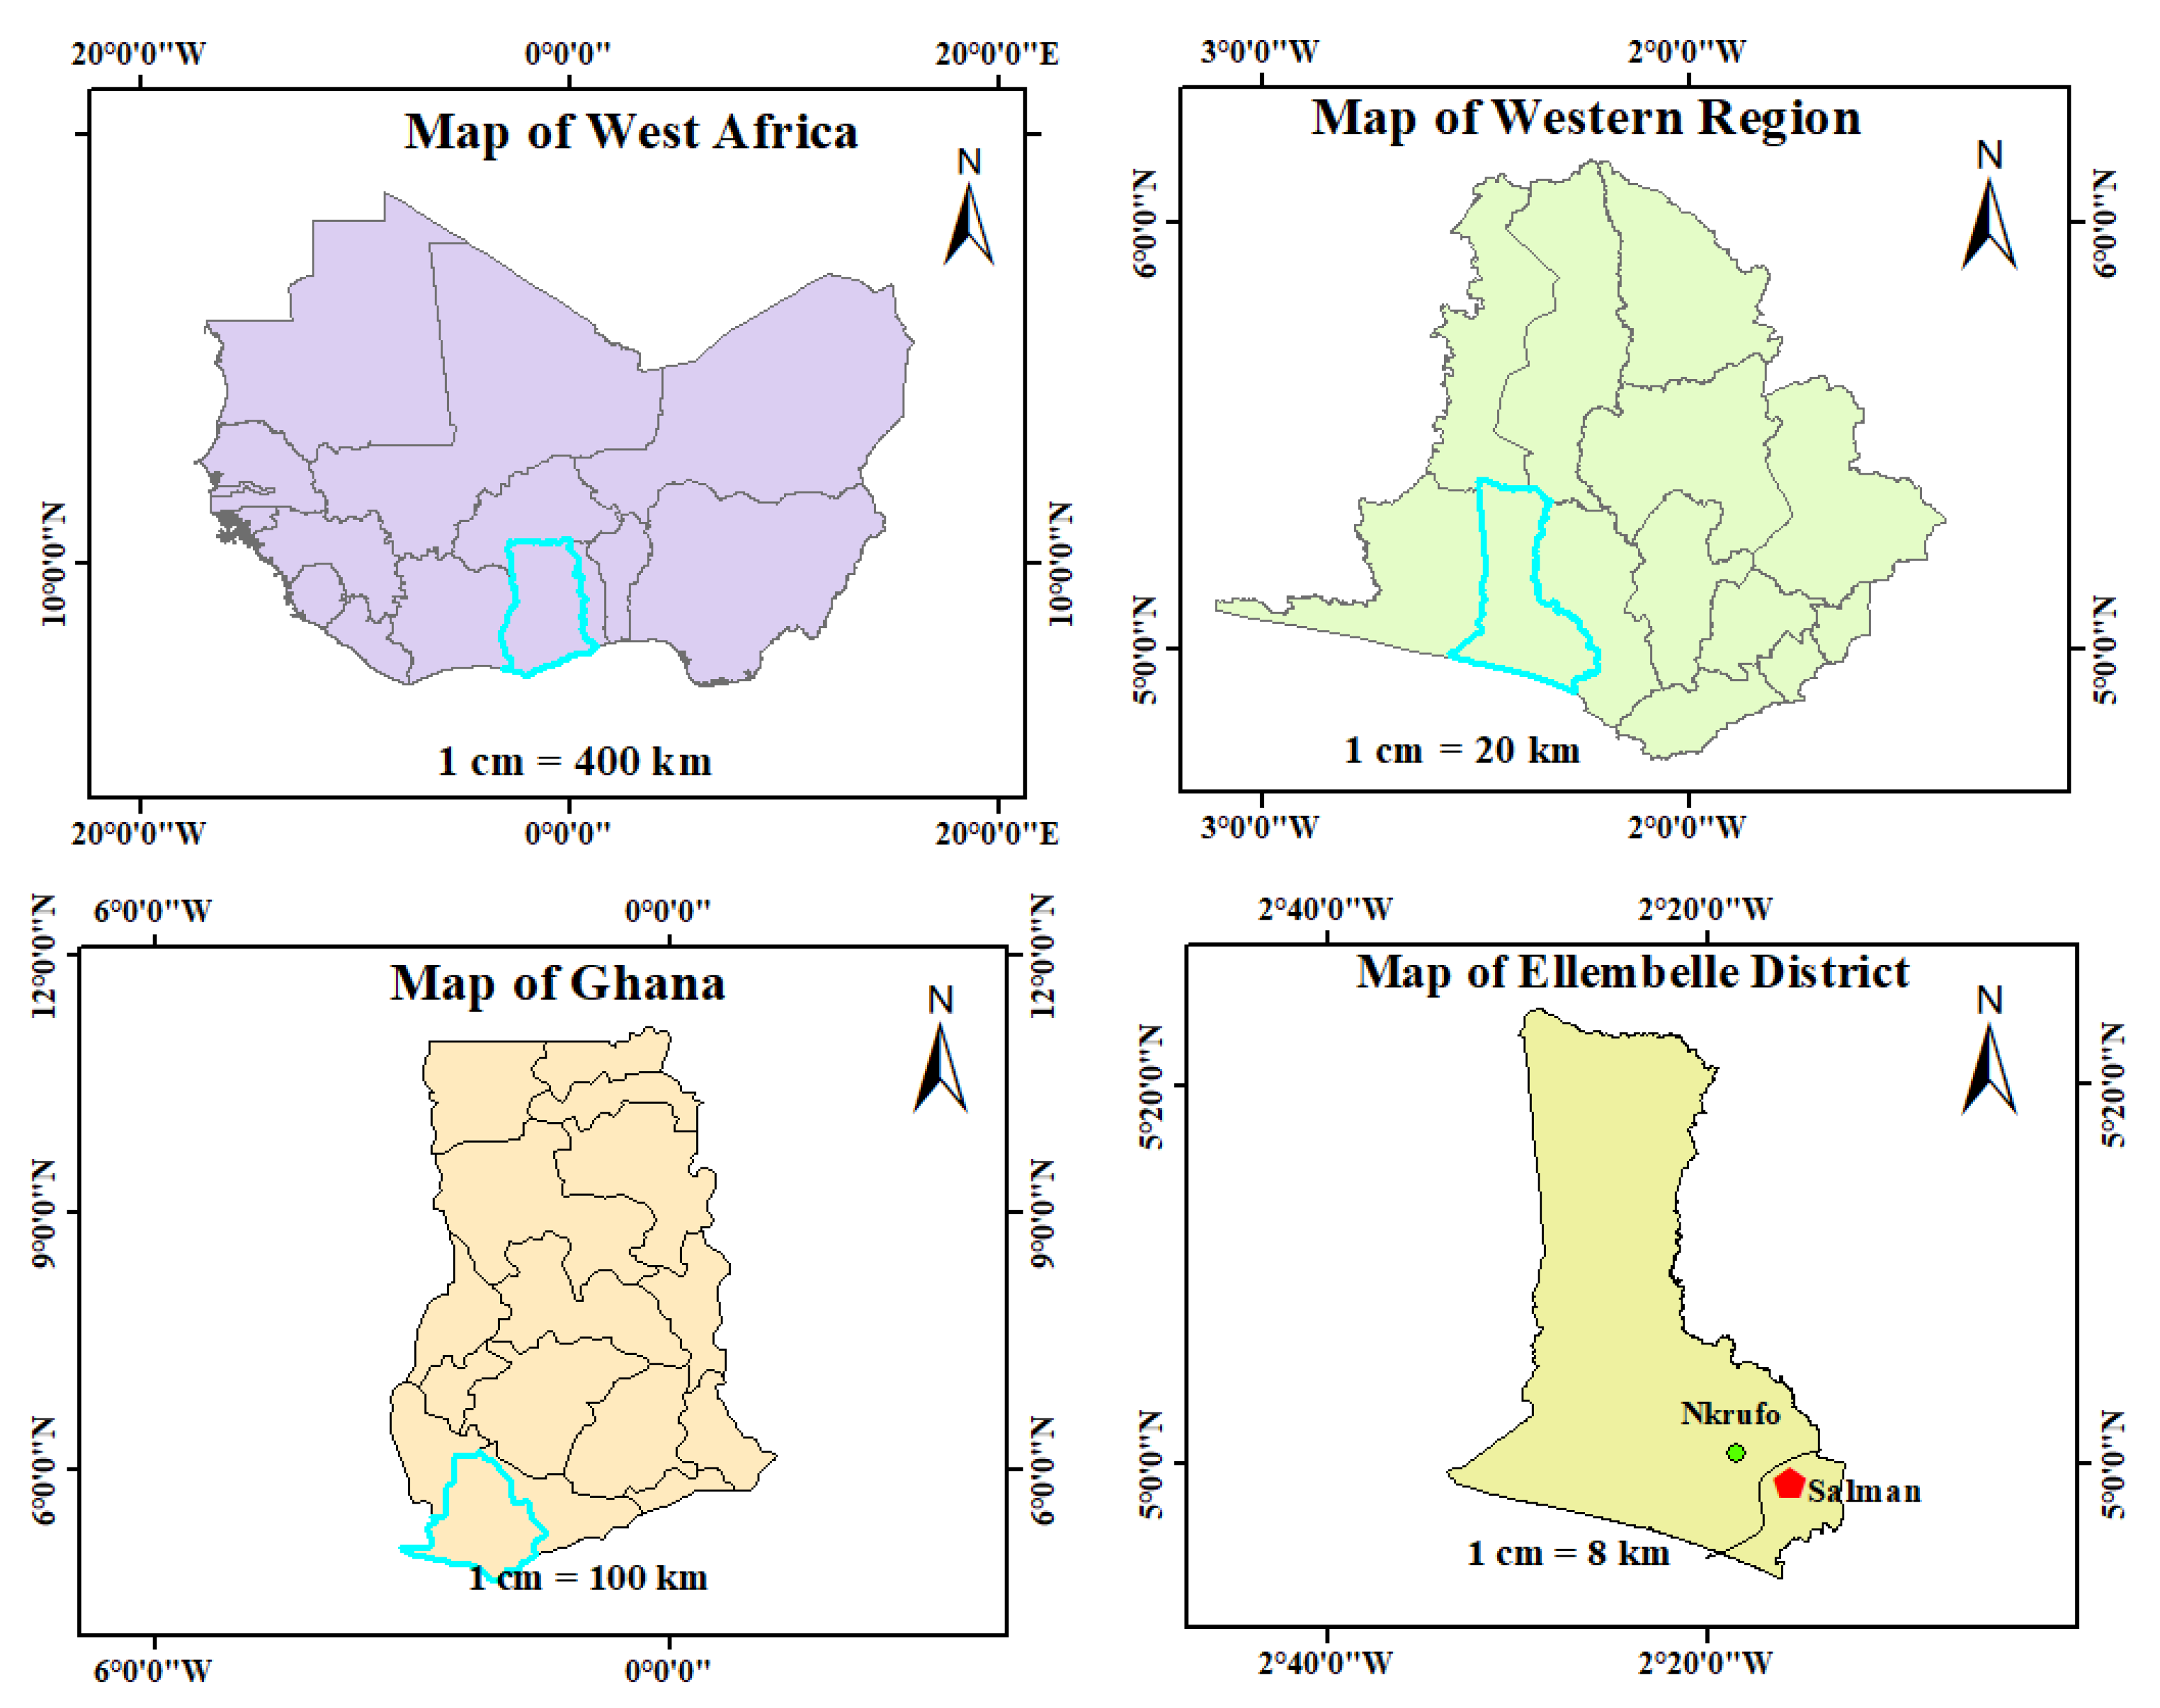
Figure 1 indicates that the Ellembelle district is situated in the Western Region of Ghana, a West African country. The location of the area of study is situated in the southern part of the region, specifically between longitudes 2°05′ W and 2°35′ W and latitudes 4°40′ N and 5°20′ N. The area under consideration is located in close proximity to the Jomoro district on its western boundary; to the north is Wassa Amenfi West, to the south is Tarkwa-Nsuaem, and to the east is Nzema East. The geographical region in question covers 1468 square kilometers, representing around 9.8% of the land in the Western Region. The population density of the area is 120 individuals per square kilometer, with a total population of 120,893 [
22]. The district’s geography is primarily characterized by undulating terrain, mainly consisting of hills. The highest point in the area reaches an altitude of 450 feet above sea level [
23]. The region exhibits a notable abundance of sandstone and a variety of diverse minerals, including kaolin, silica, and gold. These natural resources generate royalties and create jobs in the local community. The district exhibits the presence of rivers and streams [
23]. The Ahama and Nwini Rivers are important tributaries that contribute to the flow of the Ankobra River. The northern portion of the region is drained by the Ankansa and Draw Rivers, as well as their tributaries, which also act as the boundary with Wassa Amenfi [
23]. The southwestern region is home to the Amansure River, a perennial river, as well as various smaller rivers and streams. The region under consideration is situated within the humid semiarid zone of West Africa. The months of May and June exhibit the highest levels of precipitation [
23]. The average amount of rainfall each year varies between 26.8 and 42.6 mm. The average temperature in the district is 29.40 °C. The district’s relative humidity varies from 27.3% to 27.9% from July to April and from 27.6% to 26.6% in May and June. The soil in the district consists mainly of ferric acrisol, which makes up approximately 98% of its composition. This soil type is suitable for cultivating a range of farming crops, such as coffee, cacao, and coconuts, as well as oil palm, plantains, and cassava [
23].
2.2. Case Setting
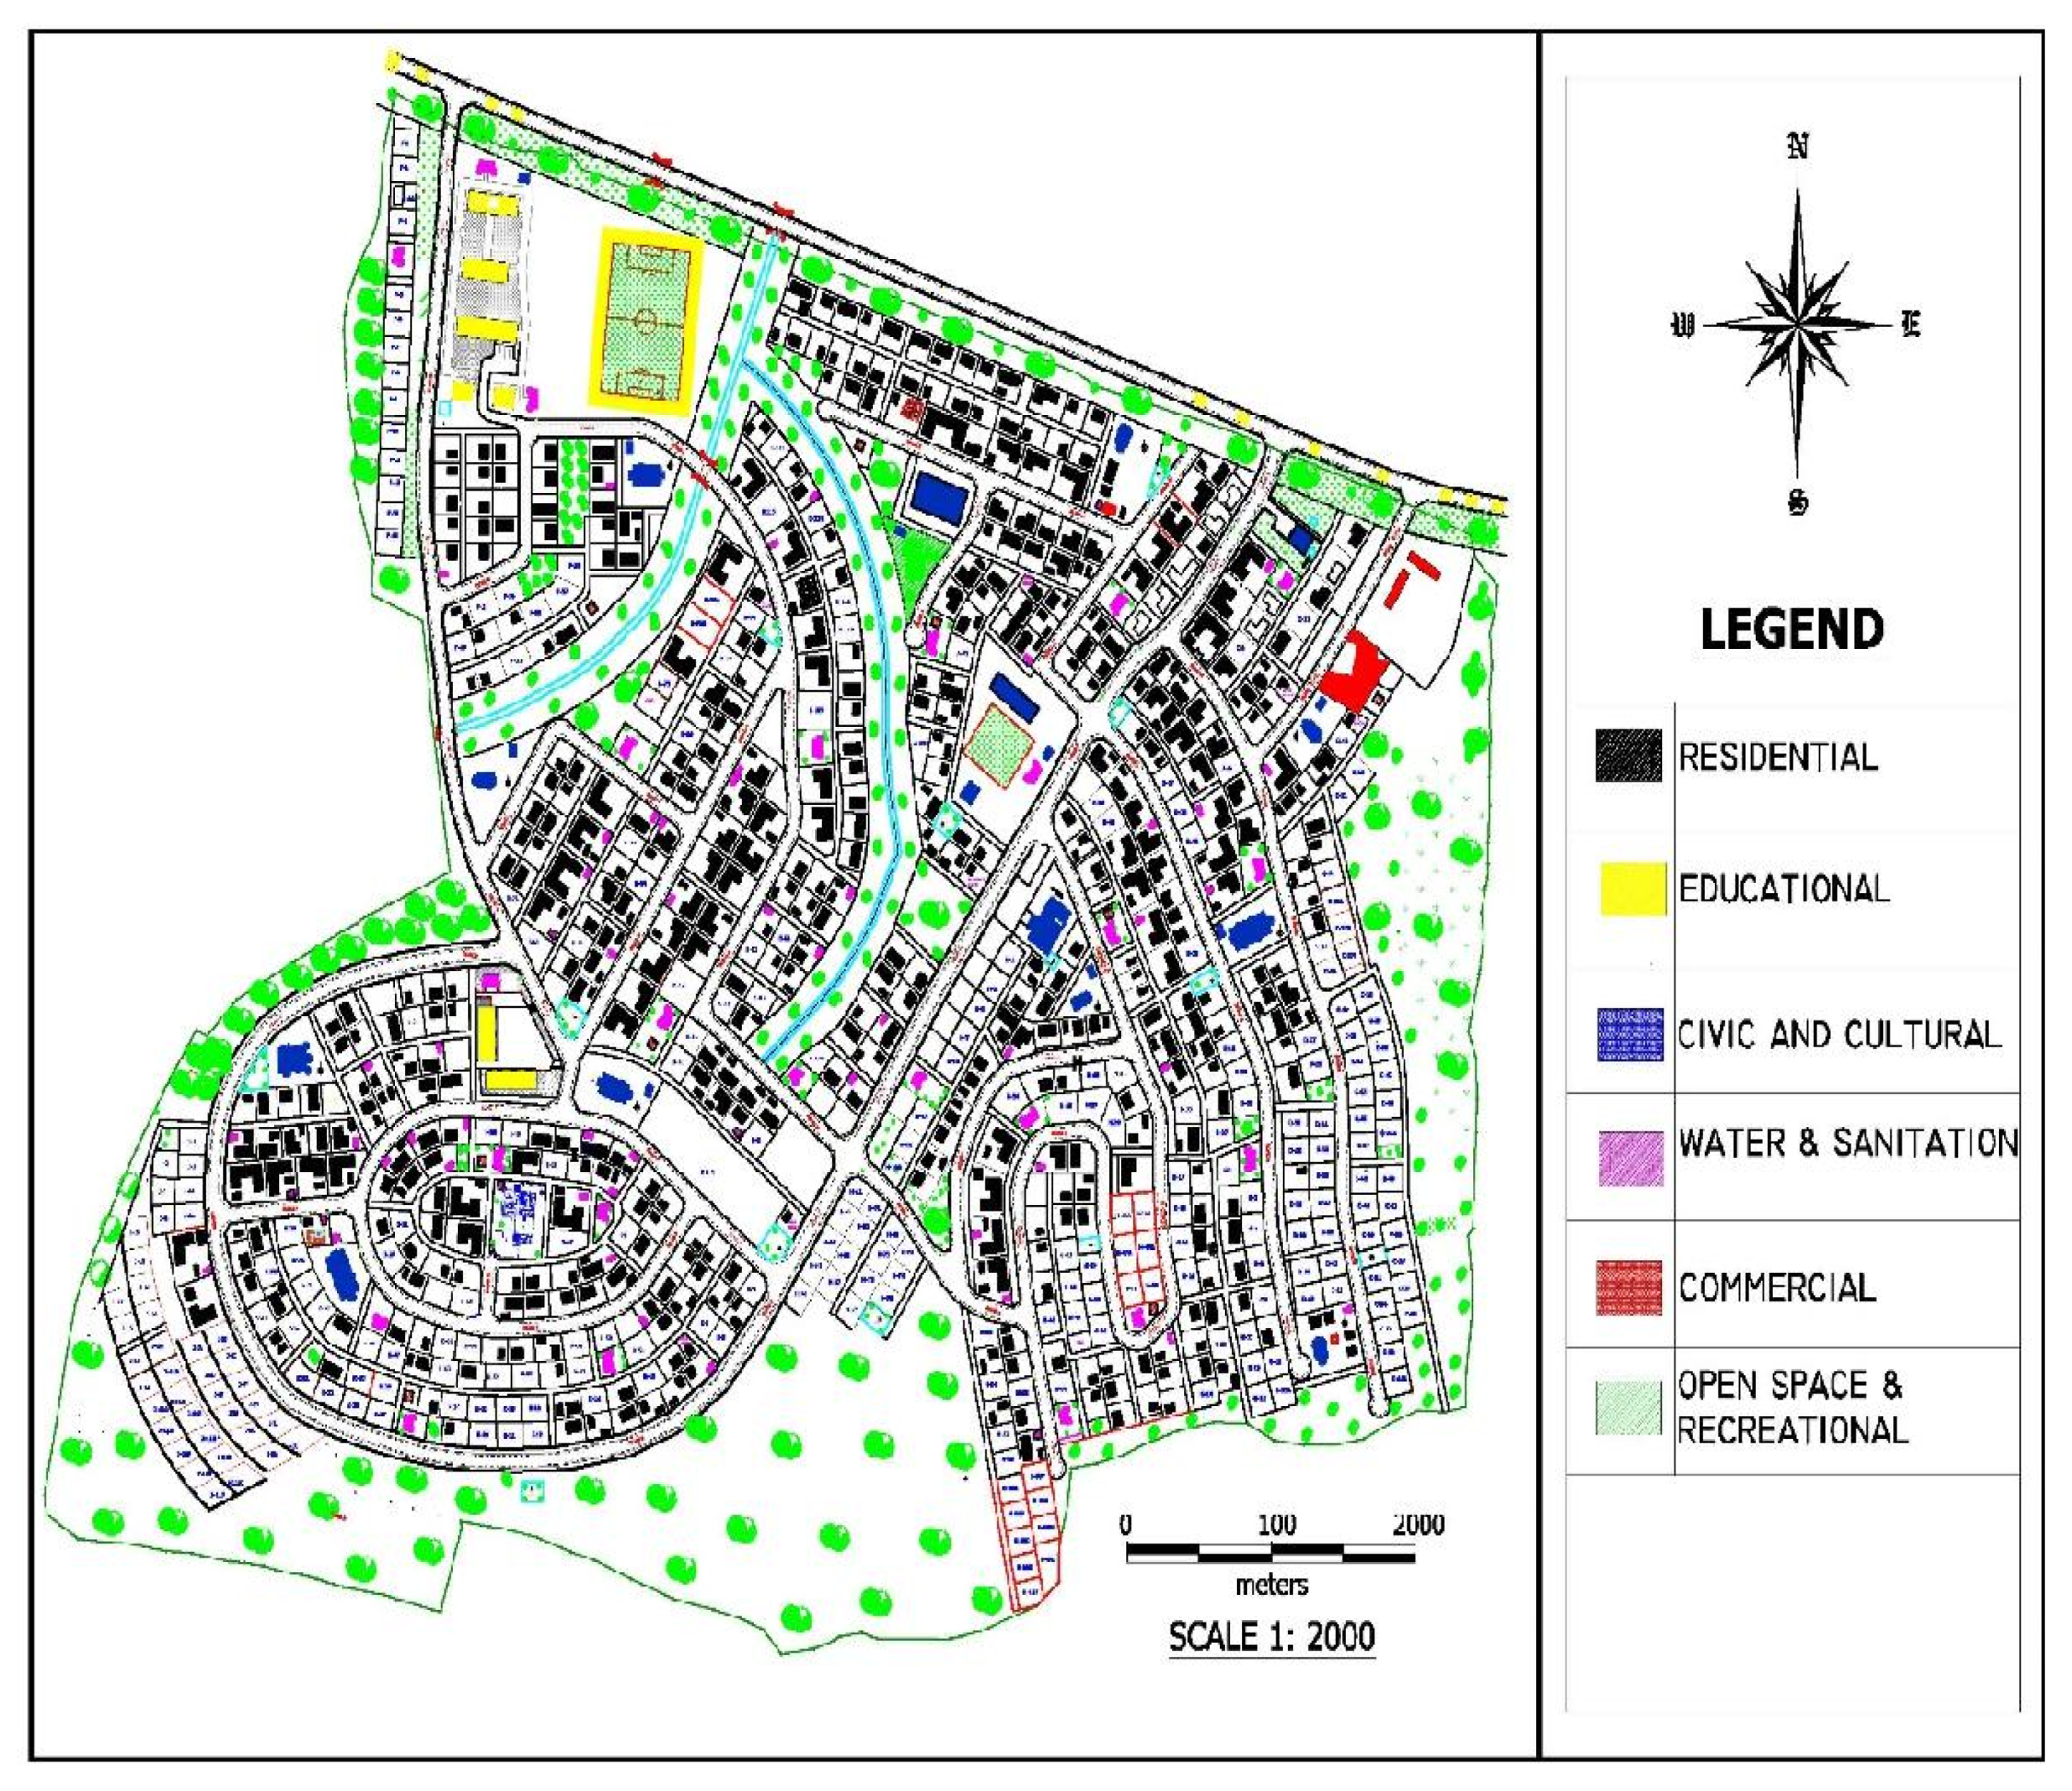
Figure 2 represents the layout of Salman resettlement village in Ellembelle, Ghana, the site for this study. A consensus was reached on the resettlement project after 24 months of talks and more than 80 meetings between affected community leaders and the mining company. This resettlement village was built in 2012. About 2200 people lived in the over 460 homes affected by the mining development. The talks led to a number of formal legal agreements that gave each property owner a choice between receiving money for their buildings and/or plants or receiving similar new homes and amenities in a new community. Importantly, unlike previous plans for moving people or groups, no terms were ever “imposed” on anyone or any group, and the resettlement plan did not lead to a war that killed civilians [
24].
The resettlement village contains 706 buildings, including 461 homes, 143 separate kitchens, 10 houses of worship, 20 ablution blocks, 17 businesses, and 29 public facilities, such as a hospital, school, and police station. Furthermore, the village has seven kilometers of gravel roads and seventeen boreholes, and all homes and public buildings have an electrical connection, which they lacked in the original village.
The spatial development of a 101.17-hectare tract of land about 1.5 km east of Salman’s old town served as the resettlement’s physical framework. The system for resettlement was “room-for-room” or “structure-for-structure”. An apartment with two rooms was built in place of a house with two rooms, while a house with one room was replaced with a house with one room. For all existing rooms that were 3.66 m × 3.66 m or less, the new dwellings had standard room sizes of 3.66 m × 3.66 m; however, standard room sizes of 3.66 m × 4.57 m were imposed for older flats that were larger than 3.66 m × 3.66 m. The land size assigned to each household varied from 3.66 m × 3.66 m to 21.34 m × 30.48 m depending on the number of rooms in the existing house [
24].
2.3. Action Plans for Resettlement and Displacement Due to Mining in Ghana
The Minerals and Mining Policy of Ghana, 2014, the Minerals and Mining (Compensation and Resettlement) Regulations, 2012 (LI 2175), as well as the Minerals and Mining Act of 2006 (Act 703) are the main laws governing mining-related displacement and resettlement in Ghana.
The compensation procedures are specified in the Minerals and Mining Act of 2006, Act 703. When assessing compensation for the disruption of surface rights owned by the proprietor, the provision states that the landowner with a mineral right has the right to seek compensation from the mineral rights holder for any infringement on their rights. Owners who choose to receive compensation through resettlement due to displacement caused by a proposed mineral operation are relocated to an appropriate alternative land. This relocation considers their economic well-being, as well as their social and cultural importance. The resettlement process adheres to the relevant town planning laws.
LI 2175 was established in the year 2012 with the purpose of providing support for the implementation of both the Minerals and Mining Policy and the Minerals and Mining Act. The document covers topics such as claims for compensation, the assessment of compensation, the principles underlying compensation, and the timeline for payment of compensation to landowners. According to the stipulation, when the mining leaseholder’s operations require the relocation of residents, they are obligated to relocate the affected individuals to a suitable alternative land. Resettlement efforts should take into account the socioeconomic and cultural values of migrants in order to improve their standard of living and economic well-being [
25].
2.4. Conceptual Model
Using Campbell’s model [
26], a well-known model in the field of residential environment and quality of life, this study examines the resettlement, residential satisfaction and QoL of mining-affected families (MAFs) in Ghana. According to the model, a person’s overall degree of life satisfaction represents their quality of life. This level of happiness reflects how satisfied individuals are in various facets of their lives. Based on the applied conceptual model, an individual’s subjective well-being in a specific location is influenced by their perception of the neighborhood and their satisfaction with their residential dwellings.
According to previous research, the resettlement of a community may provide affected families with a variety of benefits. These include physiological benefits, which pertain to preserving and enhancing quality of life and general well-being [
27]. One of the ways in which housing environmental factors affect QoL is the level of satisfaction with one’s place of residence [
28].
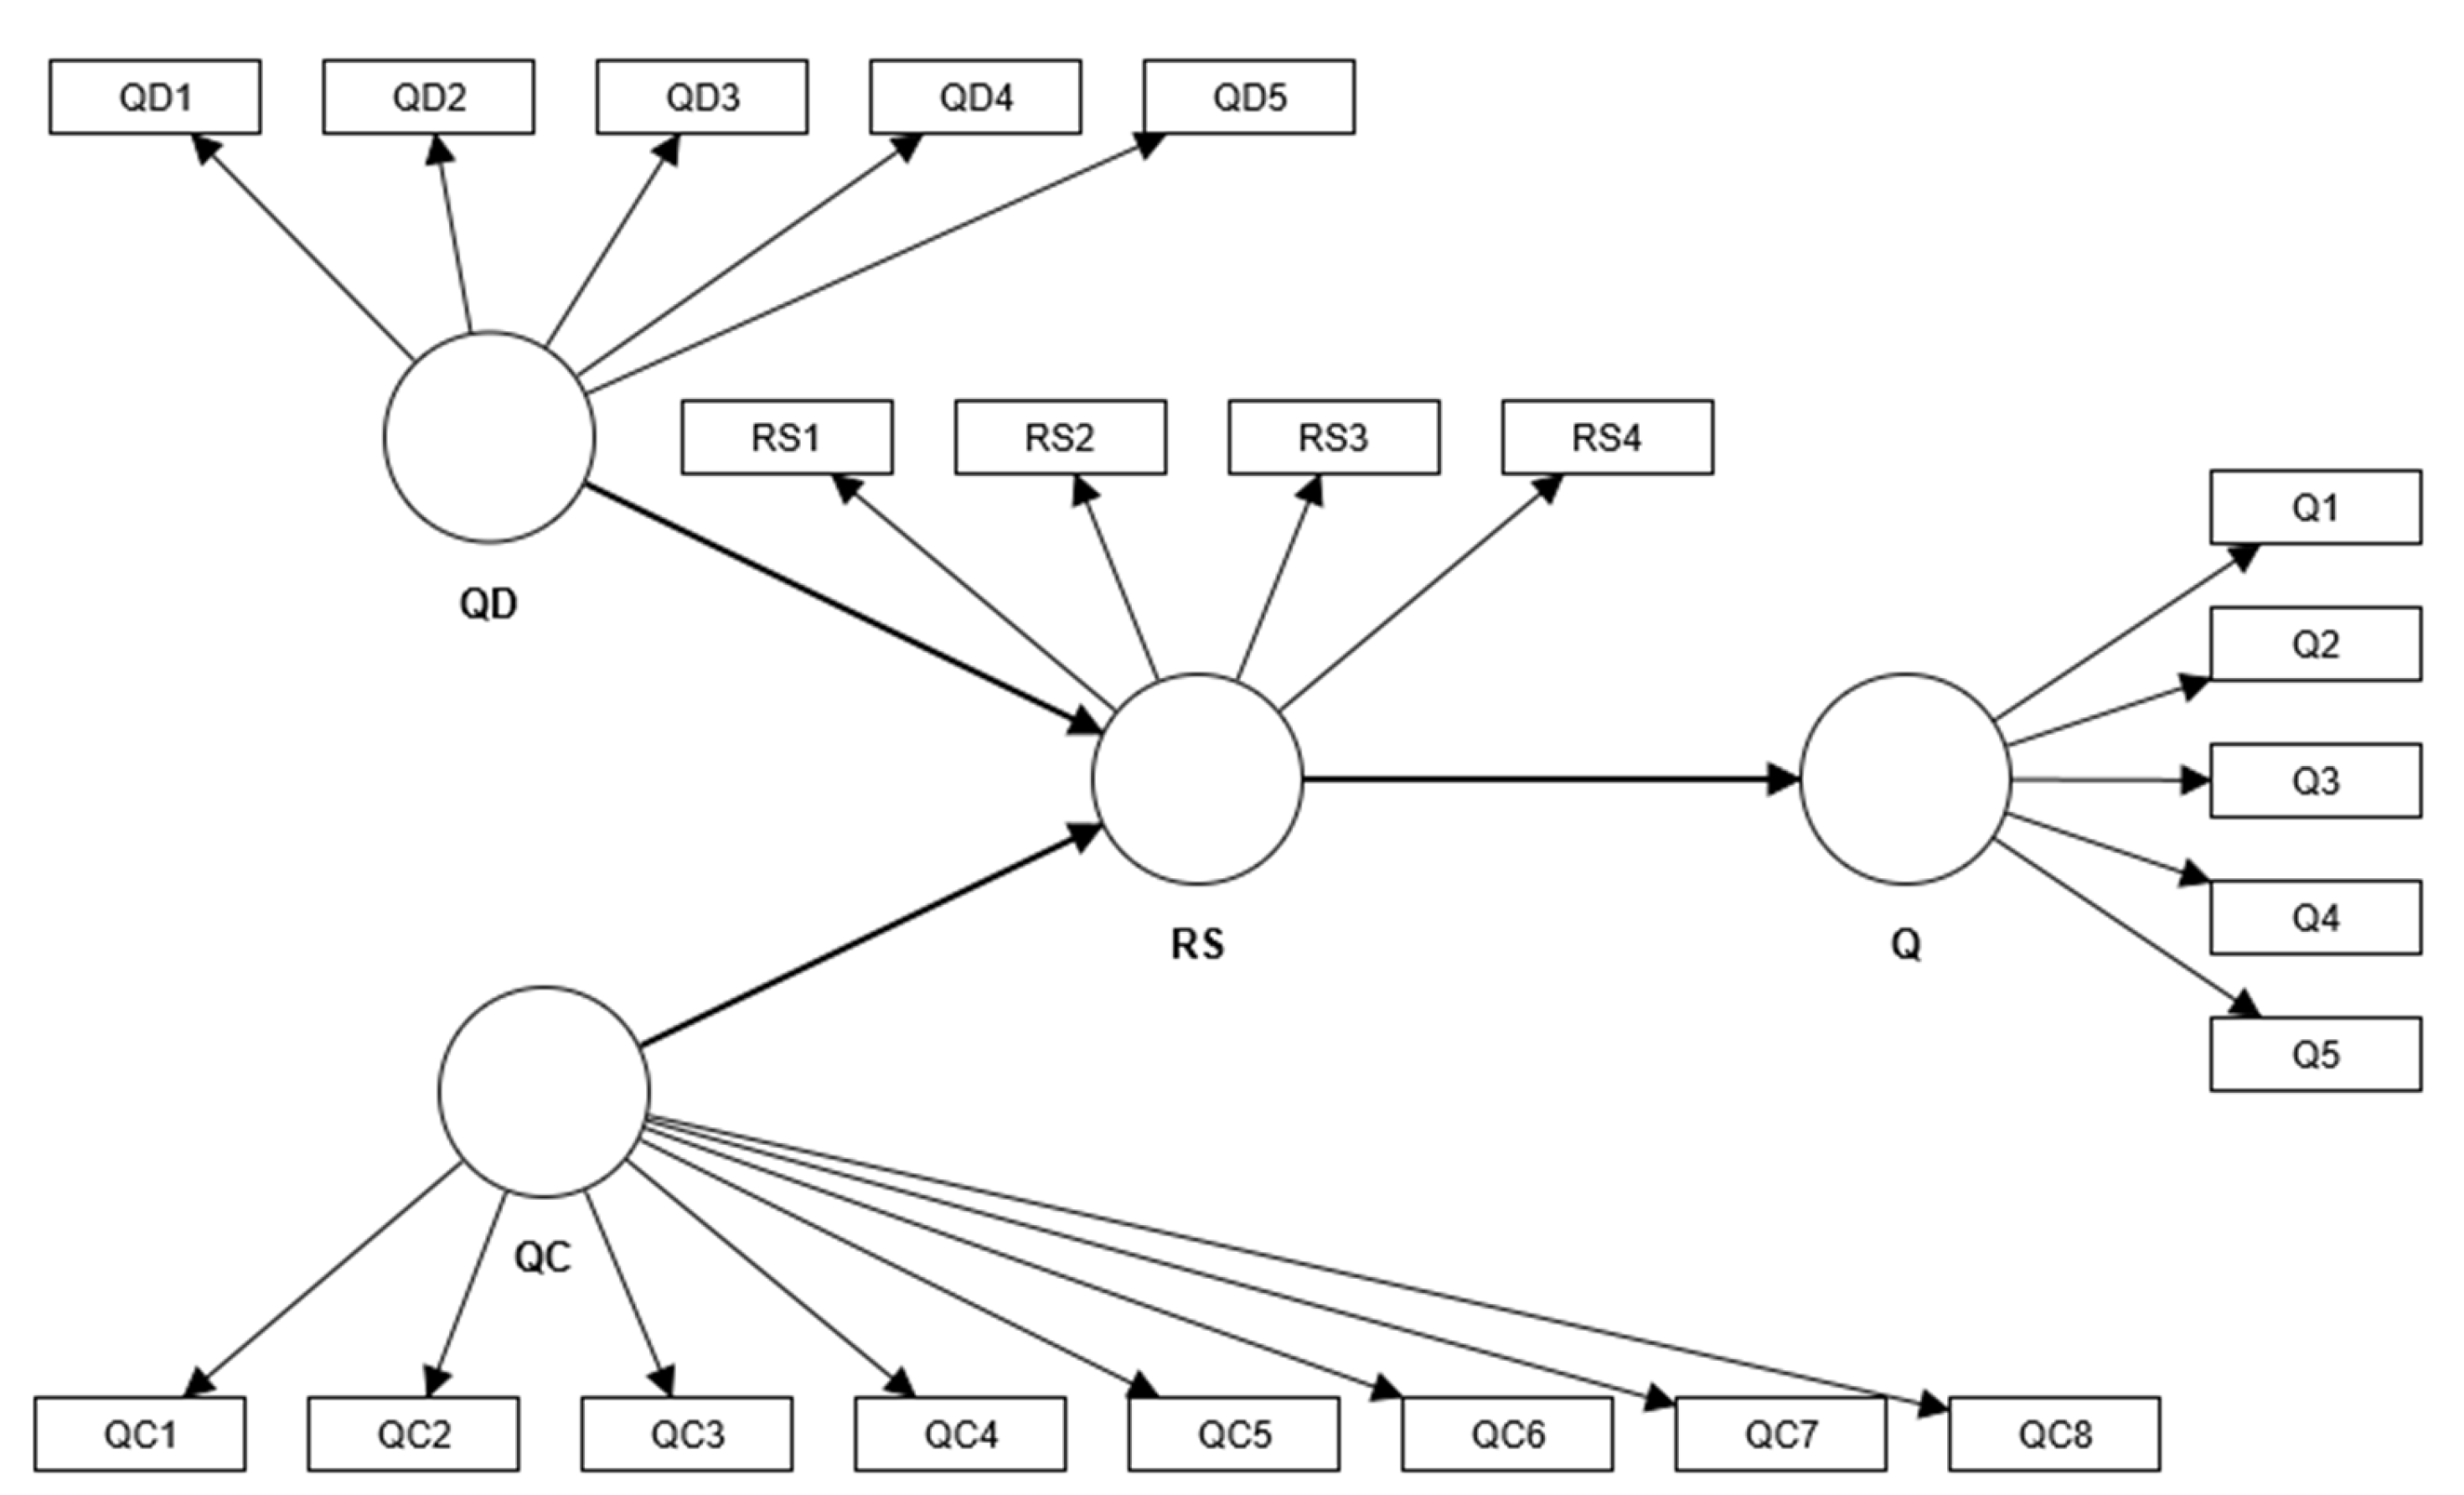
Figure 3 depicts the affected families’ perception of the resettlement on their quality of life through their residential satisfaction. The Satisfaction with Life Scale (SWLS) by Diener et al. [
29] was adopted to measure the MAFs’ perceived QoL. The quality of dwelling (QD) and quality of context (QC) of the resettlement community were adopted as measures of the MAFs’ perceived resettlement quality. QD refers to the interior and exterior features of the housing, which include the quality of construction, overcrowding, quality of basic amenities, external appearance, and appropriateness of interior configuration and comfort. QC refers to the neighborhood features, which includes the availability of public facilities, safety and security, social relationships, and infrastructural services. Residential satisfaction is the mediating construct in the model. It captures how content MAFs are with their housing, neighborhood, public facilities, and word of mouth about the resettlement community.
2.5. Hypotheses
In this study, we look at three prepositions based on the proposed model.
Hypothesis (H1). Quality of context (QC) positively influences MAFs’ residential satisfaction (RS).
Hypothesis (H2). Quality of dwelling (QD) positively influences MAFs’ residential satisfaction (RS).
Hypothesis (H3). Residential satisfaction positively influences MAFs’ quality of life.
Hypothesis (H4). Residential satisfaction mediates the relationship between the quality of the context and MAFs’ quality of life.
Hypothesis (H5). Residential satisfaction mediates the relationship between the quality of dwellings and MAFs’ quality of life.
2.6. Measures
The measures in the study were created to assess the participant’s QoL, RS, and perceived housing quality after resettlement. The tests were designed to determine how content people were with their housing and lives after resettlement. In this study, a 5-point Likert scale was adopted for the respondents’ convenience after the pretesting. The scale for measuring the quality of dwelling (5 items) [
30], quality of context (8 items) [
30], residential satisfaction (4 items) [
31], and quality of life (5 items) [
29] have all been used and validated in the literature. Socioeconomic characteristics such as gender, level of education, and income are utilized in QoL research [
12,
32,
33,
34,
35].
3. Data Collection
This quantitative study employed the convenience sampling technique to collect data from the family heads of the relocated MAFs. In order to collect data, the authors created self-administered questionnaires based on a cover letter. In this cover letter, the purpose of data collection was stated to the participants. It was also made plain in the cover letter that there are no correct or incorrect responses, as sincere comments will help the study create natural results. Because each home provided their unique data, we tested the data for nonresponse bias. After that, we checked for common method variance (CMV). In order to lessen social desirability bias, we assured all participants beforehand of their anonymity.
Prior to use, the efficacy and validity of the questionnaire were assessed. A pilot sample of 40 MAFs’ home heads from the targeted population was employed to test the questionnaire instrument. Questions with low indication dependability and those that the respondents felt were confusing and sensitive were thus removed. Last but not least, the question items were written in a clear and straightforward manner. Some necessary adjustments were made to the questions to aid respondents in understanding them.
The data were collected in March 2022 through research assistants trained to share and collect the survey questions from the respondents while assisting the respondents in understanding and successfully completing the 300 distributed questionnaires. Finally, 276 (92%) were valid and reliable for use after the pre-analysis of received data.
Analytical Methods
In this experiment, partial least squares structural equation modeling (PLS-SEM) was employed. This method was selected based on the fact that PLS-SEM is useful for both confirmatory and exploratory research [
36]. PLS-SEM is effective for complex, multi-order models and does not require any particular data standardization criteria. Additionally, PLS-SEM can be used to examine small datasets [
37]. Consequently, the PLS-SEM method was utilized in this study to examine empirical data utilizing the SmartPLS 4 software. The outcomes of PLS-SEM-based studies can be evaluated in two steps: measurement and structural model evaluation. While the structural model explores how the hypotheses fit together, the measurement model investigates the constructs’ validity and reliability. Using the t-statistic and the
p-values, it is feasible to accept or reject a hypothesis.
This study’s model also incorporated advanced model components, such as the function of residential satisfaction as a mediator. Using a structural model, this study explored five (5) hypotheses and their relationships with one another. Prior research has established that a sampling threshold for PLS-SEM is roughly 200 samples; hence, the current sample size of 276 was enough for this analysis [
38].
Figure 3 displays the model’s specifications. The model comprises an endogenous construct, a mediating construct, and two exogenous constructs. The validity and reliability of all study variables were assessed during the evaluation of reflective measurement items [
39]. The study evaluated the questionnaire’s internal consistency, constructs’ discriminant and convergent validity, and item reliability by comparing them to the thumb rule. To ensure internal consistency and reliability, Cronbach’s alpha, item loadings, composite reliability, and AVE values should surpass 0.7, 0.7, 0.7, and 0.5, respectively [
39]. Discriminant validity requires that HTMT values remain below 0.90 [
40]. The study’s analytical criteria were deemed reliable and valid by the researchers since all values from the pre testing are within the acceptable range.
4. Results
4.1. Descriptive Analysis
The sample consisted of 276 MAFs’ heads in the western region of Ghana. All the respondents willingly participated in the survey in the comfort of their homes. The data results in
Table 1 indicate that 168 of the respondents were men (60.9%). Most of them were above 45 years (78.2%) and did not have senior high or tertiary education. In addition, 55.8% (154) of them were married. Respondents with monthly household incomes less than USD 800, between USD 800 and 1350, between USD 1350 and 2000, and more than USD 2000 made up 15.6%, 42.0%, 33.0%, 14.06%, and 9.4% of the sample, respectively.
The descriptive statistics in
Table 2 reveal the mean and standard deviation of the measurement items.
4.2. Assessment of Measurement (Inner) Model
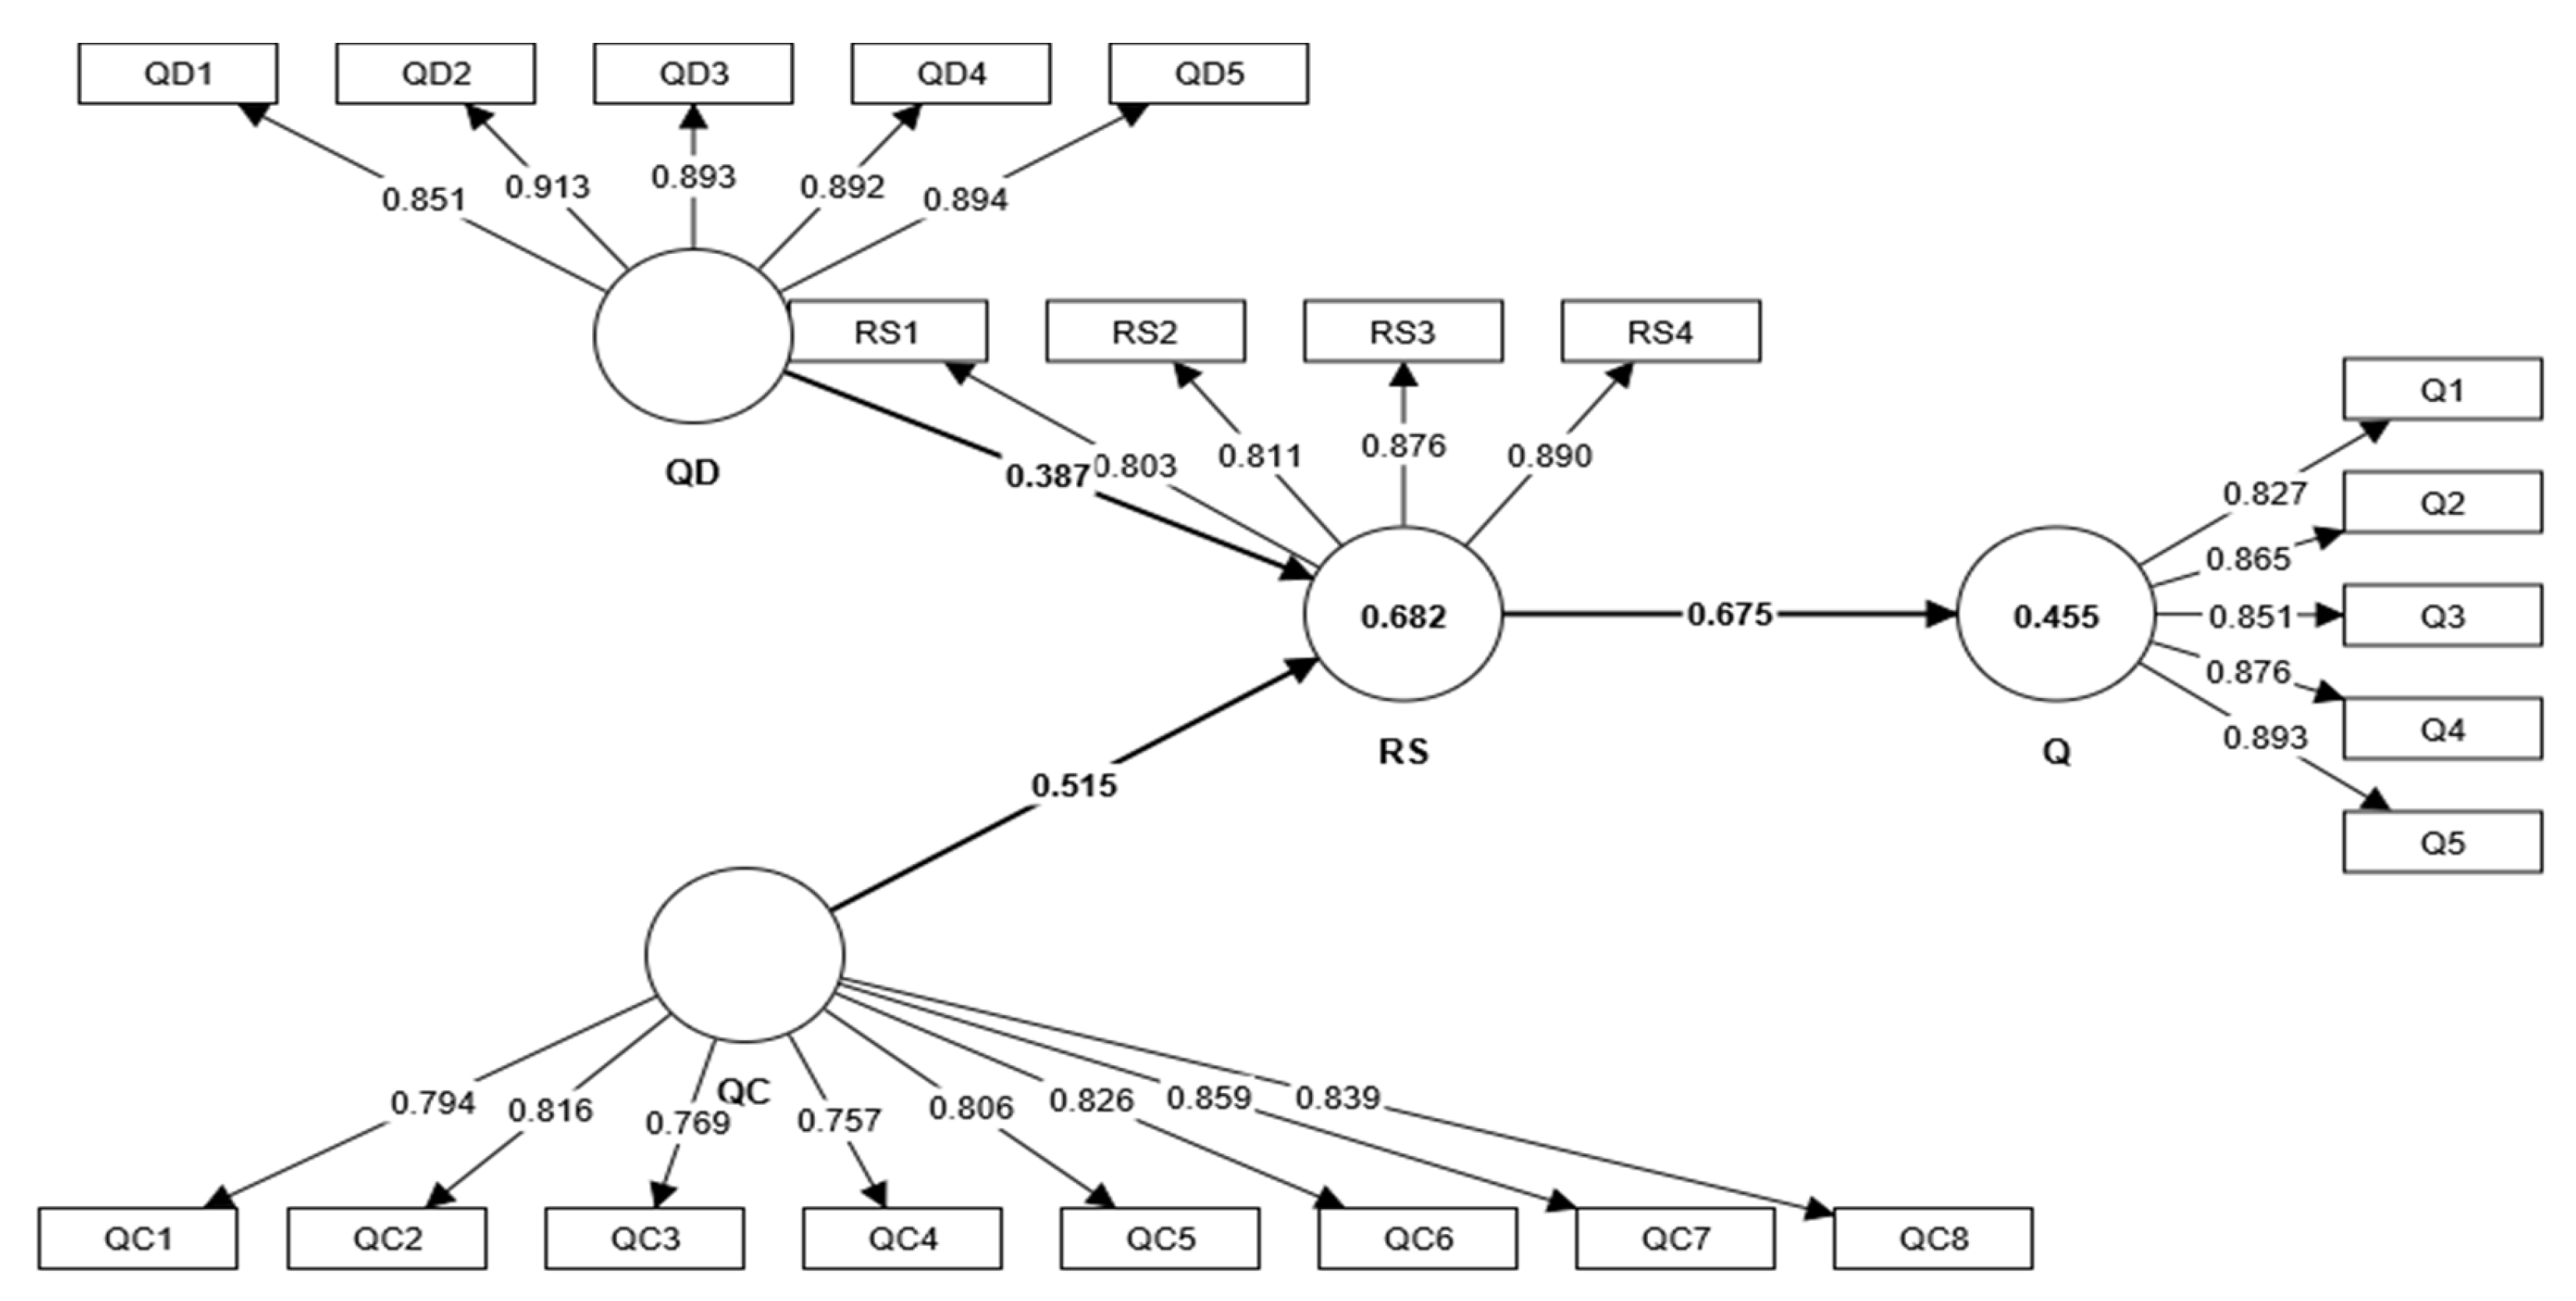
The reflective variables in the measurement model used in this study were quality of dwelling (QD), quality of context (QC), residential satisfaction (RS), and quality of life (Q). In PLS-SEM, evaluating the measurement model is the foremost and most important step. To figure out how reliable the model is, we calculated and compared the loading of each indicator on its related constructs to a threshold. In general, a loading greater than 0.7 was deemed satisfactory for the reliability of an indicator [
39]. The results from
Table 3 and
Figure 4 show that all of the loading scores met the rule of thumb. When the CR coefficient, which is used to measure the reliability of a construct, is higher than 0.7, this means that there is internal consistency [
39]. The results of
Table 3 show that all of the reflective measurement items in PLS-SEM met the rule of thumb for CR. These results show that the reliability of the measurement model is good enough. Checking the convergent and discriminant validity can show whether or not PLS-SEM is true [
40].
Table 3 reveals that the AVE of the constructs for each group of data is more than 0.5, proving the convergent validity of the study constructs.
Discriminant validity is a measure of how different one model construct is from other model constructs [
41,
42]. The heterotrait–monotrait (HTMT) ratio has lately been shown to be a better way to determine discriminant validity than more traditional techniques such as the Fornell–Larcker (FL) criterion [
40]. In past studies, the HTMT criterion for establishing discriminant validity has been given two different thresholds of 0.85 and 0.9 [
40]. The discriminant validity of this study was measured through the heterotrait–monotrait (HTMT) ratio and the Fornell–Larcker (FL) criterion. Since all of the HTMT values in
Table 4 are less than 0.85, each group-specific model estimation has been shown to be discriminately valid at the 0.85 threshold. As can be seen, the bold numbers in
Table 5 represent the square root of the AVE for all structures. By implication, it is clear that the square root of AVE is bigger than its association with any other construct in the path model.
The findings in this section demonstrate that the measurement model met the PLS-SEM requirements for validity and reliability. This section also contains several statistical studies that support the measurement models utilized in this work.
In light of this, we can conclude that the suggested path model is valid and reliable. Therefore, the investigation can move on to testing the proposed hypotheses and analyzing the structural model.
4.3. Assessment of the Structural Model
First, each predictor construct’s VIF value must be higher than 0.20 but not more than 5. Every VIF value, according to our data, is less than 5. We can now review the results report because the structural model does not consider predictor component similarity to be essential. The related VIFs for RS and QoL were 1.808, 1.808, and 3.094 for context quality, dwelling quality, and RS. Our findings show that every VIF score is categorically below the cut-off of 5. The structural model does not have a serious problem with predictor construct collinearity; thus, we may continue looking at the results report.
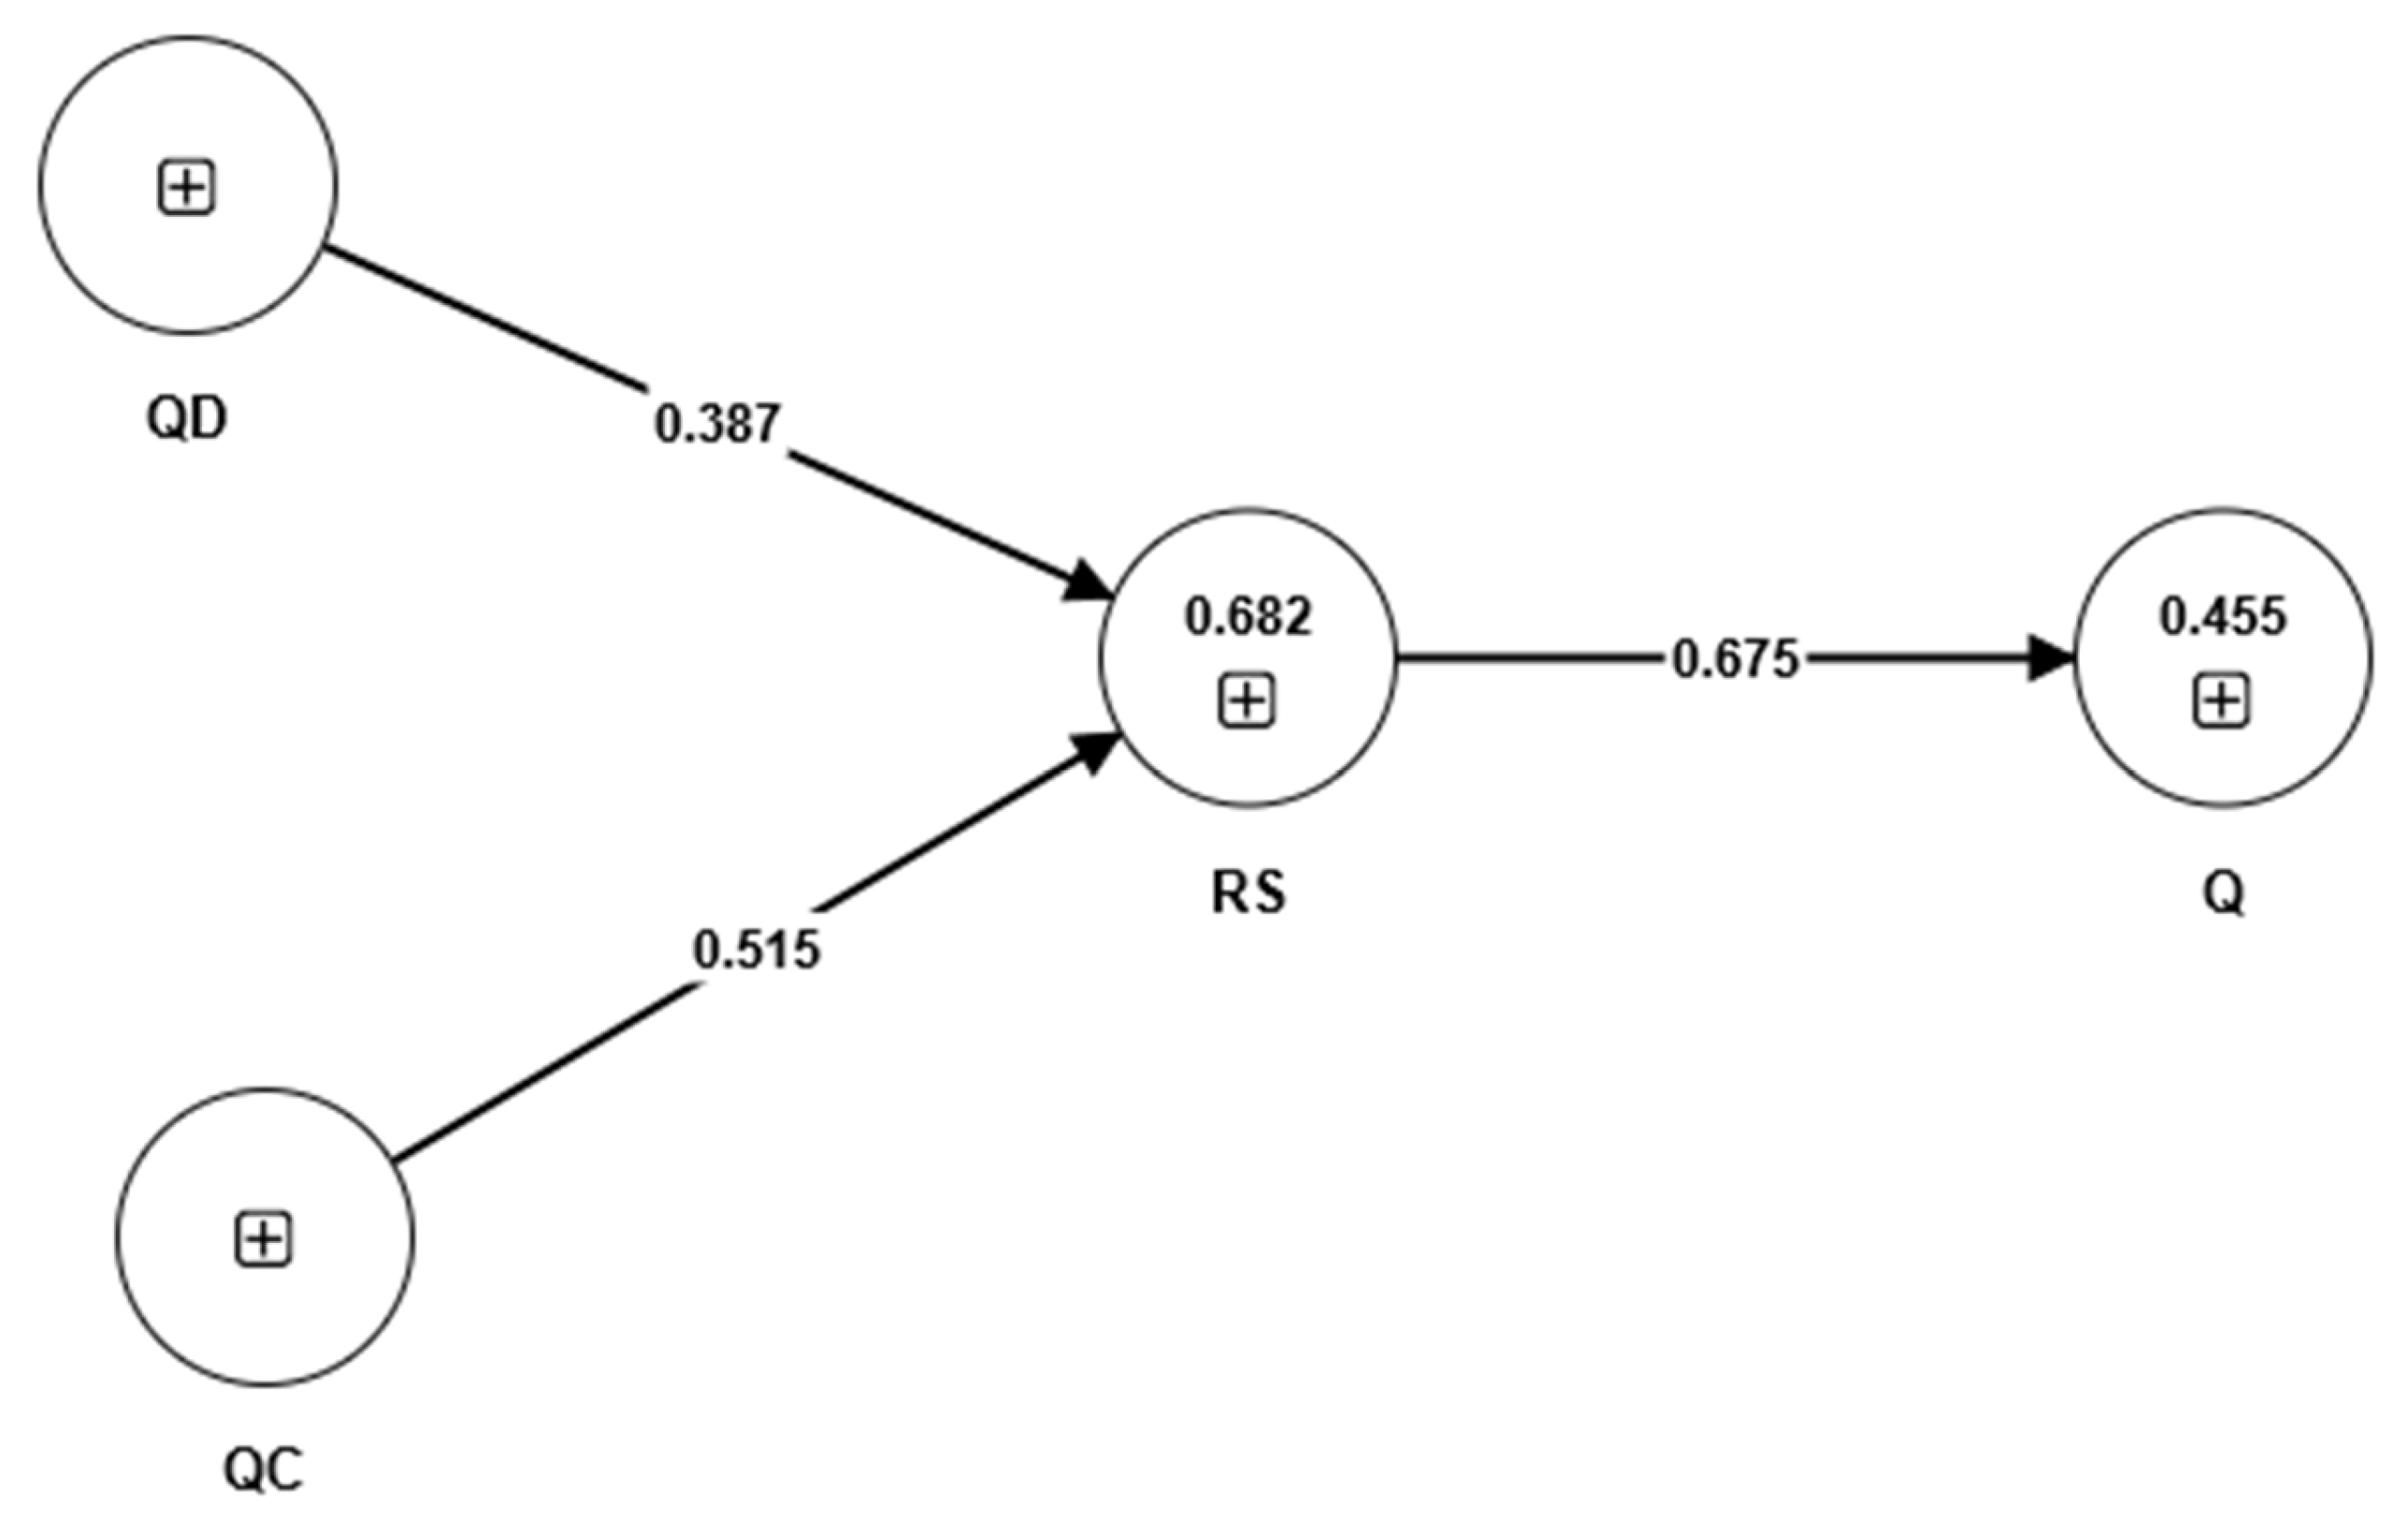
Second, the significance of a relationship is assessed using the path coefficients. Additionally, it is demonstrated that H1 is true by the strong positive link between the quality of context (QC) and residential satisfaction (RS) (β = 0.515; t-value = 9.368;
p = 0.000). RS has a positive, significant, and relationship with quality of dwelling (QD) (β = 0.387, t-value = 6.003,
p = 0.000) supported H2. Hypothesis 3 is supported since there is a strong correlation between RS and MAFs’ QoL (β = 0.675, t-value = 15.535,
p = 0.000). The researchers investigated the impact of RS on the relationship between context quality and QoL, as well as the relationship between dwelling quality and quality of life. To calculate potential mediation effects, we employed the product coefficients technique (indirect effect). Bootstrap confidence intervals (CIs) with bias correction were used to determine the significance of indirect effects [
43,
44]. According to the findings of H4, RS acts as a supplementary mediator between QC and Q. The results show that RS serves as a crucial link between QC and Q. We used the product coefficients technique (indirect effect) to evaluate the potential mediation effects of RS on QD and Q, and bias-corrected bootstrap confidence intervals (CIs) were used to determine the significance of indirect effects [
43,
44].
Table 6 demonstrates the significance of the indirect influence of QD on Q through RS (Hypothesis 5) for MAF. The findings support RS’s function as a mediator between QD and Q. A two-tailed test’s critical t values are 1.96 (significance threshold = 5%).
Table 6 and
Figure 5 provides a brief summary of these findings.
Thirdly, the coefficient of determination (R
2), also known as the R-squared value, shows how much of the variation in the endogenous latent variables can be accounted for by the influence of one or more exogenous latent variables. The R
2 shows the percentage of variance that the endogenous construct explains. It shows how effectively the model accounts for the data [
45]. Higher values of R
2 indicate a greater ability to explain occurrences. R
2 ranges from 0 to 1. Strong, moderate, and weak R
2 values are 0.75, 0.50, and 0.25, respectively [
45]. The proposed model explains 45.5 percent of QoL and 68.2 percent of RS, respectively, with an R
2 of 0.455 and 0.682, respectively. It is clear from the data in
Table 4 and
Figure 5 that the RS and Q’s R
2 values are moderate. As a result, the PLS algorithm’s output demonstrates that the structure model adequately accounts for the allowed variation level of RS and Q.
Fourth, we performed an evaluation of the relationship impact sizes, f
2. Effect sizes between 0.02 and 0.15 are regarded as minor, between 0.15 and 0.30 are regarded as medium, and 0.30 and more are regarded as high, according to Cohen [
46]. The f
2 coefficients for context quality, dwelling quality, and RS, as well as RS and quality of life, are 0.459, 0.248, and 0.836, respectively. This demonstrates that HI and H3 have significant effect sizes, while H2 has a modest effect size.
Finally, yet importantly, the indicator of the model’s predictive relevance (Q
2) was examined. Cross-validated redundancy was employed to evaluate the Q
2 of the structural model. The Q
2 value was therefore calculated using the blinding approach and the predictive sample reuse technique. Geisser’s Q
2 = SSE/SSO was the formula used to calculate the Stone test, per [
47]. On the advice of Hair, J.F., Hult, G.T.M., Ringle, C.M. and Sarstedt [
48], cross-validated redundancy was assessed utilizing blinded approaches and PLS-SEM estimates. The results revealed a perfect match between the data used to predict the research model and the PLS-SEM approach. According to Shmueli et al. [
47], the current study’s model has predictive value because the cross-redundancy values are greater than zero. Specifically, it can be seen in
Table 4 that the Q
2 values for RS and Q were determined to be 0.47 and 0.32, respectively, demonstrating their good predictive value. These results imply that the model under examination is suitable for making predictions.
5. Discussion
The quality of resettlement may have an impact on MAFs’ QoL depending on how satisfied they are with their residences [
15,
17,
49]. The qualities of the neighborhood and the house were used in this study to determine the quality of resettlement housing. However, little is known about how these two variables, when paired with residents’ levels of satisfaction with the relocation, affect quality of life. This study analyzes if and how the QoL of MAFs is affected by factors such as the condition of the home, the neighborhood, and residential satisfaction.
The findings of this study demonstrate a robust relationship between resettlement and QoL. It has been discovered that resettlement (housing quality) and QoL are related. According to path analysis, there is a direct and indirect link between context quality and overall quality of life. The study has looked at how people feel about their neighborhood in addition to the quality of their environment, which is a cognitive appraisal of how the housing environment affects QoL. According to research, having a favorable emotional reaction to one’s housing environment is associated with a higher quality of life, whereas having a negative emotional reaction is associated with higher levels of anxiety, which lowers quality of life. The survey revealed how the MAFs believed their QoL was influenced by their surroundings. This demonstrated how crucial the neighborhood is to most MAFs. These findings collectively imply that the housing environment’s quality has a considerable direct and indirect impact on people’s quality of life. Additionally, they add to and complement earlier theoretical and empirical studies [
7,
12,
50,
51].
RS also heavily depends on how well a person’s physical surroundings have been tailored to meet his or her needs and limitations. Building homes and communities that are helpful to MAFs should be one of our top priorities as people who believe in migration, especially involuntary resettlement. Future studies could be exciting in figuring out whether MAFs are happier with their lives when the homes, areas, and amenities surrounding them improve. Contrasting residents’ QoL and satisfaction with their homes before and after rebuilding their neighborhoods, homes, or communities might help achieve this.
The physical aspects of the home are just as crucial as the residential context in affecting the satisfaction of MAFs with their housing environment, according to the variables that have been explored to predict the various levels of residential pleasure. Additionally, MAFs’ perceptions of changes in the home’s adaptation to their needs and their pleasure with the physical attributes and amenities of their home and residential location significantly affect their QoL. This is because a significant factor in determining how well the home fits the MAFs’ needs is how well they perceive it. The MAFs’ living conditions and neighborhoods have undergone considerable renovations and changes that have significantly raised well-being. The needs of the MAFs must be considered in any effort to improve their QoL. The MAFs will have more independence and pleasure at home when they can use the items in their living environment in several ways. People’s happiness and QoL will rise due to their increased appreciation for these items. It is essential to consider not just the physical requirements of the home but also the neighborhood.
Another crucial consideration in determining how satisfied individuals are with their homes is how well the physical surroundings match the needs and restrictions of the MAFs. When developing homes and making plans for the resettlement community, it must be a key concern to create conditions that meet the needs of MAFs. These findings are consistent with what other research has shown, which is that MAFs are happier at home and have a higher QoL when their house’s surroundings are enhanced [
15,
17,
51,
52,
53,
54].
RS acted as a link between QoL and resettlement features. It makes sense that how a person feels about where they live, especially how much they feel like they belong there, would affect how happy they are there. How happy a person is with their home can affect their QoL in a good or bad way. Studies of correlations have also shown that there is a strong link between how happy people are and how their living environment looks and works. For a person’s QoL, local amenities and conveniences are often more important, especially for highly dependent and vulnerable migrants [
11,
34,
50]. Most of the time, an area with a community-focused design strengthens a person’s attachment to and satisfaction with their home community, as well as their overall quality of life.
Second, giving MAFs recreation centers could encourage them to spend more time outside, which is good for their residential satisfaction, as well as their physical and mental health. Nice public spaces and good roads make it easier for MAFs to meet and talk to each other [
35]. This can make people feel more connected to their community and can have a small effect on how well they feel. Several public spaces in the area are used as places for MAFs to spend time and as playgrounds for kids. This makes them feel that they belong and are part of their own group, which is good for their self-esteem. Third, the neighborhood’s features, including its stores and medical and educational facilities, often have a direct on the residents’ most important needs [
55]. People who live in neighborhoods that look nice and are well taken care of may feel connected to and proud of their community, which can improve their satisfaction and QoL [
56]. More empirical research and design are needed to back up the above theories and methods.
As far as we are aware, few studies have examined how mining-related migration affects the standard of the living environment, how happy individuals are in general, and how content they are with where they reside. Local governments and community managers should first consider all the crucial components when planning and designing a resettlement community. Moreover, the service, management, and relevant policymaking divisions of local government and the public will find our findings to be a useful resource in their efforts to improve the welfare of MAFs. A longitudinal design will be required in the future to investigate a causal relationship between the three elements. Longitudinal study approaches may provide additional factual data and a greater comprehension of the direction of the analyzed interactions.
6. Conclusions
It can be argued that the degree to which a resettlement house meets MAFs’ requirements and the degree to which they are satisfied with their surroundings have a significant impact on their quality of life. Therefore, improving their accommodation and surroundings has a significant impact on their quality of life during resettlement. Public or corporate initiatives that seek to enhance the health, happiness, and quality of life of MAFs must consider how they live and how they earn a living. The design, construction, and distribution of the housing projects when they are finished must all be included in the resettlement housing project planning to enhance the residential satisfaction and quality of life of the affected families.
Because this is a cross-sectional study, it is difficult to draw generalizations regarding the resettlement, residential satisfaction, and quality of life of the MAFs. For example, greater residential satisfaction leads to greater well-being, which raises perceptions of the quality of the resettlement. On the other hand, the converse may also be true, with a higher level of well-being resulting in more residential satisfaction and a more positive evaluation of one’s resettlement. A longitudinal design will be required to investigate the causal relationship between the three elements. Longitudinal study approaches may provide additional factual data and a greater comprehension of the direction of the analyzed interactions.
This study only considers the housing and the neighborhood environment of the resettlement. While home resettlement may cover most of the impacts of displacement, certain variables, such as livelihood, can significantly affect affected people’s quality of life. Therefore, resettlement may also affect the health, social life, and finances of the MAFs.
The study’s focus was solely on MAFs residing in the Salman resettlement village and gathered data from only the household heads. Researching the perception of the most vulnerable people in the families, including women, the aged, and children, can improve the existing literature. The PLS-SEM used in this study may have oversimplified certain problematic characteristics, leading to unreliable results in the regression analysis.
The survey should cover additional variables to comprehensively understand the impact of resettlement on residential satisfaction and quality of life.
Given the consistent importance of home attributes to quality of life, in future research, we recommend that home attribute variables of the resettlement community be included in the analysis to avoid the misspecification of models and the over/underestimation of the influence of resettlement housing attributes on RS and quality of life. In addition, including them in the analysis can help resettlement planners and policymakers determine the most suitable level (home vs. neighborhood) to make investments and enhancements to improve MAFs’ residential satisfaction and quality of life.
Further longitudinal research is necessary to clarify the relationship between quality of life, its drivers, residential satisfaction, and any moderating or mediating interactions. This research type enables the examination of quality of life and adaptation from the aging and lifecycle-based research perspective in a dynamic world. Longitudinal research would reveal temporal variations in quality of life. Longitudinal data can be a powerful tool for planners and policymakers to assess the impact of various neighborhood investments on subjective well-being.
In conclusion, while this research is a step forward in understanding the relationship between resettlement, residential satisfaction, and quality of life, there is still a long way to go. Continuing this line of research, collecting structured data, and testing frameworks across geographies is critical for researchers, planners, and policymakers that hope to present MAFs with a better and brighter tomorrow.

 ,
, 


